Metabolic regulation of misfolded protein import into mitochondria
- Center for Cell Dynamics and Department of Cell Biology, Johns Hopkins University School of Medicine, United States
- Biochemistry, Cellular and Molecular Biology (BCMB) Graduate Program, Johns Hopkins University School of Medicine, United States
- Mechanobiology Institute and Department of Biological Sciences, National University of Singapore, Singapore
- Department of Chemical and Biomolecular Engineering, Whiting School of Engineering, Johns Hopkins University, United States
Figures
Figure 1 with 3 supplements
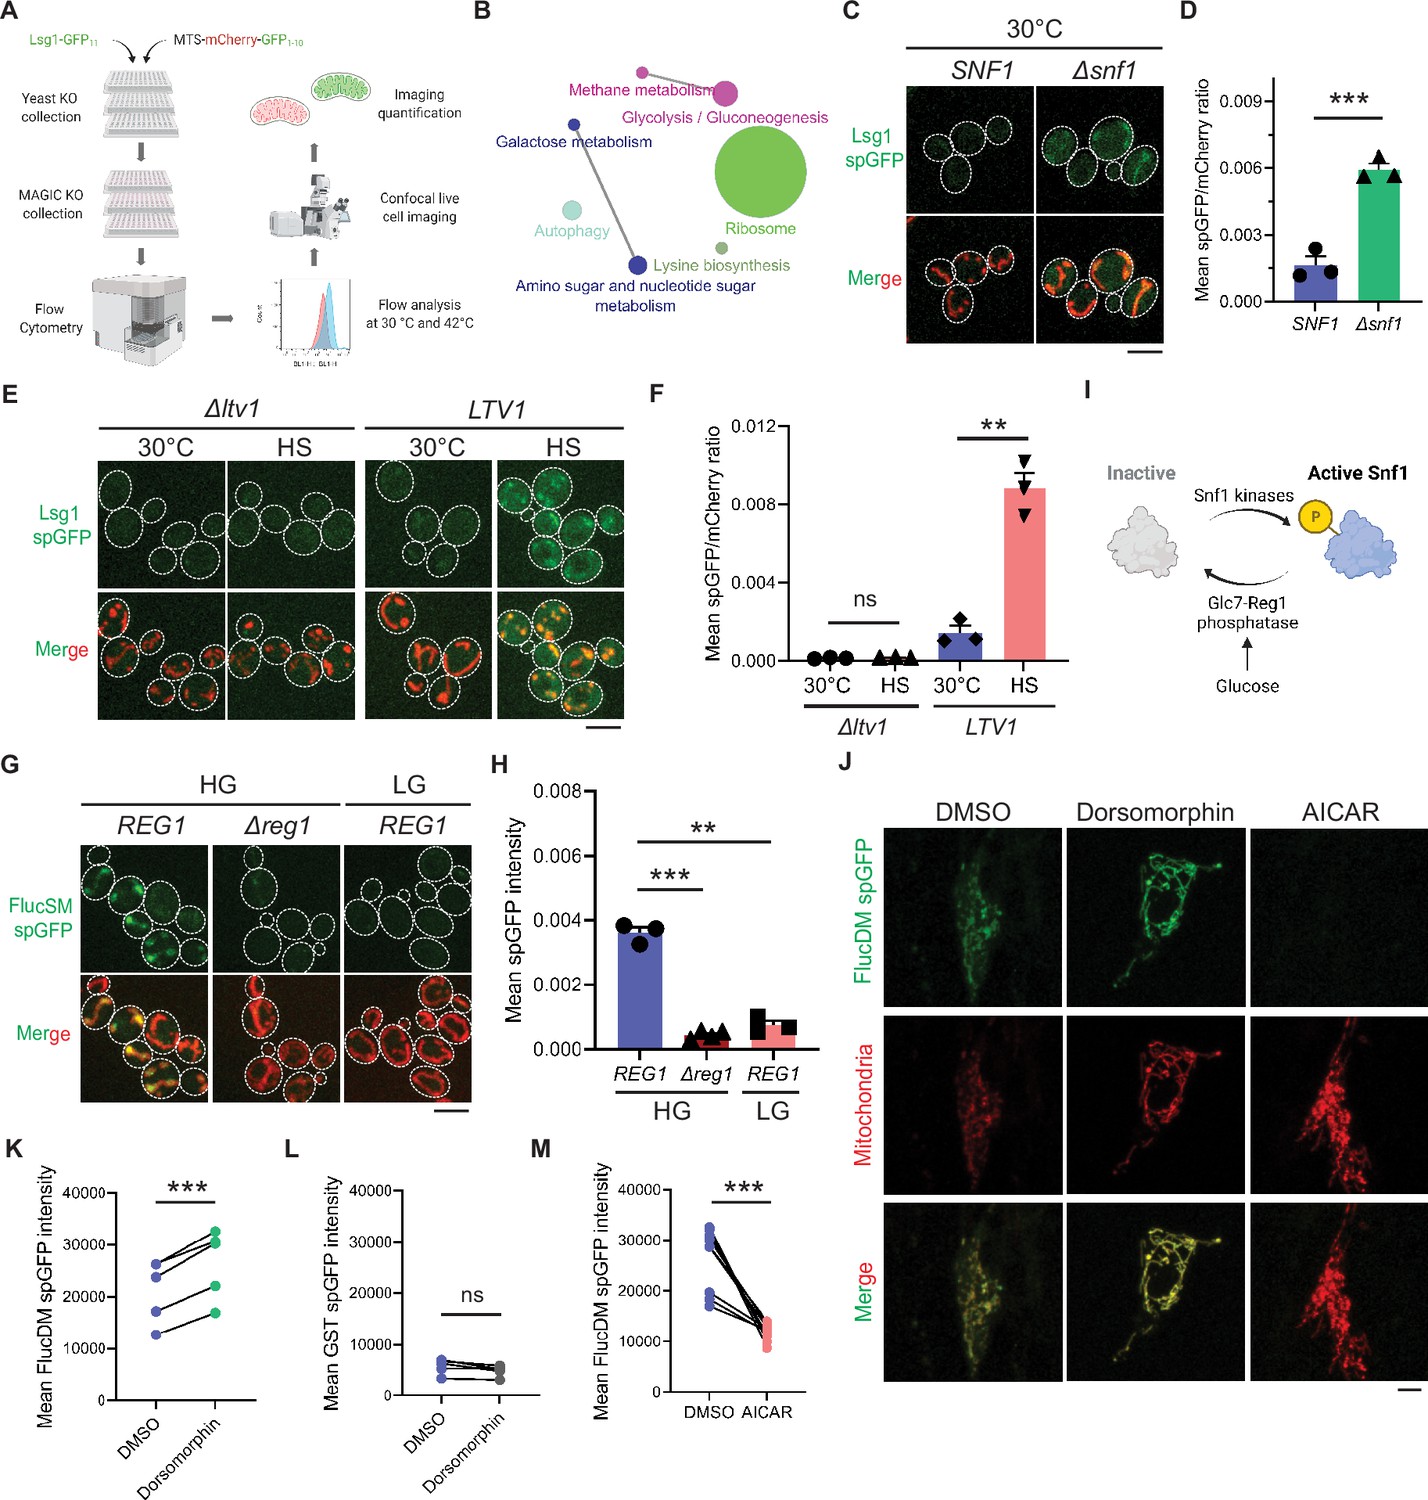
Mitochondria as guardian in cytosol (MAGIC) regulators revealed by a genome-wide screen in yeast and validations in human RPE-1 cells.
(A) Workflow of the split-GFP (spGFP)-based genetic screen in yeast. (B) KEGG pathway analysis of validated mutants that affect MAGIC. The size of the node indicates the number of genes identified. Pathways with at least two associated genes are shown. (C, D) Representative images (C) and quantification (D) of Lsg1 spGFP signal in wild-type (WT) and Δsnf1 cells at 30°C. Shown in (C): top, Lsg1 spGFP; bottom, merged images of spGFP and mitochondria labeled with MTS-mCherry. Shown in (D): means ± SEM of spGFP/mCherry ratio (n=3). Unpaired two-tailed t-test. (E, F) Representative images (E) and quantification (F) of Lsg1 spGFP signal in Δltv1 and WT LTV1 cells at 30°C and after HS. Shown in (F): means ± SEM of spGFP/mCherry ratio (n=3). Paired two-tailed t-test. HS: heat shock. (G, H) Representative images (G) and quantification (H) of FlucSM spGFP signals in WT (REG1) cells in HG or LG, and Δreg1 cells in HG. Shown in (G): top, FlucSM spGFP; bottom, merged images of spGFP and mitochondria labeled with Tom70-mCherry. Shown in (H): means ± SEM of spGFP intensity (n=3 for REG1, n=4 for Δreg1). Paired (REG1 in HG vs. LG) or unpaired (REG1 vs. Δreg1 in HG) two-tailed t-test. (I) Schematic diagram of Snf1 activation in yeast. (J) Representative images of FlucDM spGFP in RPE-1 cells treated with DMSO, dorsomorphin, or 5-aminoimidazole-4-carboxamide ribonucleoside (AICAR). Top, FlucDM spGFP; middle, mitochondria-targeted mCherry; bottom, merged images. (K–M) Flow cytometry-based quantifications of FlucDM spGFP in RPE-1 cells treated with DMSO, dorsomorphin, or AICAR (K, M), and glutathione S-transferase (GST) spGFP in cells treated with DMSO or dorsomorphin (L). Means ± SEM of spGFP intensities are shown. n=5 for (K) and (L). n=9 for (M). Paired two-tailed t-test. **p<0.01; ***p<0.001; ns, not significant, p>0.05. HG: 2% glucose; LG: 0.1% glucose plus 3% glycerol. Scale bars, 5 μm.
-
Figure 1—source data 1
Split-GFP (spGFP) quantification data.
- https://cdn.elifesciences.org/articles/87518/elife-87518-fig1-data1-v1.xlsx
Figure 1—figure supplement 1
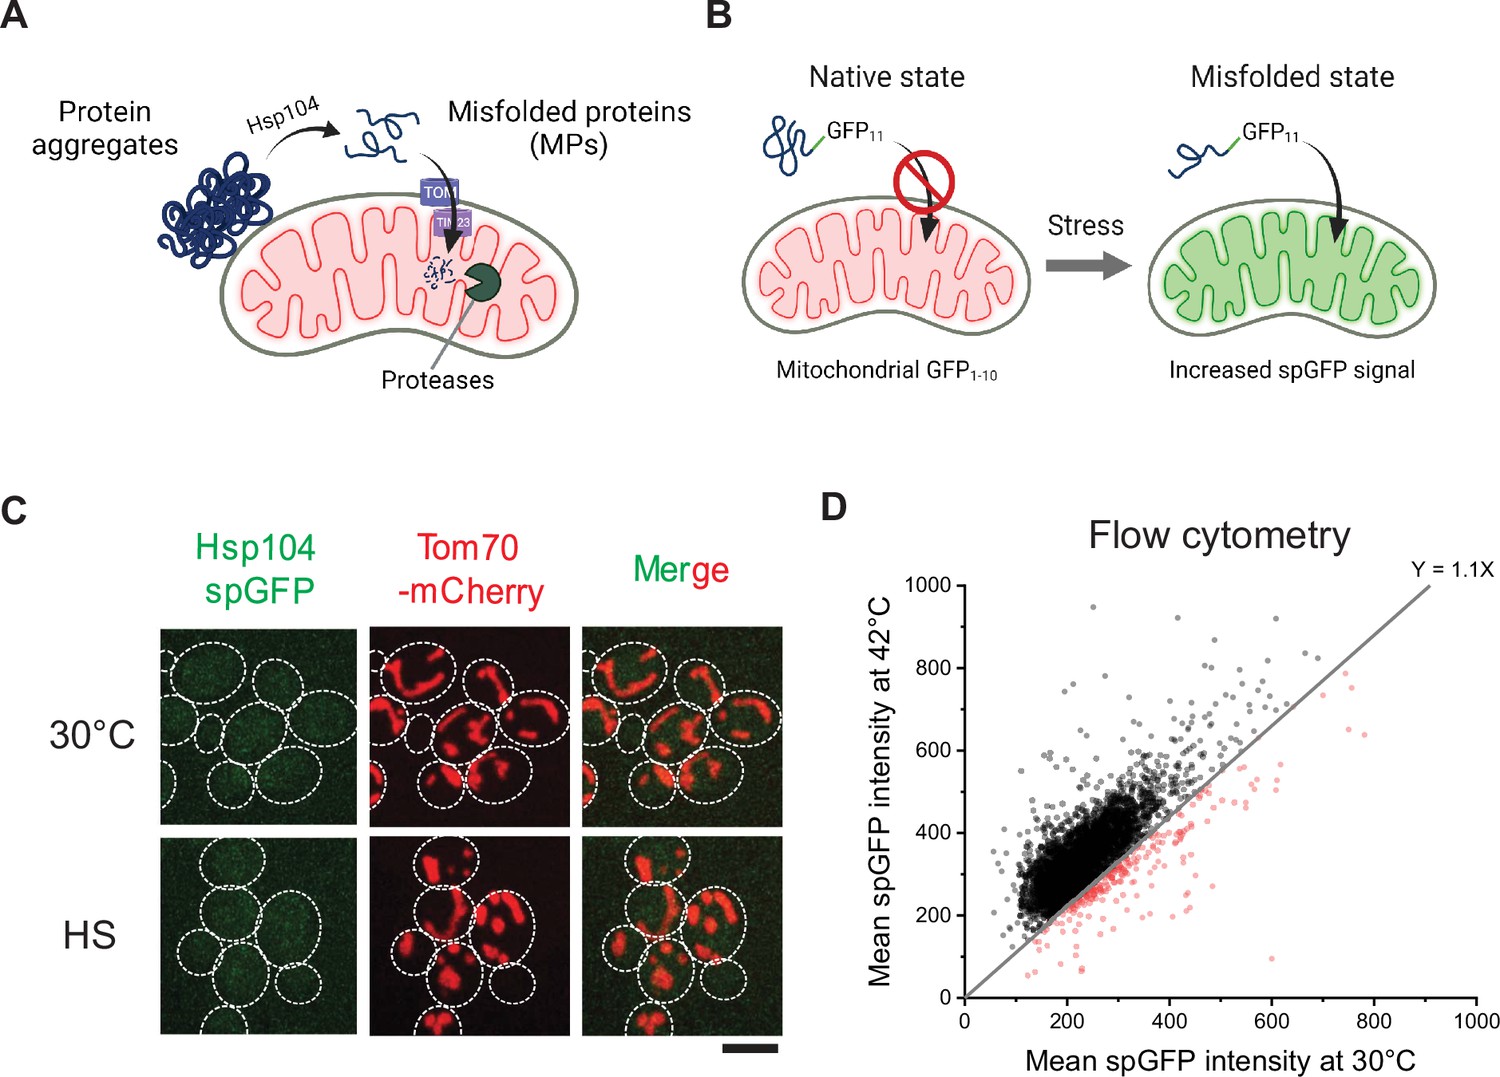
Schematics of mitochondria as guardian in cytosol (MAGIC) pathway and split-GFP (spGFP)-based imaging in the whole-genome screen in yeast.
(A) Schematic diagram of MAGIC involving the import of cytosolic misfolded proteins (MPs) through mitochondrial import machineries and the subsequent degradation under proteotoxic stresses (heat shock [HS] or overload of MPs). (B) Schematic diagram of spGFP reporter. (C) Hsp104 spGFP in mitochondria at 30°C and after HS at 42°C for 30 min. Endogenous Hsp104 was tagged with GFP11, while GFP1-10 was constitutively targeted to the mitochondrial matrix by linking to a matrix protein Grx5. Similar results were obtained by using MTS-mCherry-GFP1-10 (Ruan et al., 2017). Three biological repeats, 63 cells (30°C), and 220 cells (HS) imaged. Scale bar, 5 μm. (D) Flow cytometry readouts of yeast knockout mutants at 30°C and after 42°C HS. Red dots represent mutants that failed to show an increase in Lsg1 spGFP after HS.
-
Figure 1—figure supplement 1—source data 1
Mean split-GFP (spGFP) intensity by flow cytometry.
- https://cdn.elifesciences.org/articles/87518/elife-87518-fig1-figsupp1-data1-v1.xlsx
Figure 1—figure supplement 2
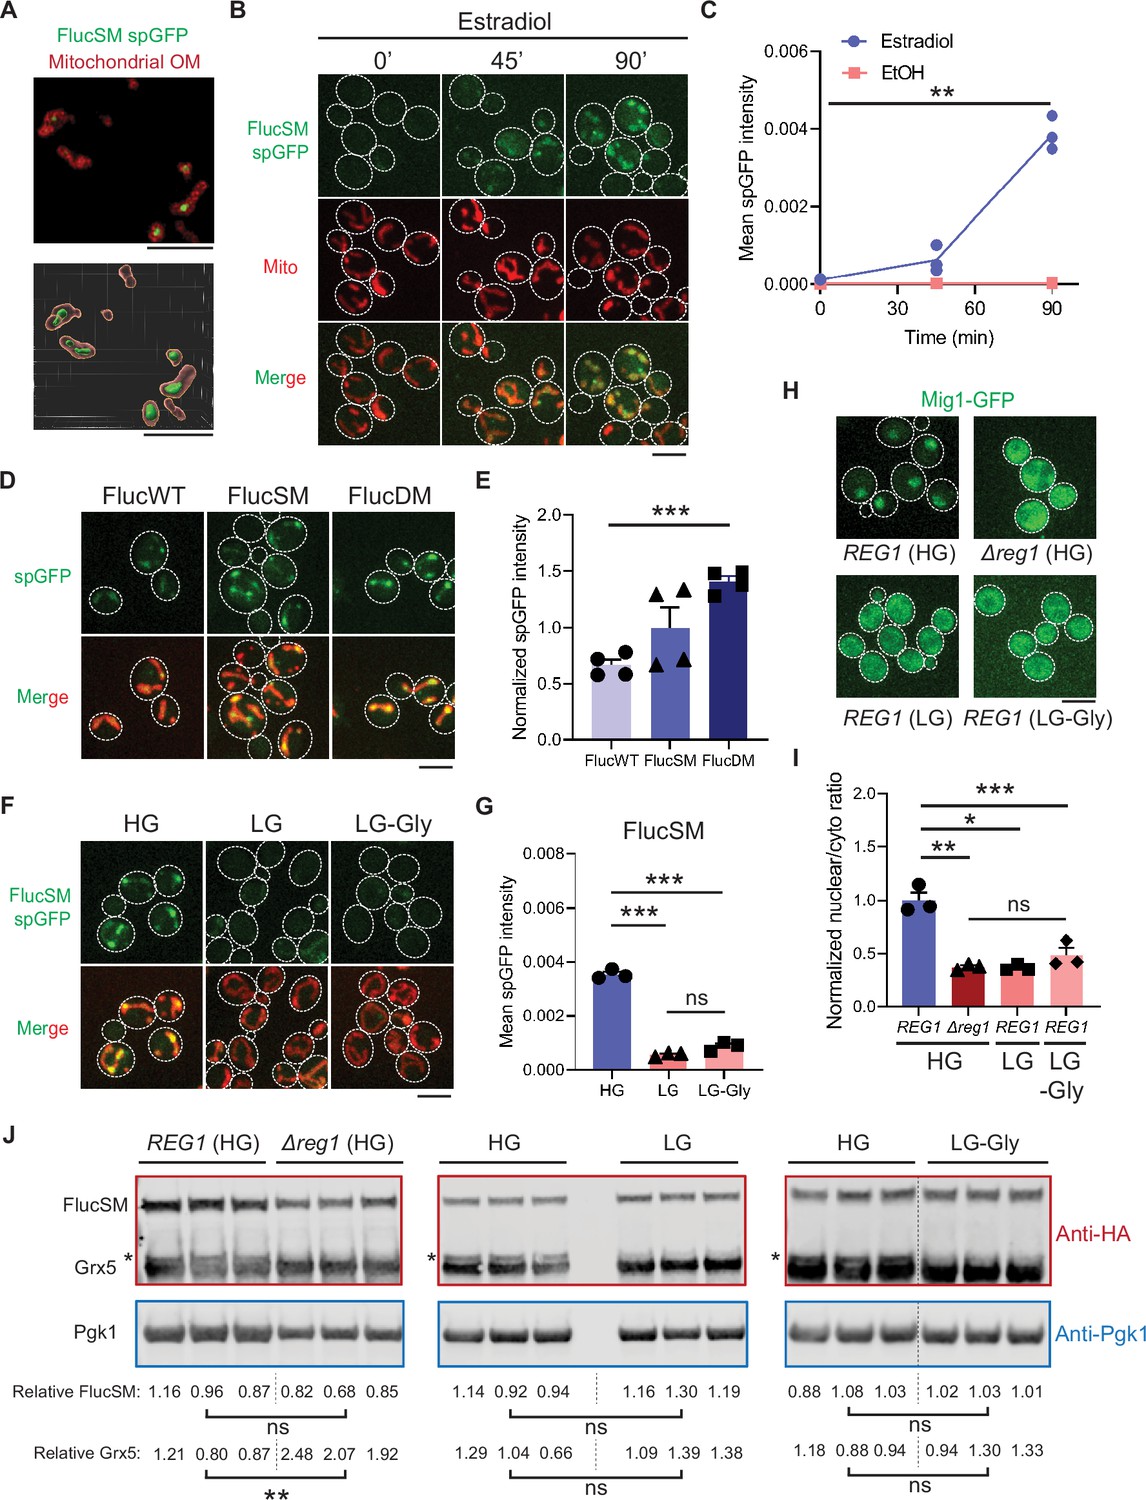
Snf1 regulates the accumulation of misfolded proteins in mitochondria after acute overexpression of FlucSM.
(A) Representative super-resolution imaging for FlucSM split-GFP (spGFP) signal in mitochondria after 90 min estradiol induction. Top, maximum projection. Bottom, 3D rendering. OM: outer membrane labeled by Tom70-mCherry. (B, C) Representative images (B) and quantification (C) of time-dependent accumulation of FlucSM spGFP signal in mitochondria at 30°C after estradiol or ethanol treatment in HG medium. Shown in (B): top, FlucSM spGFP; middle: mitochondria labeled with Tom70-mCherry; bottom: merged images. Shown in (C): means ± SEM of spGFP intensity (n=3). Paired two-tailed t-test comparing 0 min and 90 min estradiol treatment. (D, E) Representative images (D) and quantification (E) of FlucWT, FlucSM, and FlucDM spGFP after 90 min estradiol treatment in HG medium. Shown in (E): means ± SEM of normalized spGFP intensities (n=4). Unpaired two-tailed t-test between FlucWT and FlucDM. (F, G) Representative images (F) and quantification (G) of FlucSM spGFP in cells that grew in HG, LG, and LG-Gly media. Shown in (G): means ± SEM of spGFP intensity (n=3). Paired two-tailed t-test. (H, I) Representative images (H) and quantification (I) of the nuclear-cytoplasmic translocation of Mig1-GFP. Shown in (I): means ± SEM of normalized Mig-GFP nuclear-cytoplasmic ratio (n=3). Paired (wild-type [WT] in HG vs. LG or LG-Gly) or unpaired (WT vs. Δreg1 in HG) two-tailed t-test, and one-way ANOVA for comparing Δreg1 in HG, WT in LG, and WT in LG-Gly. (J) Immunoblots of FlucSM-HA-GFP11 and Grx5-HA-GFP1-10 in cell lysates. Relative FlucSM levels (FlucSM/Pgk1) and relative Grx5 levels (matured Grx5/Pgk1) of three biological repeats are shown. Paired (HG vs. LG or LG-Gly) or unpaired (WT vs. Δreg1 in HG) two-tailed t-test. Asterisks indicate the precursor species of Grx5-HA-GFP1-10 that are excluded from quantification. HG: 2% glucose; LG: 0.1% glucose plus 3% glycerol; LG-Gly: 0.1% glucose. EtOH: ethanol. *p<0.05; **p<0.01; ***p<0.001; ns, not significant, p>0.05. Scale bars, 5 μm.
-
Figure 1—figure supplement 2—source data 1
Raw data for split-GFP (spGFP) intensity and Mig1-GFP quantification.
- https://cdn.elifesciences.org/articles/87518/elife-87518-fig1-figsupp2-data1-v1.xlsx
-
Figure 1—figure supplement 2—source data 2
Raw and labeled immunoblots for Figure 1—figure supplement 2J.
- https://cdn.elifesciences.org/articles/87518/elife-87518-fig1-figsupp2-data2-v1.zip
Figure 1—figure supplement 3
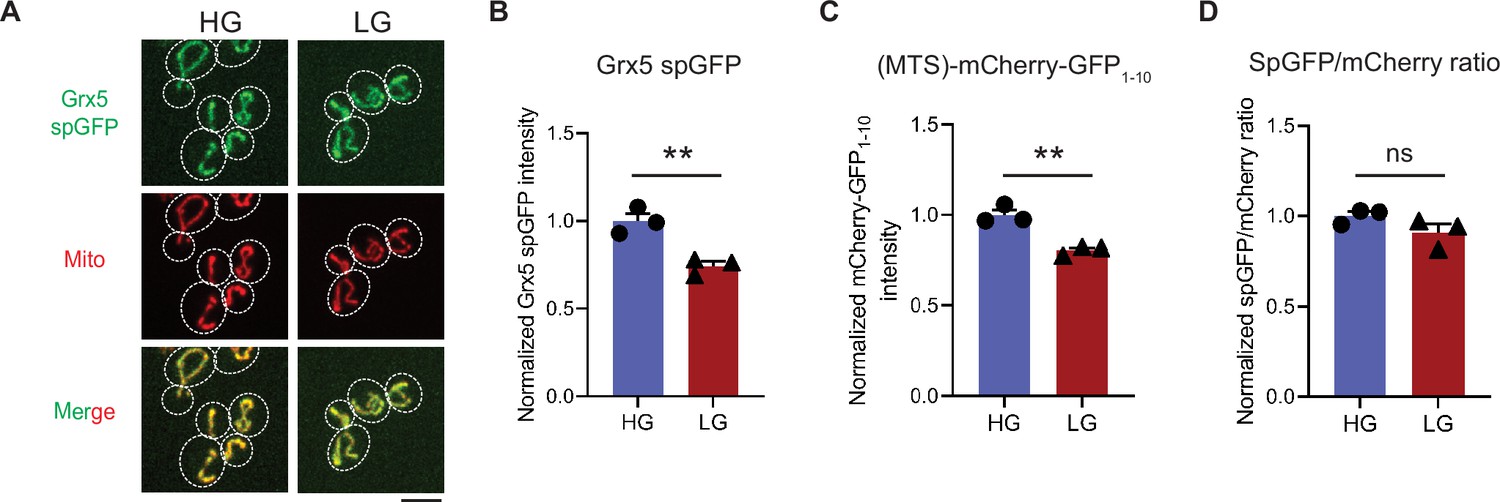
Snf1 activation only modestly affects split-GFP (spGFP) reconstitution.
(A–D) Representative images (A) and quantification of Grx5 spGFP (B), MTS-mCherry-GFP1-10 (C) and spGFP-to-mCherry ratio (D) in HG or LG medium. Means ± SEM are shown in (B–D). Unpaired two-tailed t-test (n=3). **p<0.01; ns, not significant, p>0.05. HG: 2% glucose; LG: 0.1% glucose plus 3% glycerol. Scale bars, 5 μm.
-
Figure 1—figure supplement 3—source data 1
Quantification of split-GFP (spGFP) and mCherry intensity.
- https://cdn.elifesciences.org/articles/87518/elife-87518-fig1-figsupp3-data1-v1.xlsx
Figure 2 with 1 supplement
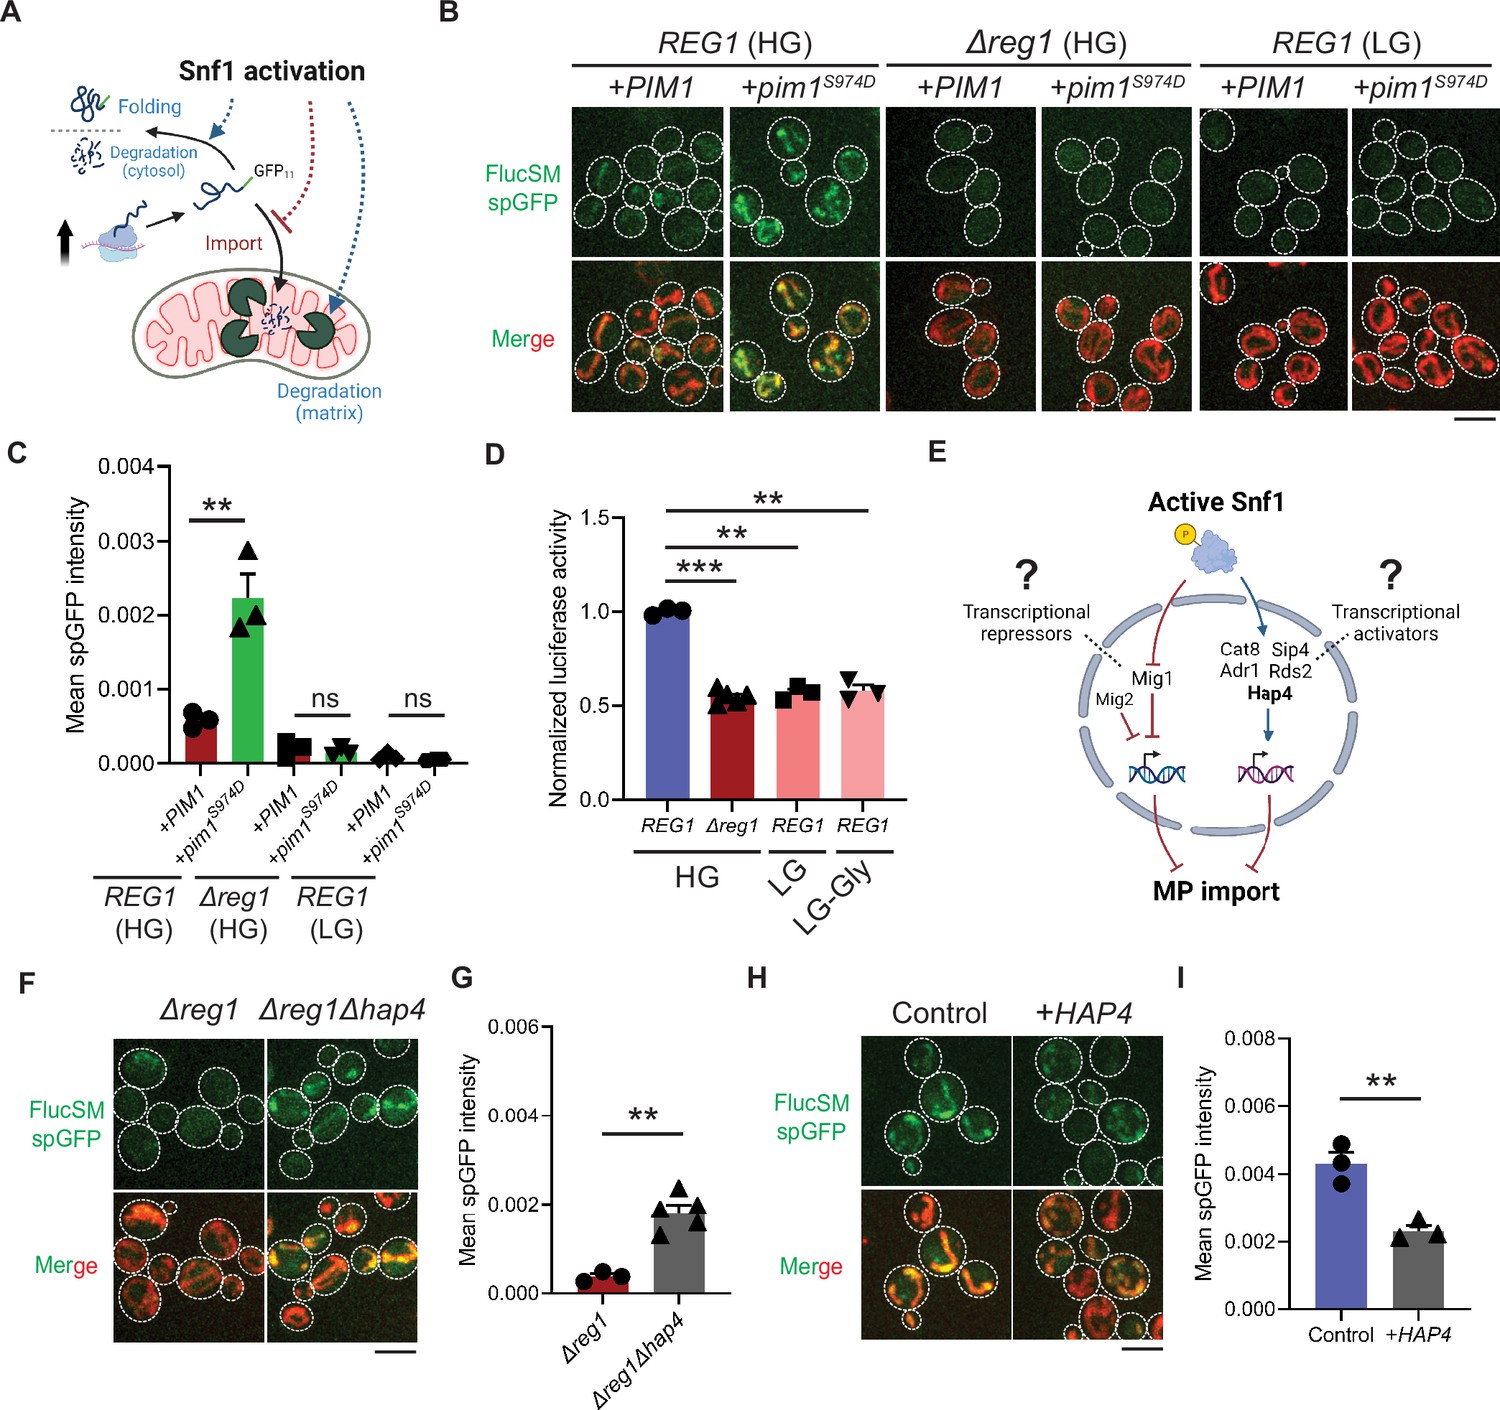
Snf1 negatively regulates mitochondrial import of cytosolic misfolded proteins (MPs).
(A) Schematic diagram showing three possible explanations for reduced split-GFP (spGFP) in mitochondria of Snf1-active cells: reduced MPs, blocked import, or enhanced degradation. (B, C) Representative images (B) and quantification (C) of FlucSM spGFP in Snf1-inactive and Snf1-active cells overexpressing copper-inducible PIM1 or pim1S974D. Shown in (C): means ± SEM of spGFP intensities (n=3). Unpaired two-tailed t-test. (D) Relative in vivo luciferase activity after 90 min of estradiol treatment. Means ± SEM of normalized FlucSM activity are shown (n=3 for REG1, n=5 for Δreg1). Paired (wild-type [WT] in different media) or unpaired (WT vs. Δreg1 in HG) two-tailed t-test. LG-Gly: 0.1% glucose only. (E) Hypothetical regulations of import of MPs through transcriptional repressors and activators downstream of Snf1 activation. (F, G) Representative images (F) and quantification (G) of FlucSM spGFP in Δreg1 and Δreg1Δhap4 cells in HG medium. Shown in (G): means ± SEM of spGFP intensity (n=3 for Δreg1, n=5 for Δreg1Δhap4). Unpaired two-tailed t-test. (H, I) Representative images (H) and quantification (I) of FlucSM spGFP in WT cells (control) or with constitutive overexpression of HAP4 in HG medium. Shown in (I): means ± SEM of spGFP intensities (n=3). Unpaired two-tailed t-test. **p<0.01; ***p<0.001; ns, not significant, p>0.05. Scale bars, 5 μm.
-
Figure 2—source data 1
Split-GFP (spGFP) intensity and luciferase activity.
- https://cdn.elifesciences.org/articles/87518/elife-87518-fig2-data1-v1.xlsx
Figure 2—figure supplement 1
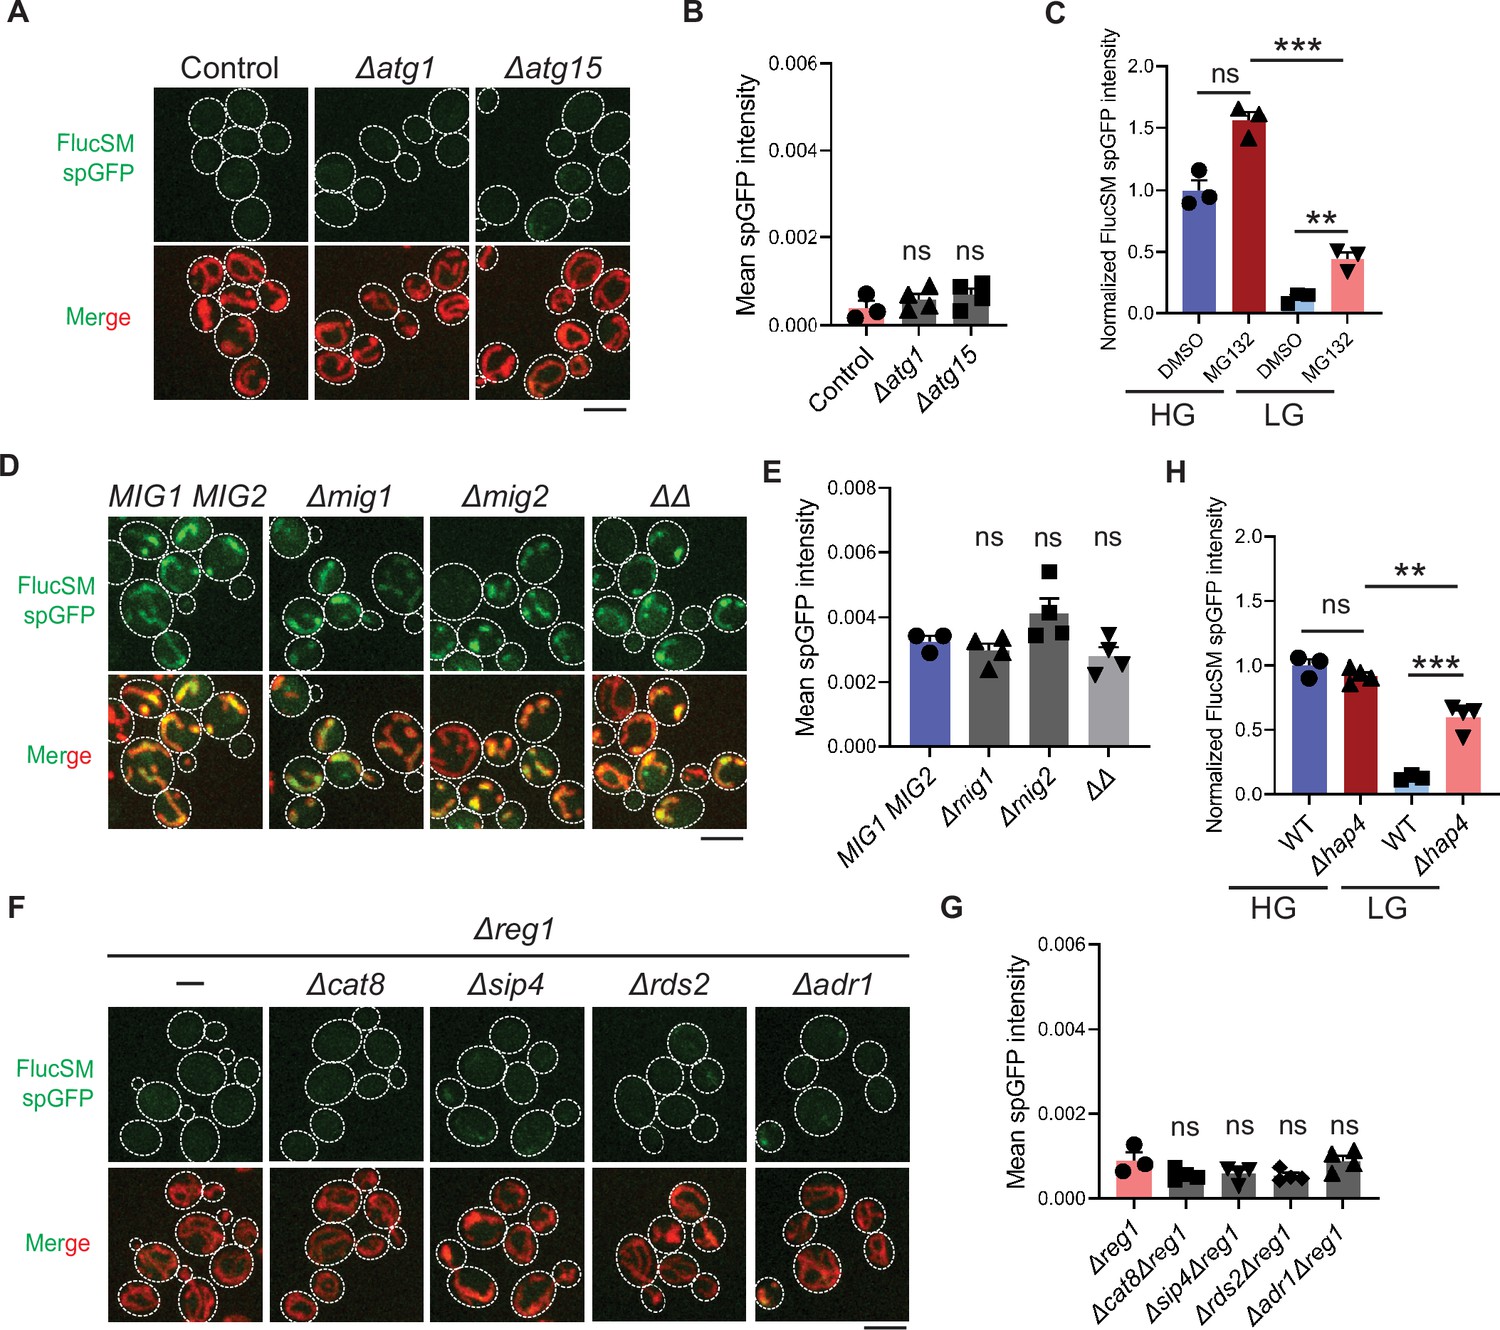
Reduced accumulation of misfolded proteins in mitochondria under Snf1 activation is neither caused by elevated autophagy nor mediated by certain transcription factors.
(A, B) Representative images (A) and quantification (B) of FlucSM split-GFP (spGFP) in control cells and autophagy-deficient mutants in LG medium. Shown in (B): means ± SEM of spGFP intensity. Unpaired two-tailed t-test between control (n=3) and each mutant (n=4). (C) Quantification of FlucSM spGFP signals in Δpdr5 cells treated with DMSO or 80 µM MG132 for 90 min during estradiol induction. Means ± SEM of normalized spGFP intensities are shown (n=3). Paired two-tailed t-test. (D, E) Representative images (D) and quantification (E) of FlucSM spGFP in wild-type (WT) (MIG1 MIG2), Δmig1, Δmig2, and Δmig1Δmig2 (ΔΔ) cells in HG medium. Shown in (E): means ± SEM of spGFP intensity (n=3 for WT, and n=4 for each mutant). Unpaired two-tailed t-test between WT and each mutant. (F, G) Representative images (F) and quantification (G) of FlucSM spGFP in Δreg1 and double mutant cells in HG medium. Shown in (G): means ± SEM of spGFP intensity . Unpaired two-tailed t-test between Δreg1 (n=3) and each double mutant (n=4). (H) Quantification of FlucSM spGFP signals in WT or Δhap4 cells. Unpaired two-tailed t-test between WT (n=3) and Δhap4 (n=4). Paired two-tailed t-test for Δhap4 cells in different medium. **p<0.01; ***p<0.001; ns, not significant, p>0.05. Scale bars, 5 μm.
-
Figure 2—figure supplement 1—source data 1
Quantification of FlucSM split-GFP (spGFP) in different mutants or under drug treatment.
- https://cdn.elifesciences.org/articles/87518/elife-87518-fig2-figsupp1-data1-v1.xlsx
Figure 3 with 1 supplement
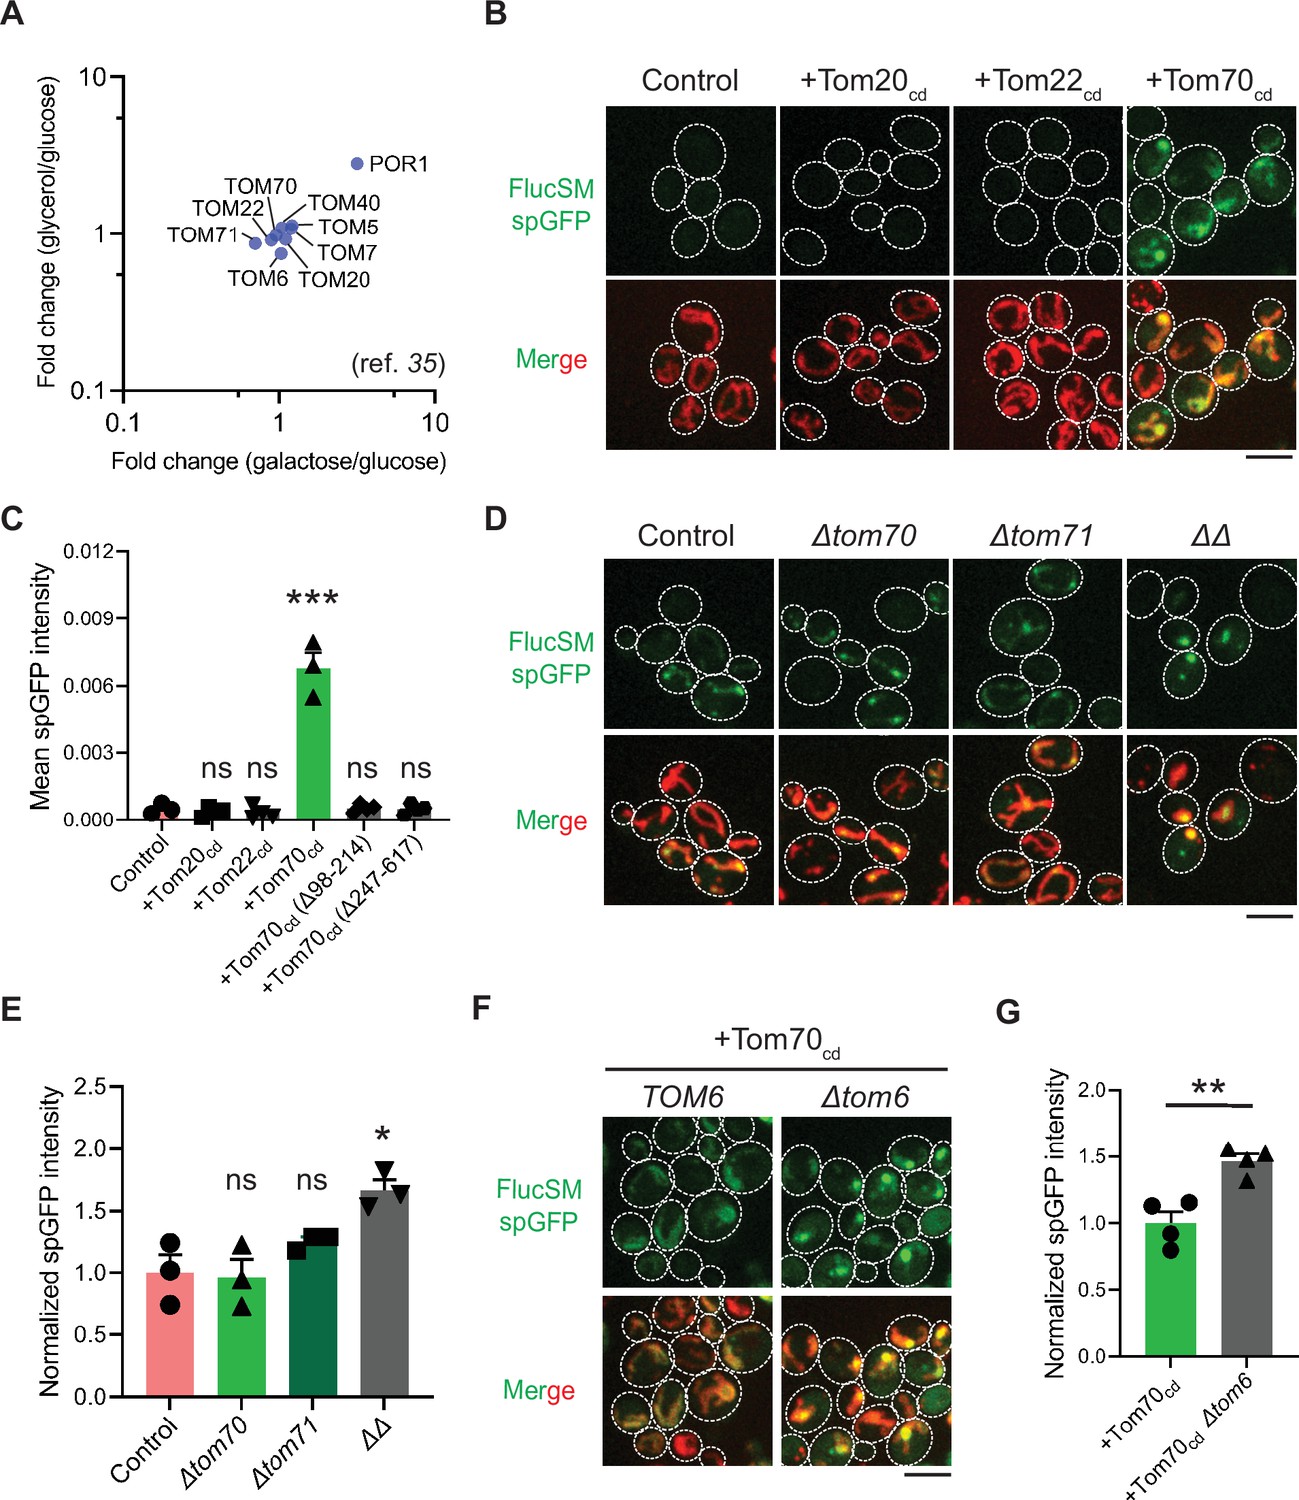
Mechanisms underlying Snf1-regulated misfolded protein (MP) import into mitochondria.
(A) Fold changes in protein abundance of TOM complex components in glucose-limiting condition (glycerol or galactose) compared to glucose-rich condition. Raw data are retrieved from a published quantitative mass spectrometry dataset (Morgenstern et al., 2017). (B, C) Representative images (B) and quantification (C) of FlucSM split-GFP (spGFP) in wild-type control cells (n=3) and cells overexpressing Tom20cd (n=4), Tom22cd (n=4), and Tom70cd (n=3) (C), or truncated Tom70cd variants (n=4) (Figure 3—figure supplement 1D) in LG medium. Shown in (C): means ± SEM of spGFP intensities. Unpaired two-tailed t-test between control and overexpression strains. (D, E) Representative images (D) and quantification (E) of FlucSM spGFP in wild-type control, Δtom70, Δtom71, and Δtom70 Δtom71 (ΔΔ) cells in HG medium. Shown in (D): top, FlucSM spGFP; bottom, merged images of spGFP and mitochondria labeled with mCherry-Fis1TM. Shown in (E): means ± SEM of normalized spGFP intensity (n=3). Unpaired two-tailed t-test. (F, G) Representative images (F) and quantification (G) of FlucSM spGFP in control and Δtom6 cells overexpressing Tom70cd in LG medium. Shown in (G): means ± SEM of normalized spGFP intensities (n=4). Unpaired two-tailed t-test. *p<0.05; **p<0.01; ***p<0.001; ns, not significant, p>0.05. Scale bars, 5 μm.
-
Figure 3—source data 1
Previously reported mass spectrometry dataset and quantification of split-GFP (spGFP) in various mutants.
- https://cdn.elifesciences.org/articles/87518/elife-87518-fig3-data1-v1.xlsx
Figure 3—figure supplement 1
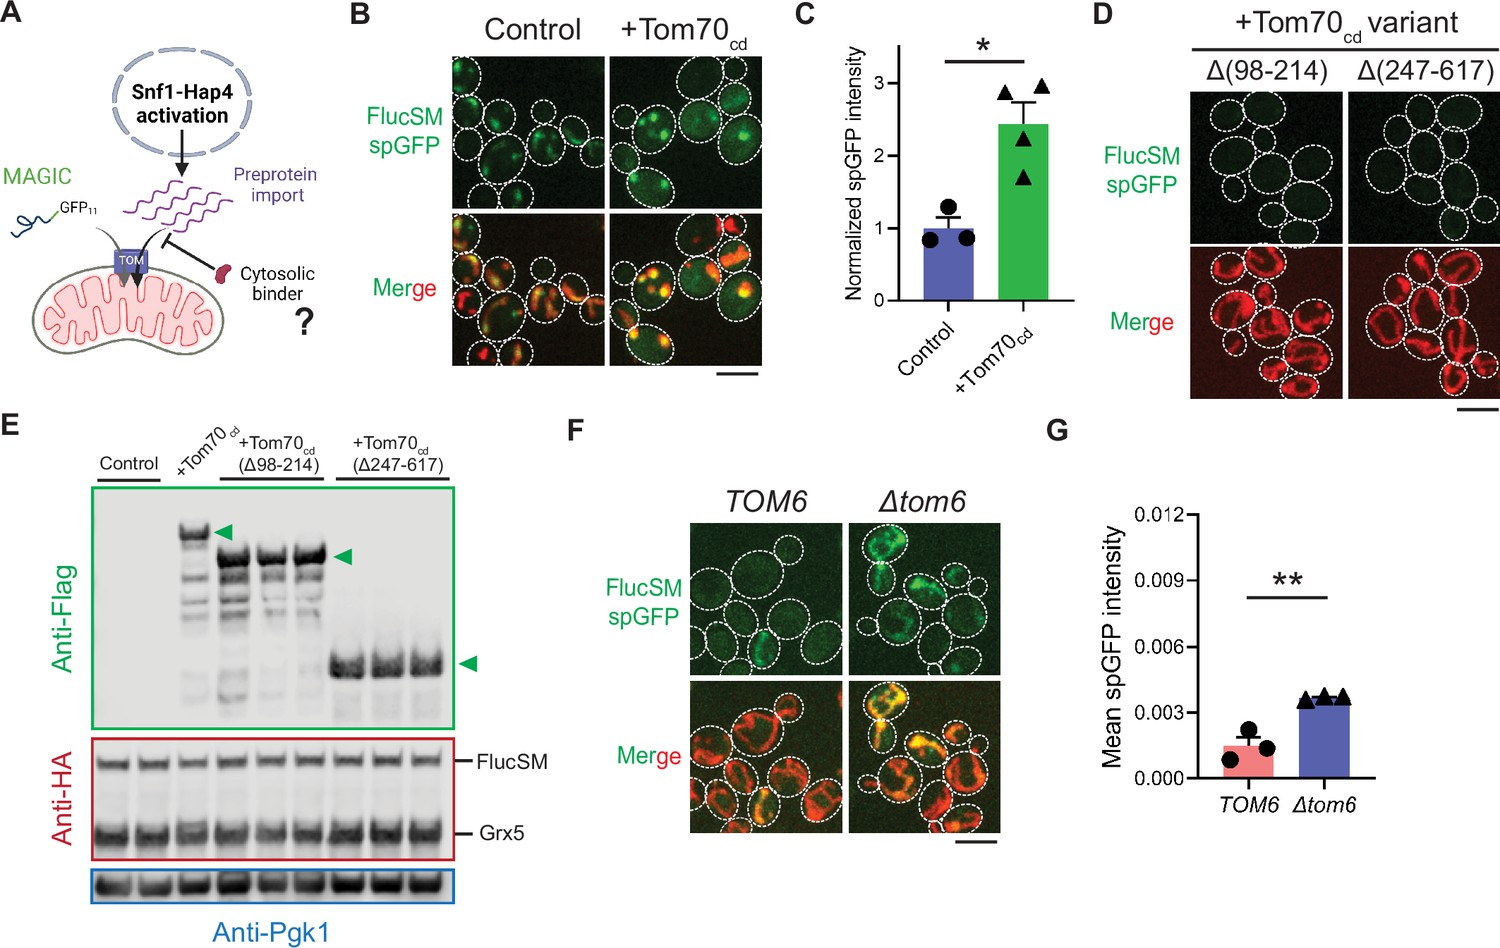
Role of Tom70 cytosolic domain and Tom6 in regulating misfolded protein import.
(A) Working model of preprotein import and misfolded protein import through limited TOM channels. Introducing cytosolic binders of preproteins may release the import capacity for misfolded proteins. (B, C) Representative images (B) and quantification (C) of FlucSM split-GFP (spGFP) in cells with or without Tom70cd overexpression in HG medium. Shown in (C): means ± SEM of normalized spGFP intensity (n=3 for control, and n=4 for Tom70cd). Unpaired two-tailed t-test. (D) Representative images of FlucSM spGFP in cells overexpressing truncated Tom70cd variants in LG medium. Quantification is shown in Figure 4C. (E) Immunoblots of overexpressed Tom70cd-3×Flag variants in lysates of cells that grew in LG medium. Anti-HA panel shows FlucSM-HA-GFP11 after 90 min estradiol treatment and constitutively expressed Grx5-HA-GFP1-10. Arrowheads indicate intact Tom70cd-3×Flag variants. (F, G) Representative images (F) and quantification (G) of FlucSM spGFP in wild-type (WT) and Δtom6 cells in LG medium. Shown in (G): means ± SEM of spGFP intensities (n=3). Unpaired two-tailed t-test. *p<0.05; **p<0.01; ns, not significant, p>0.05. Scale bars, 5 μm.
-
Figure 3—figure supplement 1—source data 1
Normalized split-GFP (spGFP) intensity.
- https://cdn.elifesciences.org/articles/87518/elife-87518-fig3-figsupp1-data1-v1.xlsx
-
Figure 3—figure supplement 1—source data 2
Raw and labeled immunoblots for Figure 3—figure supplement 1E.
- https://cdn.elifesciences.org/articles/87518/elife-87518-fig3-figsupp1-data2-v1.zip
Figure 4 with 1 supplement
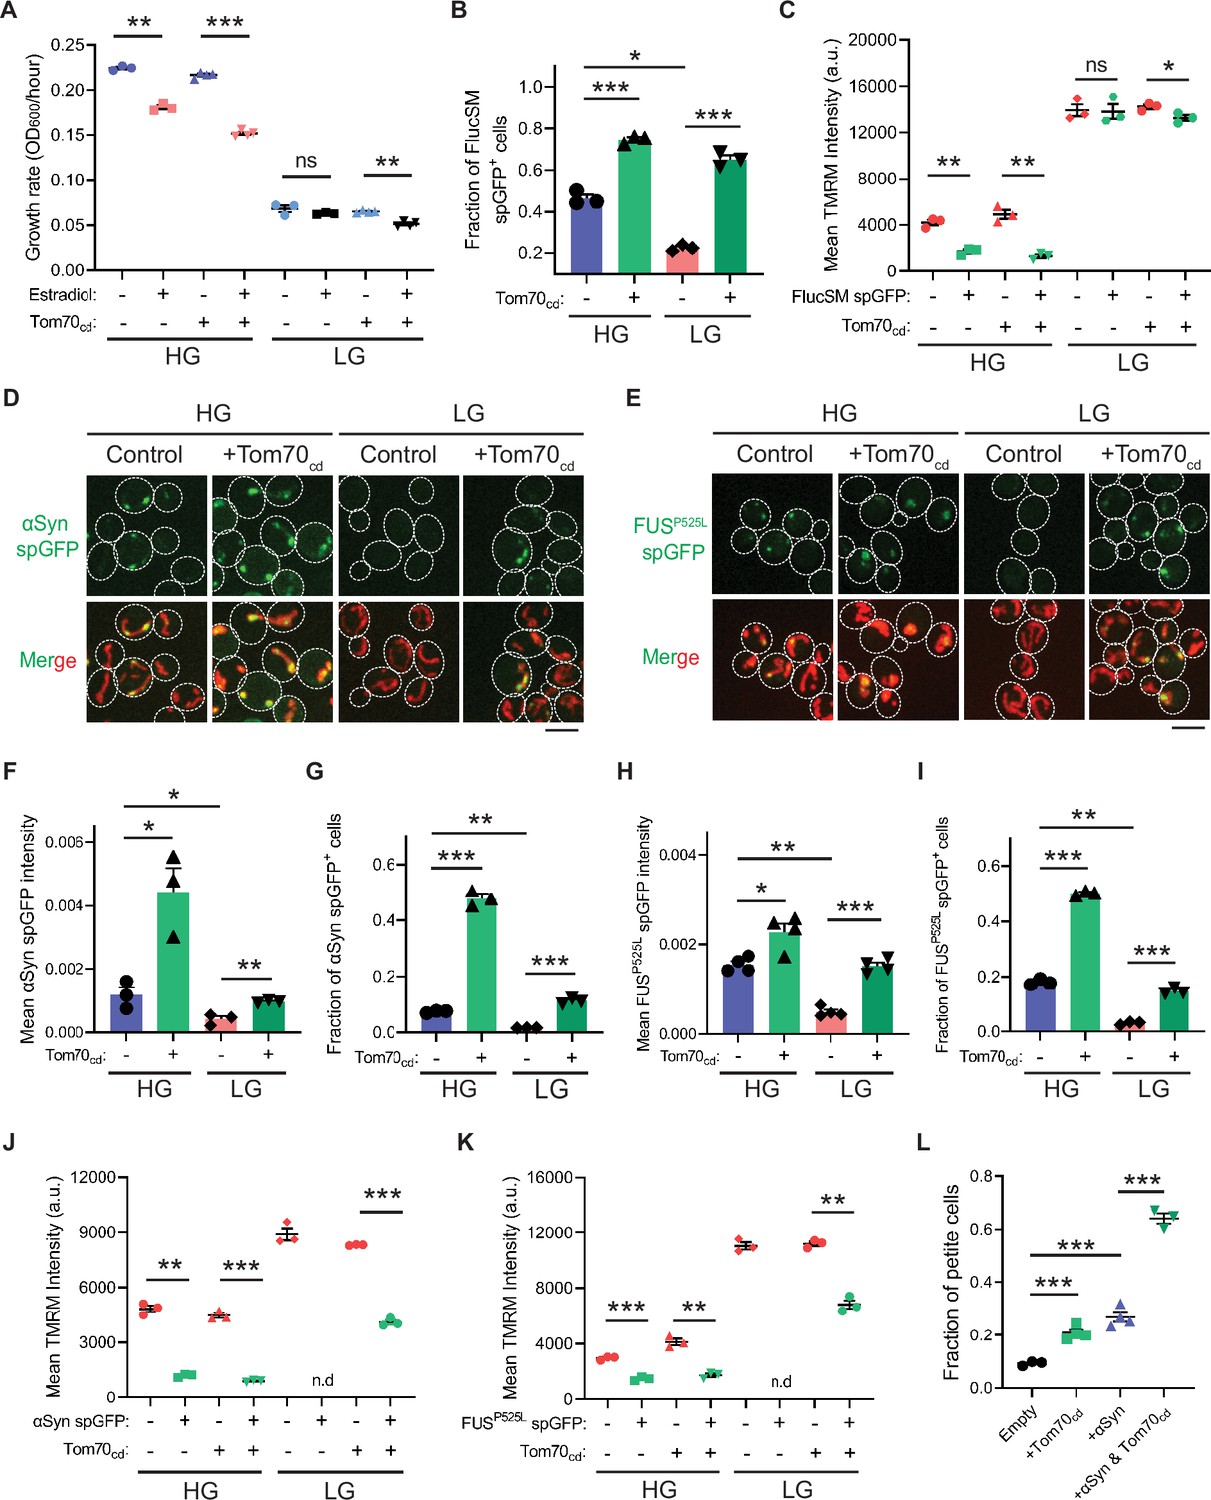
Snf1 activation protects cellular fitness against proteotoxic stress.
(A) Growth rates of wild-type cells and cells overexpressing Tom70cd with (estradiol) or without (EtOH) FlucSM expression in HG and LG medium. Means ± SEM of OD600 or growth rates are shown (n=3 for no Tom70cd expression, and n=4 for Tom70cd expression). Paired two-tailed t-test. (B) Fraction of FlucSM split-GFP (spGFP)-positive cells measured by flow cytometry. Means ± SEM are shown (n=3). Unpaired two-tailed t-test for cells growing in the same medium. Paired two-tailed t-test for control cells growing in different medium. (C) Comparisons of mitochondrial membrane potential between FlucSM spGFP-negative and spGFP-positive cells measured by tetramethylrhodamine methyl ester (TMRM). Means ± SEM are shown (n=3). Paired two-tailed t-test. (D–I) Representative images and quantifications of α-synuclein (αSyn) spGFP and FUSP525L spGFP signal. Shown in (F, H): means ± SEM of spGFP intensity measured by confocal imaging (n=3 for αSyn, and n=4 for FUSP525L). Shown in (G, I): means ± SEM of fraction of spGFP-positive cells measured by flow cytometry (n=3 for αSyn, and n=4 for FUSP525L). Unpaired two-tailed t-test for cells growing in the same medium. Paired two-tailed t-test for control cells between HG and LG medium. (J, K) Comparisons of membrane potential between αSyn or FUSP525L spGFP-negative and spGFP-positive cells measured by TMRM. Means ± SEM are shown (n=3 for αSyn, and n=4 for FUSP525L). Paired two-tailed t-test. n.d.: not determined due to limited positive cell counts in control cells growing in LG medium. (L) Fraction of respiratory-deficient petite cells measured by using tetrazolium overlay. Means ± SEM are shown (n=3 for empty control and αSyn with Tom70cd, and n=4 for the rest). Unpaired two-tailed t-test. HG: 2% glucose; LG: 0.1% glucose plus 3% glycerol. *p<0.05; **p<0.01; ***p<0.001; ns, not significant, p>0.05. Scale bars, 5 μm.
-
Figure 4—source data 1
Quantification of growth rate, split-GFP (spGFP), tetramethylrhodamine methyl ester (TMRM) intensity, and petite cell fraction.
- https://cdn.elifesciences.org/articles/87518/elife-87518-fig4-data1-v1.xlsx
Figure 4—figure supplement 1
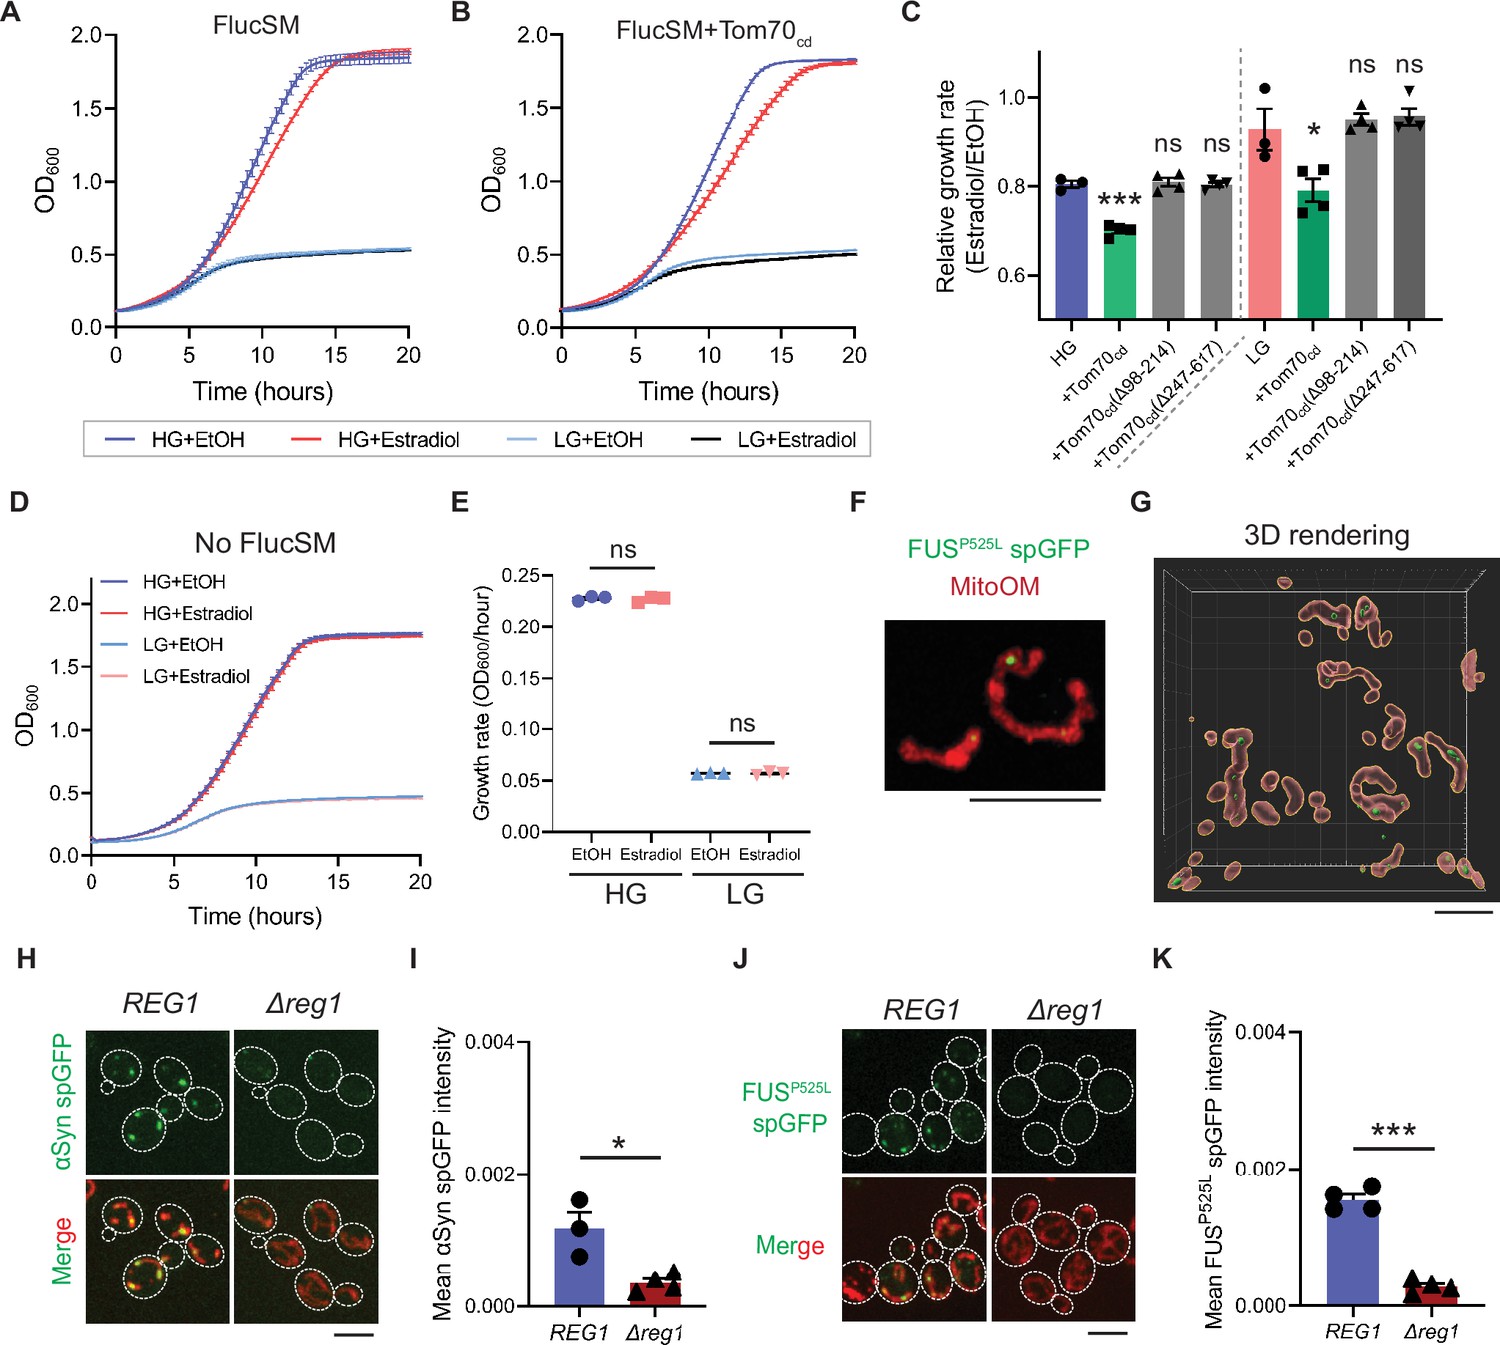
Snf1 activation protects against stress associated with FlucSM overexpression and prevents the accumulation of α-synuclein and FUSP525L in yeast mitochondria.
(A, B) Growth curves of wild-type control cells (n=3) (A) and cells overexpressing Tom70cd (n=4) (B) with (estradiol) or without (EtOH) FlucSM expression in HG and LG medium. Fitted growth rates are shown in Figure 4A. (C) Relative growth rates of control cells and cells overexpressing Tom70cd variants. Means ± SEM are shown. Unpaired two-tailed t-test between control (n=3) and Tom70cd variants (n=4) that grew in the same medium (HG or LG). (D, E) Growth curves (D) and growth rates (E) of BY4741 cells lack of FlucSM split-GFP (spGFP) reporter in HG and LG medium. Means ± SEM are shown (n=3). Paired two-tailed t-test. (F, G) Representative super-resolution imaging for FUSP525L spGFP signal in mitochondria after 100 min of estradiol induction. Shown in (F): maximum projection image. Shown in (G): 3D rendered image. Mitochondrial OM: Mitochondrial outer membrane labeled with Tom70-mCherry. (H–K) Representative images (H, J) and quantification (I, K) of α-synuclein (αSyn) spGFP signal FUSP525L spGFP signal in wild-type (REG1) (n=3 for αSyn or n=4 for FUSP525L) and Δreg1 cells (n=4). Shown in (I, K): means ± SEM of spGFP intensity. Unpaired two-tailed t-test. HG: 2% glucose; LG: 0.1% glucose plus 3% glycerol. EtOH: ethanol. *p<0.05; **p<0.01; ns, not significant, p>0.05. Scale bars, 5 μm.
-
Figure 4—figure supplement 1—source data 1
Raw data of growth curves, and quantification of growth rate and split-GFP (spGFP) intensity.
- https://cdn.elifesciences.org/articles/87518/elife-87518-fig4-figsupp1-data1-v1.xlsx
Figure 5
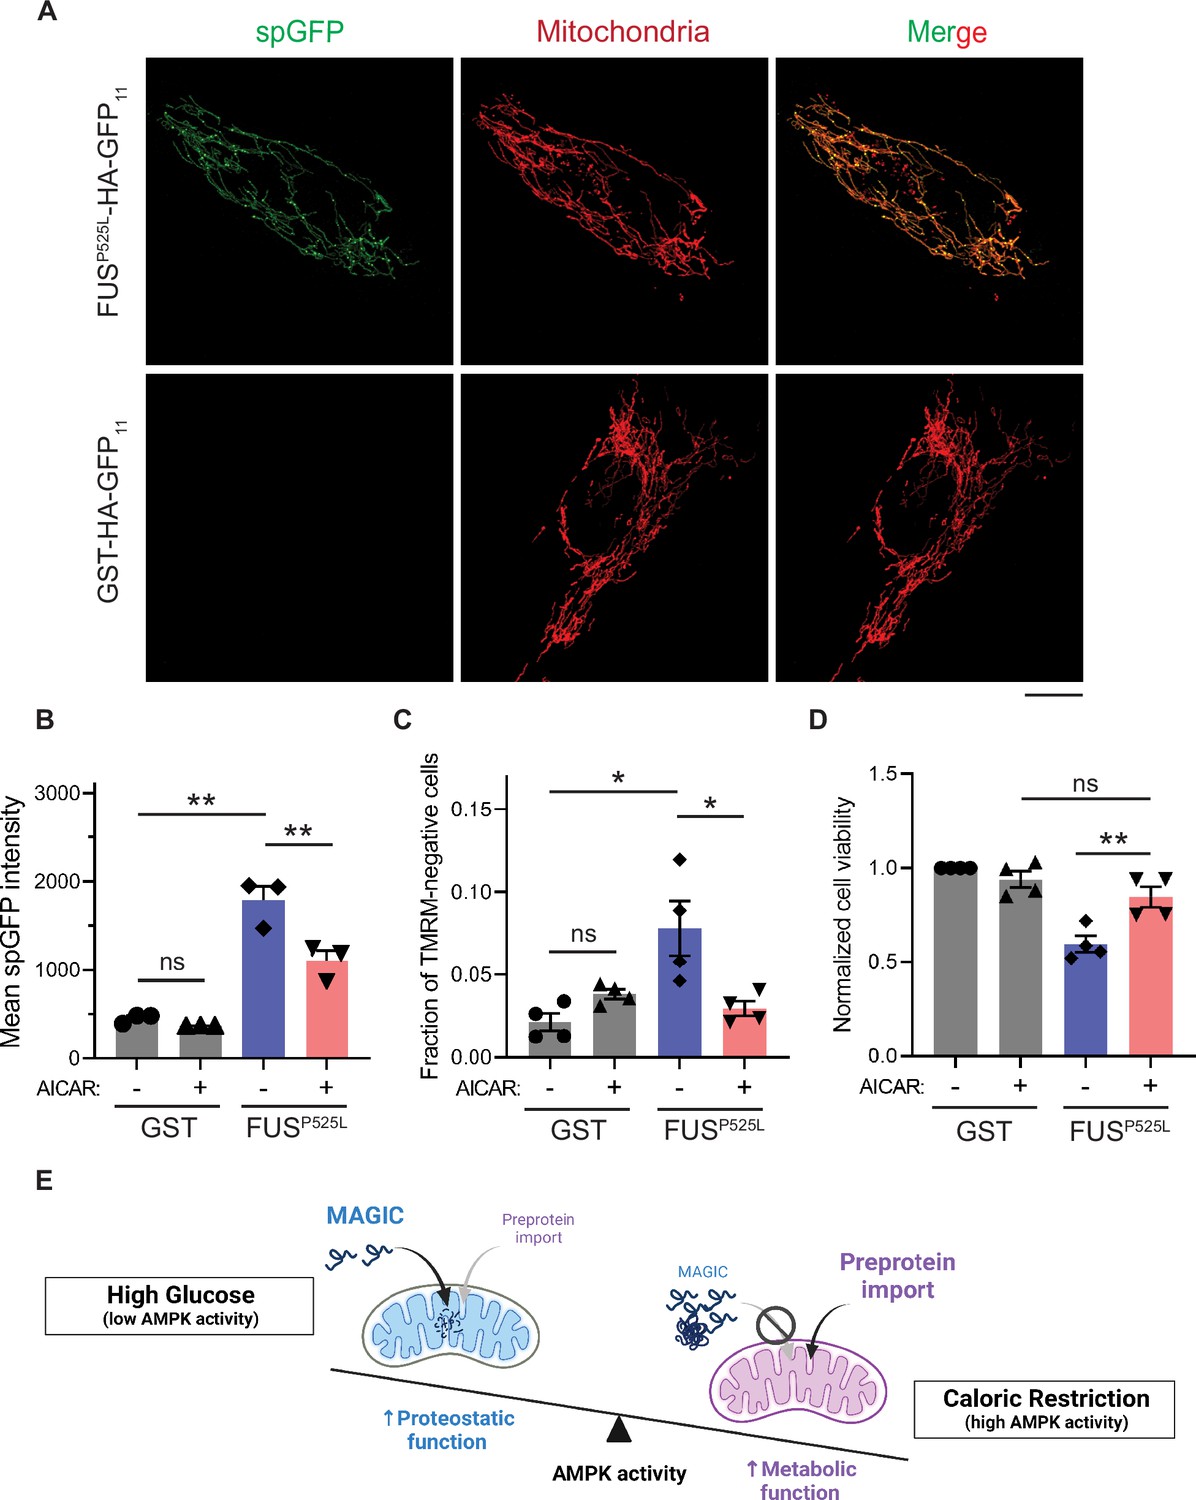
AMP-activated protein kinase (AMPK) activation prevents the accumulation of ALS-associated FUSP525L in mitochondria of RPE-1 cells and alleviates FUS-induced cytotoxicity.
(A, B) Representative images (A) and flow cytometry quantification (B) of FUSP525L split-GFP (spGFP) and glutathione S-transferase (GST) spGFP in mitochondria of RPE-1 cells treated with or without 5-aminoimidazole-4-carboxamide ribonucleoside (AICAR). Shown in (B): means ± SEM of spGFP intensity (n=3). (C, D) Fraction of tetramethylrhodamine methyl ester (TMRM)-negative cells (C) and normalized cell viability (D) of RPE-1 cells expressing GST-HA-GFP11 or FUSP525L-HA-GFP11 with or without AICAR treatment. Means ± SEM are shown (n=4). (E) Working model wherein Snf1/AMPK balances the metabolic and proteostasis function of mitochondria in response to glucose availability. Paired two-tailed t-test for the same cell line treated with drug or control medium. Unpaired two-tailed t-test between cell lines expressing GST and FUSP525L. *p<0.05; **p<0.01; ns, not significant, p>0.05. Scale bars, 10 μm.
-
Figure 5—source data 1
Raw data for Figure 5B–D.
- https://cdn.elifesciences.org/articles/87518/elife-87518-fig5-data1-v1.xlsx
Videos
Video 1
3D reconstructed structured illumination microscopy (SIM) images showing FlucSM split-GFP (spGFP) inside mitochondria after 90 min estradiol treatment.
The mitochondrial outer membrane is labeled with Tom70-mCherry.
Video 2
3D reconstructed structured illumination microscopy (SIM) images showing FUSP525L split-GFP (spGFP) inside mitochondria after 100 min estradiol treatment.
The mitochondrial outer membrane is labeled with Tom70-mCherry.
Tables
Table 1
List of validated mitochondria as guardian in cytosol (MAGIC) regulators.
Bold: ribosome-associated genes based on KEGG.
| Systematic name | Standard name | MAGIC phenotype |
|---|---|---|
| YDR477W | SNF1 | Class 1 |
| YML016C | PPZ1 | Class 1 |
| YJR120W | Class 1 | |
| YOL055C | THI20 | Class 1 |
| YKL057C | NUP120 | Class 1 |
| YML024W | RPS17A | Class 2 |
| YDR083W | RRP8 | Class 2 |
| YCR002C | CDC10 | Class 2 |
| YKL143W | LTV1 | Class 2 |
| YLL026W | HSP104 | Class 2 |
| YPR159W | KRE6 | Class 2 |
| YOR096W | RPS7A | Class 2 |
| YMR116C | ASC1 | Class 2 |
| YPR057W | BRR1 | Class 2 |
| YJR074W | MOG1 | Class 2 |
| YCR068W | ATG15 | Class 2 |
| YML062C | MFT1 | Class 2 |
| YML026C | RPS18B | Class 2 |
| YML013W | UBX2 | Class 2 |
| YMR032W | HOF1 | Class 2 |
| YNR029C | ZNG1 | Class 2 |
| YDL020C | RPN4 | Class 2 |
| YER151C | UBP3 | Class 2 |
| YMR255W | GFD1 | Class 2 |
| YMR307W | GAS1 | Class 2 |
| YOR035C | SHE4 | Class 2 |
| YOL072W | THP1 | Class 2 |
| YDL083C | RPS16B | Class 2 |
| YOR258W | YOR258W | Class 2 |
| YOL129W | VPS68 | Class 2 |
| YHR163W | SOL3 | Class 2 |
| YLR372W | ELO3 | Class 2 |
| YKL191W | DPH2 | Class 2 |
| YIR032C | DAL3 | Class 2 |
| YBR020W | GAL1 | Class 2 |
| YJR145C | RPS4A | Class 2 |
| YDR085C | AFR1 | Class 2 |
| YGR019W | UGA1 | Class 2 |
| YEL068C | Class 2 | |
| YIL112W | HOS4 | Class 2 |
| YKL198C | PTK1 | Class 2 |
| YER087C-A | Class 2 | |
| YJL200C | ACO2 | Class 2 |
| YJL160C | PIR5 | Class 2 |
| YMR034C | RCH1 | Class 2 |
| YGR132C | PHB1 | Class 2 |
| YLL033W | IRC19 | Class 2 |
| YGR072W | UPF3 | Class 2 |
| YGR016W | Class 2 | |
| YCR071C | IMG2 | Class 2 |
| YER060W | FCY21 | Class 2 |
| YER075C | PTP3 | Class 2 |
| YGR129W | SYF2 | Class 2 |
| YPR146C | Class 2 | |
| YEL012W | UBC8 | Class 2 |
| YJR113C | RSM7 | Class 2 |
| YPL173W | MRPL40 | Class 2 |
| YDL057W | Class 2 | |
| YBR068C | BAP2 | Class 2 |
| YHR200W | RPN10 | Class 2 |
| YOR298C-A | MBF1 | Class 2 |
| YER056C | FCY2 | Class 2 |
| YNL081C | SWS2 | Class 2 |
| YGL114W | YGL114W | Class 2 |
| YAR030C | Class 2 | |
| YLR053C | NRS1 | Class 2 |
| YMR089C | YTA12 | Class 2 |
| YBR058C | UBP14 | Class 2 |
| YBR175W | SWD3 | Class 2 |
| YBR231C | SWC5 | Class 2 |
| YDR073W | SNF11 | Class 2 |
| YDR115W | MRX14 | Class 2 |
| YGR136W | LSB1 | Class 2 |
| YGR159C | NSR1 | Class 2 |
| YHL033C | RPL8A | Class 2 |
| YHR011W | DIA4 | Class 2 |
| YHR143W | DSE2 | Class 2 |
| YCL005W | LDB16 | Class 2 |
| YCL037C | SRO9 | Class 2 |
| YLR131C | ACE2 | Class 2 |
| YMR074C | SDD2 | Class 2 |
| YKL009W | MRT4 | Class 2 |
| YKL128C | PMU1 | Class 2 |
| YKL132C | RMA1 | Class 2 |
| YGR056W | RSC1 | Class 2 |
| YOR125C | CAT5 | Class 2 |
| YAL043C-a | Class 2 | |
| YLL015W | BPT1 | Class 2 |
| YOR235W | IRC13 | Class 2 |
| YJL179W | PFD1 | Class 2 |
| YLR387C | REH1 | Class 2 |
| YLR388W | RPS29A | Class 2 |
| YDR173C | ARG82 | Class 2 |
| YGL197W | MDS3 | Class 2 |
| YGL194C | HOS2 | Class 2 |
| YGL210W | YPT32 | Class 2 |
| YPL049C | DIG1 | Class 2 |
| YGL085W | LCL3 | Class 2 |
| YNL156C | NSG2 | Class 2 |
| YKL213C | DOA1 | Class 2 |
| YKR042W | UTH1 | Class 2 |
| YKR057W | RPS21A | Class 2 |
| YLR065C | SND2 | Class 2 |
| YIL043C | CBR1 | Class 2 |
| YIL049W | DFG10 | Class 2 |
| YIL088C | AVT7 | Class 2 |
| YIL054W | Class 2 | |
| YOL111C | MDY2 | Class 2 |
| YOL122C | SMF1 | Class 2 |
| YER091C | MET6 | Class 2 |
| YNL316C | PHA2 | Class 2 |
| YDL213C | NOP6 | Class 2 |
| YDR006C | SOK1 | Class 2 |
| YDR025W | RPS11A | Class 2 |
| YBR297W | MAL33 | Class 2 |
| YCR025C | Class 2 | |
| YML088W | UFO1 | Class 2 |
| YNL008C | ASI3 | Class 2 |
| YNL010W | PYP1 | Class 2 |
| YNR047W | FPK1 | Class 2 |
| YBR027C | Class 2 | |
| YBR043C | QDR3 | Class 2 |
| YML036W | CGI121 | Class 2 |
| YPL004C | LSP1 | Class 2 |
| YML066C | SMA2 | Class 2 |
| YBR133C | HSL7 | Class 2 |
| YDL002C | NHP10 | Class 2 |
| YBR172C | SMY2 | Class 2 |
| YDL021W | GPM2 | Class 2 |
| YDR462W | MRPL28 | Class 2 |
| YDR500C | RPL37B | Class 2 |
| YGL136C | MRM2 | Class 2 |
| YER174C | GRX4 | Class 2 |
| YER167W | BCK2 | Class 2 |
| YMR221C | FMP42 | Class 2 |
| YIL094C | LYS12 | Class 2 |
| YGR254W | ENO1 | Class 2 |
| YMR257C | PET111 | Class 2 |
| YMR278W | PRM15 | Class 2 |
| YMR291W | TDA1 | Class 2 |
| YMR303C | ADH2 | Class 2 |
| YNL303W | Class 2 | |
| YNL302C | RPS19B | Class 2 |
| YNL265C | IST1 | Class 2 |
| YNL264C | PDR17 | Class 2 |
Table 2
List of yeast strains and plasmids.
| Strain ID | Genotype | Source | |
|---|---|---|---|
| BY4741 | MATa his3Δ1; leu2Δ0; met15Δ0; ura3Δ0 | ||
| RLY8616 | GRX5-GFP11-His3MX6; trp1::PGPD-MTS-mCherry-GFP1-10-natMX6 | Ruan et al., 2017 | |
| RLY8618 | LSG1-GFP11-His3MX6; trp1::PGPD-MTS-mCherry-GFP1-10-natMX6 | Ruan et al., 2017 | |
| RLY9798 | LSG1-GFP11-His3MX6; trp1::PGPD-MTS-mCherry-GFP1-10-natMX6; Δsnf1::kanMX6 | This study | |
| RLY9799 | LSG1-GFP11-His3MX6; trp1::PGPD-MTS-mCherry-GFP1-10-natMX6; Δltv1::kanMX6 | This study | |
| RLY9800 | ura3Δ0::GEM-hphMX6; trp1::PGPD-GRX5-HA-GFP1-10-natMX6; HO::PGAL1-FlucSM-HA-GFP11-His3MX6; TOM70-mCherry-Ura3MX6 | This study | |
| RLY9801 | ura3Δ0::GEM-hphMX6; trp1::PGPD-GRX5-HA-GFP1-10-natMX6; HO::PGAL1-FlucSM-HA-GFP11-His3MX6; TOM70-mCherry-Ura3MX6; Δreg1::Leu2 | This study | |
| RLY9802 | trp1::PGPD-GRX5-HA-GFP1-10-natMX6; amp::GEM-PGAL1-FlucSM-HA-GFP11-kanMX6; TOM70-RFP-hphMX6 | This study | |
| RLY9803 | trp1::PGPD-GRX5-HA-GFP1-10-natMX6; amp::GEM-PGAL1-FlucSM-HA-GFP11-kanMX6; TOM70-mCherry-Ura3MX6 | This study | |
| RLY9804 | trp1::PGPD-GRX5-HA-GFP1-10-natMX6; amp::GEM-PGAL1-FlucWT-HA-GFP11-kanMX6; TOM70-mCherry-Ura3MX6 | This study | |
| RLY9805 | trp1::PGPD-GRX5-HA-GFP1-10-natMX6; amp::GEM-PGAL1-FlucDM-HA-GFP11-kanMX6; TOM70-mCherry-Ura3MX6 | This study | |
| RLY9806 | MIG1-GFP-His3MX6; PUS1-RFP-hphMX6 | This study | |
| RLY9807 | MIG1-GFP-His3MX6; PUS1-RFP-hphMX6; Δreg1::Leu2 | This study | |
| RLY9808 | ura3Δ0::PCUP1-PIM1-Ura3; GRX5-GFP1-10-natMX6; trp1::PGPD-mCherry-Fis1TM-hphMX6; amp::GEM-PGAL1-FlucSM-HA-GFP11-kanMX6 | This study | |
| RLY9809 | ura3Δ0::PCUP1-pim1S974D-Ura3; GRX5-GFP1-10-natMX6; trp1::PGPD-mCherry-Fis1TM-hphMX6; amp::GEM-PGAL1-FlucSM-HA-GFP11-kanMX6 | This study | |
| RLY9810 | trp1::PGPD-MTS-mCherry-natMX6; amp::GEM-PGAL1-FlucSM-HA-GFP11-kanMX6 | This study | |
| RLY9811 | trp1::PGPD-MTS-mCherry-natMX6; amp::GEM-PGAL1-FlucSM-HA-GFP11-kanMX6; Δreg1::His3MX6 | This study | |
| RLY9812 | ura3Δ0::GEM-hphMX6; trp1::PGPD-GRX5-HA-GFP1-10-natMX6; HO::PGAL1-FlucSM-HA-GFP11-His3MX6; TOM70-mCherry-Ura3MX6; Δreg1::Leu2; Δhap4::kanMX6 | This study | |
| RLY9813 | trp1::PGPD-GRX5-HA-GFP1-10-natMX6; amp::GEM-PGAL1-FlucSM-HA-GFP11-kanMX6; TOM70-mCherry-Ura3MX6; HO::PGPD-HAP4-hphMX6 | This study | |
| RLY9814 | ura3Δ0::GEM-hphMX6; trp1::PGPD-GRX5-HA-GFP1-10-natMX6; HO::PGAL1-FlucSM-HA-GFP11-His3MX6; TOM70-mCherry-Ura3MX6; Δatg1::kanMX6 | This study | |
| RLY9815 | ura3Δ0::GEM-hphMX6; trp1::PGPD-GRX5-HA-GFP1-10-natMX6; HO::PGAL1-FlucSM-HA-GFP11-His3MX6; TOM70-mCherry-Ura3MX6; Δatg15::kanMX6 | This study | |
| RLY9816 | ura3Δ0::GEM-hphMX6; trp1::PGPD-GRX5-HA-GFP1-10-natMX6; HO::PGAL1-FlucSM-HA-GFP11-His3MX6; TOM70-mCherry-Ura3MX6; Δmig1::kanMX6 | This study | |
| RLY9817 | ura3Δ0::GEM-hphMX6; trp1::PGPD-GRX5-HA-GFP1-10-natMX6; HO::PGAL1-FlucSM-HA-GFP11-His3MX6; TOM70-mCherry-Ura3MX6; Δmig2::Leu2 | This study | |
| RLY9818 | ura3Δ0::GEM-hphMX6; trp1::PGPD-GRX5-HA-GFP1-10-natMX6; HO::PGAL1-FlucSM-HA-GFP11-His3MX6; TOM70-mCherry-Ura3MX6; Δmig1::kanMX6; Δmig2::Leu2 | This study | |
| RLY9819 | ura3Δ0::GEM-hphMX6; trp1::PGPD-GRX5-HA-GFP1-10-natMX6; HO::PGAL1-FlucSM-HA-GFP11-His3MX6; TOM70-mCherry-Ura3MX6; Δreg1::Leu2; Δcat8::kanMX6 | This study | |
| RLY9820 | ura3Δ0::GEM-hphMX6; trp1::PGPD-GRX5-HA-GFP1-10-natMX6; HO::PGAL1-FlucSM-HA-GFP11-His3MX6; TOM70-mCherry-Ura3MX6; Δreg1::Leu2; Δsip4::kanMX6 | This study | |
| RLY9821 | ura3Δ0::GEM-hphMX6; trp1::PGPD-GRX5-HA-GFP1-10-natMX6; HO::PGAL1-FlucSM-HA-GFP11-His3MX6; TOM70-mCherry-Ura3MX6; Δreg1::Leu2; Δrds2::kanMX6 | This study | |
| RLY9822 | ura3Δ0::GEM-hphMX6; trp1::PGPD-GRX5-HA-GFP1-10-natMX6; HO::PGAL1-FlucSM-HA-GFP11-His3MX6; TOM70-mCherry-Ura3MX6; Δreg1::Leu2; Δadr1::kanMX6 | This study | |
| RLY9823 | trp1::PGPD-GRX5-HA-GFP1-10-natMX6; amp::GEM-PGAL1-FlucSM-HA-GFP11-kanMX6; TOM70-mCherry-Ura3MX6; HO::PGPD-tom20cd-hphMX6 | This study | |
| RLY9824 | trp1::PGPD-GRX5-HA-GFP1-10-natMX6; amp::GEM-PGAL1-FlucSM-HA-GFP11-kanMX6; TOM70-mCherry-Ura3MX6; HO::PGPD-tom22cd-hphMX6 | This study | |
| RLY9825 | ura3Δ0::GEM-hphMX6; trp1::PGPD-GRX5-HA-GFP1-10-natMX6; HO::PGAL1-FlucSM-HA-GFP11-His3MX6; TOM70-mCherry-Ura3MX6; amp::PGPD-tom70cd-3xFLAG-kanMX6 | This study | |
| RLY9826 | ura3Δ0::GEM-hphMX6; trp1::PGPD-GRX5-HA-GFP1-10-natMX6; HO::PGAL1-FlucSM-HA-GFP11-His3MX6; TOM70-mCherry-Ura3MX6; amp::PGPD-tom70cd(Δ98–214)–3xFLAG-kanMX6 | This study | |
| RLY9827 | ura3Δ0::GEM-hphMX6; trp1::PGPD-GRX5-HA-GFP1-10-natMX6; HO::PGAL1-FlucSM-HA-GFP11-His3MX6; TOM70-mCherry-Ura3MX6; amp::PGPD-tom70cd(Δ247–617)–3xFLAG-kanMX6 | This study | |
| RLY9828 | ura3Δ0::GEM-hphMX6; trp1::PGPD-GRX5-HA-GFP1-10-natMX6; HO::PGAL1-FlucSM-HA-GFP11-His3MX6; trp1::PGPD-mCherry-Fis1TM-kanMX6 | This study | |
| RLY9829 | ura3Δ0::GEM-hphMX6; trp1::PGPD-GRX5-HA-GFP1-10-natMX6; HO::PGAL1-FlucSM-HA-GFP11-His3MX6; trp1::PGPD-mCherry-Fis1TM-kanMX6; Δtom70::Ura3MX6 | This study | |
| RLY9830 | ura3Δ0::GEM-hphMX6; trp1::PGPD-GRX5-HA-GFP1-10-natMX6; HO::PGAL1-FlucSM-HA-GFP11-His3MX6; trp1::PGPD-mCherry-Fis1TM-kanMX6; Δtom71::Leu2 | This study | |
| RLY9831 | ura3Δ0::GEM-hphMX6; trp1::PGPD-GRX5-HA-GFP1-10-natMX6; HO::PGAL1-FlucSM-HA-GFP11-His3MX6; trp1::PGPD-mCherry-Fis1TM-kanMX6; Δtom70::Ura3MX6; Δtom71::Leu2 | This study | |
| RLY9832 | ura3Δ0::GEM-hphMX6; trp1::PGPD-GRX5-HA-GFP1-10-natMX6; HO::PGAL1-FlucSM-HA-GFP11-His3MX6; TOM70-mCherry-Ura3MX6; amp::PGPD-tom70cd-3xFLAG-kanMX6; Δtom6::Leu2 | This study | |
| RLY9833 | ura3Δ0::GEM-hphMX6; trp1::PGPD-GRX5-HA-GFP1-10-natMX6; HO::PGAL1-FlucSM-HA-GFP11-His3MX6 | This study | |
| RLY9834 | ura3Δ0::GEM-hphMX6; trp1::PGPD-GRX5-HA-GFP1-10-natMX6; HO::PGAL1-FlucSM-HA-GFP11-His3MX6; amp::PGPD-tom70cd-3xFLAG-kanMX6 | This study | |
| RLY9835 | ura3Δ0::PGPD-a-Synuclein-HA-GFP11-His3MX6; GRX5-GFP1-10-natMX6; TOM70-mCherry-Ura3MX6 | This study | |
| RLY9836 | ura3Δ0::PGPD-a-Synuclein-HA-GFP11-His3MX6; GRX5-GFP1-10-natMX6; TOM70-mCherry-Ura3MX6; Δreg1::Leu2 | This study | |
| RLY9837 | ura3Δ0::PGPD-a-Synuclein-HA-GFP11-His3MX6; GRX5-GFP1-10-natMX6; TOM70-mCherry-Ura3MX6; trp1::PGPD-tom70cd-3xFLAG-kanMX6 | This study | |
| RLY9838 | ura3Δ0::PGPD-a-Synuclein-HA-GFP11-His3MX6; GRX5-GFP1-10-natMX6 | This study | |
| RLY9839 | ura3Δ0::PGPD-a-Synuclein-HA-GFP11-His3MX6; GRX5-GFP1-10-natMX6; trp1::PGPD-tom70cd-3xFLAG-kanMX6 | This study | |
| RLY9840 | trp1::PGPD-GRX5-HA-GFP1-10-natMX6; TOM70-mCherry-Ura3MX6; amp::GEM-PGAL1-FUSP525L-HA-GFP11-kanMX6 | This study | |
| RLY9841 | ura3Δ0::GEM-hphMX6; trp1::PGPD-GRX5-HA-GFP1-10-natMX6; HO::PGAL1-FUSP525L-HA-GFP11-His3MX6; TOM70-mCherry-Ura3MX6 | This study | |
| RLY9842 | ura3Δ0::GEM-hphMX6; trp1::PGPD-GRX5-HA-GFP1-10-natMX6; HO::PGAL1-FUSP525L-HA-GFP11-His3MX6; TOM70-mCherry-Ura3MX6; Δreg1::Leu2 | This study | |
| RLY9843 | ura3Δ0::GEM-hphMX6; trp1::PGPD-GRX5-HA-GFP1-10-natMX6; HO::PGAL1-FUSP525L-HA-GFP11-His3MX6; TOM70-mCherry-Ura3MX6; amp::PGPD-tom70cd-3xFLAG-kanMX6 | This study | |
| RLY9844 | trp1::PGPD-GRX5-HA-GFP1-10-natMX6; amp::GEM-PGAL1-FUSP525L-HA-GFP11-kanMX6 | This study | |
| RLY9845 | trp1::PGPD-GRX5-HA-GFP1-10-natMX6; amp::GEM-PGAL1-FUSP525L-HA-GFP11-kanMX6; trp1::PGPD-tom70cd-3xFLAG-kanMX6 | This study | |
| RLY9846 | ura3Δ0::GEM-hphMX6; trp1::PGPD-GRX5-HA-GFP1-10-natMX6; HO::PGAL1-FlucSM-HA-GFP11-His3MX6; TOM70-mCherry-Ura3MX6; Δpdr5::kanMX6 | This study | |
| RLY9847 | ura3Δ0::GEM-hphMX6; trp1::PGPD-GRX5-HA-GFP1-10-natMX6; HO::PGAL1-FlucSM-HA-GFP11-His3MX6; TOM70-mCherry-Ura3MX6; Δhap4::kanMX6 | This study | |
| Plasmid ID | Construct | Vector type | Source |
| RLB918 | TRP1::PGPD-MTS-mCherry-GFP1-10-natMX6 | Yeast expression | Ruan et al., 2017 |
| RLB919 | TRP1::PGPD-Grx5-HA-GFP1-10-natMX6 | Yeast expression | Ruan et al., 2017 |
| pJW1663 | GEM-PGAL1-GFP-kanMX6 | Yeast expression | Costa et al., 2018 |
| RLB1050 | TRP1::PGPD-mCherry-Fis1TM-KanMX6 | Yeast expression | Ruan et al., 2017 |
| RLB1051 | GEM-PGAL1-FlucSM-HA-GFP11-KanMX6 | Yeast expression | This study |
| RLB1052 | GEM-PGAL1-FlucWT-HA-GFP11-KanMX6 | Yeast expression | This study |
| RLB1053 | GEM-PGAL1-FlucDM-HA-GFP11-KanMX6 | Yeast expression | This study |
| RLB1054 | GEM-PGAL1-FUSP525L-HA-GFP11-KanMX6 | Yeast expression | This study |
| RLB1055 | pRS316-PCUP1-PIM1-Ura3 | Yeast expression | Nitika et al., 2022 |
| RLB1056 | pRS316-PCUP1-pim1S974D-Ura3 | Yeast expression | Nitika et al., 2022 |
| RLB1057 | pRS313-HO(homology)-PGAL1-FlucSM-HA-GFP11-His3MX6-HO(homology) | Yeast expression | This study |
| RLB1058 | pRS313-HO(homology)-PGAL1-FUSP525L-HA-GFP11-His3MX6-HO(homology) | Yeast expression | This study |
| RLB1059 | pRS316-HO(homology)-PGPD-HAP4-hphMX6-HO(homology) | Yeast expression | This study |
| RLB1060 | TRP1::PGPD-tom70cd-3xFLAG-KanMX6 | Yeast expression | This study |
| RLB1061 | TRP1::PGPD-tom70cd(Δ98–214)–3xFLAG-KanMX6 | Yeast expression | This study |
| RLB1062 | TRP1::PGPD-tom70cd(Δ247–617)–3xFLAG-KanMX6 | Yeast expression | This study |
| RLB1063 | pRS316-HO(homology)-PGPD-tom20cd-hphMX6-HO(homology) | Yeast expression | This study |
| RLB1064 | pRS316-HO(homology)-PGPD-tom22cd-hphMX6-HO(homology) | Yeast expression | This study |
| RLB1065 | PGPD-a-Synuclein-HA-GFP11-His3MX6 | Yeast expression | This study |
| RLB1066 | PCMV-FUSP525L-HA-GFP11 | Mammalian expression | Ruan et al., 2017 |
| RLB912 | PCMV-MTS-mCherry-GFP1-10 | Mammalian expression | Ruan et al., 2017 |
| RLB914 | PCMV-FlucDM-HA-GFP11 | Mammalian expression | Ruan et al., 2017 |
| RLB916 | PCMV-GST-HA-GFP11 | Mammalian expression | Ruan et al., 2017 |
Additional files
Download links
A two-part list of links to download the article, or parts of the article, in various formats.
Downloads (link to download the article as PDF)
Open citations (links to open the citations from this article in various online reference manager services)
Cite this article (links to download the citations from this article in formats compatible with various reference manager tools)
Metabolic regulation of misfolded protein import into mitochondria
eLife 12:RP87518.
https://doi.org/10.7554/eLife.87518.3


