An important role for triglyceride in regulating spermatogenesis
- Department of Cellular and Physiological Sciences, Life Sciences Institute, The University of British Columbia, Canada
- Department of Chemistry, The University of British Columbia, Canada
- Department of Biology, Queen’s University, Canada
Figures
Figure 1 with 1 supplement
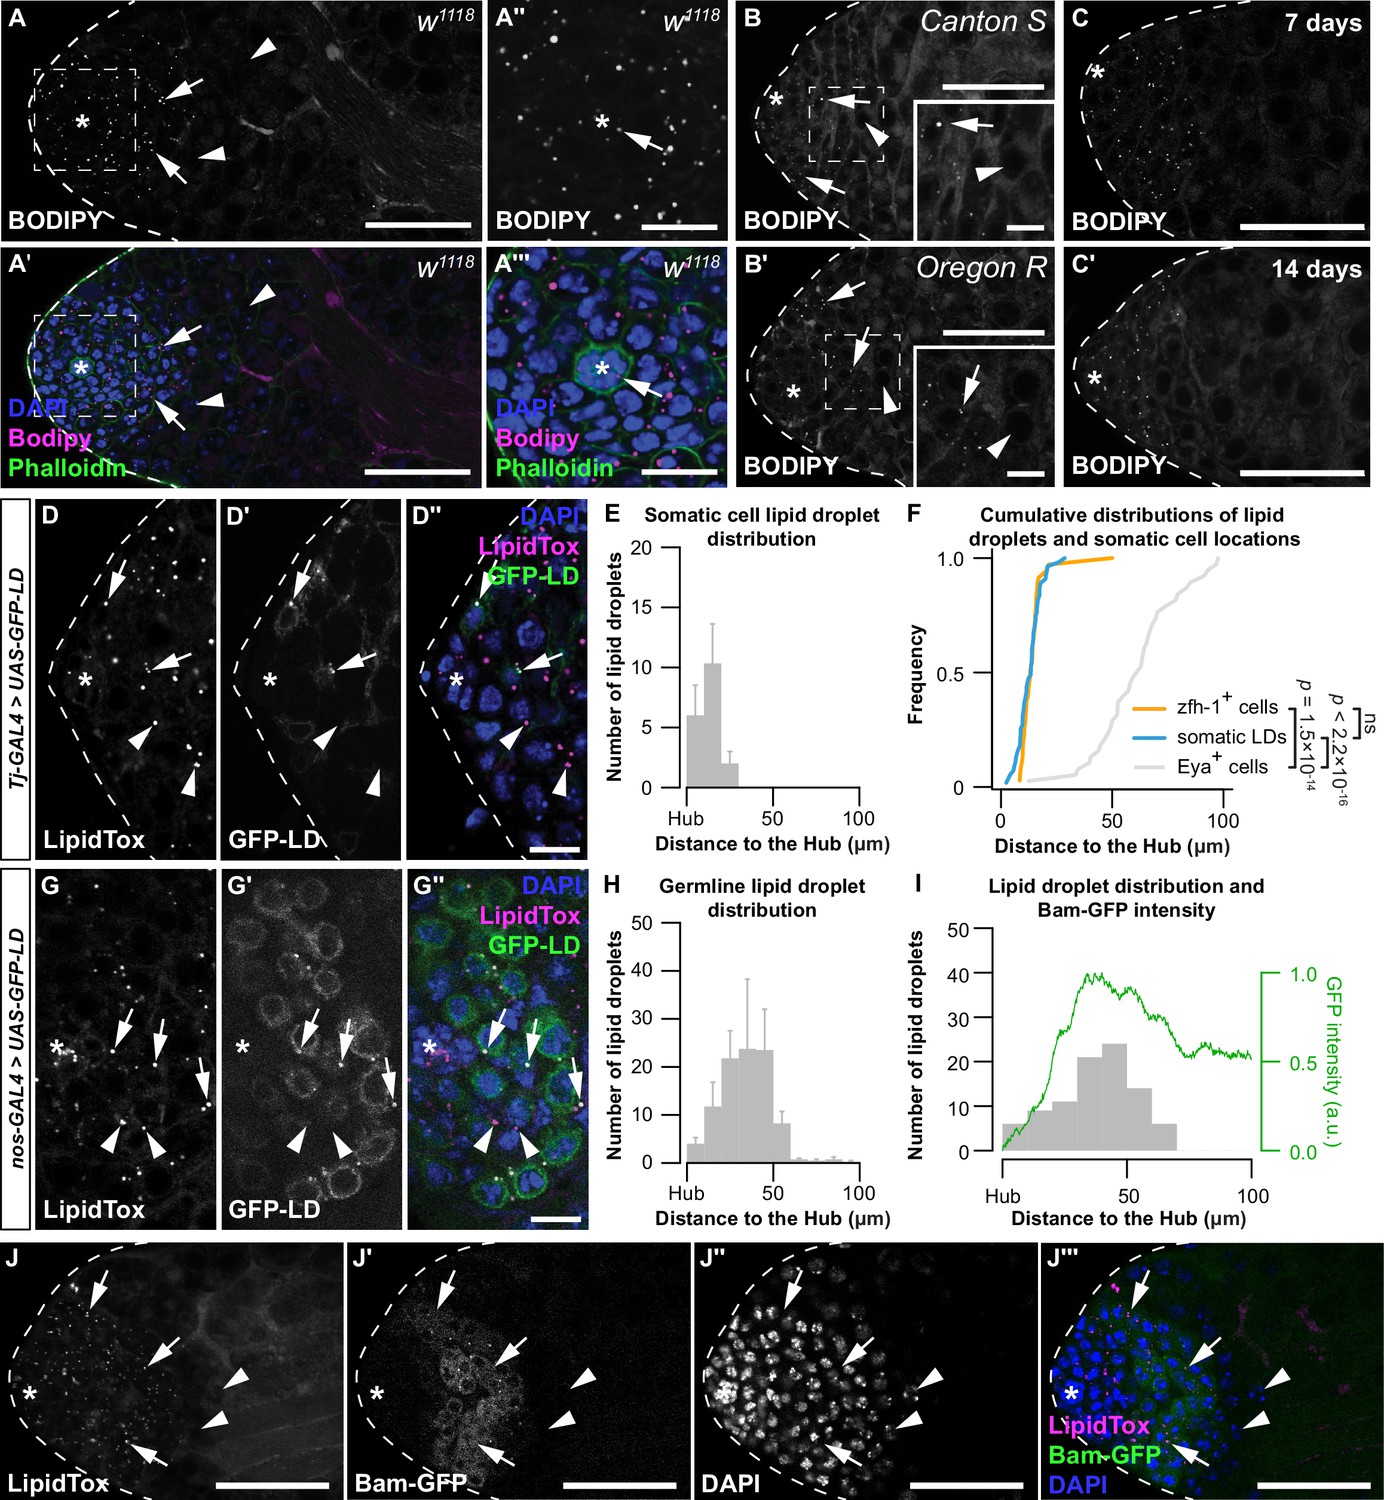
Lipid droplets (LD) are present in early-stage somatic and germ cells.
(A) Testis LD in w1118 animals visualized with neutral lipid dye BODIPY. (A, A') Scale bar = 50 μm; (A'', A''') scale bar = 15 μm. Asterisk indicates hub in all images. Arrows point to LD; arrowheads point to spermatocytes in A, B. Spermatocytes were identified as described in methods section. (B) Testis LD visualized with BODIPY in newly eclosed males from two wild-type genotypes. Scale bars: main image = 50 μm; inset image = 10 μm. (C) Testis LD from w1118 animals at different times post-eclosion. Scale bars = 50 μm. (D) Testis LD visualized with LipidTox Red in animals with somatic cell overexpression of GFP-LD (Tj-GAL4>UAS-GFP-LD). Green fluorescent protein (GFP)- and LipidTox Red-positive punctae are somatic LD (D–D'' arrows); LipidTox punctae without GFP indicate germline LD (D–D'' arrowheads). Scale bars = 10 μm. (E) Histogram showing the spatial distribution of somatic cell LD; error bars represent standard error of the mean (SEM). (F) Cumulative frequency distributions of somatic LD (blue line, data reproduced from E), zfh-1-positive somatic cells (zfh-1+ cells, orange line), and Eya-positive somatic cells (Eya+ cells, gray line). (G) Testis LD visualized with LipidTox Red in males with germline overexpression of GFP-LD (nos-GAL4>UAS-GFP-LD). GFP- and LipidTox Red-positive punctae indicate germline LD (arrows); LipidTox punctae without GFP indicate non-germline LD (arrowheads). Scale bars = 10 μm. (H) Histogram representing the spatial distribution of LD within the germline; error bars represent SEM. (I) Histogram representing the spatial distribution of LD and GFP fluorescence (green line) (arbitrary units, a.u.) in a representative testis of a bam-GFP animal (panel J). (J) Testis LD in a bam-GFP animal; arrows point to LD and arrowheads point to spermatocytes. Scale bar = 50 μm. See also Figure 1—figure supplement 1.
Figure 1—figure supplement 1
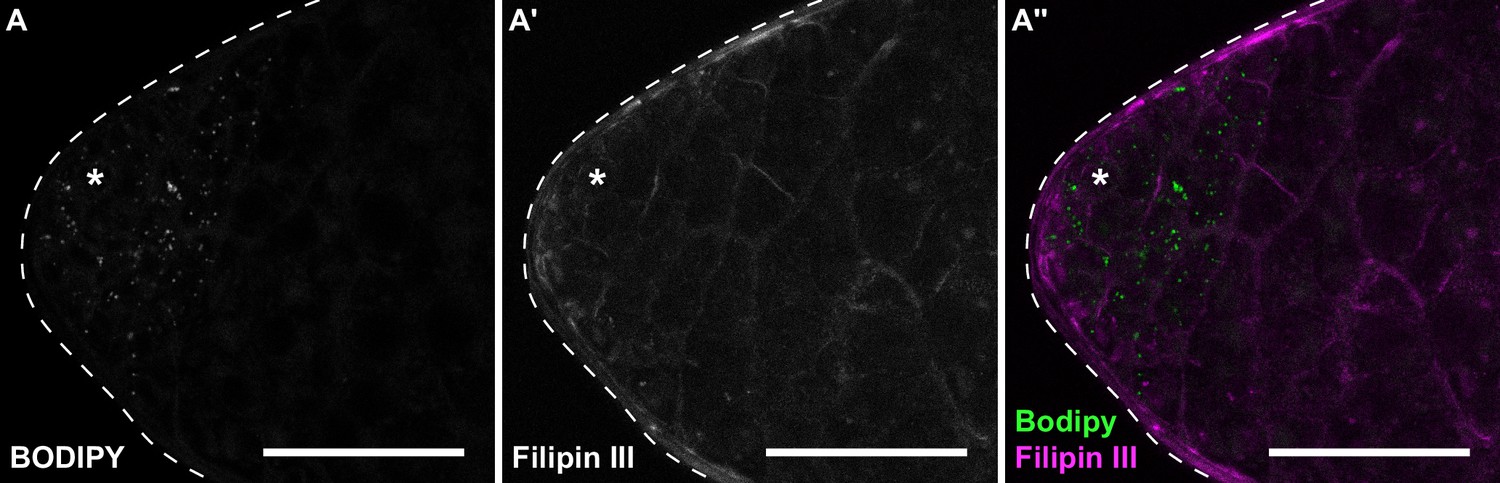
Cholesterol is absent from testis lipid droplets.
(A) Testes stained with BODIPY (A) to detect neutral lipids and Filipin III (A') to detect free cholesterol. Scale bars = 50 μm.
Figure 2 with 2 supplements
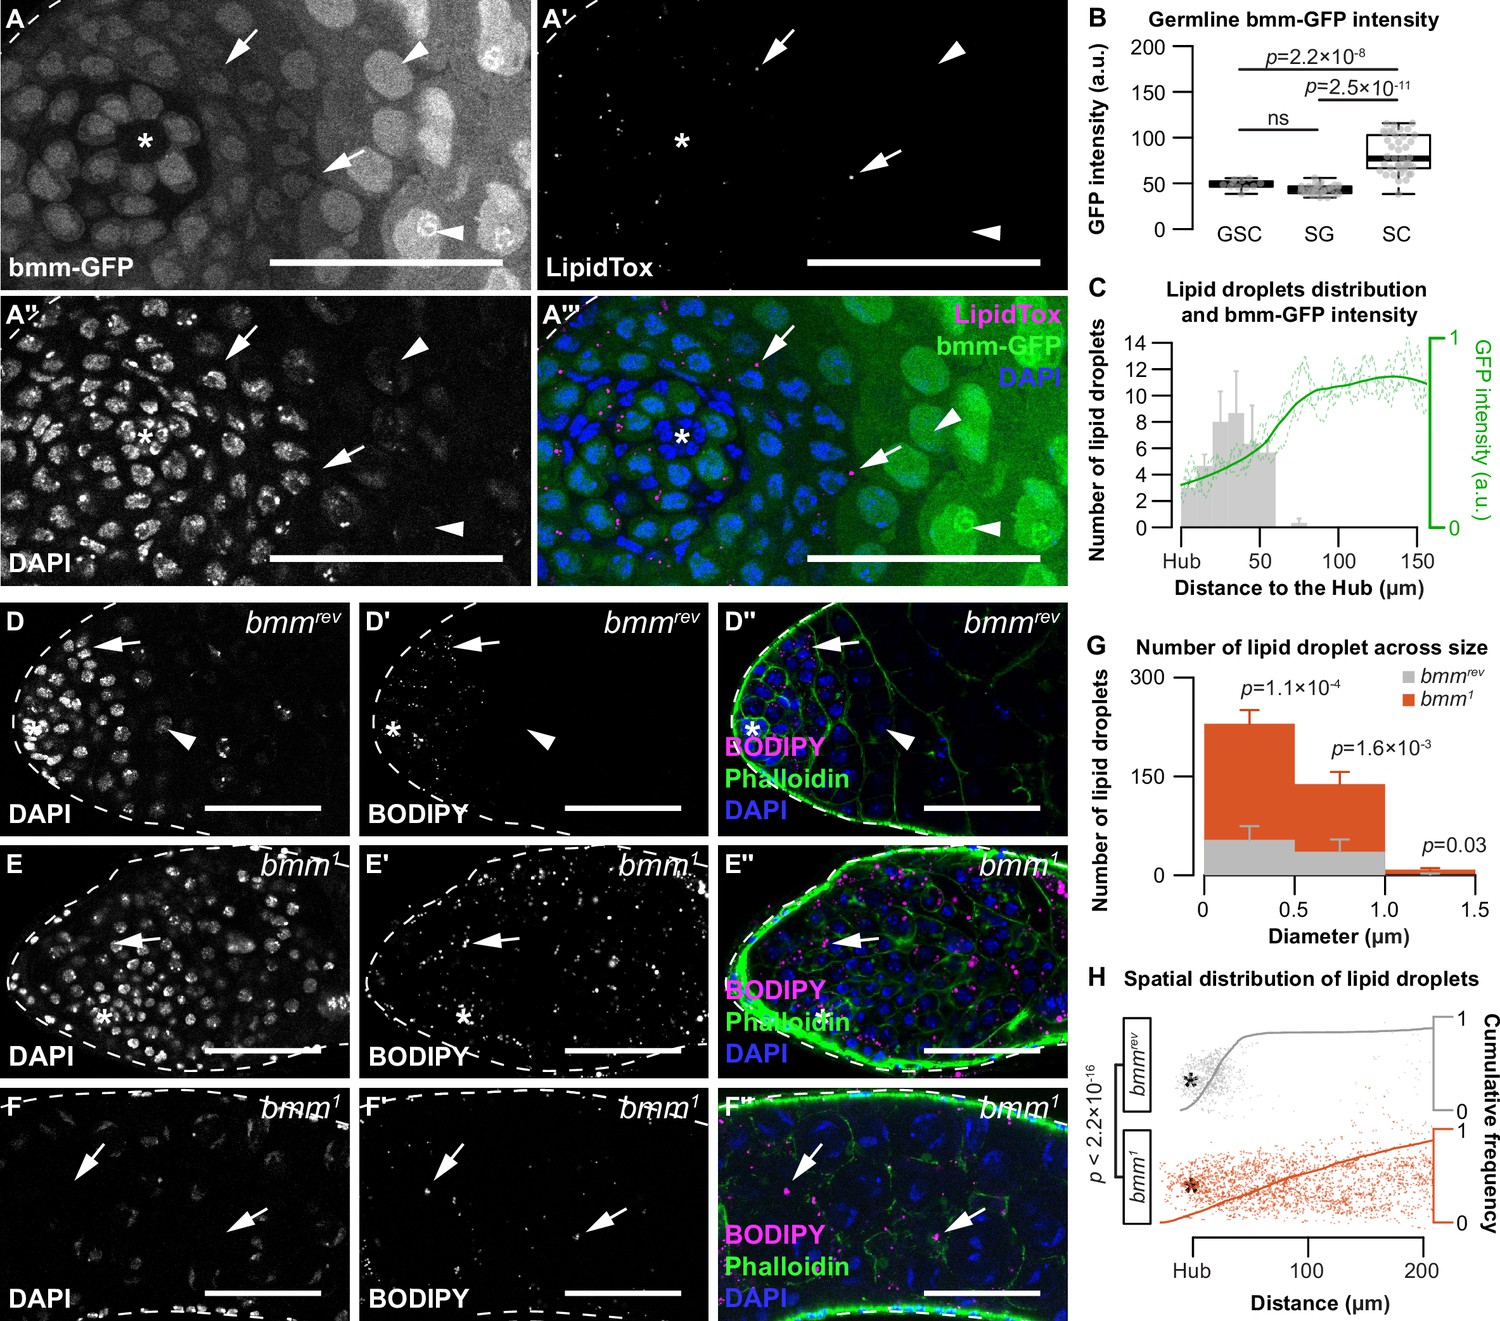
brummer regulates lipid droplets (LD) in both germline and somatic cells of the testis.
(A–A'''') Testis LD indicated by LipidTox Red in bmm-GFP animals. Arrows point to LD in all images. Arrowheads point to spermatocytes. Scale bars = 50 μm. Asterisks indicate the hub in all images. (B) Quantification of nuclear GFP intensity in testes isolated from bmm-GFP animals (n = 3). Germline stem cell (GSC), spermatogonia (SG), spermatocyte (SC). (C) Spatial distribution of LD (gray histogram) and GFP expression (green line) in testes from bmm-GFP animals as a function of distance from the hub (n = 3). LD near the apical region of the testis in bmmrev (D) or bmm1 (E) animals. (F) LD further away from the apical tip in bmm1animals. (D–F) Scale bars = 50 μm. (G) Histogram representing testis LD size distribution in bmmrev (gray) and bmm1 (orange). (B,C,G) Error bars represent standard error of the mean (SEM). (H) Apical tip of the testes is at the left of the graph; individual dots represent a single LD and its relative position to the hub marked by an asterisk. Cumulative frequency distribution of the distance between LD and the apical tip of the testes are drawn as solid lines. See also Figure 2—figure supplement 1 and Figure 2—figure supplement 2.
Figure 2—figure supplement 1
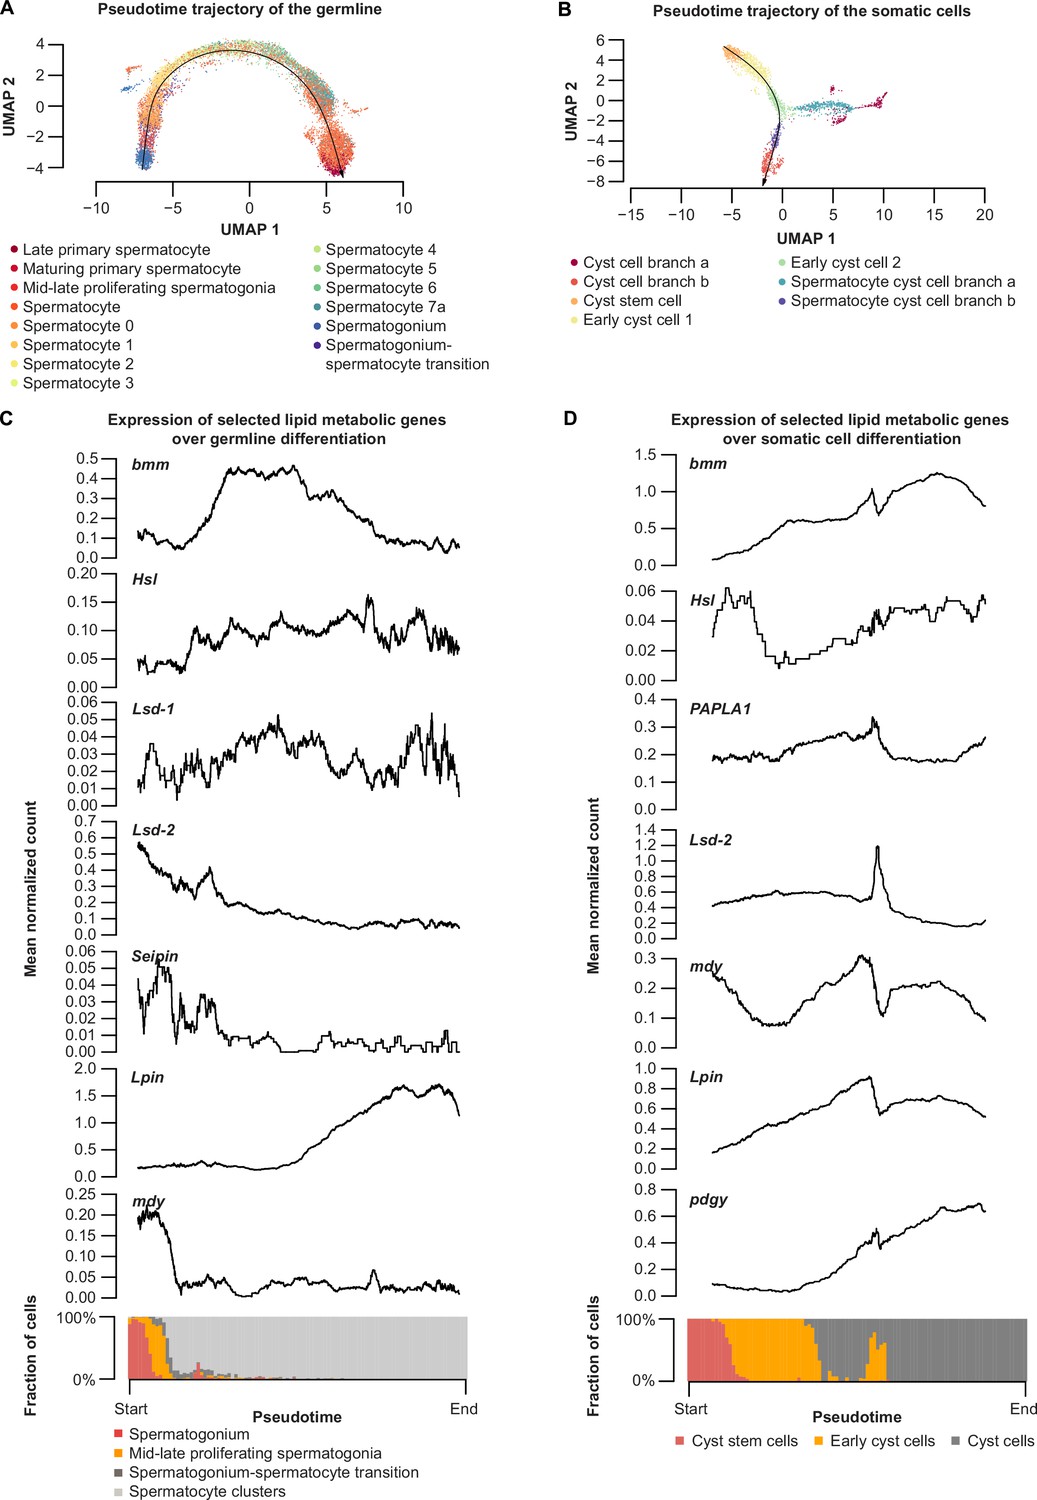
Expression of brummer and selected lipid metabolic genes during spermatogenesis in germline and somatic lineages.
(A) Pseudotime trajectory of germline (black line) based on single-cell RNA sequencing data (Li et al., 2021). Individual cells are labeled according to the annotation within the dataset. (B) Pseudotime trajectory of the somatic cells (black line) based on publicly available single-cell RNA sequencing data (Li et al., 2021). Individual cells are labeled according to the annotation within the dataset. Only one trajectory (branch b) is marked and used for panel D. (C) Rolling average of normalized transcript counts in the germline along the trajectory shown in panel A are plotted as a black line on the upper panel. Composition of cell types mapped on to the trajectory at each time point is shown at the bottom of panel B. (D) Rolling average of normalized transcript counts in somatic cells plotted as a black line along the trajectory shown in C (upper panel). Composition of cell types mapped on to the trajectory at each time point is shown at the bottom of panel D.
Figure 2—figure supplement 2
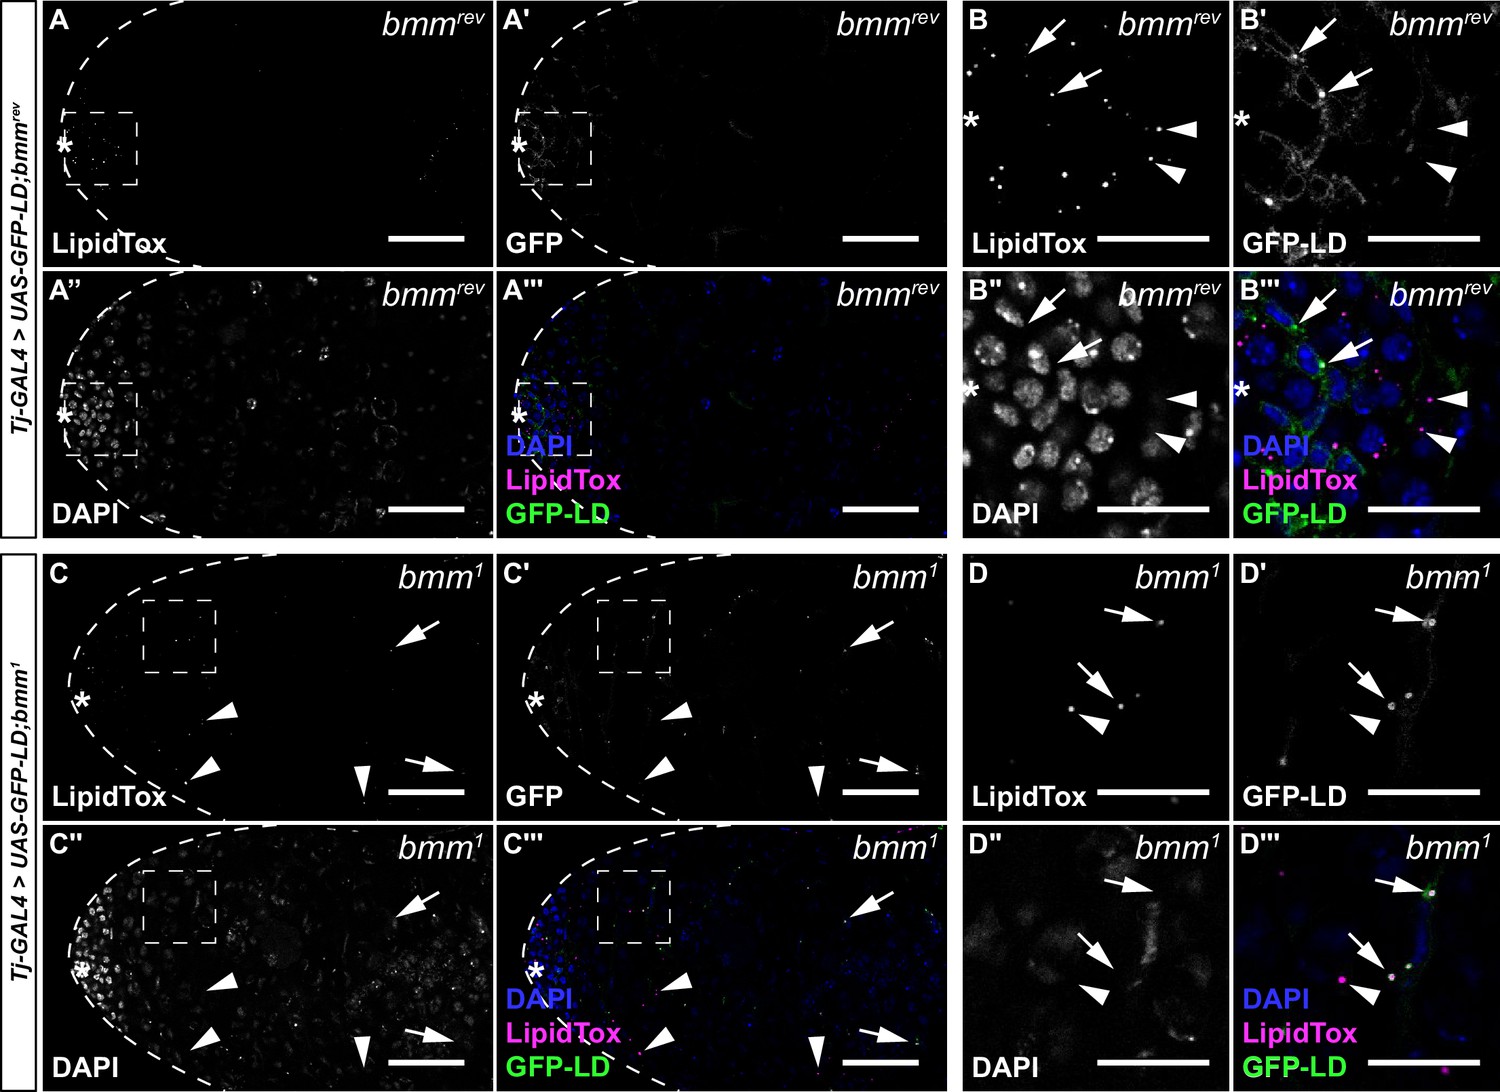
brummer regulates lipid droplets (LD) in both germline and somatic cells of the testis.
Representative images of bmmrev (A and B) and bmm1 (C and D) testes with somatic overexpression of GFP-LD (Tj-GAL4>UAS-GFP-LD). Panels B and D contain magnified images of the area indicated by the boxes in panels A and C, respectively. In bmmrev testes, LD were restricted to a region near the apical tip (A) of the testis in both somatic (B–B''', arrows) and germline cells (B–B''', arrowheads). In bmm1 testes, LD were present in both somatic (C, D, arrows) and germline cells (C, D, arrowheads), near the apical tip of the testis in a region corresponding to early-stage germ cells and in the region corresponding to spermatocytes. (A, C) Scale bars = 50 μm; (B, D) scale bars = 20 μm.
Figure 3
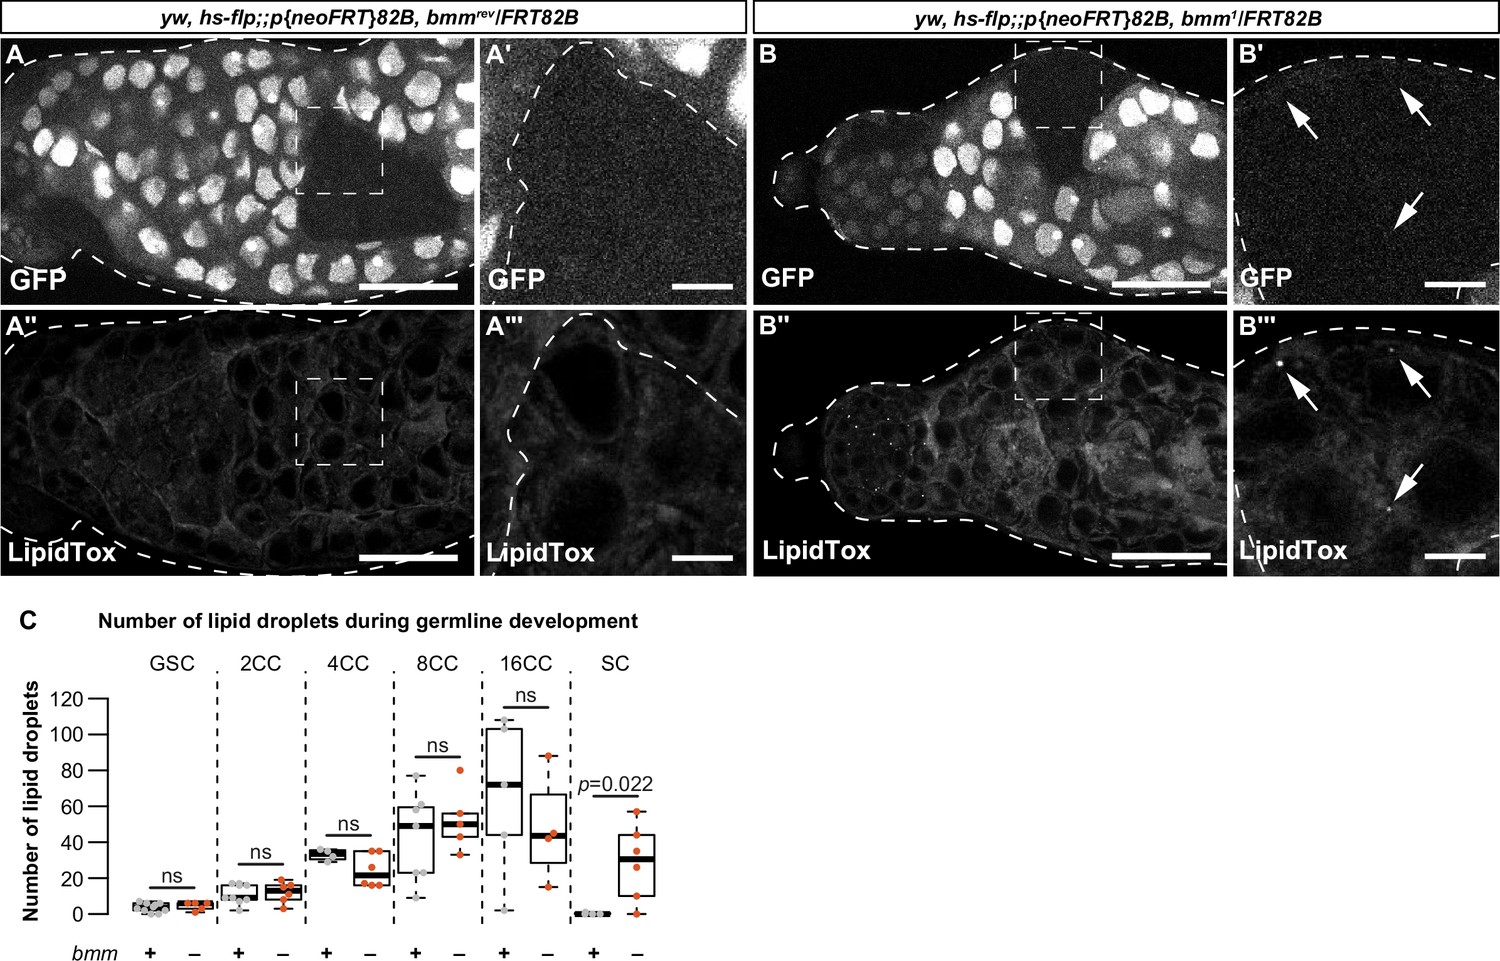
bmm regulates germline lipid droplets (LD) in a cell-autonomous manner.
(A, B) Single confocal slices through a representative testis isolated from an individual carrying clones induced using the FLP-FRT system at 3 days post-clone induction. Clones are homozygous for an allele that encodes a functional bmm protein product (bmmrev; A–A''') or a loss-of-function bmm allele (bmm1, B–B'''). GFP-negative areas mark homozygous clones in panels A and B; the boxed areas in A, A'' and B, B'' are shown in A', A''' and B', B''', respectively. In homozygous bmmrev spermatocyte clones we detected no LD using neutral lipid dye LipidTox (A'', A'''). In contrast, spermatocyte clones homozygous for bmm1 have detectable LD (B'', B''', arrows). Scale bars = 50 μm in A, A'' and B, B''; scale bars = 10 μm in A', A''' and B', B'''. (C) Number of testis LD in bmmrev (gray) or bmm1 (orange) in FLP-FRT clones 3 days post-clone induction; dots represent measurements from a single clone. The number of cells in each cyst (CC) counted is indicated. There were significantly more LD in bmm1 spermatocyte (SC) clones (p = 0.026; Welch two-sample t-test) but not at other stages of development. Error bars represent standard error of the mean (SEM).
Figure 4 with 1 supplement
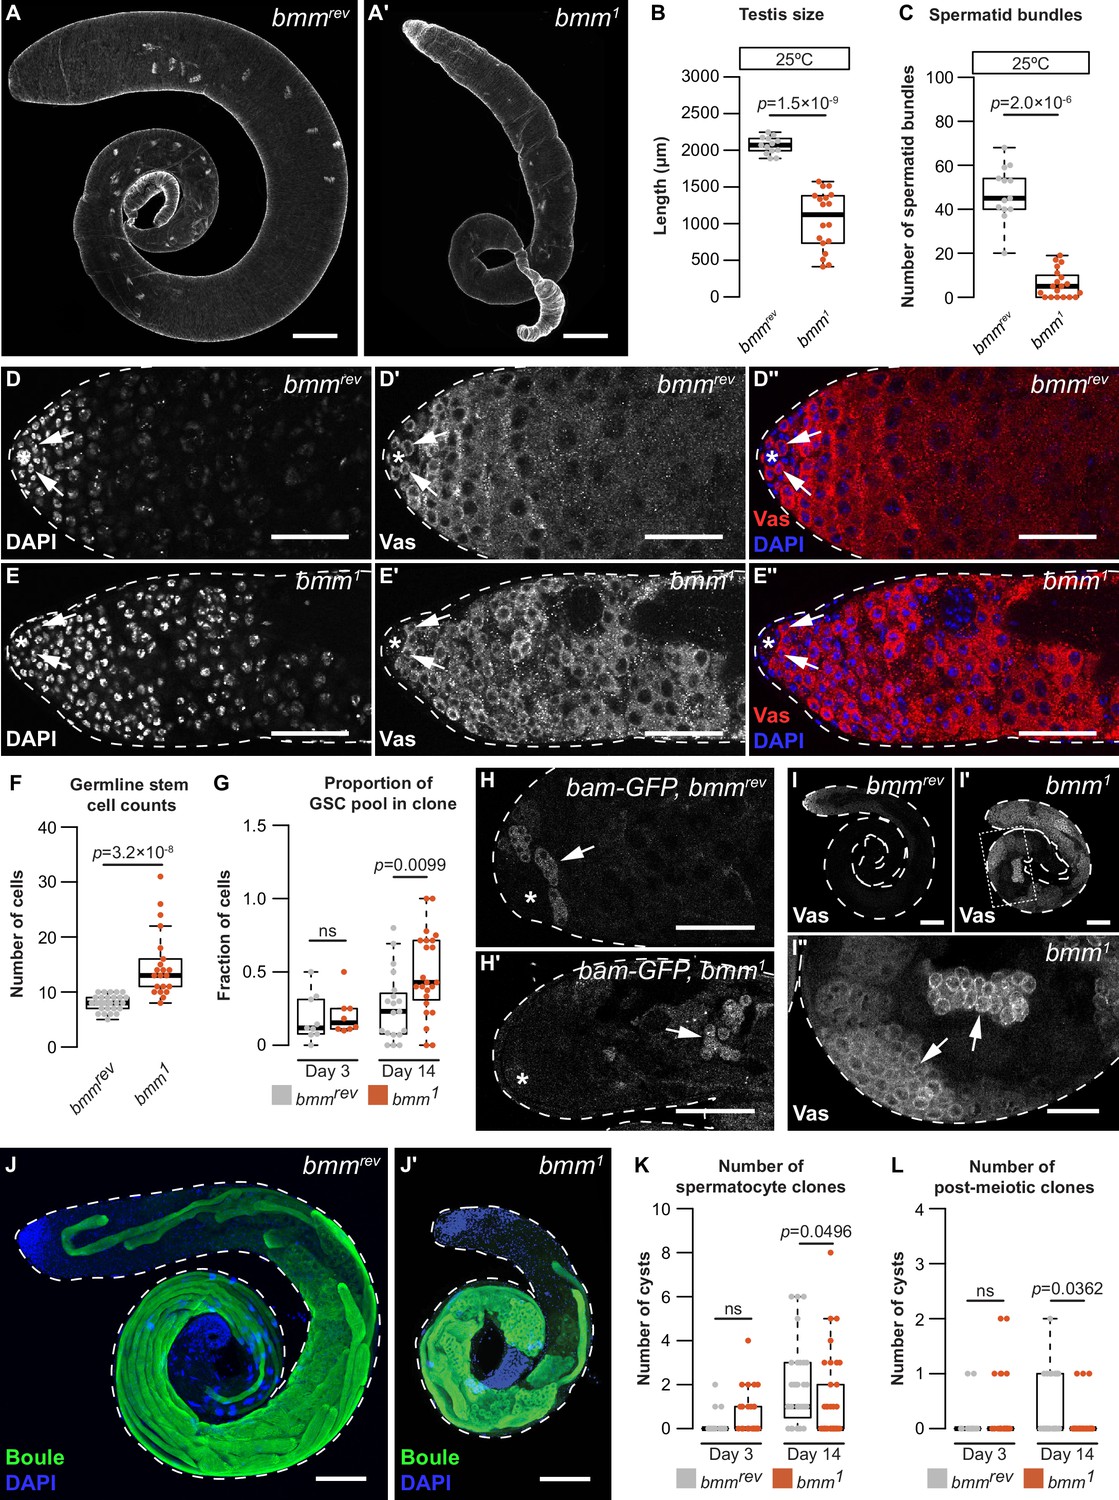
A cell-autonomous role for bmm in regulating spermatogenesis.
Testes isolated from bmmrev (A) and bmm1 (A') animals raised at 25°C stained with phalloidin. Scale bars = 100 μm. (B) Testis size in bmm1 and bmmrev animals raised at 25°C. (C) Spermatid bundle number in bmm1 and bmmrev testes from animals reared at 25°C. Representative images of bmmrev (D) or bmm1 (E) testes stained with 4′,6-diamidino-2-phenylindole (DAPI) and anti-Vasa antibody. Arrows indicate germline stem cells (GSCs). Scale bar = 50 μm. The hub is marked by an asterisk in all images. (F) GSC number in bmm1 and bmmrev testes. (G) Proportion of GSCs that were either bmm1 or bmmrev clones at 3 and 14 days post-clone induction. (H) Representative images of bmmrev (H) and bmm1 (H') testes carrying bam-GFP; data quantified in Figure 4—figure supplement 1J. Arrows indicate regions with high Bam-GFP. Scale bars = 50 μm. (I) Representative images of bmmrev (I) or bmm1 (I', I'') testes stained with anti-Vasa antibody. Arrows indicate Vasa-positive cysts in bmm1 testis. Panel I'' is magnified from the boxed region in I'. (I, I') Scale bars = 100 μm; (I'') scale bar = 50 μm. Maximum projection of bmmrev (J) or bmm1 (J') testes stained with anti-Boule antibody (green) and DAPI (blue). Scale bars = 100 μm. Number of bmm1 and bmmrev spermatocyte clones (K) or post-meiotic clones (L) at 3 and 14 days post-clone induction. (B,C,F,G,K,L) Error bars indicate standard error of the mean (SEM). See also Figure 4—figure supplement 1.
Figure 4—figure supplement 1
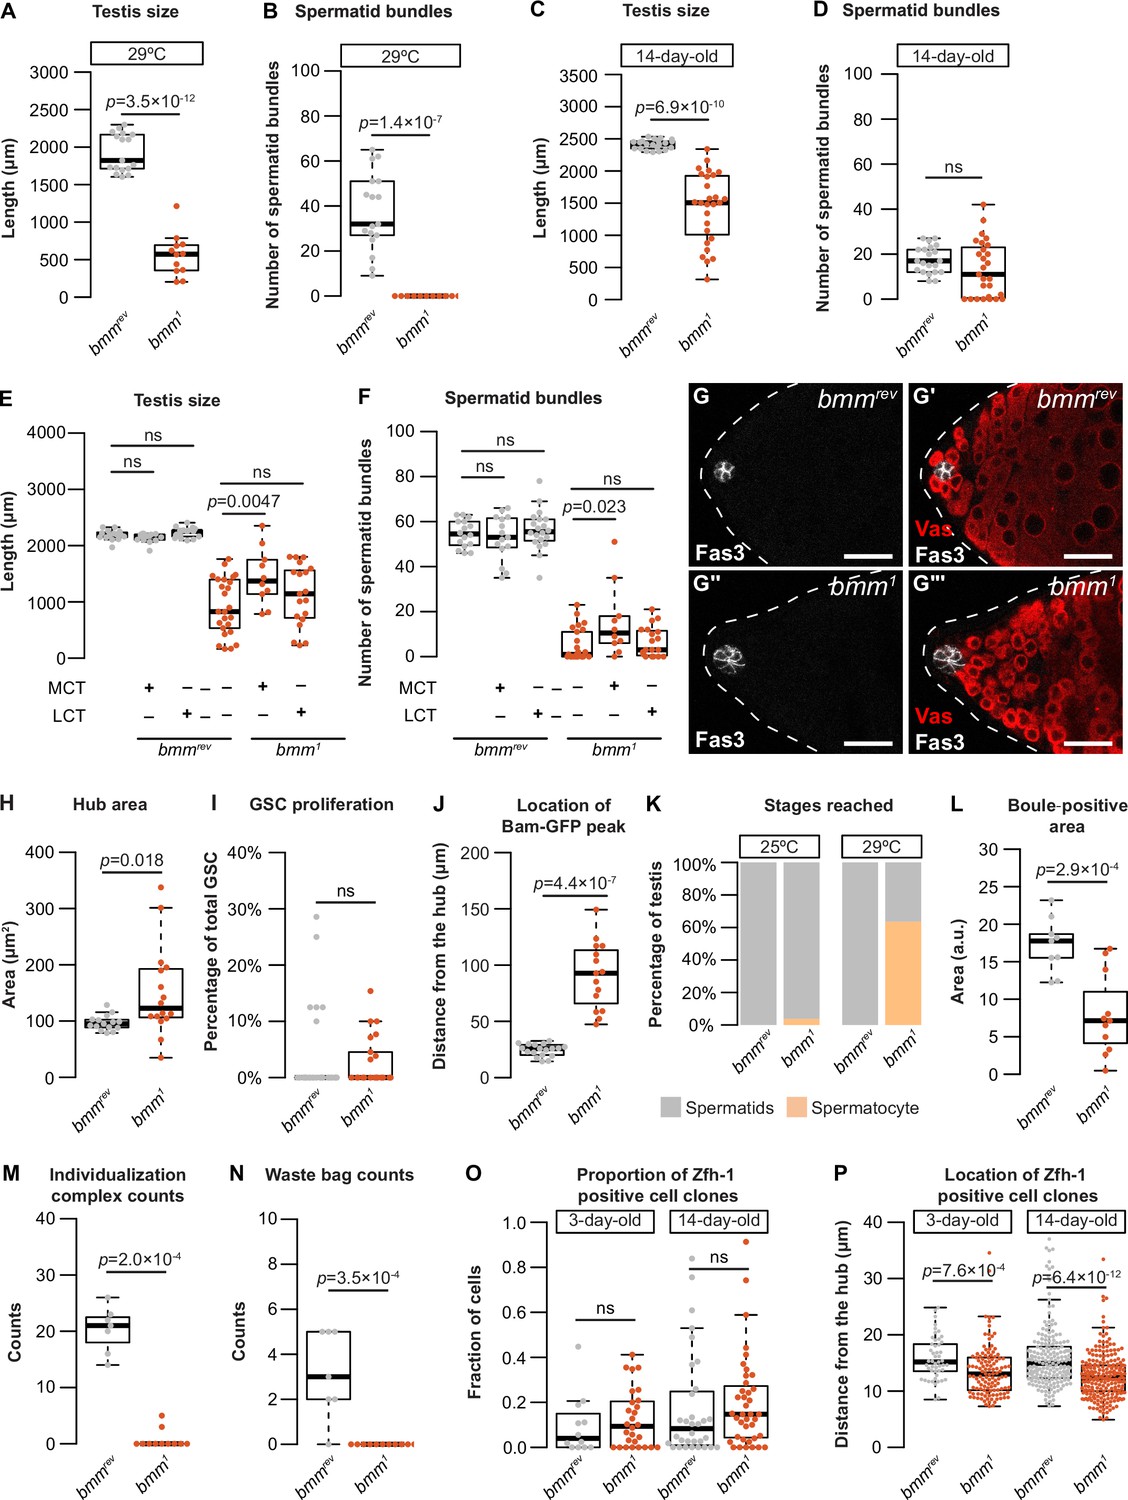
Additional characterization of testis development and spermatogenesis in animals lacking bmm.
(A) Testis size was smaller in bmm1 mutant animals compared with bmmrev controls at <24 hr post-eclosion when raised at 29°C (Welch two-sample t-test). (B) The number of spermatid bundles was significantly lower in bmm1 mutant animals compared with bmmrev controls at <24 hr post-eclosion when raised at 29°C (Kruskal–Wallis rank sum test). (C) Testis size was significantly smaller in bmm1 mutant males compared with bmmrev control males at 14 days post-eclosion (Welch two-sample t-test). (D) While the median number of spermatid bundles was not significantly different between bmm1 mutant males and bmmrev control males at 14 days post-eclosion (Welch two-sample t-test), 8/27 bmm1 testis had no spermatid bundles, a phenotype absent in age-matched bmmrev males (0/22) (p = 0.0163, Pearson’s Chi-squared test), suggesting a subtle defect is present. (E) Food supplemented with 4% medium-chain triglyceride (MCT), but not long-chain triglyceride (LCT), significantly increased testis length in bmm1 animals but had no effect on this phenotype in bmmrev control animals (one-way analysis of variance [ANOVA] with Tukey multiple comparison test). (F) Food supplemented with 4% medium-chain triglyceride significantly increased the number of spermatid bundles in bmm1 testes but had no effect on this phenotype in bmmrev control animals (one-way ANOVA with Tukey multiple comparison test). (G) Representative images of bmmrev (G, G') or bmm1 (G'', G''') testes stained for FasIII (G, G'') and Vas (G', G'''). Scale bars = 25 μm. (H) Quantification of hub area in bmmrev or bmm1 testes showed a significantly larger hub size in bmm1 testes (Welch two-sample t-test). (I) The number of germline stem cells (GSCs) undergoing mitosis (phospho-histone H3+ GSC/total GSC) was not significantly different between bmm1 and bmmrev testes (Kruskal–Wallis rank sum test). (J) The distance between the hub and the first Bam-GFP-positive cyst (Figure 3H) was significantly higher in bmm1 testes than in bmmrev testes (Welch two-sample t-test). (K) All bmmrev testes and most bmm1 testes contained spermatids when raised at 25°C; however, the most advanced stage of spermatogenesis observed in the majority of bmm1 testes isolated from animals reared at 29°C was the spermatocyte stage. (L) Testes isolated from bmm1 animals showed a significantly smaller Boule-positive area than control testes (Welch two-sample t-test). (M) Testes isolated from bmm1 animals contain fewer individualization complexes than bmmrev control testes (Kruskal–Wallis rank sum test). (N) Fewer waste bags were present in testes isolated from bmm1 animals compared with bmmrev control testes (Kruskal–Wallis rank sum test). (O) Proportion of Zfh-1-positive clones that were homozygous for either bmm1 or bmmrev at 3 and 14 days post-clone induction (Kruskal–Wallis rank sum test). (P) The location of Zfh-1-positive clones homozygous for either bmm1 or bmmrev at 3 and 14 days post-clone induction measured as the distance from the center of the hub. Clones homozygous for bmm1 locate significantly closer to the hub than the wild-type clones (Kruskal–Wallis rank sum test). Error bars indicate standard error of the mean (SEM).
Figure 5 with 1 supplement
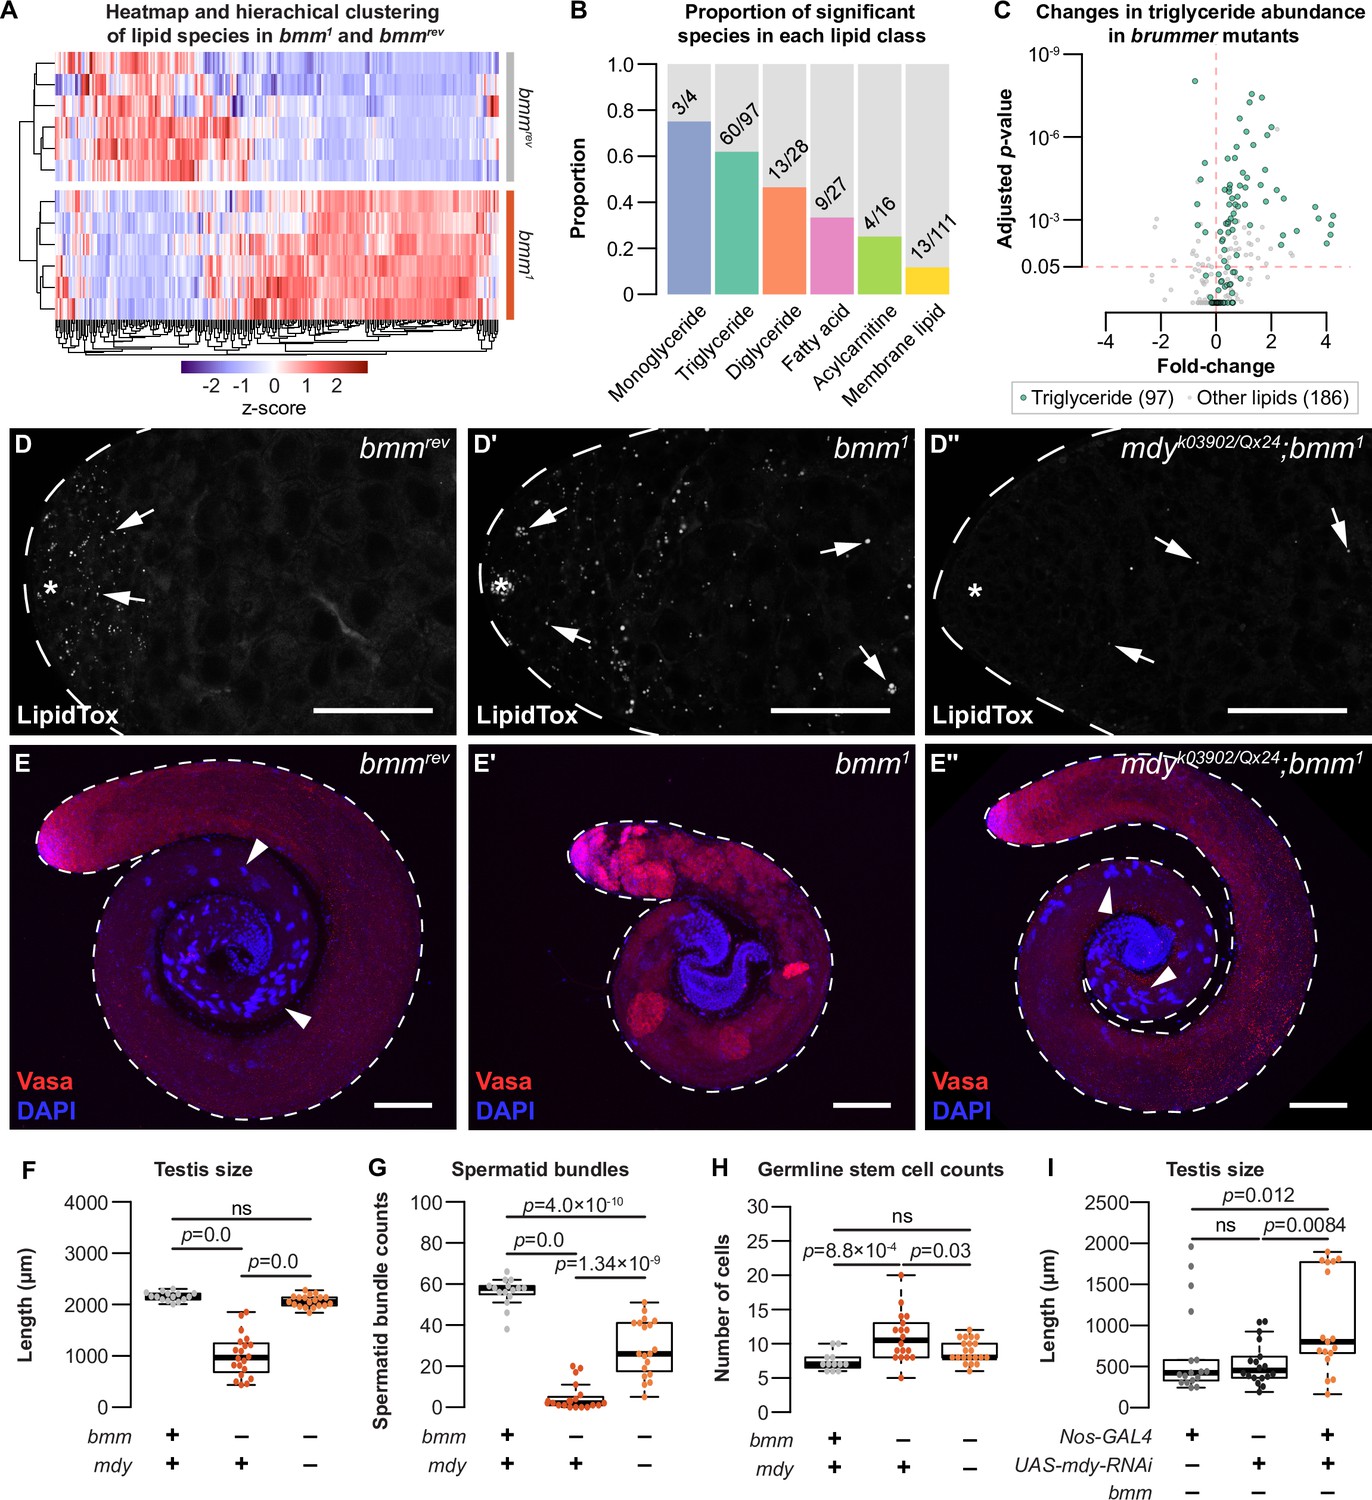
Loss of bmm disrupts triglyceride homeostasis and leads to spermatogenic defects.
(A) Hierarchical clustering of lipid species detected in bmmrev and bmm1 animals. (B) Histograms showing the proportion of significant species in each lipid class with different levels between bmm1 and bmmrev. Numbers on histograms indicate the number of species with differences in abundance. (C) Volcano plot showing fold change in abundance of triglyceride (green; 97 species) and non-triglyceride lipids (gray; 186 species) in our dataset. (D) Arrows indicate testis lipid droplets (LD) stained with LipidTox Red in bmmrev (D), bmm1 (D'), or mdyQX25/k03902; bmm1 (D'') animals. (E) Whole testes isolated from bmmrev (E), bmm1 (E'), or mdyQX25/k03902;bmm1 (E'') animals stained with anti-Vasa antibody (red) and DAPI (blue). Arrowheads indicate spermatid bundles. Scale bars = 100 μm. (F) Testis size in bmmrev, bmm1, and mdyQX25/k03902;bmm1 animals. Spermatid bundles (G) and number of germline stem cells (H) in bmmrev, bmm1, and mdyQX25/k03902;bmm1 animals. (I) Testis size in animals with germline-specific mdy knockdown (nos-GAL4>mdy RNAi; bmm1) compared with controls (nos-GAL4>+; bmm1 and +>mdy RNAi; bmm1). Error bars indicate standard error of the mean (SEM). See also Figure 5—figure supplement 1.
Figure 5—figure supplement 1
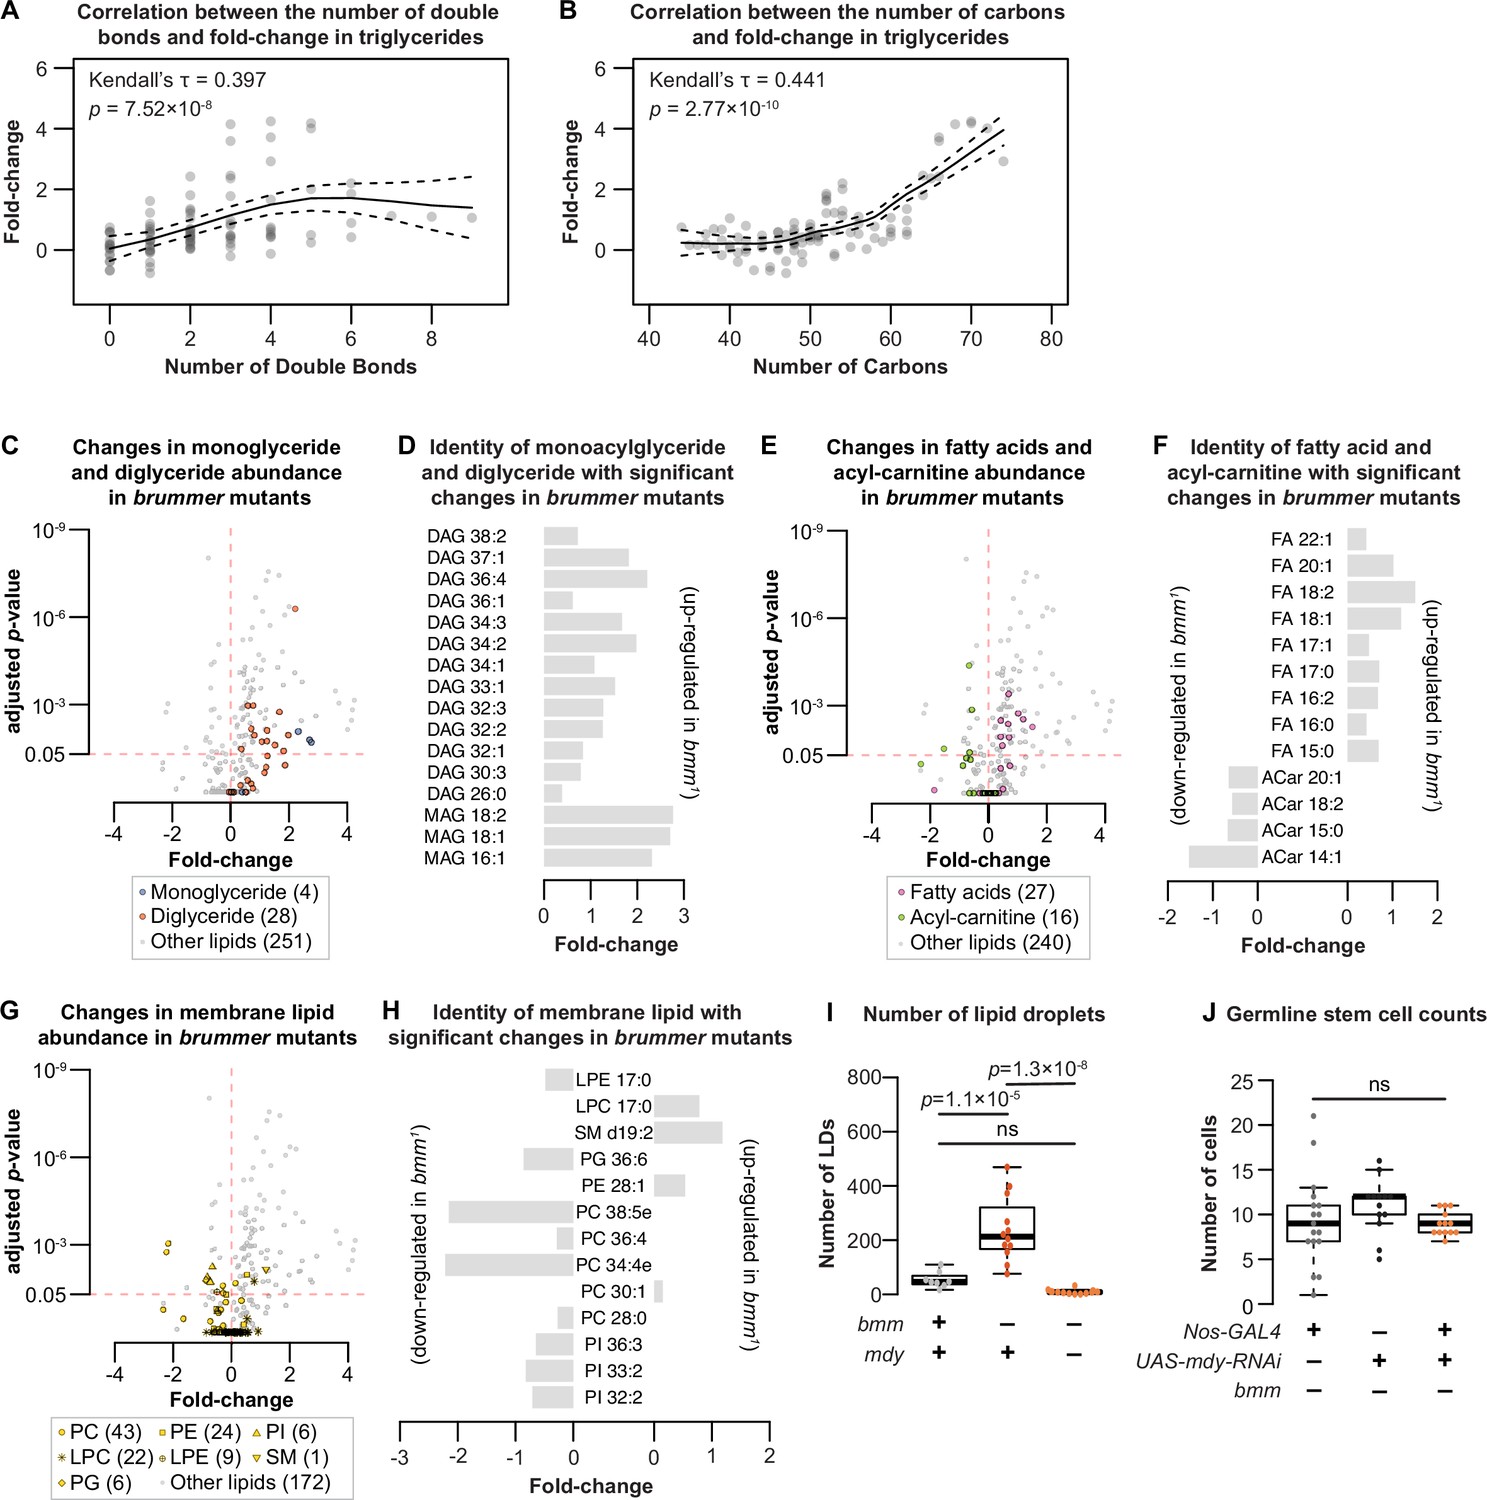
Lipidomic analysis of animals lacking bmm.
(A) Higher fold-changes of triglycerides in bmm1 animals were associated with less saturation in the acyl-groups (Kendall’s rank correlation test). (B) Higher fold-changes of triglycerides in bmm1 animals were associated with higher number of carbons in the acyl-groups (Kendall’s rank correlation test). Each dot represents a single triglyceride species for panels B and C. (C) Volcano plot of identified lipids; monoglycerides shown in blue and diglycerides shown in orange. Many monoglycerides and diglycerides show increase in fold-change in bmm1 males. (D) The number of carbon and the degree of saturation of monoglycerides (MAG) and diglycerides (DAG) with significant changes in abundance between bmm1 and bmmrev males. (E) Volcano plot of identified lipids; fatty acids shown in magenta and acyl-carnitine shown in green. Many fatty acids show an increase in fold-change while many acyl-carnitines show a decrease in fold-change in bmm1 males. (F) The number of carbon and the degree of saturation of fatty acids (FA) and acyl-carnitines (ACar) with significant changes in abundance between bmm1 and bmmrev males. (G) Volcano plot of identified lipids; membrane lipids shown in yellow. (H) The number of carbon and the degree of saturation of membrane lipids with significant changes in abundance between bmm1 and bmmrev males. For panels G and H, PC: phosphatidylcholine; PE: phosphatidylethanolamine; PI: phosphatidylinositol; LPC: lysophosphatidylcholine; LPE: lysophosphatidylethanolamine; SM: sphingomyelin; PG: phosphatidylglycerol. (I) Loss of mdy function rescued the elevated number of lipid droplets (LD) in bmm1 testes to control levels (one-way analysis of variance [ANOVA] with Tukey multiple comparison test). (J) Germline-specific loss of mdy in bmm1 animals did not reduce germline stem cell (GSC) numbers, but the variance in GSC numbers was significantly rescued (nos-GAL4>+; bmm1 vs nos-GAL4>mdy RNAi; bmm1: p = 4.5 × 10⁻⁵;+>mdy RNAi; bmm1 vs nos-GAL4 >mdy RNAi; bmm1: p = 0.0082 by F-test). Error bars indicate standard error of the mean (SEM).
Figure 6

Model of bmm-mediated lipid droplet regulation in the Drosophila testis.
Schematic representation summarizing bmm-mediated lipid droplet regulation in the testis during development.
Tables
Key resources table
| Reagent type (species) or resource | Designation | Source or reference | Identifiers | Additional information |
|---|---|---|---|---|
| Antibody | Anti-Vasa (rabbit, polyclonal) | Gift from Dr. R. Lehman, MIT | IF (1:200) | |
| Antibody | Anti-Eya (mouse monoclonal) | Developmental Studies Hybridoma Bank (DSHB) | eya10H6 | IF (1:50) |
| Antibody | Anti-zfh1 (mouse polyclonal) | Gift from Dr. J. Skeath, WUSTL | IF (1:1000) | |
| Antibody | Anti-boule (rabbit polyclonal) | Gift from Dr. S. Wasserman, UCSD | IF (1:1000) | |
| Antibody | Anti-phospho-histone H3 (mouse monoclonal) | Millipore Sigma | 05-1354 | IF (1:1000) |
| Strain, strain background | w1118 | Bloomington Drosophila stock center | 3605 | 3605 |
| Strain, strain background | CantonS | Bloomington Drosophila stock center | 64349 | 64349 |
| Strain, strain background | OregonR | Bloomington Drosophila stock center | 25211 | 25211 |
| Strain, strain background | bmm1 | Gift from Dr. R. Kühnlein; Grönke et al., 2005 | ||
| Strain, strain background | bmmrev | Gift from Dr. R. Kühnlein; Grönke et al., 2005 | ||
| Strain, strain background (Drosophila melanogaster) | mdy[Qx25], cn[1], bw[1]/CyO, I(2)DTS513[1] | Bloomington Drosophila stock center | 5095 | 5095 |
| Strain, strain background (Drosophila melanogaster) | y[1],w[67c23];P{lacW}Cse1[k03802],mdy[k03902]/CyO | Bloomington Drosophila stock center | 10536 | 10536 |
| Strain, strain background (Drosophila melanogaster) | w[1118];P{GD1749}v6367 (UAS-mdy-RNAi) | Vienna Drosophila resource center | 6367 | 6367 |
| Strain, strain background (Drosophila melanogaster) | nos-GAL4::VP16 | Bloomington Drosophila stock center | 7303 | 7303 |
| Strain, strain background (Drosophila melanogaster) | Tj-GAL4 | Gift from Dr. D. Godt, University of Toronto | ||
| Strain, strain background (Drosophila melanogaster) | c587-GAL4 | Bloomington Drosophila stock center | 67747 | 67747 |
| Strain, strain background (Drosophila melanogaster) | Bam-GFP | Chen and McKearin, 2003 | ||
| Strain, strain background (Drosophila melanogaster) | bmm-GFP | Gift from Dr. K. Kamei; Men et al., 2016 | ||
| Strain, strain background (Drosophila melanogaster) | GFP-LD | Gift from Dr. M. Welte; Yu et al., 2011 | ||
| Strain, strain background (Drosophila melanogaster) | P{neoFRT}82B, bmm[1] | This study | Flies available from E. Rideout, made as in ‘Fly Husbandry’ | |
| Strain, strain background (Drosophila melanogaster) | P{neoFRT}82B, bmm[rev] | This study | Flies available from E. Rideout, made as in ‘Fly Husbandry’ | |
| Strain, strain background (Drosophila melanogaster) | bam-GFP, bmm[1] | This study | Flies available from E. Rideout, made as in ‘Fly Husbandry’ | |
| Strain, strain background (Drosophila melanogaster) | bam-GFP, bmm[rev] | This study | Flies available from E. Rideout, made as in ‘Fly Husbandry’ | |
| Software, algorithm | Fiji | https://imagej.net/software/fiji/ | ||
| Software, algorithm | R | https://cran.r-project.org |
Additional files
-
Supplementary file 1
Raw data and statistical outputs from Figure 1.
- https://cdn.elifesciences.org/articles/87523/elife-87523-supp1-v1.xlsx
-
Supplementary file 2
- https://cdn.elifesciences.org/articles/87523/elife-87523-supp2-v1.xlsx
-
Supplementary file 3
Raw data and statistical outputs from Figure 4.
- https://cdn.elifesciences.org/articles/87523/elife-87523-supp3-v1.xlsx
-
Supplementary file 4
Raw data and statistical outputs from Figure 5.
- https://cdn.elifesciences.org/articles/87523/elife-87523-supp4-v1.xlsx
-
Supplementary file 5
Identified lipid species from untargeted lipidomic analysis.
- https://cdn.elifesciences.org/articles/87523/elife-87523-supp5-v1.csv
-
MDAR checklist
- https://cdn.elifesciences.org/articles/87523/elife-87523-mdarchecklist1-v1.docx
Download links
A two-part list of links to download the article, or parts of the article, in various formats.
Downloads (link to download the article as PDF)
Open citations (links to open the citations from this article in various online reference manager services)
Cite this article (links to download the citations from this article in formats compatible with various reference manager tools)
An important role for triglyceride in regulating spermatogenesis
eLife 12:RP87523.
https://doi.org/10.7554/eLife.87523.4


