Therapeutic doses of ketamine acutely attenuate the aversive effect of losses during decision-making
- Department of Neuroscience, Yale School of Medicine, United States
- Department of Psychiatry and Neuroscience, Yale School of Medicine, United States
Figures
Figure 1 with 1 supplement
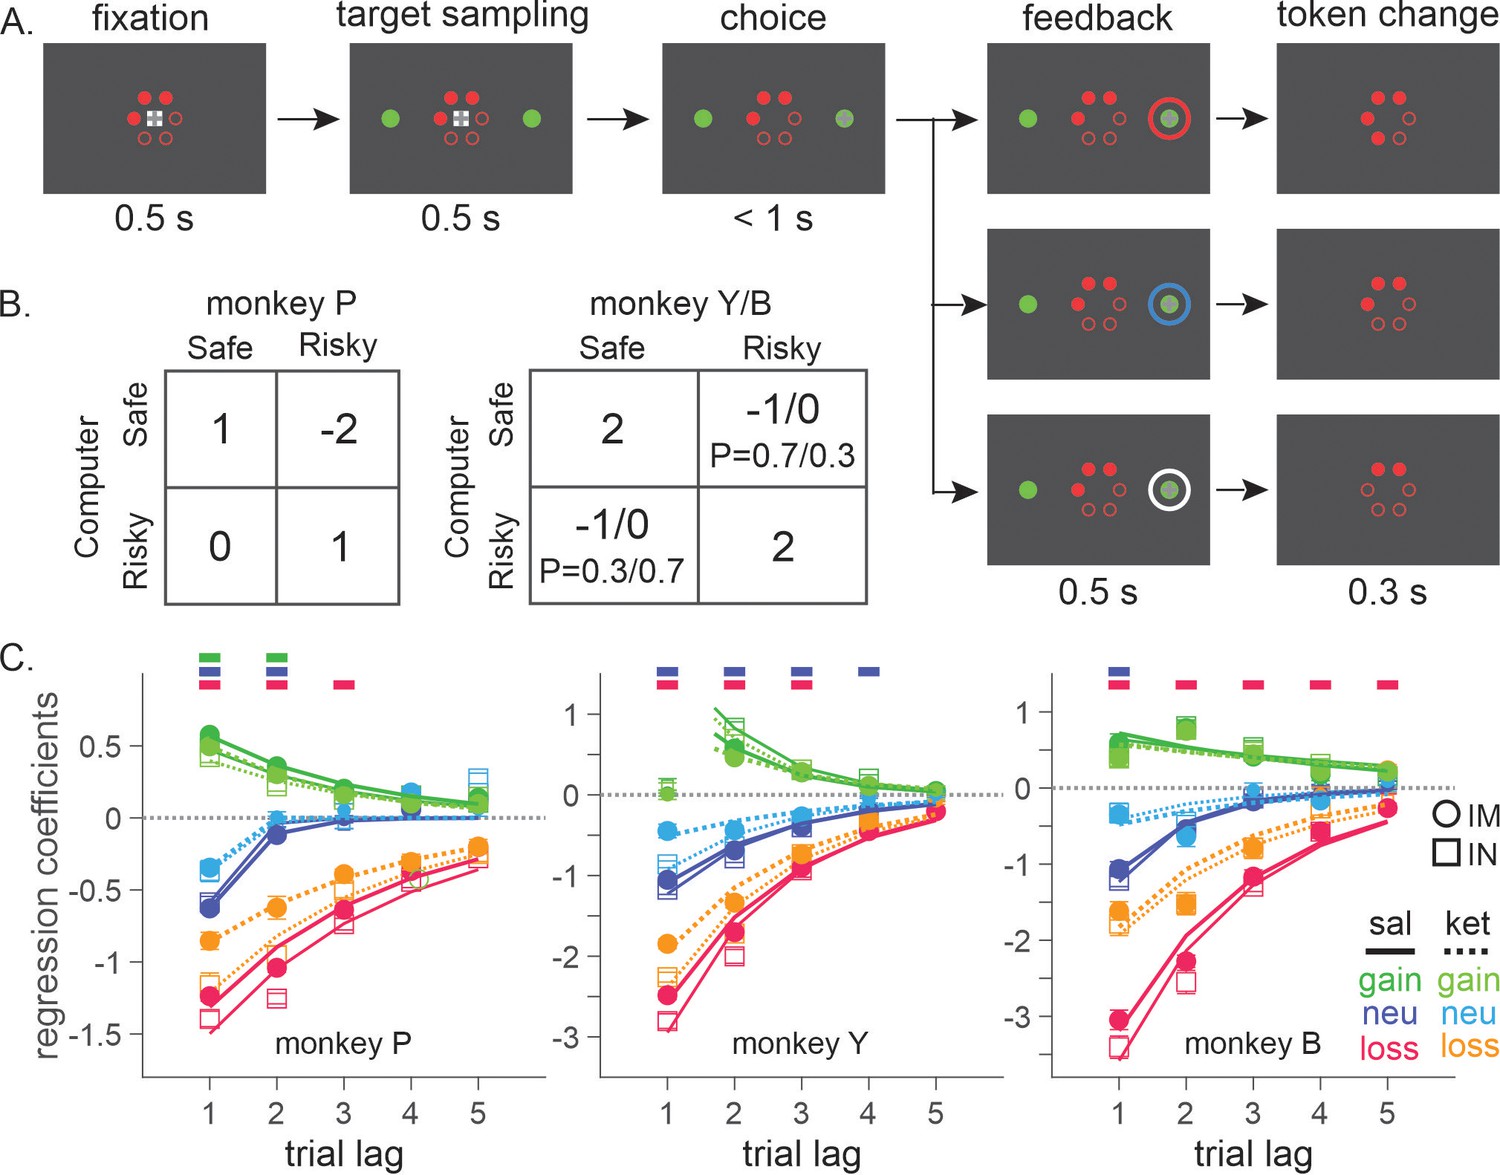
Biased matching pennies (BMP) task and ketamine-induced behavioral modulation.
(A) Temporal sequence of trial events. Gray cross indicates the target that the animal was required to fixate during each epoch. Each trial began with the animal’s gaze on the fixation target displayed on the center of a computer monitor for 0.5 s. Solid red disks around the fixation target indicated the tokens owned by the animal, namely asset, with empty disks serving as placeholders for the tokens to be acquired for exchange with juice reward. After two green disks were displayed for 0.5 s at the diametrically opposed positions along the horizontal meridian, the fixation target was extinguished signaling the animal to indicate its choice by shifting gaze to one of the two green disks. After 0.5 s of fixation, a feedback ring appeared around the chosen target with its color indicating the choice outcome, followed by the corresponding change in tokens. Once the animal collected six tokens, they were automatically exchanged with six drops of apple juice. After juice reward, the animal began the subsequent trial with two to four free tokens. Tokens and placeholders stayed on the screen throughout the trial and inter-trial interval. (B) Payoff matrix of BMP. (C) Coefficients from logistic regression models applied separately to the data from saline (sal) and ketamine (ket) sessions with intramuscular (IM, filled symbols) and intranasal (IN, empty symbols) administration. Standard errors are shown as horizontal bars above/below each coefficient. Lines are exponential functions best fit to the coefficients from saline (solid) and ketamine (dotted) sessions, and those from IM (thick) and IN (thin) sessions. Bars at the top of each panel indicate that the difference between saline and ketamine sessions is statistically significant with the horizontal position and color of each bar coding trial lag and outcome (same color scheme as that of saline sessions), respectively (independent sample t-test, p < 0.05; IM and IN sessions were combined). For IM sessions, N=52 (Sal) and 17 (Ket) for monkey P; N=49 (Sal) and 15 (Ket) for monkey Y; N=25 (Sal) and 9 (Ket) for monkey B. For IN sessions, N=23 (Sal) and 13 (Ket) for monkey P; N=16 (Sal) and 10 (Ket) for monkey Y; N=19 (Sal) and 8 (Ket) for monkey B.
-
Figure 1—source data 1
Means and standard errors of regression coefficients, and best-fit parameters of exponential functions.
- https://cdn.elifesciences.org/articles/87529/elife-87529-fig1-data1-v1.xlsx
Figure 1—figure supplement 1
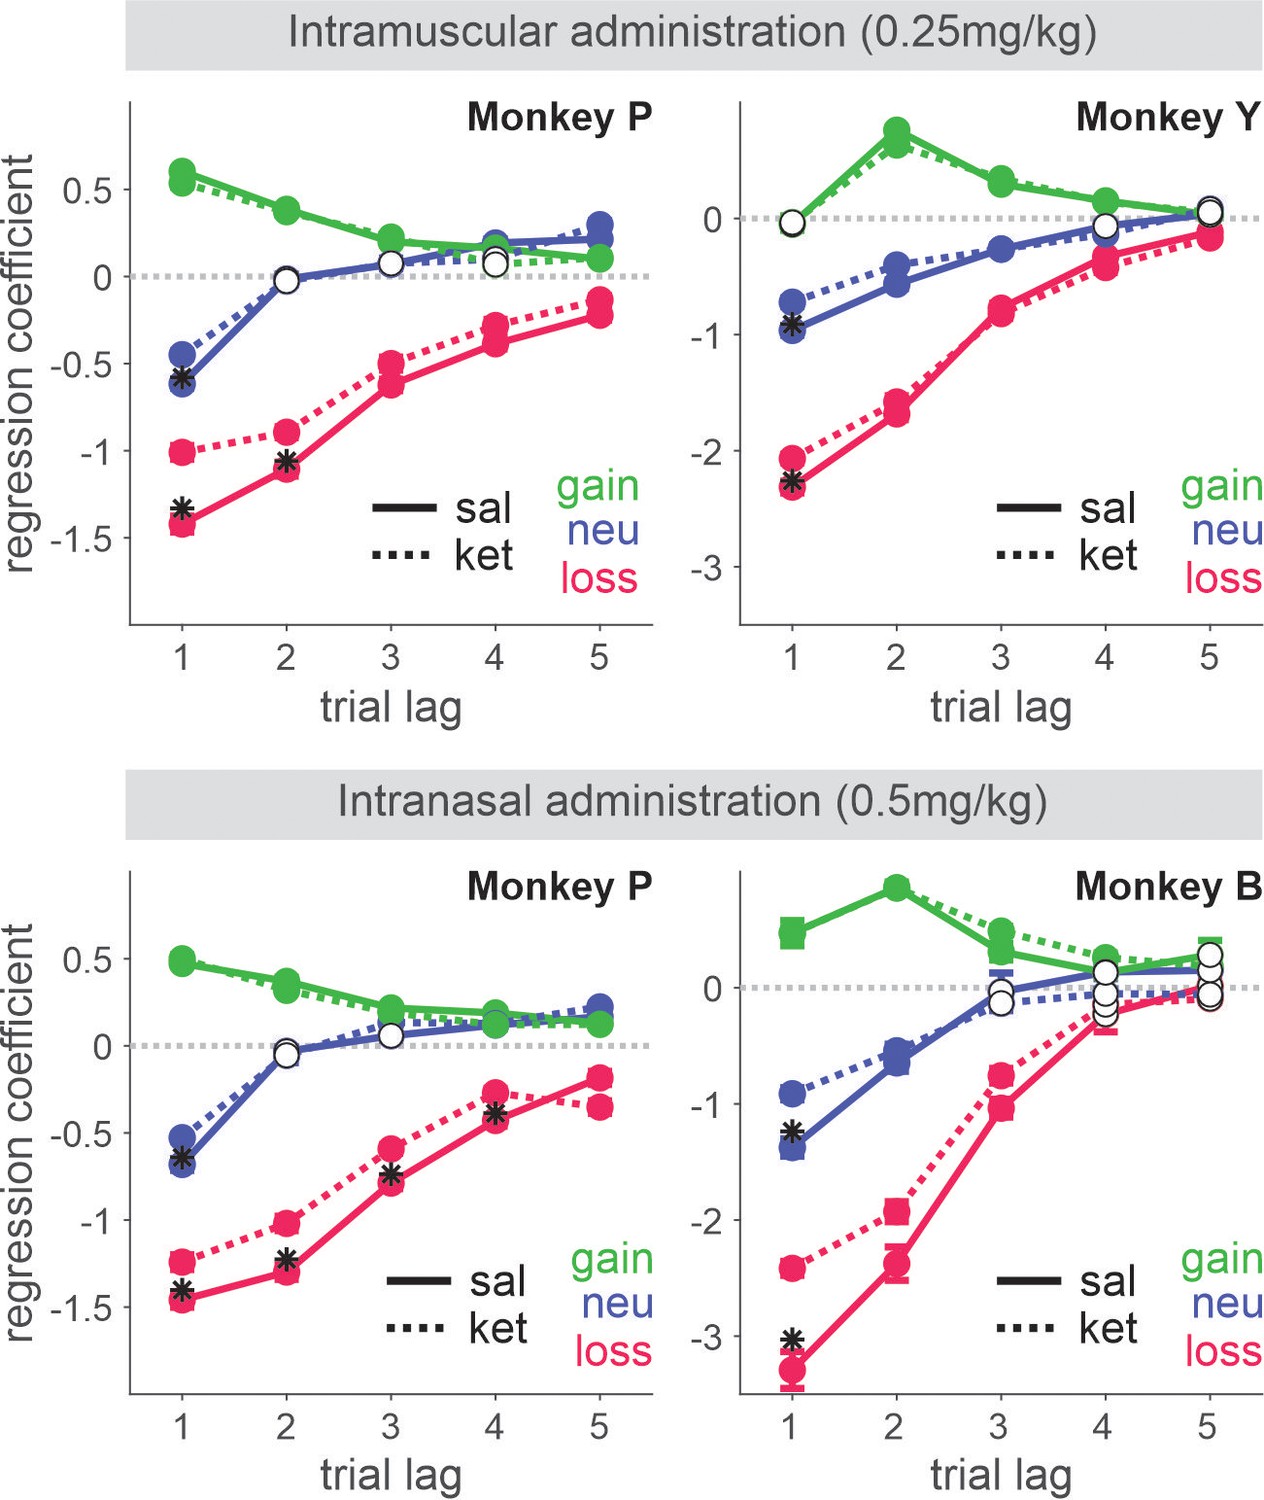
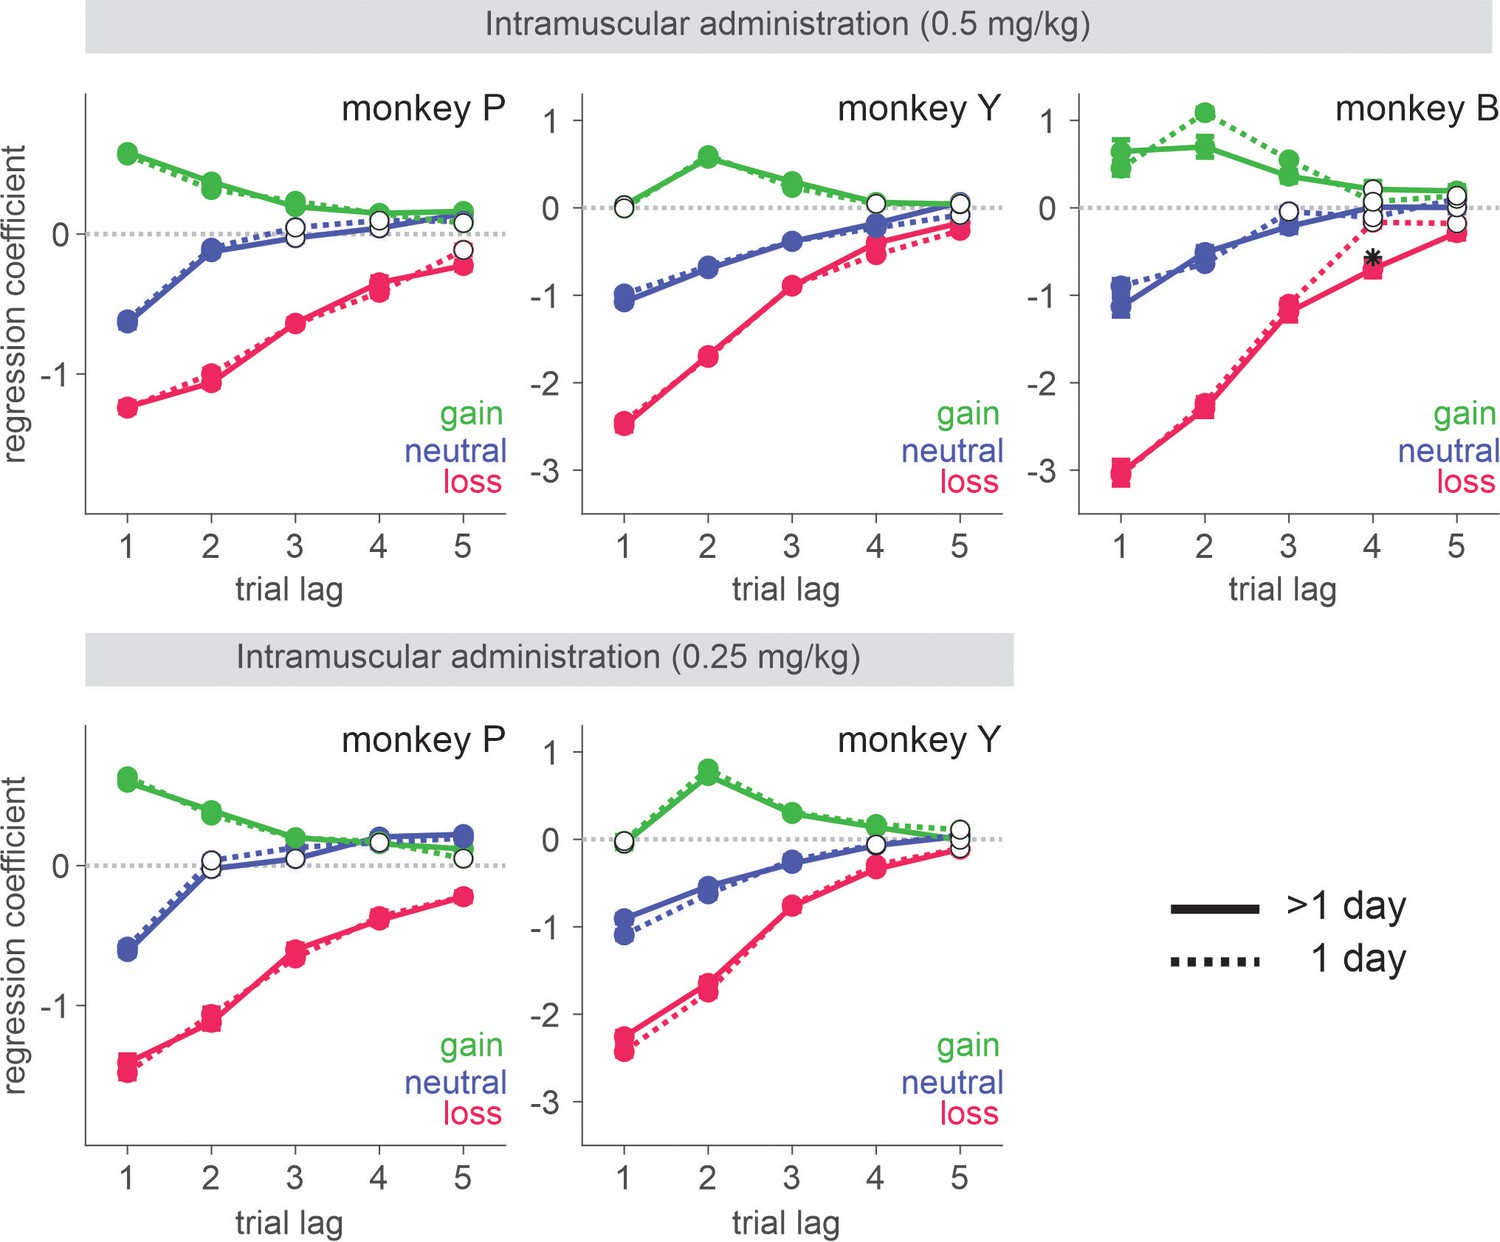
Behavioral effect of 0.25 mg/kg intramuscularly (IM) administered (top) and 0.5 mg/kg intranasally (IN) administered (bottom) ketamine.
Regression coefficients reflecting the effects of gain, neutral (zero token), and loss outcomes obtained in the past trials are plotted. Solid and dotted lines represent data from saline and ketamine sessions, respectively. Solid (empty) symbols indicate that the corresponding coefficients are (not) significantly different from zero (one-sample t-test, p < 0.05). * indicates that the coefficients from ketamine and saline sessions are significantly different for corresponding trial lag of outcome (independent sample t-test, p < 0.05). Standard error is shown as horizontal bars above/below each coefficient. For IM sessions, N=50 (Sal) and 14 (Ket) for monkey P; N=36 (Sal) and 10 (Ket) for monkey Y. For IN sessions, N=34 (Sal) and 12 (Ket) for monkey P; N=28 (Sal) and 12 (Ket) for monkey B.
-
Figure 1—figure supplement 1—source data 1
Means and standard errors of regression coefficients.
- https://cdn.elifesciences.org/articles/87529/elife-87529-fig1-figsupp1-data1-v1.xlsx
Figure 2

Time course of plasma concentration of ketamine following intramuscular (IM) and intranasal (IN) administration.
Dotted lines indicate the data from individual sessions, and dotted lines for average across individual sessions. Blood sample was taken every 20 min after injection.
-
Figure 2—source data 1
Numerical data for plasma concentration used to generate the figure.
- https://cdn.elifesciences.org/articles/87529/elife-87529-fig2-data1-v1.xlsx
Figure 3

Model comparison for saline sessions.
Each row shows free (filled circles), unused (empty circles), and fixed (specific values) parameters of a variant of reinforcement learning (RL) model. For the details of RL models and parameters, see Table 1. Heat map on the right represents natural logarithm of differential BIC (Bayesian information criterion) of each variant from the best model. Best model for each animal is indicated by check (√) mark. Q(standard): standard Q-learning model; Q-SE: Q-learning with subjective outcome evaluation; DF: differential forgetting model; DF-R: differential forgetting with neutral outcome being the reference point; NDF: non-differential forgetting model; NDF-R: non-differential forgetting model with neutral outcome being the reference point; NDF-A: non-differential forgetting model with asset-gated outcome evaluation.
-
Figure 3—source data 1
Numerical values of BIC used to generate the figure.
- https://cdn.elifesciences.org/articles/87529/elife-87529-fig3-data1-v1.xlsx
Figure 4
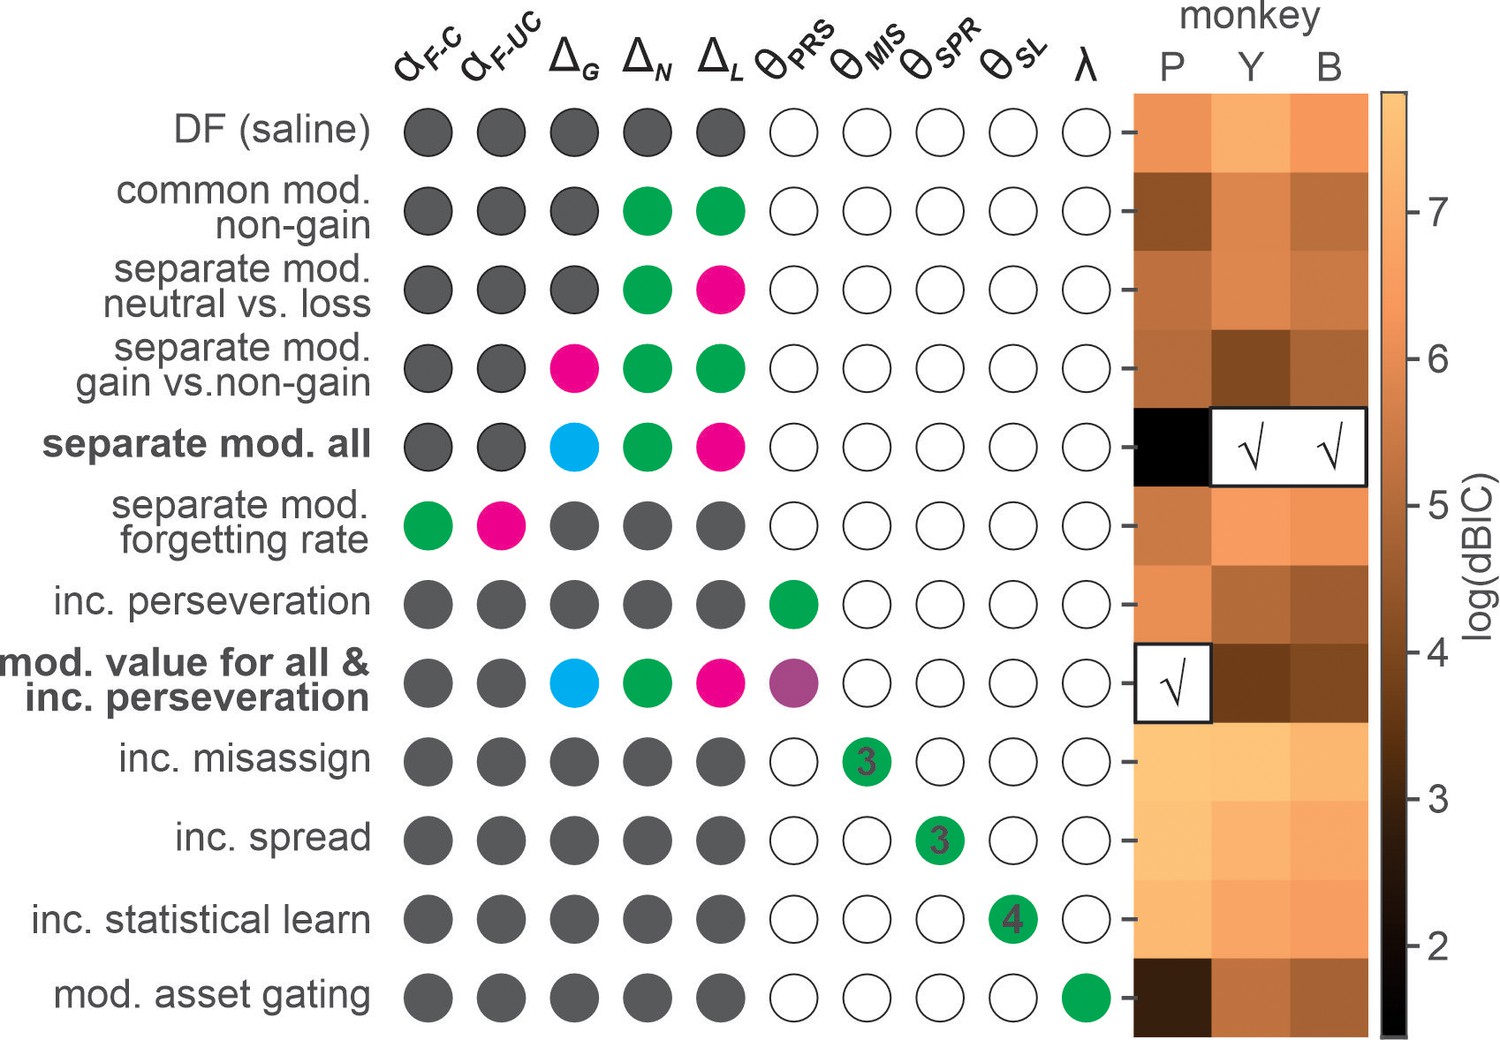
Model comparison for the effects of ketamine.
Each row shows fixed (gray-filled circles), free (colored circles), and unused (empty circles) parameters of a variant of differential forgetting (DF) model. For the details of each model, see Table 2. θ represents a set of parameters added to a particular variant of DF model, and the number inside colored circles indicate the number of added parameters (>1). For the details of each model, see Table 2. Heat map on the right represents natural logarithm of differential BIC (Bayesian information criterion) of each variant from the best model. Best model for each animal is indicated by check (√) mark. DF(saline): differential forgetting model fit to the data from saline session; Common mod. non-gain: common modulation of non-gain outcome evaluation; Separate mod. neutral vs. loss: differential modulation of neutral and loss outcome evaluation; Separate mod. gain vs. non-gain: differential modulation of gain and non-gain outcome evaluation; Separate mod. all: outcome-dependent modulation of outcome evaluation; Separate mod. forgetting rate: differential modulation of forgetting rate for chosen and unchosen target; Inc perseveration: increased perseveration; Mod. value for all & inc perseveration: outcome-dependent modulation of outcome evaluation and increased perseveration; Inc misassign: increased backward credit misassignment; Inc spread: increased forward spread in credit assignment; Inc statistical learning: increased statistical learning of reward rate; Mod. asset gating: modulation of asset-gated outcome evaluation.
-
Figure 4—source data 1
Numerical values of BIC used to generate the figure.
- https://cdn.elifesciences.org/articles/87529/elife-87529-fig4-data1-v1.xlsx
Figure 5 with 1 supplement
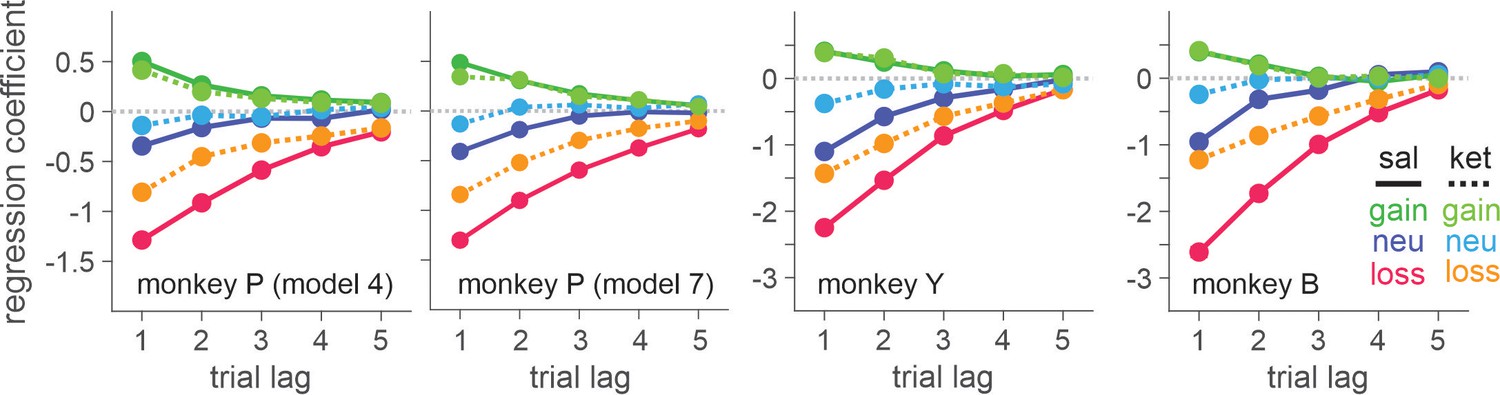
Ketamine-induced behavioral modulation simulated with differential forgetting model (for saline session) and best-fitting K-model (for ketamine session).
Simulated data were generated with the maximum likelihood parameters of best-fitting models for saline (differential forgetting model) and ketamine (K-model 4: differential modulation of value for all the outcomes) sessions. Simulated choice was analyzed with logistic regression model (Equation 1).
-
Figure 5—source data 1
Means and standard errors of regerssion coefficients.
- https://cdn.elifesciences.org/articles/87529/elife-87529-fig5-data1-v1.xlsx
Figure 5—figure supplement 1

Ketamine-induced behavioral modulation simulated with best-fitting K-model of each class of reinforcement learning (RL) models.
Format is same as in Figure 4. Each column represents simulated data with best-fitting parameters for individual monkey (P, Y, and B from left to right).
-
Figure 5—figure supplement 1—source data 1
Means and standard errors of regression coefficients.
- https://cdn.elifesciences.org/articles/87529/elife-87529-fig5-figsupp1-data1-v1.xlsx
Figure 6
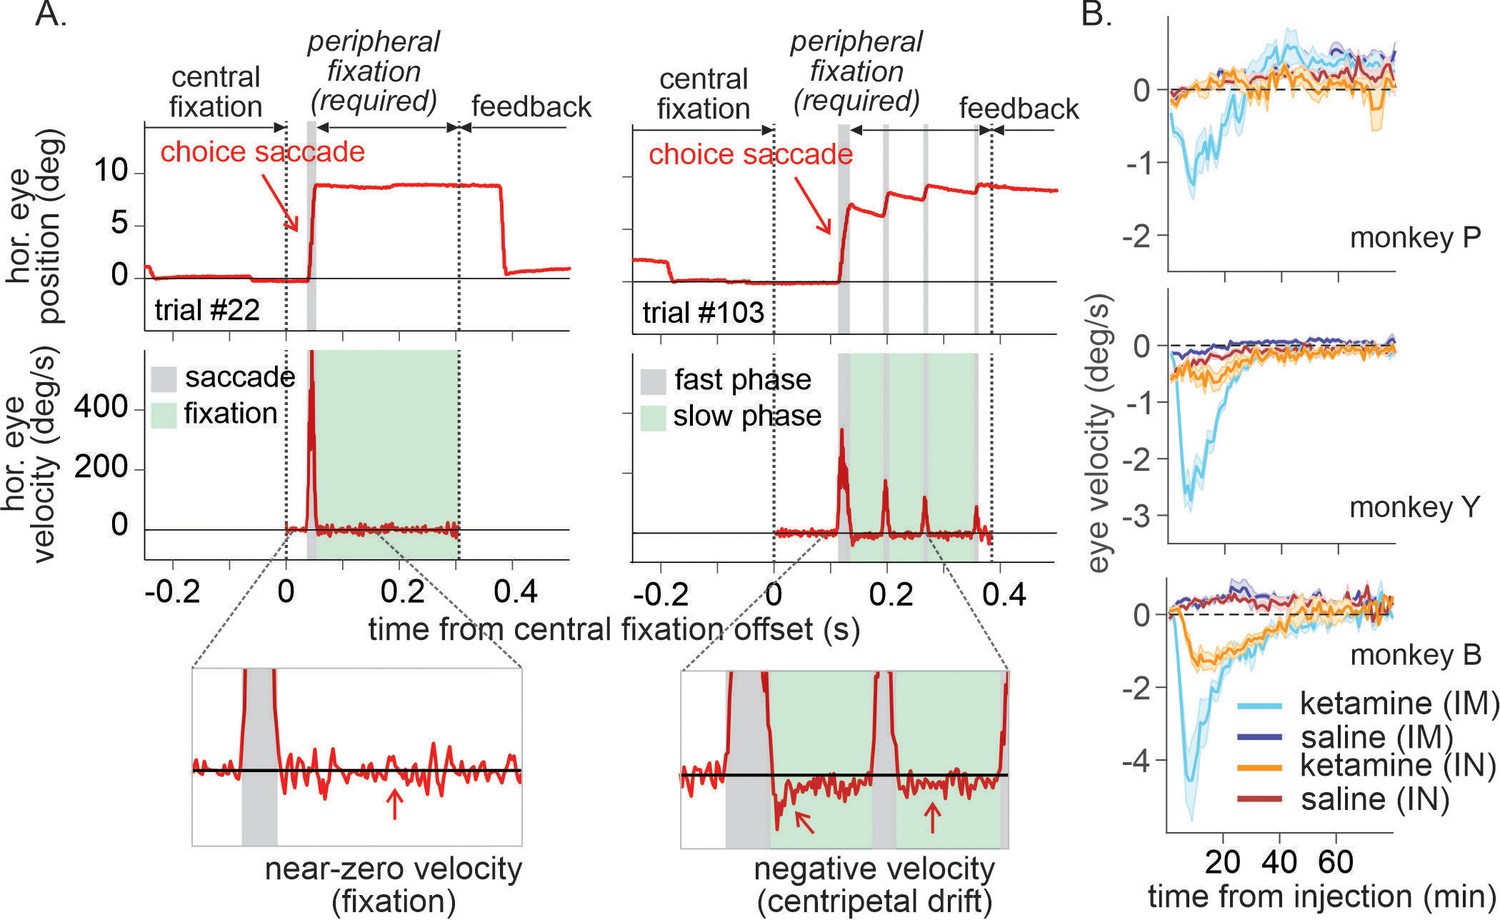
Time course of ketamine-induced ocular nystagmus.
(A) Ocular position and velocity during fixation on the peripheral target in example trials during saline (left panel) and ketamine (right panel) sessions. (B) Time course of mean ocular velocity aligned at the time of saline or ketamine injection (monkey P, Y, and B from top to bottom). Shades indicate standard error. IM and IN indicates intramuscular and intranasal administration, respectively. For IM sessions, N=52 (Sal) and 17 (Ket) for monkey P; N=49 (Sal) and 15 (Ket) for monkey Y; N=25 (Sal) and 9 (Ket) for monkey B. For IN sessions, N=23 (Sal) and 13 (Ket) for monkey P; N=16 (Sal) and 10 (Ket) for monkey Y; N=19 (Sal) and 8 (Ket) for monkey B.
-
Figure 6—source data 1
Means and standard errors of slow-phase ocular velocity (deg/s) used to generate Figure 6B.
- https://cdn.elifesciences.org/articles/87529/elife-87529-fig6-data1-v1.xlsx
Figure 7

Time course of ketamine-induced modulation of outcome-dependent choice behavior.
Time course of attenuation in loss evaluation induced by 0.5 mg/kg of intramuscularly (A) and 1 mg/kg of intranasally (B) administered ketamine. Regression coefficient reflecting ketamine’s modulation of the effect of each outcome from the previous trial (trial lag 1) is plotted as a function of time relative to the injection. Solid (empty) symbols indicate that coefficients are (not) significantly different from zero (t-test, p < 0.05). Dotted lines represent standard error obtained from shuffled data (N=1000) between saline and ketamine sessions separately for each outcome. For IM sessions, N=52 (Sal) and 12 (Ket) for monkey P; N=49 (Sal) and 15 (Ket) for monkey Y; N=4 (Sal) and 7 (Ket) for monkey B.
-
Figure 7—source data 1
Means and standard errors of differential regression coefficients.
- https://cdn.elifesciences.org/articles/87529/elife-87529-fig7-data1-v1.xlsx
Figure 8
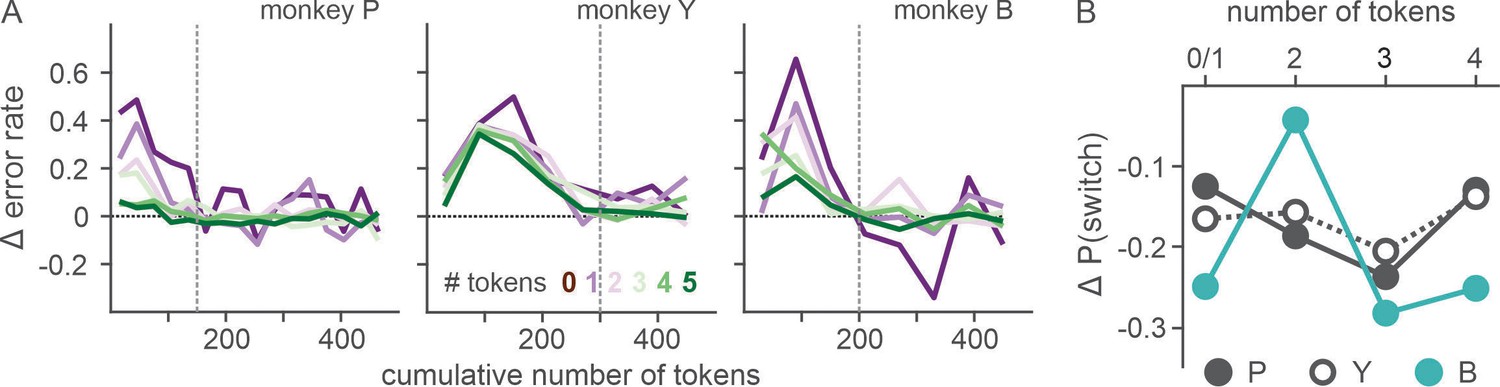
Effect of motivation on countering ketamine-induced fixation errors.
(A) Difference in the rate of fixation break/trial between ketamine and saline sessions is plotted as a function of cumulative number of tokens (as a proxy for time with the satiation effect being controlled). Number of tokens owned by the animal at a given trial (asset) is color coded. Vertical dotted lines demarcate the latest data point that was included in the linear regression analysis. (B) Difference in the probability of choice switch after loss from the previous trial (trial lag 1) between ketamine and saline sessions is plotted as a function of asset at the time of decision. Due to limited number of loss trials, analysis was performed after dividing trials into four groups according to asset (0–1, 2, 3, 4). N=52 (Sal) and 17 (Ket) for monkey P; N=49 (Sal) and 15 (Ket) for monkey Y; N=25 (Sal) and 9 (Ket) for monkey B.
-
Figure 8—source data 1
Differential error rate and probability of choice switch as the function of owned tokens.
- https://cdn.elifesciences.org/articles/87529/elife-87529-fig8-data1-v1.xlsx
Figure 9
Behavioral effects of ketamine do not spread over the sessions subsequent to the injection.
Regression coefficients reflecting the effects of gain, neutral (zero token), and loss outcomes obtained in the past trials are plotted. Solid (dotted) lines represent data from saline sessions >1 day (1 day) after a ketamine session. Solid (empty) symbols indicate that the corresponding coefficients are (not) significantly different from zero (t-test, p < 0.05). Standard error is shown as horizontal bars above/below each coefficient. For IM sessions, N=37 (Sal) and 14 (Ket) for monkey P; N=35 (Sal) and 13 (Ket) for monkey Y; N=18 (Sal) and 6 (Ket) for monkey B. For IN sessions, N=37 (Sal) and 12 (Ket) for monkey P; N=25 (Sal) and 10 (Ket) for monkey Y.
-
Figure 9—source data 1
Means and standard errors of regression coefficients.
- https://cdn.elifesciences.org/articles/87529/elife-87529-fig9-data1-v1.xlsx
Author response image 1

ketamine-induced behavioral modulation simulated with differential forgetting model (for saline session) and best-fitting K-model (for ketamine session).
Tables
Table 1
Reinforcement learning models for normal behavior during saline sessions.
| Model | Value update | |
|---|---|---|
| Q-learning (Q) | , if A is chosen. | |
| Rt = 1, 0, −1 for gain, neutral, and loss, respectively. | ||
| Q-learning with subjective outcome evaluation (QSE) | , if A is chosen. | |
| = , , for gain, neutral, and loss (QSE). = 0 (QSE-R) | ||
| Differential forgetting (DF) | , if A is chosen. , if A is not chosen. | |
| = , , for gain, neutral, and loss (DF). = 0 (DF-R) | ||
| Non-differential forgetting (NDF) | , if A is chosen. , if A is not chosen. | |
| = , , for gain, neutral, and loss (NDF). = 0 (NDF-R) | ||
| DF with asset-gated outcome evaluation (DF-A) | , if A is chosen. , if A is not chosen. | |
| = 1, 0, −1 for gain, neutral, and loss, respectively. |
Table 2
Reinforcement learning models for ketamine-induced modulation of choice behavior.
| K-model | Hypothesis | Model parameters |
|---|---|---|
| Value model | ||
| 1 | Common modulation of LR/value for non-gain outcomes | = , , for neutral and loss outcomes, respectively. |
| 2 | Differential modulation of LR/value for non-gain outcome | = , , for neutral and loss outcomes, respectively. |
| 3 | Differential modulation of LR/value for gain vs. non-gain outcome | = , , , for gain, neutral, and loss outcomes. |
| 4 | Differential modulation of LR/value for all the outcomes | = , , , for gain, neutral, and loss outcomes, respectively. |
| Memory model | ||
| 5 | Differential modulation of forgetting rate for chosen and unchosen actions | , for chosen and unchosen action, respectively. |
| Perseveration model | ||
| 6 | Modulation of perseveration tendency | = 1 (−1), if right (left) target was chosen at trial t. |
| 7 | Modulation of LR/value and perseveration | Model 4 + model 6 |
| Temporal credit assignment (TCA) model | ||
| 8 | Increase mis-assignment | + + = 1 (−1), if right (left) target was chosen at trial t. = , , for gain, neutral, and loss t trial t. |
| 9 | Increase spread | + + = 1 (−1), if right (left) target was chosen at trial t. = , , for gain, neutral, and loss at trial t. |
| 10 | Increase statistical learning (SL) | , = , , for gain, neutral, and loss at trial t. |
| Motivation model | ||
| 11 | Modulation of asset-gated outcome evaluation | , if A is chosen. , if A is not chosen. = , , for gain, neutral, and loss at trial t. |
Table 3
Maximum likelihood parameter estimates of the best models for saline and ketamine sessions.
| P | Saline | 0.72 | 0.09 | −0.57 | −1.3 | −2.31 |
| Ketamine | 0.40 (0.49) | 0.11 (0.18) | −0.18 (−0.15) | |||
| Y | Saline | 0.65 | 0.20 | −0.54 | −1.91 | −3.15 |
| Ketamine | 0.31 | −0.18 | −0.95 | |||
| B | Saline | 0.83 | 0.19 | −1.07 | −2.26 | −4.12 |
| Ketamine | 0.18 | −0.25 | −1.01 |
Author response table 1
Maximum likelihood parameter estimates of the best models for saline and ketamine sessions.
| P | Saline | 0.72 | 0.09 | –0.57 | –1.3 | –2.31 |
| Ketamine | 0.40 (0.49) | 0.11 (0.18) | –0.18 (-0.15) | |||
| Y | Saline | 0.65 | 0.20 | –0.54 | –1.91 | –3.15 |
| Ketamine | 0.31 | –0.18 | –0.95 | |||
| B | Saline | 0.83 | 0.19 | –1.07 | –2.26 | –4.12 |
| Ketamine | 0.18 | –0.25 | –1.01 |
Additional files
Download links
A two-part list of links to download the article, or parts of the article, in various formats.
Downloads (link to download the article as PDF)
Open citations (links to open the citations from this article in various online reference manager services)
Cite this article (links to download the citations from this article in formats compatible with various reference manager tools)
Therapeutic doses of ketamine acutely attenuate the aversive effect of losses during decision-making
eLife 12:RP87529.
https://doi.org/10.7554/eLife.87529.3


