Coupling of Slack and NaV1.6 sensitizes Slack to quinidine blockade and guides anti-seizure strategy development
- State Key Laboratory of Natural and Biomimetic Drugs, Department of Molecular and Cellular Pharmacology, School of Pharmaceutical Sciences, Peking University Health Science Center, China
- NHC and CAMS Key Laboratory of Medical Neurobiology, MOE Frontier Science Center for Brain Research and Brain-Machine Integration, School of Brain Science and Brain Medicine, Zhejiang University, China
- Department of Medicinal Chemistry and Molecular Pharmacology, College of Pharmacy, Purdue University, United States
- Department of Biophysics, Kidney Disease Center of the First Affiliated Hospital, Zhejiang University School of Medicine, Hangzhou, China
- IDG/McGovern Institute for Brain Research, Peking University, China
Figures
Figure 1 with 3 supplements
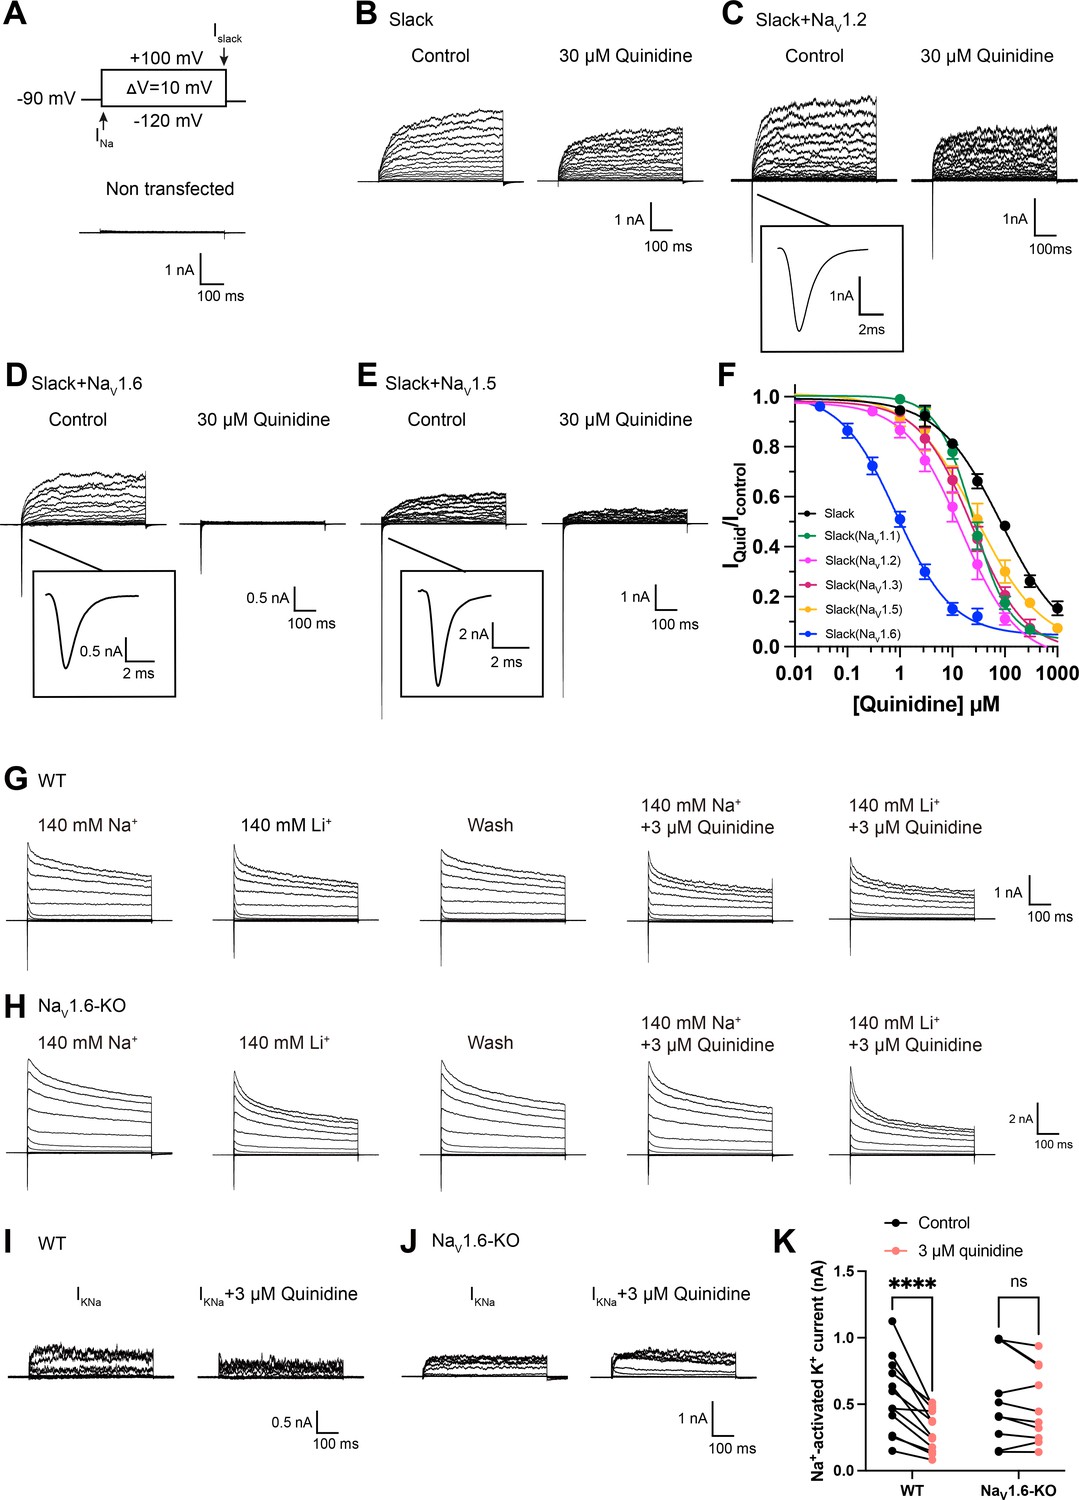
NaV1.6 specifically sensitizes Slack to quinidine blockade.
(A) The voltage protocol and current traces from control (non-transfected) HEK293 cells. The arrows on the voltage protocol indicate the onset of inward sodium currents through NaV channels and delayed outward potassium currents through Slack channels. The currents were evoked by applying 600 ms step pulses to voltages varying from –120 mV to +100 mV in 10 mV increments, with a holding potential of –90 mV and a stimulus frequency of 0.20 Hz. (B) Example current traces from HEK293 cells expressing Slack alone. The left traces show the family of control currents; the right traces show Slack currents remaining after application of 30 μΜ quinidine in the bath solution. (C–E) Example current traces from HEK293 cells co-expressing Slack with NaV1.2 (C), NaV1.6 (D), or NaV1.5 (E) channels before and after application of 30 μΜ quinidine. (F) The concentration–response curves for blocking of Slack by quinidine at +100 mV upon expression of Slack alone (n = 6) and co-expression of Slack with NaV1.1 (n = 7), NaV1.2 (n = 10), NaV1.3 (n = 13), NaV1.5 (n = 9), or NaV1.6 (n = 19). Please refer to Supplementary file 1a for IC50 values. (G, H) Delayed outward currents in primary cortical neurons from postnatal (P0-P1) homozygous NaV1.6 knockout C3HeB/FeJ mice (NaV1.6-KO) (H) and the wild-type littermate controls (WT) (G). Current traces were elicited by 600 ms step pulses to voltages varying from –120 mV to +100 mV in 20 mV increments, with a holding potential of –70 mV, and recorded with different bath solutions in the following order: Na+-based bath solution (IControl), replacement of external Na+ with Li+ in equivalent concentration (ILi), washout of quinidine by Na+-based bath solution (IWash), Na+-based bath solution with 3 μM quinidine (IQuid), Li+-based bath solution with 3 μM quinidine (ILi+Quid). The removal and subsequent replacement of extracellular Na+ revealed the IKNa in neurons. (I, J) The sensitivity of native sodium-activated potassium currents (IKNa) to 3 μM quinidine blockade in WT (I) and NaV1.6-KO (J) neurons. IKNa before application of quinidine was obtained from the subtraction of IControl and ILi. Maintained IKNa after application of 3 μM quinidine was obtained from the subtraction of IQuid and ILi+Quid. (K) Summarized amplitudes of IKNa before and after application of 3 μM quinidine in the bath solution in WT (black, n = 12) and NaV1.6-KO (red, n = 10) primary cortical neurons. ****p<0.0001, two-way repeated-measures ANOVA followed by Bonferroni’s post hoc test.
-
Figure 1—source data 1
Numerical data for Figure 1 and Figure 1—figure supplements 1–3.
- https://cdn.elifesciences.org/articles/87559/elife-87559-fig1-data1-v1.xlsx
Figure 1—figure supplement 1
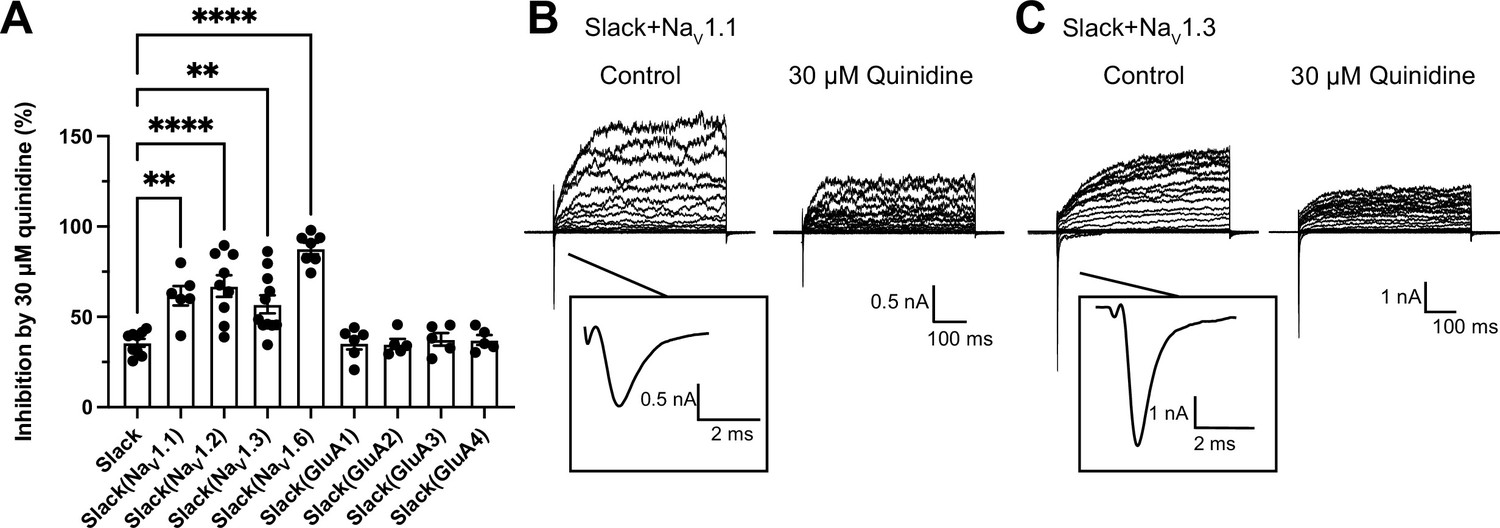
The sensitivity of Slack to quinidine blockade upon expression of Slack alone and co-expression of Slack with sodium-permeable channels.
(A) The inhibitory effects of 30 μΜ quinidine on Slack upon expression of Slack alone (n = 9) and co-expression of Slack with NaV1.1 (n = 6), NaV1.2 (n = 9), NaV1.3 (n = 11), NaV1.6 (n = 7), GluA1 (n = 6), GluA2 (n = 5), GluA3 (n = 5), or GluA4 (n = 5). **p<0.01, ****p<0.0001; one-way ANOVA followed by Bonferroni’s post hoc test. Upon co-expression of Slack with NaV subunits, NaV currents and Slack currents were evoked by applying 600 ms step pulses to voltages varying from –120 mV to +100 mV in 10 mV increments, with a holding potential of –90 mV and a stimulus frequency of 0.20 Hz (pulse protocol 1). Upon co-expression of Slack with AMPAR subunits, the AMPAR currents were elicited by 1 mM glutamate in the presence of 5 μΜ cyclothiazide (CTZ), applied for 10 s before the co-application of CTZ plus glutamate. After recording AMPAR currents, Slack currents were elicited by a 600 ms step pulse to +100 mV from a holding potential of –90 mV in the absence or presence of 30 μΜ quinidine in the bath solution (pulse protocol 2). For Slack expressed alone, both pulse protocols were used (n = 5 for pulse protocol 1 and n = 4 for pulse protocol 2). (B, C) Example current traces from HEK293 cells co-expressing Slack with NaV1.1 (B), NaV1.3 (C), before and after application of 30 μΜ quinidine.
Figure 1—figure supplement 2
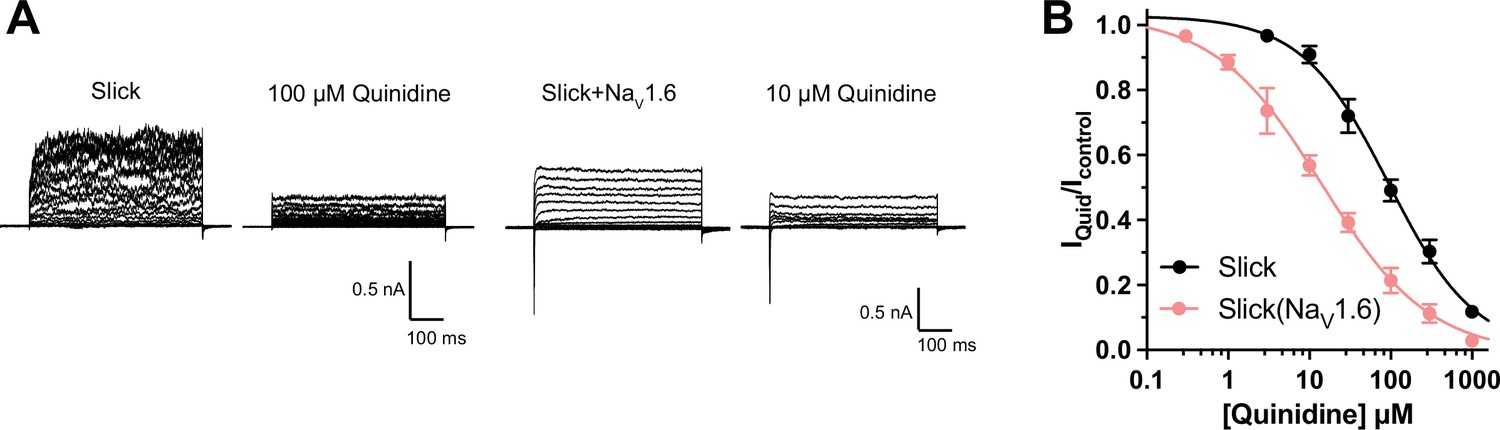
The sensitivity of Slick to quinidine blockade upon expression of Slick alone or co-expression of Slick with NaV1.6.
(A) Example current traces from HEK293 cells expressing Slick alone and co-expressing Slick with NaV1.6. The left traces show the family of control currents; the right traces show the delayed outward current remaining after application of the indicated concentrations of quinidine. (B) The concentration–response curves for blocking of Slick by quinidine upon expression of Slick alone (n = 5) and co-expression of Slick with NaV1.6 (n = 7).
Figure 1—figure supplement 3
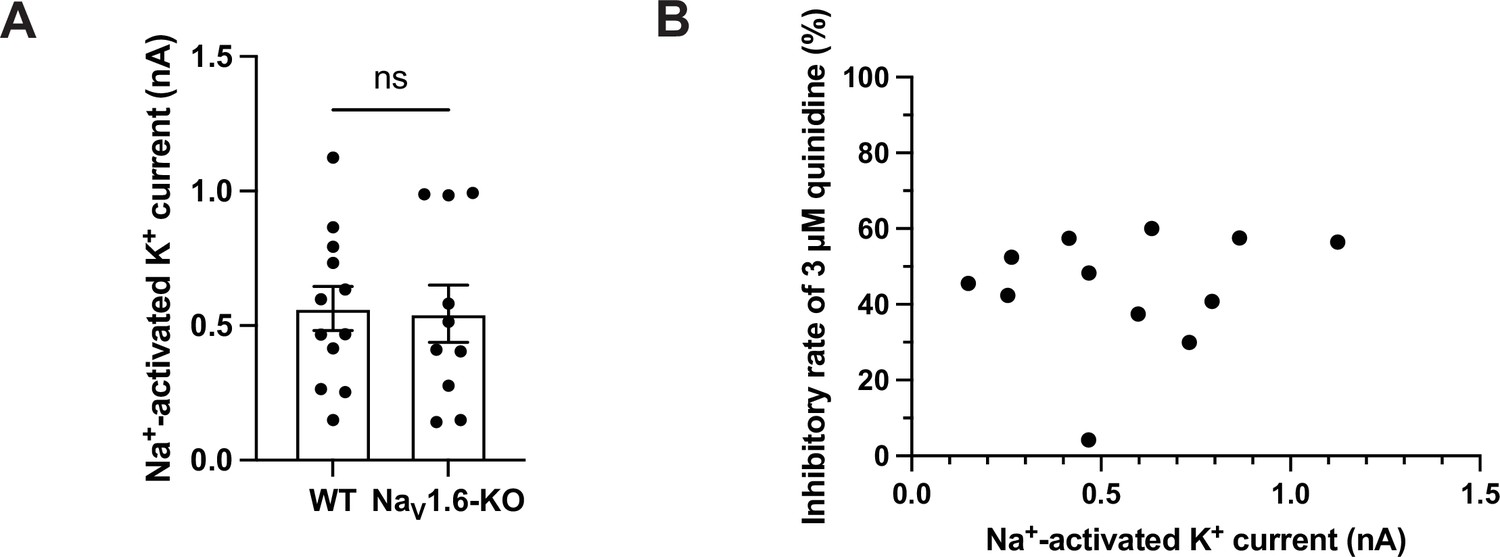
The amplitudes and sensitivity to quinidine of sodium-activated potassium currents in primary cortical neurons.
(A) The amplitudes of IKNa in WT (n = 12) and NaV1.6-KO (n = 10) neurons. ns, p>0.05, unpaired two-tailed Student’s t-test. (B) The correlation between the amplitudes of IKNa in WT neurons before bath application of 3 μΜ quinidine and the inhibitory effect of 3 μΜ quinidine on IKNa in WT neurons. r = 0.1555, p=0.6294, Pearson correlation analysis.
Figure 2 with 4 supplements
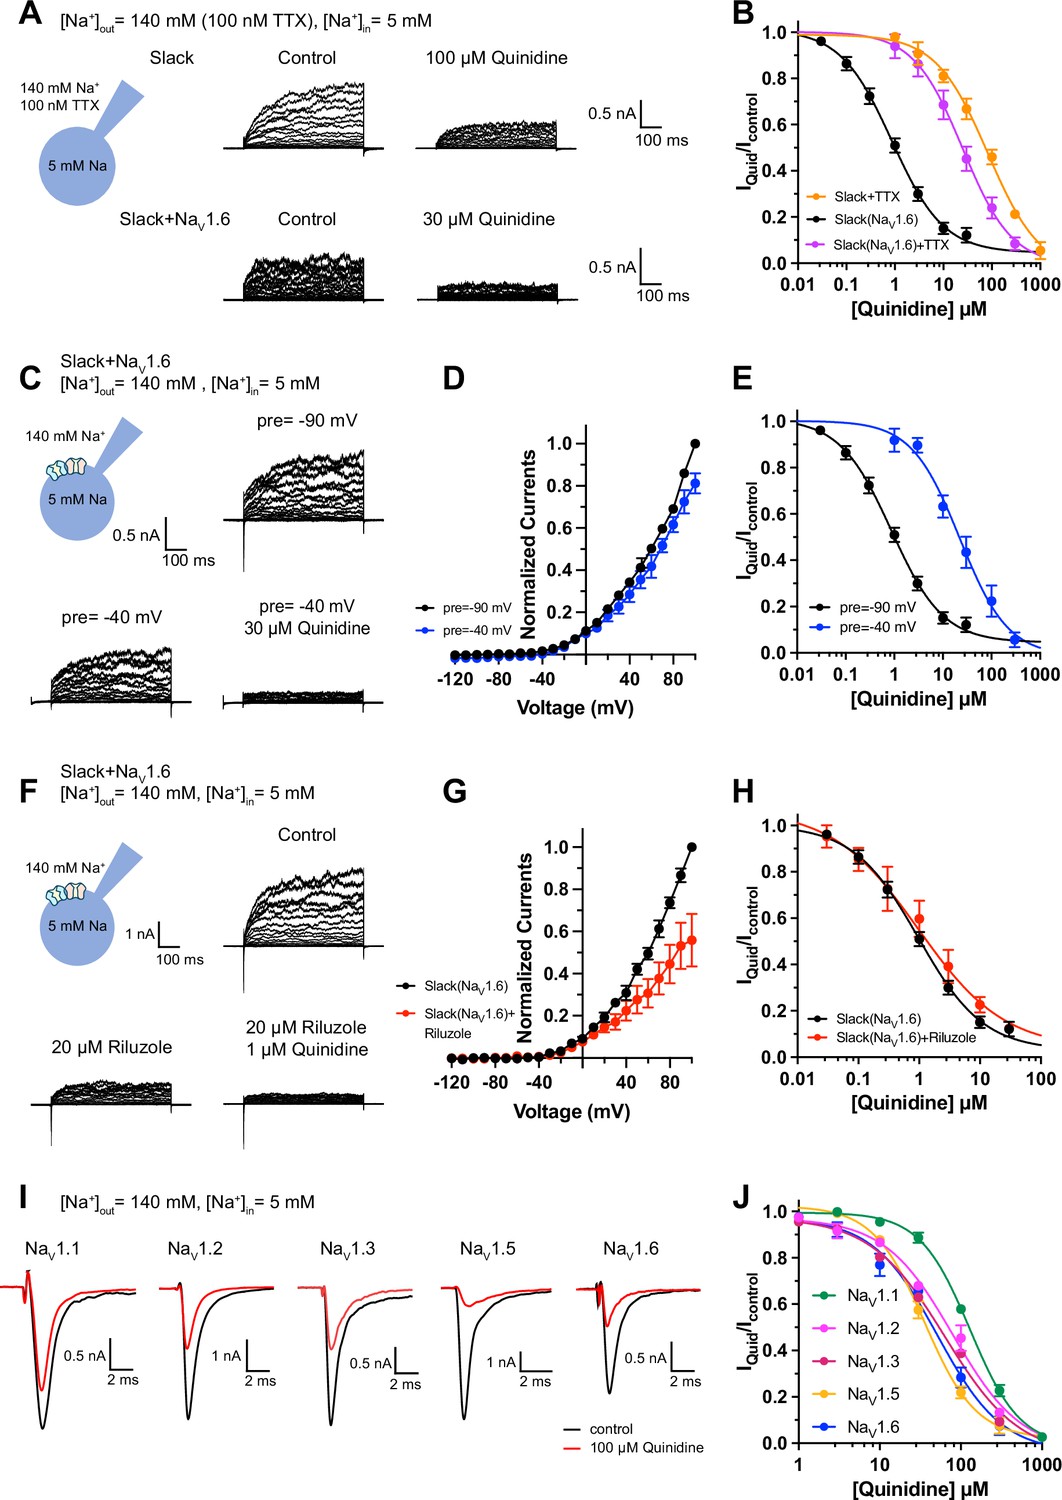
Blocking transient sodium influx through NaV1.6 reduces NaV1.6-mediated sensitization of Slack to quinidine blockade.
(A) Example current traces from HEK293 cells expressing Slack alone (top) and co-expressing Slack with NaV1.6 (bottom), with 100 nM tetrodotoxin (TTX) in the bath solution. The left traces show the family of control currents; the right traces show Slack currents remaining after application of quinidine. The presented concentrations of quinidine were chosen to be near the IC50 values. (B) The concentration–response curves for blocking of Slack by quinidine at +100 mV upon expression of Slack alone (n = 3) and co-expression of Slack with NaV1.6 (n = 7), with 100 nM TTX in the bath solution. (C) Top: example current traces recorded from a HEK293 cell co-expressing Slack with NaV1.6 and evoked from a 100 ms prepulse (pre) of –90 mV, with the same voltage protocol as in Figure 1D. Bottom: example current traces recorded from the same cell but evoked from a 100 ms prepulse of –40 mV, before and after application of quinidine. (D) I–V curves of Slack upon co-expression with NaV1.6. The currents were evoked from a prepulse of –90 mV (black) or –40 mV (blue). (E) The concentration–response curves for blocking of Slack by quinidine at +100 mV with a prepulse of –90 mV (black, n = 19) or –40 mV (blue, n = 5). (F) Top: example current traces recorded from a HEK293 cell co-expressing Slack and NaV1.6 without riluzole in the bath solution. Bottom: example current traces recorded from the same cell with 20 µM riluzole in the bath solution, before and after application of quinidine. (G) I–V curves of Slack upon co-expression with NaV1.6 before (black) and after (red) application of 20 µM riluzole into bath solution. The concentration–response curves for blocking of Slack by quinidine upon co-expression of Slack with NaV1.6, without (n = 19) or with (n = 6) 20 µM riluzole in the bath solution. (I, J) The sensitivity of NaV channel subtypes to quinidine blockade upon expression of NaV alone in HEK293 cells. Example current traces (I) were evoked by a 50 ms step depolarization to 0 mV from a holding potential of –90 mV. The concentration–response curves for blocking of NaV channel subtypes by quinidine (J) are shown on the right panel (n = 5 for NaV1.1, n = 3 for NaV1.2, n = 6 for NaV1.3, n = 6 for NaV1.5, and n = 4 for NaV1.6).
-
Figure 2—source data 1
Numerical data for Figure 2 and Figure 2—figure supplements 1–4.
- https://cdn.elifesciences.org/articles/87559/elife-87559-fig2-data1-v1.xlsx
Figure 2—figure supplement 1
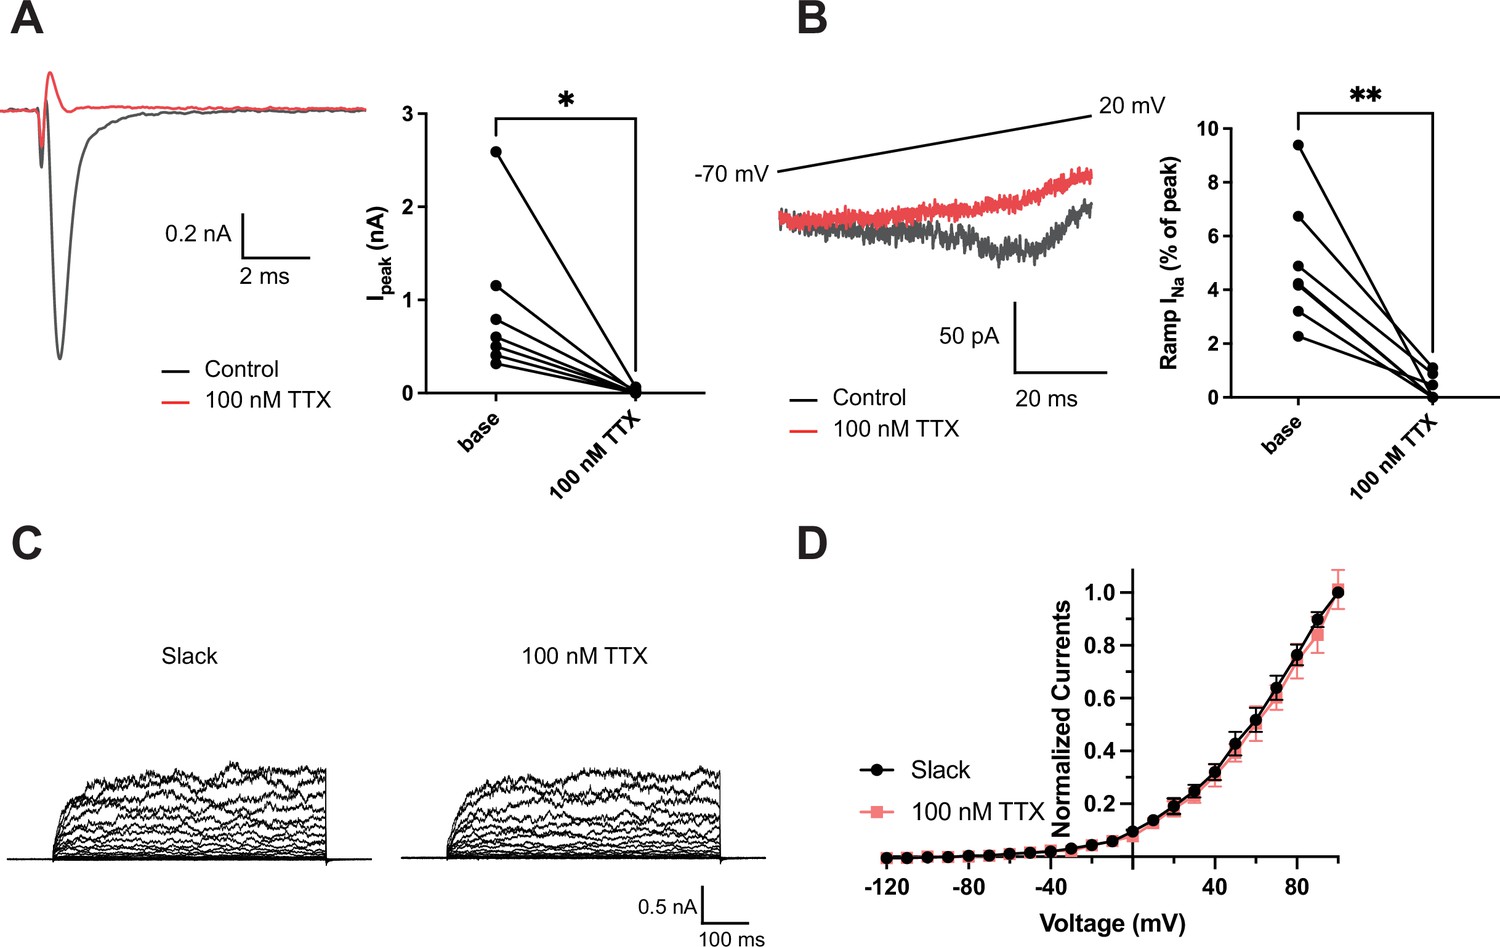
Effects of 100 nM tetrodotoxin (TTX) on NaV1.6 and Slack currents.
(A) Example peak currents (Ipeak) at 0 mV of NaV1.6 before (black) and after (red) application of 100 nM TTX in the bath solution. (B) Example ramp sodium current (ramp INa) traces evoked during a slow ramp stimulus beginning at −120 mV and ending at 20 mV over a duration of 200 ms (traces from –70 mV to 20 mV are shown). Summarized ramp INa relative to Ipeak of NaV1.6 before and after application of 100 nM TTX in the bath solution are shown on the right panel. (C) Example current traces of Slack expressed alone evoked from a holding potential of –90 mV. (D) I–V relationships of Slack before (black) and after (red) application of 100 nM TTX in the bath solution. *p<0.05, **p<0.01, paired two-tailed Student’s t-test.
Figure 2—figure supplement 2
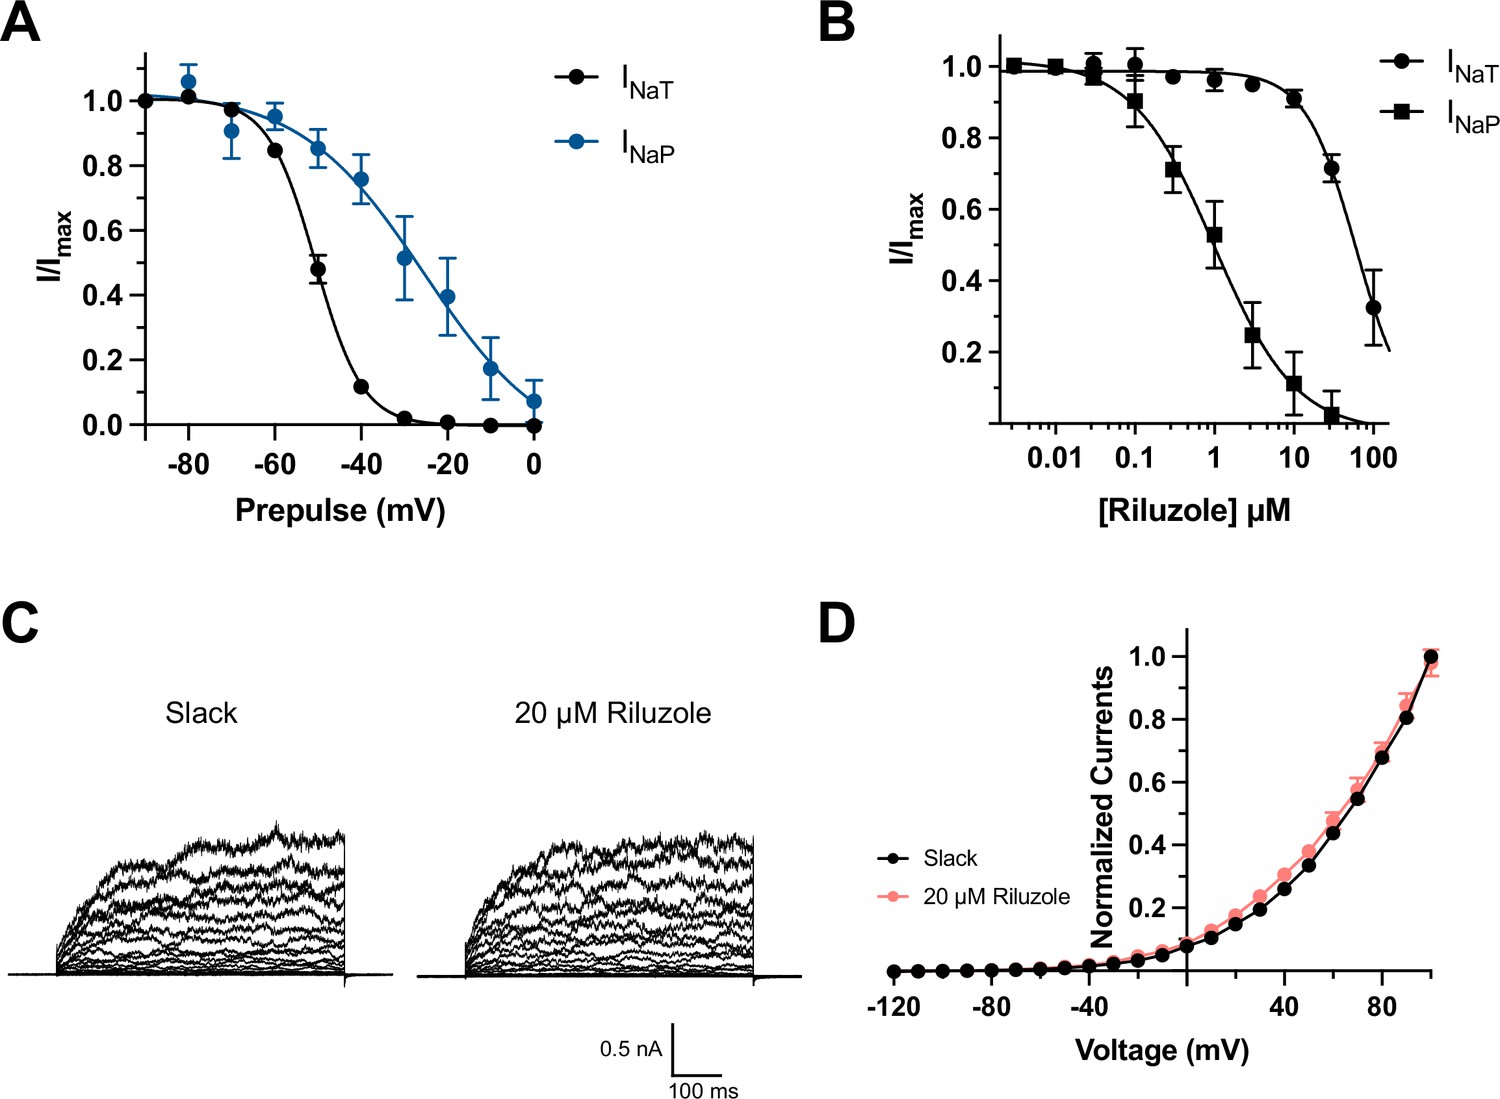
Effects of depolarized prepulse potentials and riluzole on channels.
(A) Inactivation relationships of transient (INaT) and persistent sodium currents (INaP) of NaV1.6 in HEK293 cells. The currents were elicited by a 600 ms step test pulse to 0 mV from a 100 ms prepulse of voltage varying from –90 mV to 0 mV in 10 mV increments. The INaT represents the peak of sodium current, and the INaP was assessed at 150 ms in test pulse. (B) The concentration–response curves for inhibition of transient (n = 6) and persistent NaV1.6 currents (n = 6) by riluzole upon expression of NaV1.6 alone in HEK293 cells. (C) Example current traces from HEK293 cells expressing Slack before and after application of 20 µM riluzole into the bath solution. (D) I–V relationships of Slack currents before and after application of 20 µM riluzole (n = 5).
Figure 2—figure supplement 3
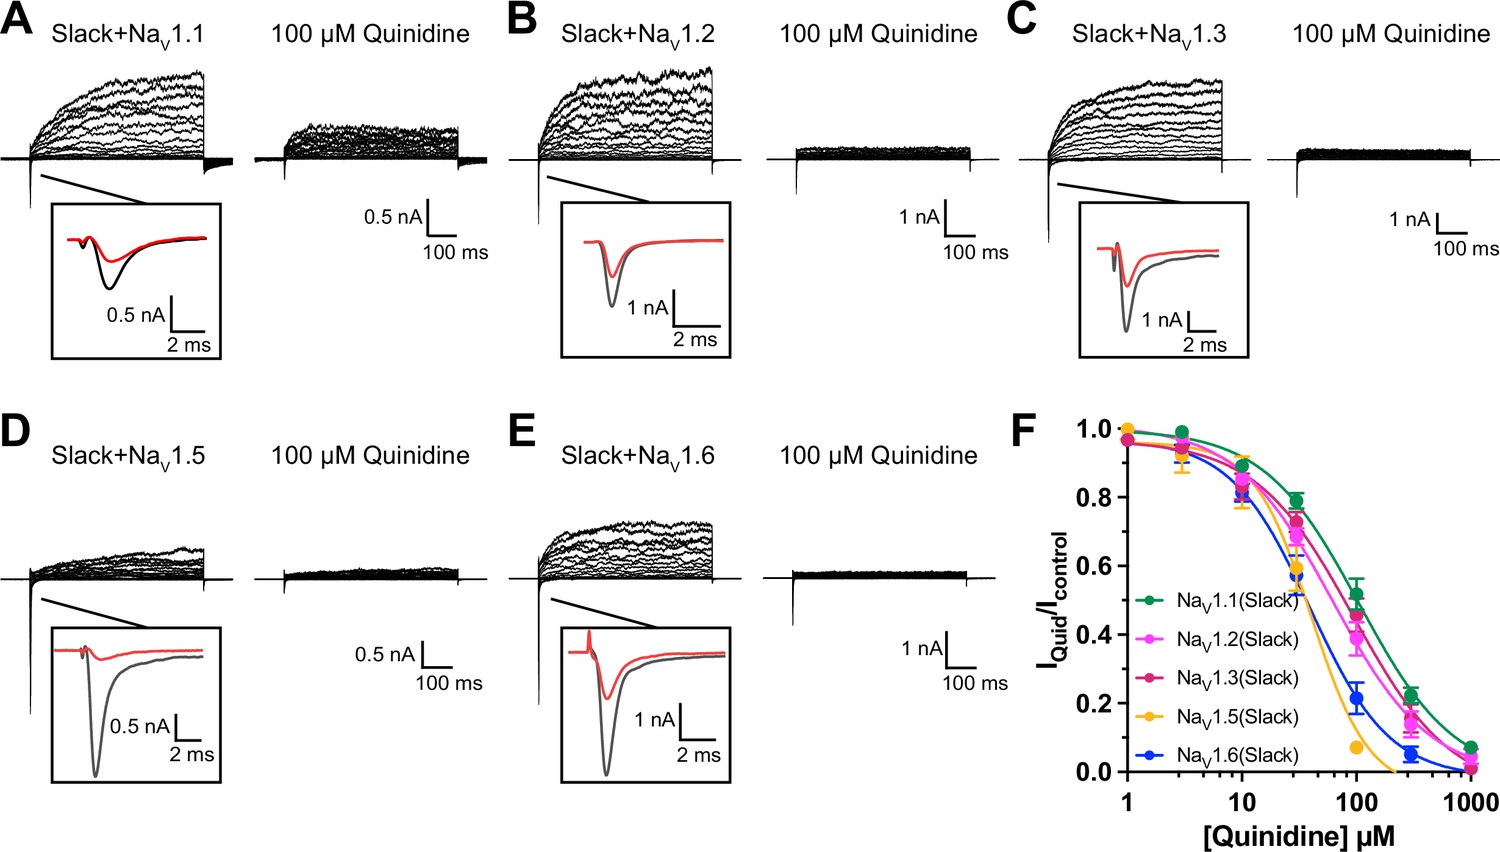
The sensitivity of NaV channel subtypes to quinidine blockade.
(A–E) Example current traces of NaV1.1 (A), NaV1.2 (B), NaV1.3 (C), NaV1.5 (D), and NaV1.6 (E) co-expressed with Slack in HEK293 cells. (F) The concentration–response curves for blocking of NaV by quinidine upon co-expression of NaV with Slack (n = 6 for NaV1.1, n = 3 for NaV1.2, n = 12 for NaV1.3, n = 9 for NaV1.5, and n = 5 for NaV1.6). Please refer to Supplementary file 1b for IC50 values.
Figure 2—figure supplement 4
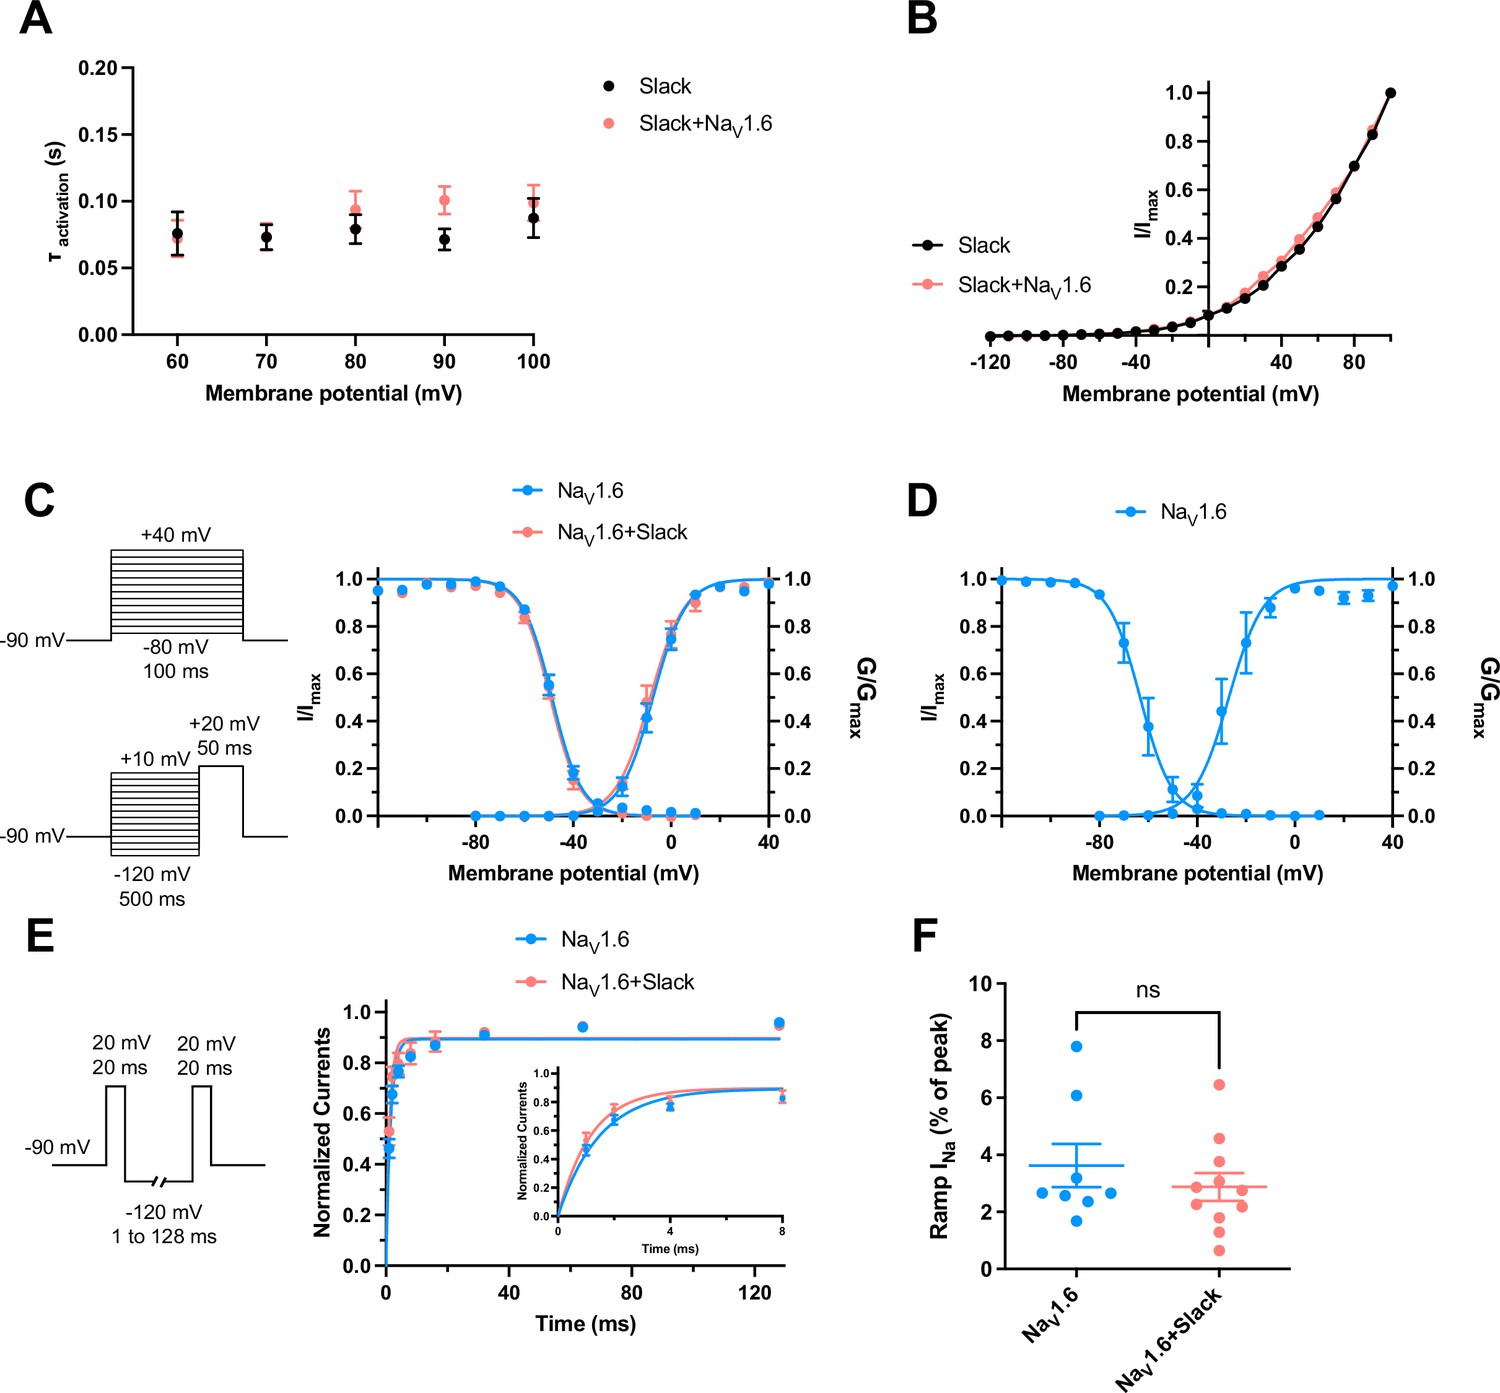
The dynamic properties of Slack and NaV1.6 channels.
(A) Average time constants calculated from single exponential decay fits of activation of Slack currents upon expression of Slack alone and co-expression of Slack with NaV1.6 (n = 10). (B) I–V curves of Slack expressed alone (black) or Slack upon co-expressed with NaV1.6 (red). (C) Voltage dependence of steady-state activation and steady-state fast inactivation of NaV1.6 sodium currents upon expression of NaV1.6 alone (n = 10 for activation and n = 11 for inactivation; blue) and co-expression of NaV1.6 with Slack (n = 6 for activation and n = 7 for inactivation; red) in HEK293 cells. The pipette solution contained (in mM) 100 K-gluconate, 30 KCl, 15 choline-Cl, 5 NaCl, 10 glucose, 5 EGTA, and 10 HEPES. To measure steady-state activation, HEK293 cells were stimulated by a 100 ms step pulses to voltages varying from –80 mV to 40 mV in 10 mV increments, with a holding potential of –90 mV and a stimulus frequency of 0.2 Hz. To measure steady-state fast inactivation, HEK293 cells were stimulated by a 100 ms prepulse to voltages varying from –120 mV to –20 mV in 10 mV increments followed by a test step to –20 mV, with a holding potential of –90 mV and a stimulus frequency of 0.2 Hz. (D) Voltage dependence of steady-state activation and steady-state fast inactivation of NaV1.6 sodium currents upon expression of NaV1.6 alone in HEK293 cells (n = 4 for activation and n = 5 for inactivation; using the same voltage protocols as in Figure 6c). The pipette solution contained (in mM) 140 CsF, 10 NaCl, 1 EGTA, and 10 HEPES. (E) The voltage protocols and time course for recovery from fast inactivation of NaV1.6 sodium currents upon expression of NaV1.6 (n = 8, blue) and co-expression of NaV1.6 with Slack (n = 7, red). HEK293 cells were stimulated by two 20 ms pulses (prepulse and test pulse) to 20 mV from a recovery potential of –120 mV with recovery phase intervals varying from 1 ms to 128 ms. The solid curves were fitted to the single exponential equation, with a time constant τ of 1.49 ms for NaV1.6 and a time constant τ of 1.17 ms for NaV1.6 with Slack. *p<0.05; extra sum-of-squares F-test. (F) Summarized ramp INa relative to Ipeak of NaV1.6 upon expression of NaV1.6 alone (n = 8) and co-expression of NaV1.6 with Slack (n = 11) (using the same protocols as in Figure 1—figure supplement 3b). Please refer to Supplementary file 1c for values of half-maximal activation and inactivation (V1/2) and slope factors (k).
Figure 3 with 1 supplement

Slack physically interacts with NaV1.6.
(A) Immunofluorescence of Slack, NaV1.2, NaV1.6 (green), and AnkG (red) in neocortex layer 5 (left) and hippocampal CA1 pyramidal cell layer (right). Confocal microscopy images were obtained from coronal brain slices of C57BL/6 mice. The panels from top to bottom show the double staining of Slack with AnkG, NaV1.2 with AnkG, and NaV1.6 with AnkG, respectively. DAPI (blue) was used for nuclear counterstaining. (B) Coimmunoprecipitation (Co-IP) of Slack and NaV1.6 in cell lysates from HEK293T cells co-transfected with Slack and NaV1.6. (C) Co-IP of Slack and NaV1.6 in mouse brain tissue lysates. Input volume corresponds to 10% of the total lysates for Co-IP. (D) A schematic diagram showing the fluorescence-labeled Slack and NaV1.6. mTFP1 and mVenus were fused to the C-terminal region of Slack (Slack-mTFP1) and NaV1.6 (NaV1.6-mVenus), respectively. (E) FRET imaging of Slack‐mTFP1 and NaV1.6-mVenus co-expressed in HEK293 cells. The emission spectra measured from the edge of cell (dotted arrows in red) are used for FRET efficiency calculation. (F) The apparent FRET efficiency measured from cells co-expressing the fluorophore-tagged ion channels (n=14) or co-expressing the fluorophores (n=12). ****p<0.0001, Mann–Whitney test. (G, H) The FRET efficiency measured from cells co-expressing the fluorophore‐tagged ion channels (G), or from cells co-expressing fluorophores (H). The efficiency value was plotted as a function of the fluorescence intensity ratio between mTFP1 and mVenus (Fc/Fy). Each symbol represents a single cell. The solid curve represents the FRET model that yields the best fit; dotted curves represent models with 5% higher or lower FRET efficiencies.
-
Figure 3—source data 1
Numerical data for Figure 3.
- https://cdn.elifesciences.org/articles/87559/elife-87559-fig3-data1-v1.xlsx
Figure 3—figure supplement 1
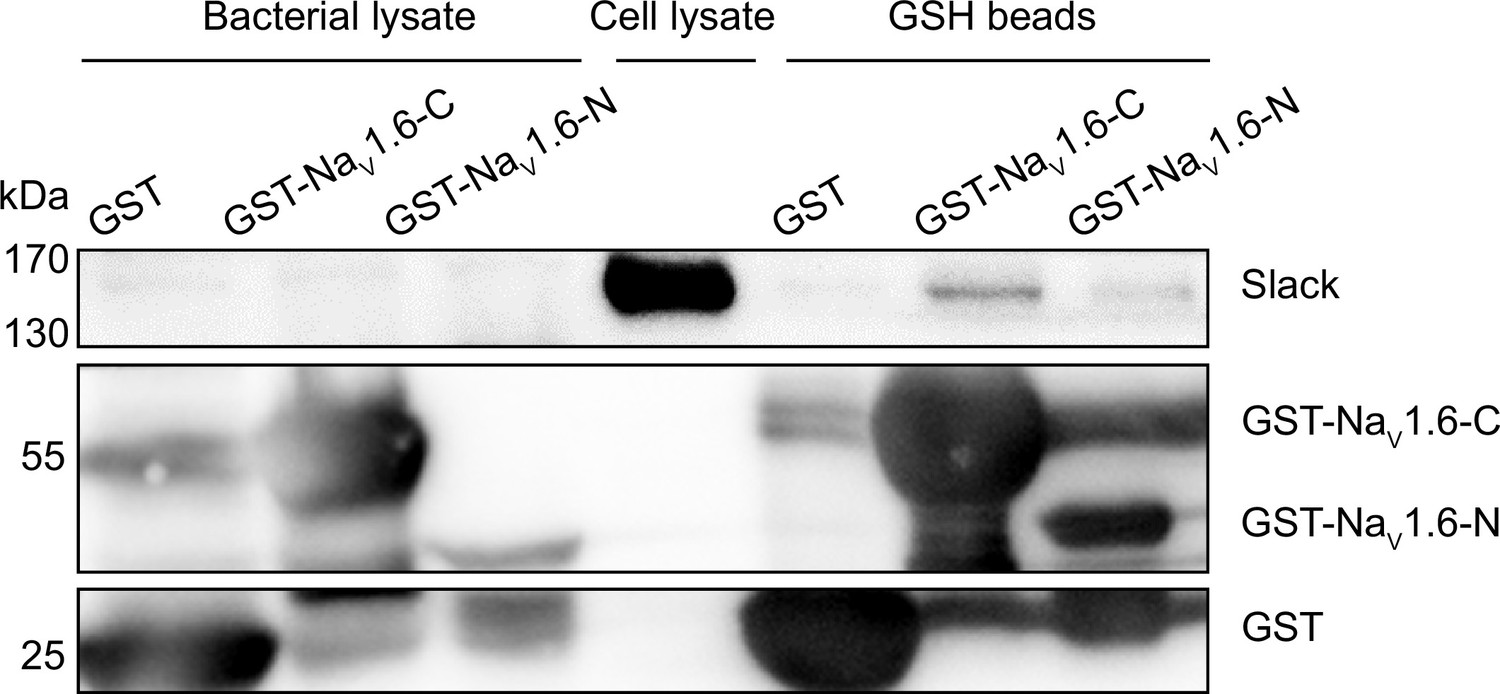
Glutathione S-transferase (GST) pull-down assay of Slack with the N- and C-termini of NaV1.6.
The GST-fused NaV1.6’s termini were separately expressed in BL21(DE3) and captured by GSH beads. The GST-fused proteins were subsequently incubated with cells lysates of HEK293T cells expressing Slack. Input (bacterial lysate) volume corresponds to 20% of the total lysates for pull down.
Figure 4 with 1 supplement
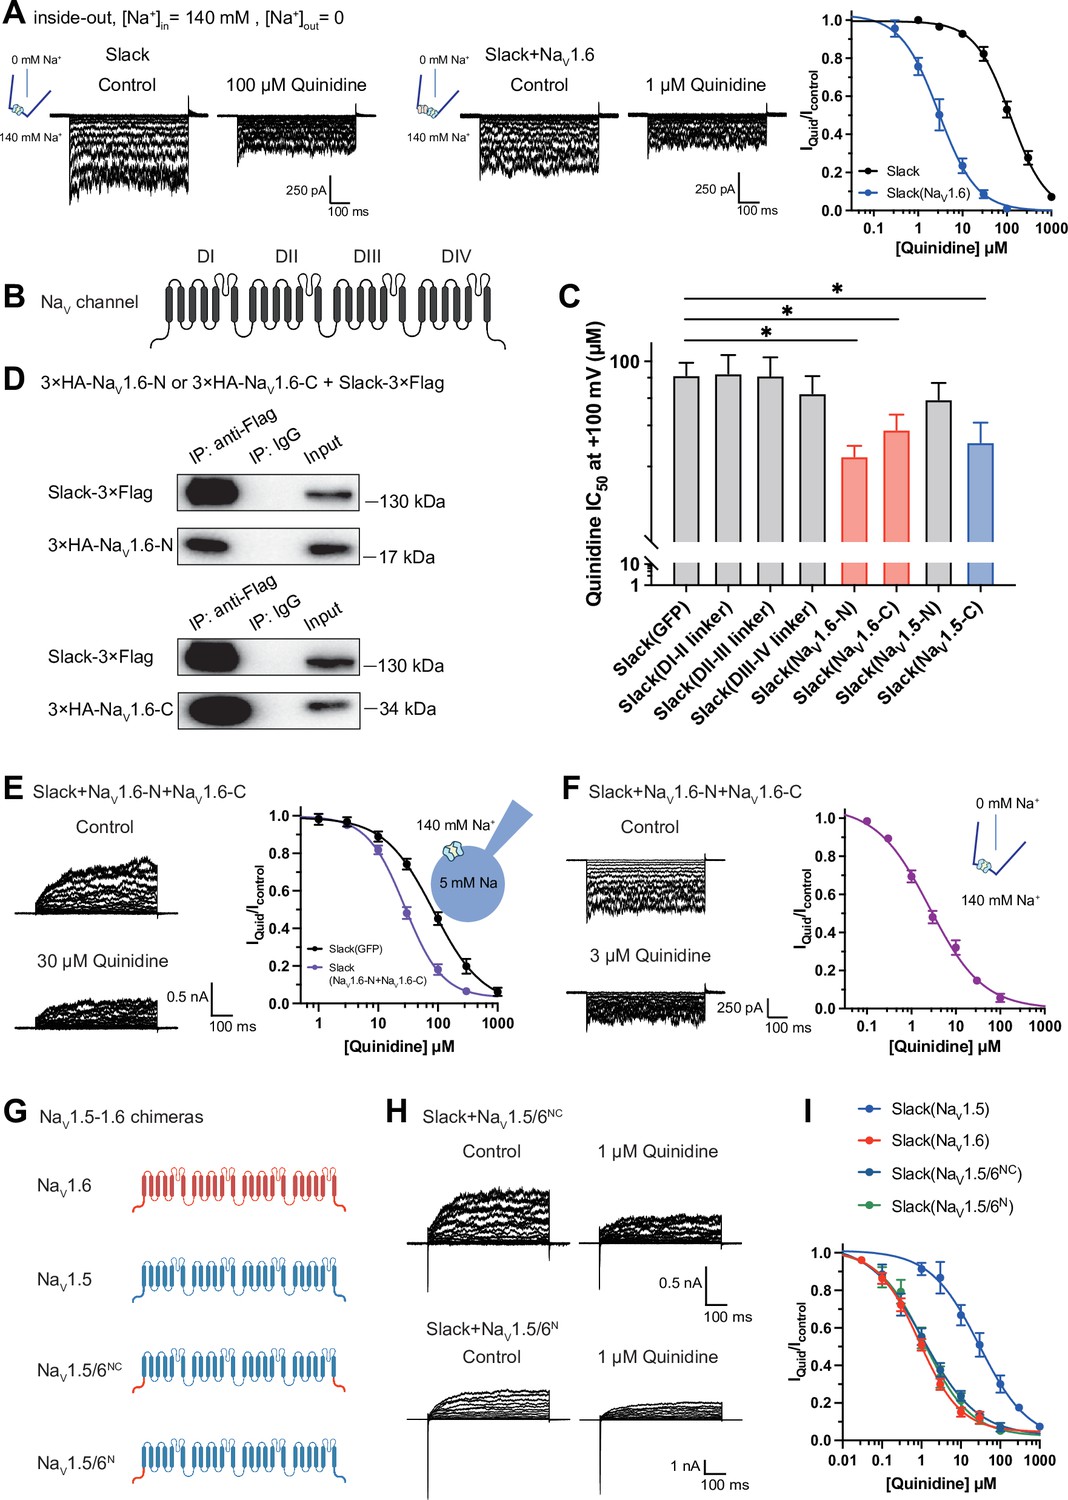
NaV1.6’s N- and C-termini interacting with Slack is a prerequisite for NaV1.6-mediated sensitization of Slack to quinidine blockade.
(A) The sensitivity of Slack to quinidine blockade upon expression of Slack alone (n = 3) and co-expression of Slack with NaV1.6 (n = 3) from excised inside-out patches. The pipette solution contained (in mM) 130 KCl, 1 EDTA, 10 HEPES, and 2 MgCl2 (pH 7.3); the bath solution contained (in mM) 140 NaCl, 1 EDTA, 10 HEPES, and 2 MgCl2 (pH 7.4). The membrane voltage was held at 0 mV and stepped to voltages varying from −100 mV to 0 mV in 10 mV increments. Example current traces are shown on the left panel. The concentration–response curves for blocking of Slack by quinidine are shown on the right panel. (B) Domain architecture of the human NaV channel pore-forming α subunit. (C) Calculated IC50 values at +100 mV of quinidine on Slack upon co-expression with indicate cytoplasmic fragments from NaV channels. For NaV1.6, cytoplasmic fragments used include N-terminus (NaV1.6-N, residues 1–132), inter-domain linkers (domain I–II linker, residues 409–753; domain II–III linker, residues 977–1199; domain III–IV linker, residues 1461–1523), and C-terminus (NaV1.6-C, residues 1766–1980). For NaV1.5, cytoplasmic fragments used include N-terminus (NaV1.5-N, residues 1–131) and C-terminus (NaV1.5-C, residues 1772–2016). (D) Co-IP of Slack and terminal domains of NaV1.6 in cell lysates from HEK293T cells co-expressing 3×Flag-tagged Slack (Slack-3×Flag) and 3×HA-tagged termini of NaV1.6 (3×HA-NaV1.6-N or 3×HA-NaV1.6-C). The 3×Flag tag was fused to the C-terminal region of Slack and the 3×HA tag was fused to the N-terminal region of NaV1.6’s fragments. (E) The sensitivity of Slack to quinidine blockade upon co-expression of Slack with GFP (n = 12) or N- and C-termini of NaV1.6 (n = 11), from whole-cell recordings. (F) The sensitivity of Slack to quinidine blockade upon co-expression of Slack with N- and C-termini of NaV1.6, from excised inside-out recordings (n = 10, using the same protocols as in A). Example current traces before and after application of quinidine are shown on the left panel. The concentration–response curves are shown on the right panel. (G) A schematic diagram of the NaV1.5–1.6 chimeric channels (NaV1.5/6NC and NaV1.5/6N) used in this study. (H) Example current traces recorded from HEK293 cells co-expressing Slack and NaV1.5–1.6 chimeras before and after application of the indicated concentration of quinidine. (I) The concentration–response curves for blocking of Slack by quinidine upon co-expression of Slack with NaV1.5 (n = 9), NaV1.6 (n = 19), NaV1.5/6NC (n = 9), or NaV1.5/6N (n = 9).
-
Figure 4—source data 1
Numerical data for Figure 4 and Figure 4—figure supplement 1.
- https://cdn.elifesciences.org/articles/87559/elife-87559-fig4-data1-v1.xlsx
Figure 4—figure supplement 1
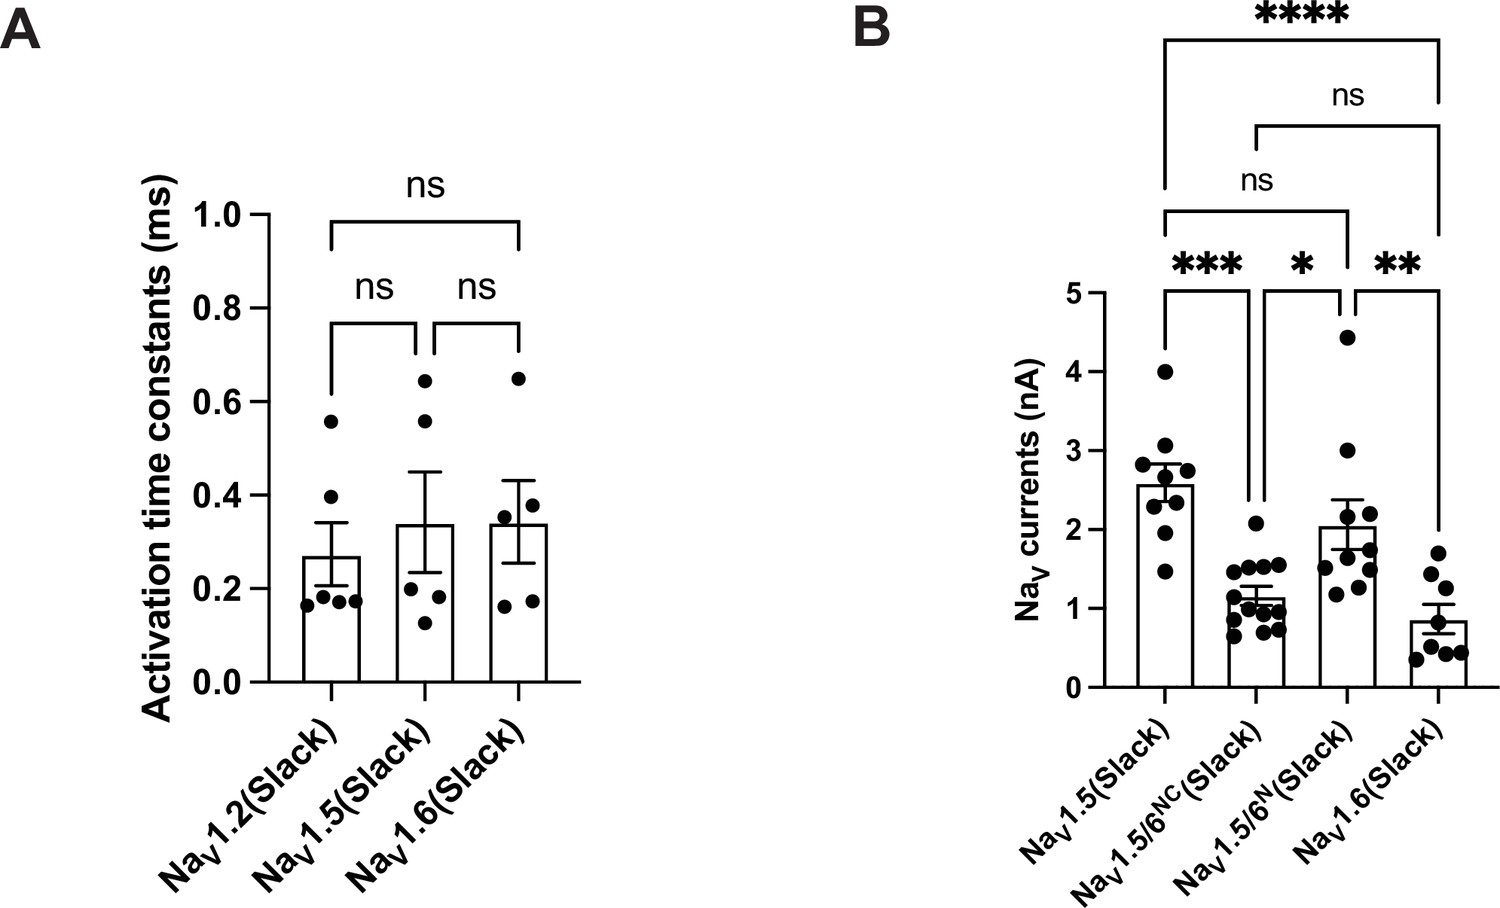
Comparison of the activation and amplitudes of NaV channel subtypes currents upon co-expressed with Slack.
(A) The activation time constants of peak sodium currents in HEK293 cells co-expressing NaV1.2 (n = 6), NaV1.5 (n = 5), and NaV1.6 (n = 5) with Slack, respectively. ns, p>0.05, one-way ANOVA followed by Bonferroni’s post hoc test. (B) Comparison of peak sodium current amplitudes of NaV1.5 (n = 9), NaV1.5/6NC (n = 13), NaV1.5/6N (n = 10), and NaV1.6 (n = 8) upon co-expressed with Slack in HEK293 cells. ns, p>0.05, *p<0.05, **p<0.01, ***p<0.001, ****p<0.0001; one-way ANOVA followed by Bonferroni’s post hoc test.
Figure 5
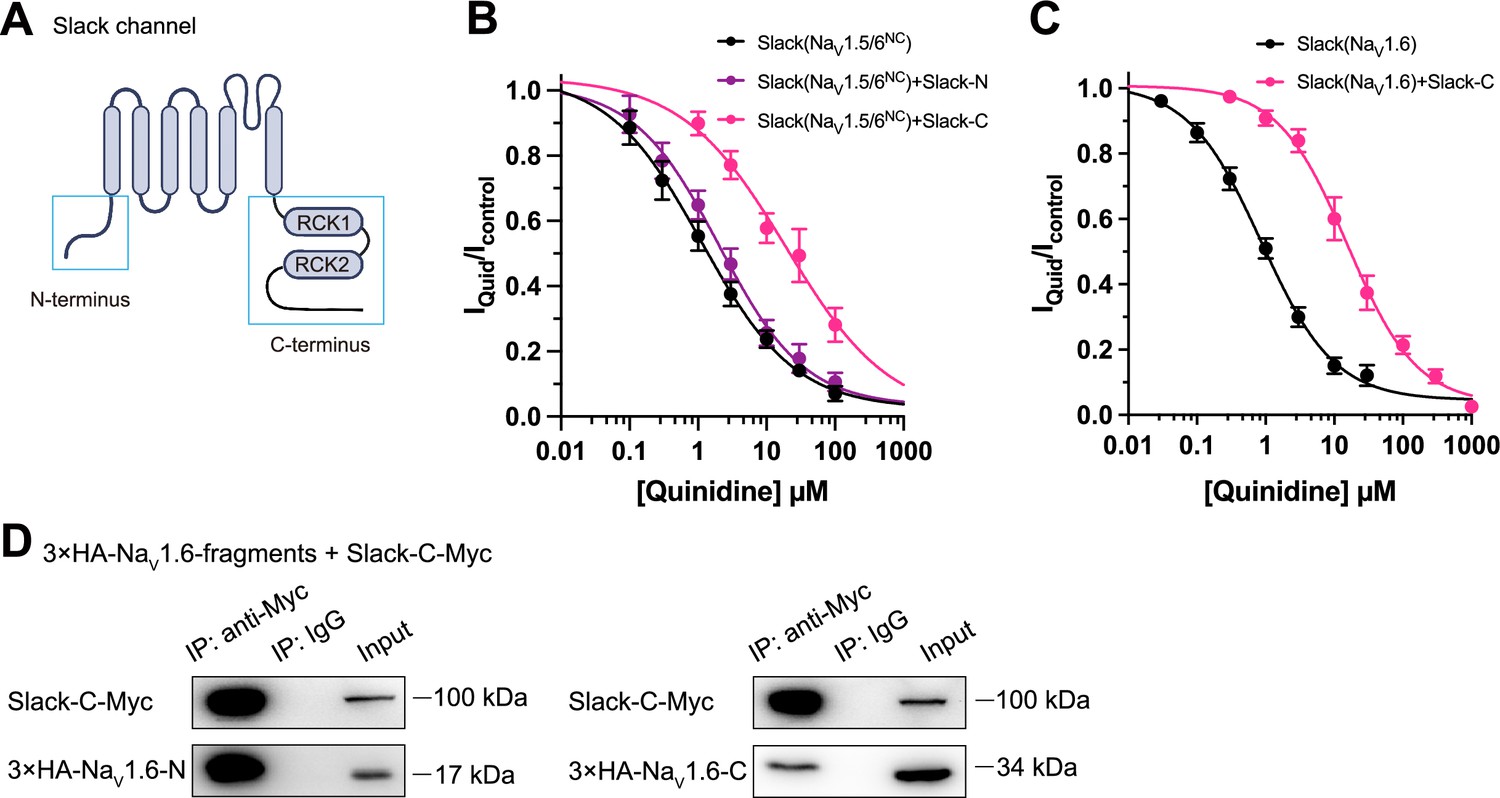
Slack’s C-terminus is required for NaV1.6-mediated sensitization of Slack to quinidine blockade.
(A) Domain architecture of the human Slack channel subunit. Slack’s N-terminus (Slack-N, residues 1–116) and C-terminus (Slack-C, residues 345–1235) are shown in the blue boxes. (B) The concentration–response curves for blocking of Slack by quinidine upon additional expression of Slack’s N- or C-terminus in HEK293T cells co-expressing Slack and NaV1.5/6NC. (C) The concentration–response curves for blocking Slack by quinidine upon additional expression of Slack’s C-terminus in HEK293 cells co-expressing Slack and NaV1.6. (D) Co-IP of Myc-tagged Slack’s C-terminus (Slack-C-Myc) with 3×HA-tagged NaV1.6’s termini (3×HA-NaV1.6-N or 3×HA-NaV1.6-C) in HEK293T cell lysates. The 3×HA tag was fused to the N-terminal region of NaV1.6’s fragments, and the Myc tag was fused to the C-terminal region of Slack’s fragment.
-
Figure 5—source data 1
Numerical data for Figure 5.
- https://cdn.elifesciences.org/articles/87559/elife-87559-fig5-data1-v1.xlsx
Figure 6 with 1 supplement
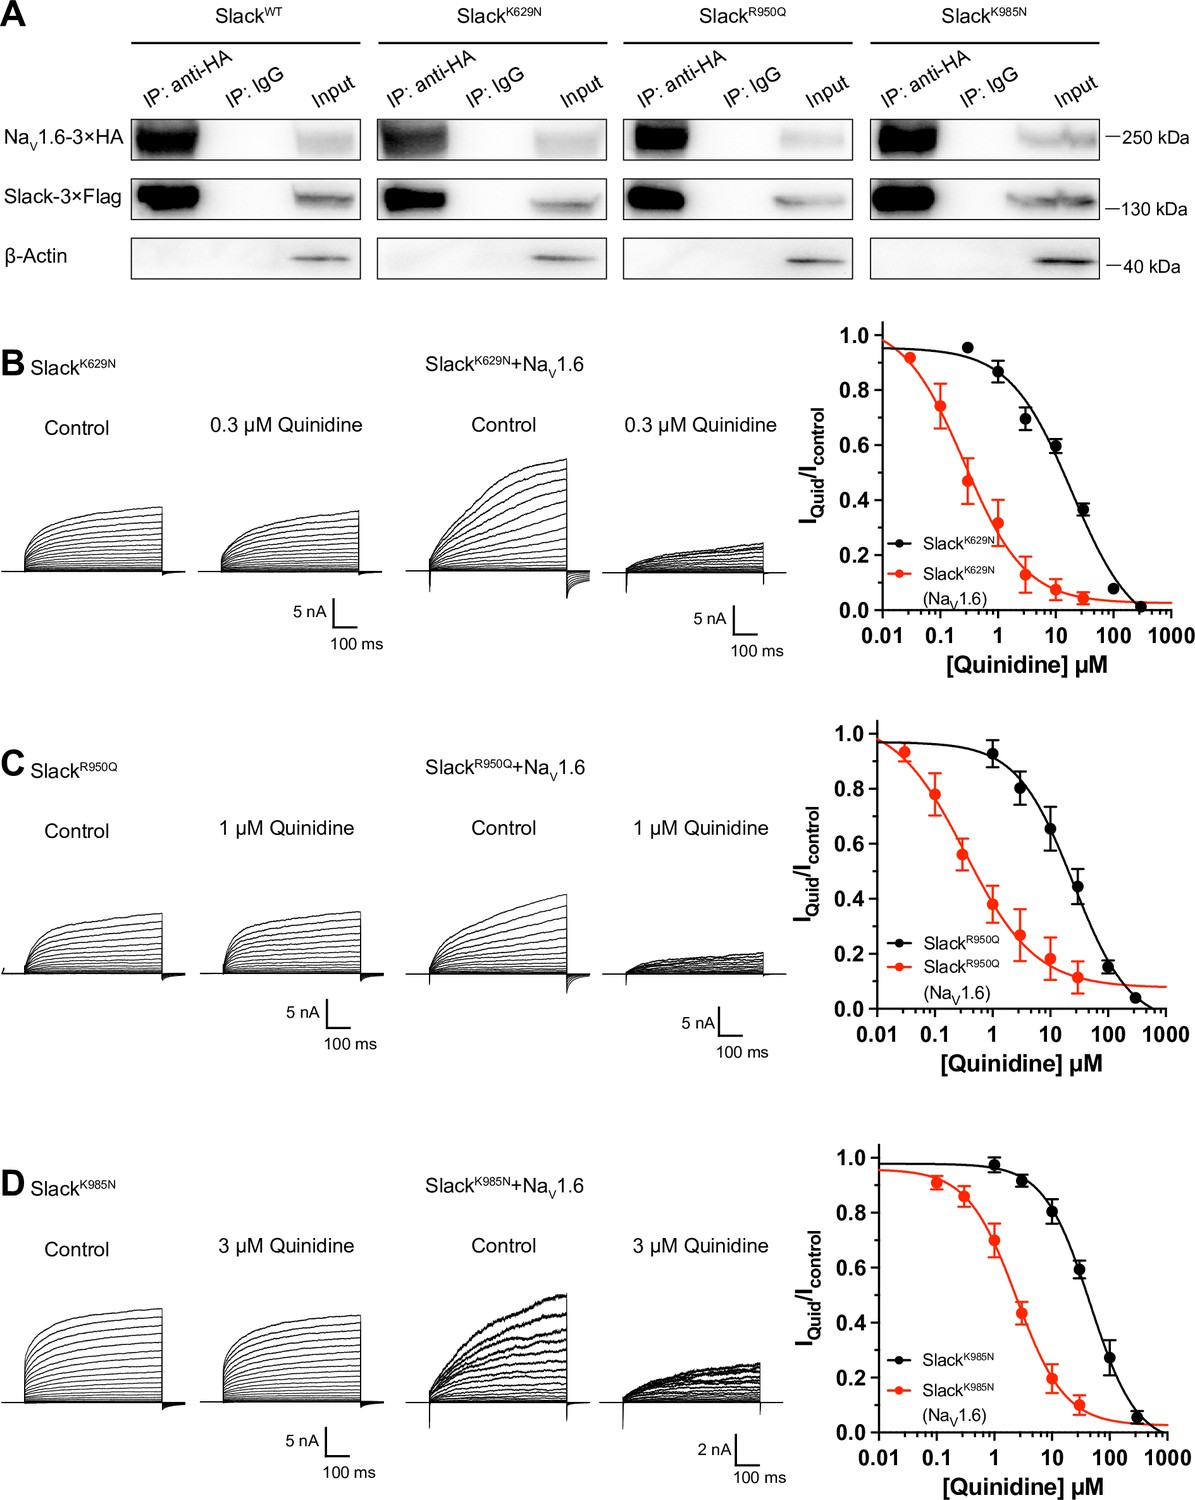
NaV1.6 sensitizes epilepsy-related Slack mutant variants to quinidine blockade.
(A) Co-IP of 3×Flag-tagged Slack or its mutations (Slack-3×Flag) with 3×HA-tagged NaV1.6 (NaV1.6–3×HA) in HEK293T cell lysates. The tags were all fused to the C-terminal region of wild-type or mutant ion channels. (B–D) The sensitivity of Slack mutant variants (SlackK629N [B], SlackR950Q [C], and SlackK985N [D]) to quinidine blockade upon expression of Slack mutant variants alone and co-expression of Slack mutant variants with NaV1.6. Left: example current traces recorded from HEK293 cells expressing Slack mutant variants alone and co-expressing Slack mutant variants with NaV1.6, before and after application of the indicated concentrations of quinidine. Right: the concentration–response curves for blocking of Slack mutant variants by quinidine upon expression of Slack mutant variants alone (n = 8 for SlackK629N, n = 7 for SlackR950Q, and n = 5 for SlackK985N) and co-expression of Slack mutant variants with NaV1.6 (n = 8 for SlackK629N upon co-expression with NaV1.6, n = 5 for SlackR950Q upon co-expression with NaV1.6, and n = 7 for SlackK985N upon co-expression with NaV1.6). Please refer to Supplementary file 1d for IC50 values.
-
Figure 6—source data 1
Numerical data for Figure 6 and Figure 6—figure supplement 1.
- https://cdn.elifesciences.org/articles/87559/elife-87559-fig6-data1-v1.xlsx
Figure 6—figure supplement 1
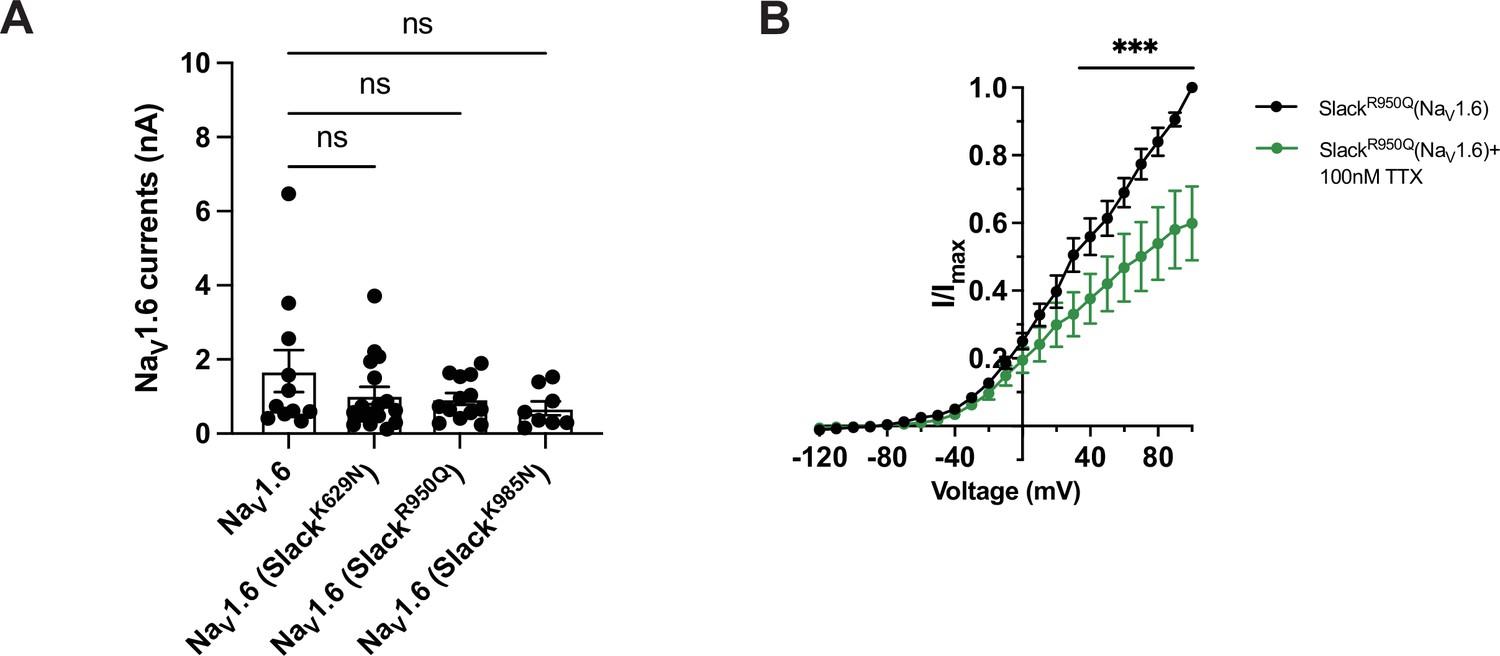
The Na+-mediated currents coupling of Slack mutant variants and NaV1.6 upon co-expression in HEK293 cells.
(A) Comparison of NaV1.6 sodium current amplitudes upon expression of NaV1.6 alone (n = 11) and co-expression of NaV1.6 with epilepsy-related Slack mutant variants (SlackK629N [n = 17], SlackR950Q [n = 13], and SlackK985N [n = 8]). ns, p>0.05, one-way ANOVA followed by Bonferroni’s post hoc test. (B) The current amplitudes of SlackR950Q before (black) and after (green) bath application of 100 nM tetrodotoxin (TTX) upon co-expression with NaV1.6 in HEK293 cells (n = 5). ***p<0.001, two-way repeated-measures ANOVA followed by Bonferroni’s post hoc test.
Figure 7 with 1 supplement

Viral expression of Slack’s C-terminus prevents SlackG269S-induced seizures.
(A, B) The current densities of Slack mutant variants (SlackG288S [A] and SlackR398Q [B]) upon co-expression with NaV1.5/6NC in HEK293T cells were reduced by additional expression of Slack’s C-terminus. Left: example current traces from HEK293T cells co-expressing Slack mutant variants and NaV1.5/6NC or co-expressing Slack mutant variants, NaV1.5/6NC, and Slack’s C-terminus. Right: summarized current densities at +100 mV. *p<0.05, **p<0.01, ***p<0.001; one-way ANOVA followed by Bonferroni’s post hoc test. (C) Architecture for expression cassettes of AAVs. (D) Top: study design and timeline for the stereotactic injection model. Bottom: immunofluorescence of HA-tagged SlackG269S (green), 3×Flag-tagged Slack’s C-terminus (red), and DAPI (blue) in hippocampal CA1 pyramidal cell layer at 5 wk after viral injection of SlackG269S with Slack’s C-terminus into CA1 of mice. (E) Time course of kainic acid (KA)-induced seizure stage changes at 10 min intervals based on a modified Racine, Pinal, and Rovner scale (please refer to ‘Methods’ for further details). The number of mice used: ‘GFP’ control group (n = 11), ‘SlackG269S+GFP’ group (n = 12), ‘SlackG269S+Slack-C’ group (n = 12). ‘GFP” vs. “SlackG269S+GFP’: F(1,21) = 10.48, p= 0.0040, *p<0.05, **p<0.01; ‘SlackG269S+GFP’ vs. ‘SlackG269S+Slack-C’: F(1,22) = 10.30, p= 0.0040, #p<0.05, ##p<0.01. ‘GFP’ vs. ‘SlackG269S+Slack-C’: F(1,21) = 0.09574, p= 0.7600. Repeated two-way ANOVA followed by Bonferroni’s post hoc test. (F) Total seizure score per mouse over the 2 hr after KA injection of these three groups. *p<0.05, **p<0.01; one-way ANOVA followed by Bonferroni’s post hoc test. (G) The percentage of mice with stage VI–IX seizures over the 2 hr after KA injection in each group. *p<0.05; Fisher’s exact test.
-
Figure 7—source data 1
Numerical data for Figure 7 and Figure 7—figure supplement 1.
- https://cdn.elifesciences.org/articles/87559/elife-87559-fig7-data1-v1.xlsx
Figure 7—figure supplement 1
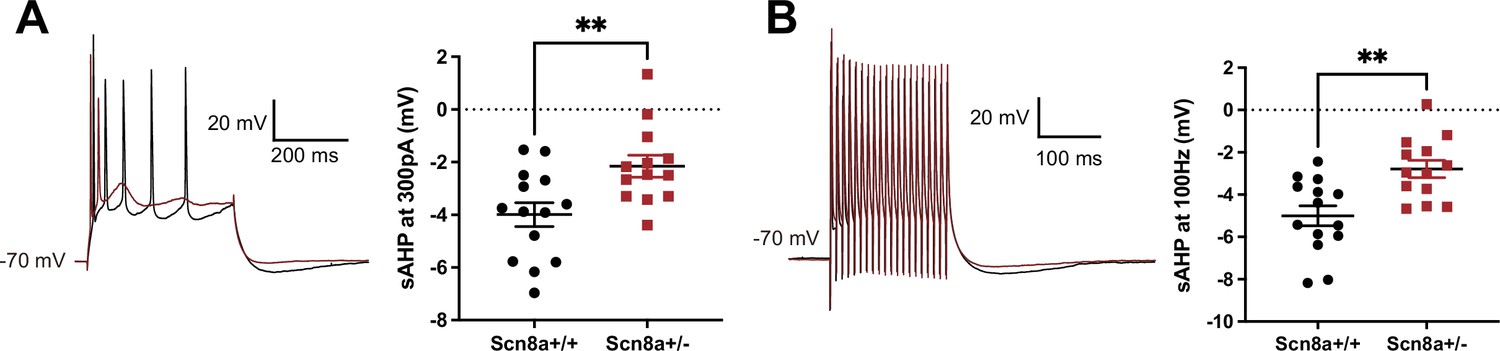
Heterozygous knockout of NaV1.6 decreases the amplitude of slow afterhyperpolarization (AHP) in hippocampal CA1 pyramidal neurons.
(A) Action potentials elicited at 300 pA followed by a slow AHP in wild-type (WT) neurons (n = 14, black) and heterozygous NaV1.6 knockout (Scn8a+/-) neurons (n = 13, red). The amplitude of slow AHP reduced in the Scn8a+/- neurons. **p<0.01; unpaired two-tailed Student’s t-test. (B) Action potentials elicited in the 100 Hz pulse train followed by a slow AHP in WT (n = 14, black) and Scn8a+/- neurons (n = 13, red). The amplitude of slow AHP reduced in the Scn8a+/- neurons. **p<0.01; unpaired two-tailed Student’s t-test.
Figure 8

Model for protection against seizures by quinidine blockade or disruption of the Slack-NaV1.6 interaction.
The axon initial segments (AIS)-localized Slack-NaV1.6 complex provides a plausible explanation for NaV1.6-mediated sensitization of Slack to quinidine blockade. This sensitization requires physical interaction between NaV1.6 and Slack and NaV1.6-mediated sodium influx. Moreover, disruption of the Slack-NaV1.6 interaction by expression of Slack’s C-terminus reduces the amount of Na+ in the close vicinity of Slack and thus reduces Slack currents. Therefore, the blocking of Slack by quinidine and disruption of the Slack-NaV1.6 interaction can both convert the gain-of-function phenotypes of epilepsy-related Slack mutant variants and protect against seizures.
Author response image 1

The activation time constants of peak sodium currents in HEK293 cells co-expressing NaV1.
2 (n = 6), NaV1.5 (n = 5), and NaV1.6 (n = 5) with Slack, respectively. ns, p > 0.05, one-way ANOVA followed by Bonferroni’s post hoc test.
Author response image 2

Comparison of peak sodium current amplitudes of NaV1.
5 (n = 9), NaV1.5/6NC (n = 13), NaV1.5/6N (n = 10), and NaV1.6 (n = 8) upon co-expressed with Slack in HEK293 cells. ns, p > 0.05, * p < 0.05, ** p < 0.01, *** p < 0.001, **** p < 0.0001; one-way ANOVA followed by Bonferroni’s post hoc test.
Author response image 3

The correlation between the inhibitory effect of quinidine and the amplitudes of baseline IKNa in WT neurons (data from manuscript Figure 1K).
r = 0.1555, p=0.6294, Pearson correlation analysis.
Author response image 4

The amplitudes of IKNa in WT and NaV1.
6-KO neurons (data from manuscript Figure 1K). ns, p > 0.05, unpaired two-tailed Student’s t test.
Author response image 5

The amplitudes of NaV1.
6 sodium currents upon co-expression of NaV1.6 with epilepsy-related Slack mutant variants (SlackK629N, SlackR950Q, and SlackK985N). ns, p>0.05, oneway ANOVA followed by Bonferroni’s post hoc test.
Author response image 6

The current amplitudes of SlackR950Q before and after bath-application of 100 nM TTX upon co-expression with NaV1.
6 in HEK293 cells (n = 5). ***p < 0.001, Two-way repeated measures ANOVA followed by Bonferroni’s post hoc test.
Additional files
-
Supplementary file 1
The IC50 values for quinidine sensitivity and kinetic characteristics of Slack and NaV1.x channels.
(a) The sensitivity of Slack to quinidine blockade upon expression of Slack alone and co-expression of Slack with NaV1.x. (b) The sensitivity of NaV channel subtypes to quinidine blockade upon expression of NaV1.x alone and co-expression of NaV1.x with Slack. (c) Biophysical characteristics of NaV1.6 expressed alone and NaV1.6 upon co-expression with Slack. (d) The sensitivity of Slack mutant variants to quinidine blockade upon expression of Slack mutant variants alone and co-expression of Slack mutant variants with NaV1.6.
- https://cdn.elifesciences.org/articles/87559/elife-87559-supp1-v1.docx
-
MDAR checklist
- https://cdn.elifesciences.org/articles/87559/elife-87559-mdarchecklist1-v1.docx
Download links
A two-part list of links to download the article, or parts of the article, in various formats.
Downloads (link to download the article as PDF)
Open citations (links to open the citations from this article in various online reference manager services)
Cite this article (links to download the citations from this article in formats compatible with various reference manager tools)
Coupling of Slack and NaV1.6 sensitizes Slack to quinidine blockade and guides anti-seizure strategy development
eLife 12:RP87559.
https://doi.org/10.7554/eLife.87559.4


