ER-to-lysosome Ca2+ refilling followed by K+ efflux-coupled store-operated Ca2+ entry in inflammasome activation and metabolic inflammation
- Severance Biomedical Science Institute, Yonsei University College of Medicine, Republic of Korea
- Department of Physiology and Ion Channel Disease Research Center, Dongguk University College of Medicine, Republic of Korea
- Department of Pharmacology and Brain Korea 21 Project for Medical Sciences, Yonsei University College of Medicine, Republic of Korea
- Soonchunhyang Institute of Medi-bio Science and Division of Endocrinology, Department of Internal Medicine, Soonchunhyang University College of Medicine, Republic of Korea
- Department of Physiology, Ischemic/Hypoxic Disease Institute, Seoul National University College of Medicine, Republic of Korea
Figures
Figure 1 with 1 supplement
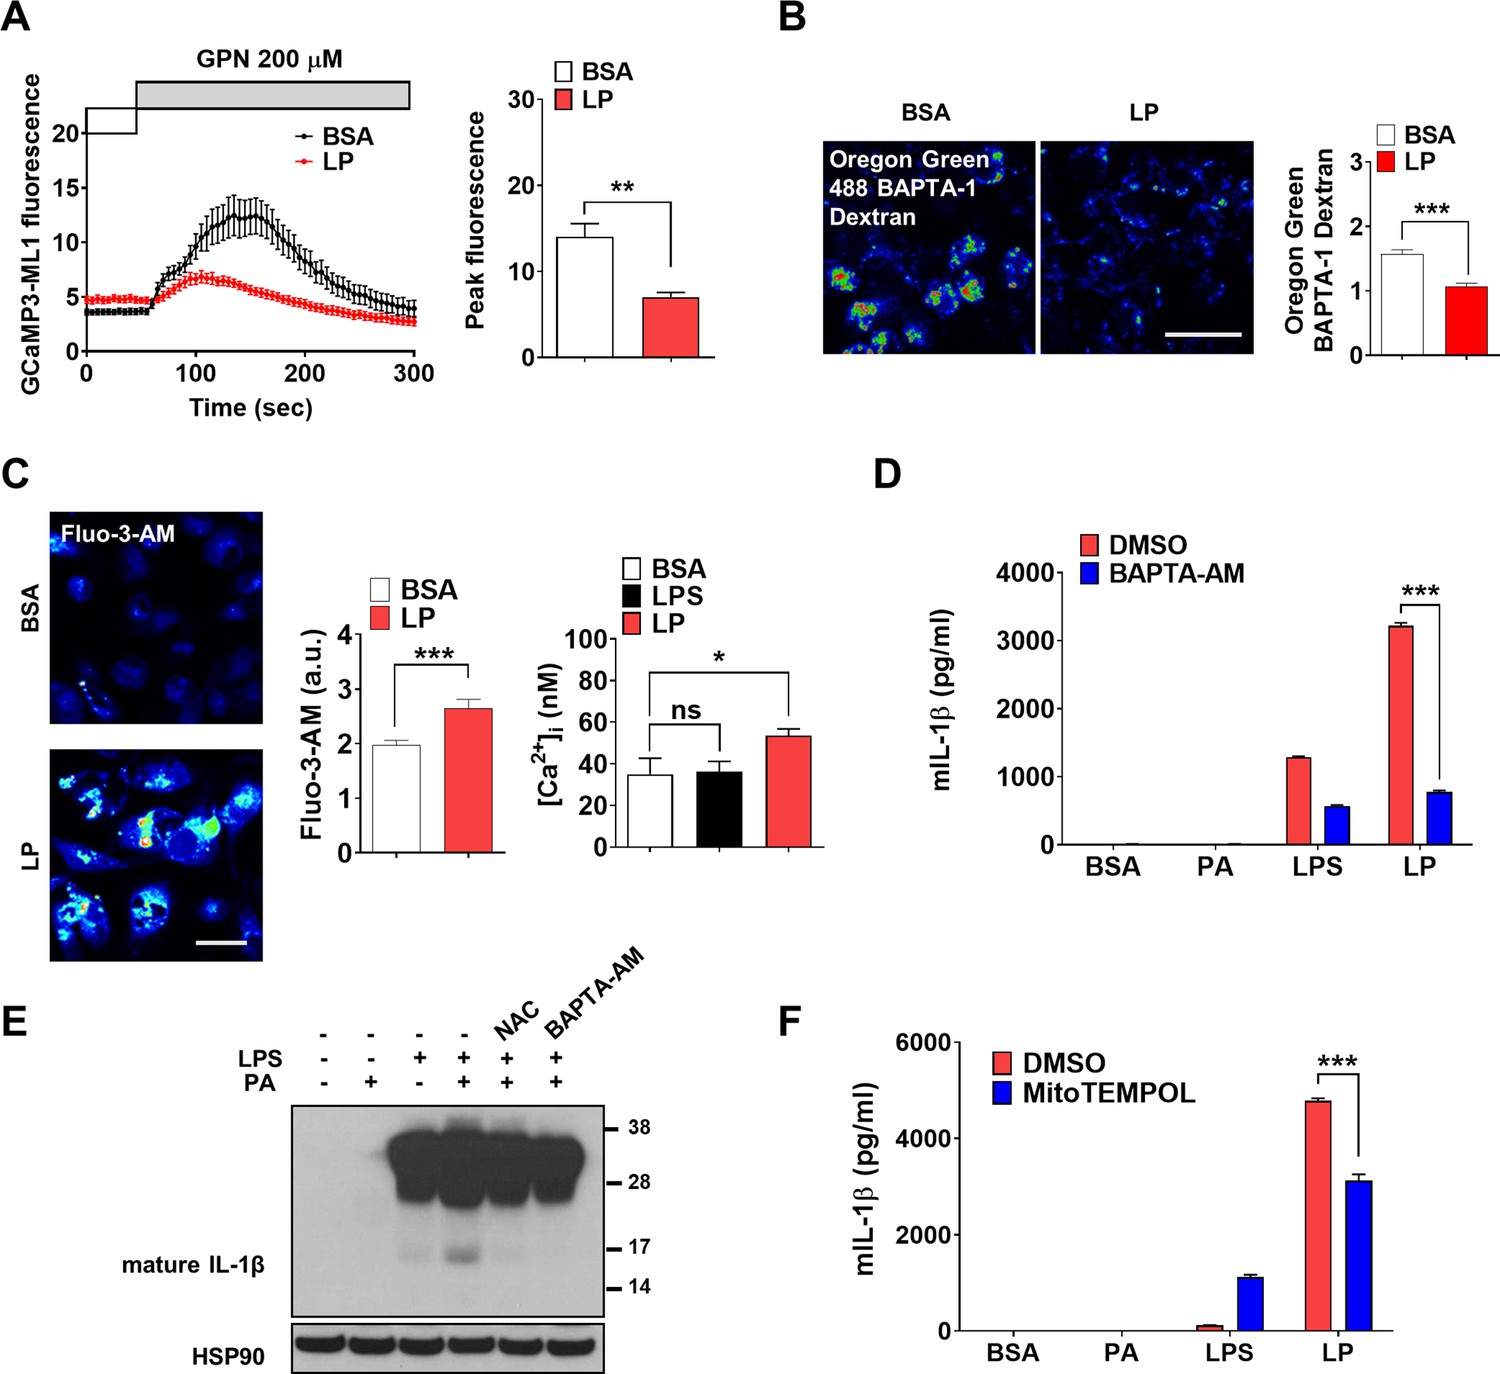
Lysosomal Ca2+ and mitochondrial reactive oxygen species (ROS) in inflammasome.
(A) Perilysosomal fluorescence after applying GPN to GCaMP3-ML1-transfected bone marrow-derived macrophages (BMDMs) treated with LP for a total of 4 hr including lipopolysaccharide (LPS) pretreatment for 3 hr (left) (actual LP treatment time is 1 hr). Peak fluorescence (right) (n = 6). (B) [Ca2+]Lys in Oregon Green BAPTA-1 Dextran (OGBD)-loaded MΦs treated with LP for a total of 4 hr including LPS pretreatment for 3 hr (right). Representative fluorescence images (left) (n = 8). (C) [Ca2+]i in MΦs treated with LP for a total of 4 hr including LPS pretreatment for 3 hr, determined using Fluo-3-AM staining (middle) or Fura-2 (right). Representative Fluo-3 images (left) (n = 7 for BSA; n = 6 for LPS; n = 13 for LP). (D) IL-1β ELISA of culture supernatant after treating peritoneal MΦs with LPS alone or palmitic acid (PA) alone for 21 hr, or with LP for a total of 21 hr including LPS pretreatment for 3 hr in the presence or absence of BAPTA-AM (n = 3). (E) Immunoblotting (IB) of lysate of peritoneal MΦs treated with LPS alone or PA alone for 21 hr, or with LP for a total of 21 hr including LPS pretreatment for 3 hr in the presence or absence of BAPTA-AM or N-acetyl cysteine (NAC), using indicated Abs. (F) IL-1β ELISA of culture supernatant after treating MΦs with LPS alone or PA alone for 21 hr, or with LP for a total of 21 hr including LPS pretreatment for 3 hr in the presence or absence of MitoTEMPOL (n = 3). Data shown as means ± SEM from more than three independent experiments. *p<0.05, **p<0.01, and ***p<0.001 by two-tailed Student’s t-test (A, B), one-way ANOVA with Tukey’s test (C), or two-way ANOVA with Sidak test (D, F) (ns, not significant). Scale bars, 20 μm.
-
Figure 1—source data 1
Original data for fluorescence and ELISA.
- https://cdn.elifesciences.org/articles/87561/elife-87561-fig1-data1-v1.xlsx
-
Figure 1—source data 2
Original uncropped blot.
- https://cdn.elifesciences.org/articles/87561/elife-87561-fig1-data2-v1.pdf
Figure 1—figure supplement 1
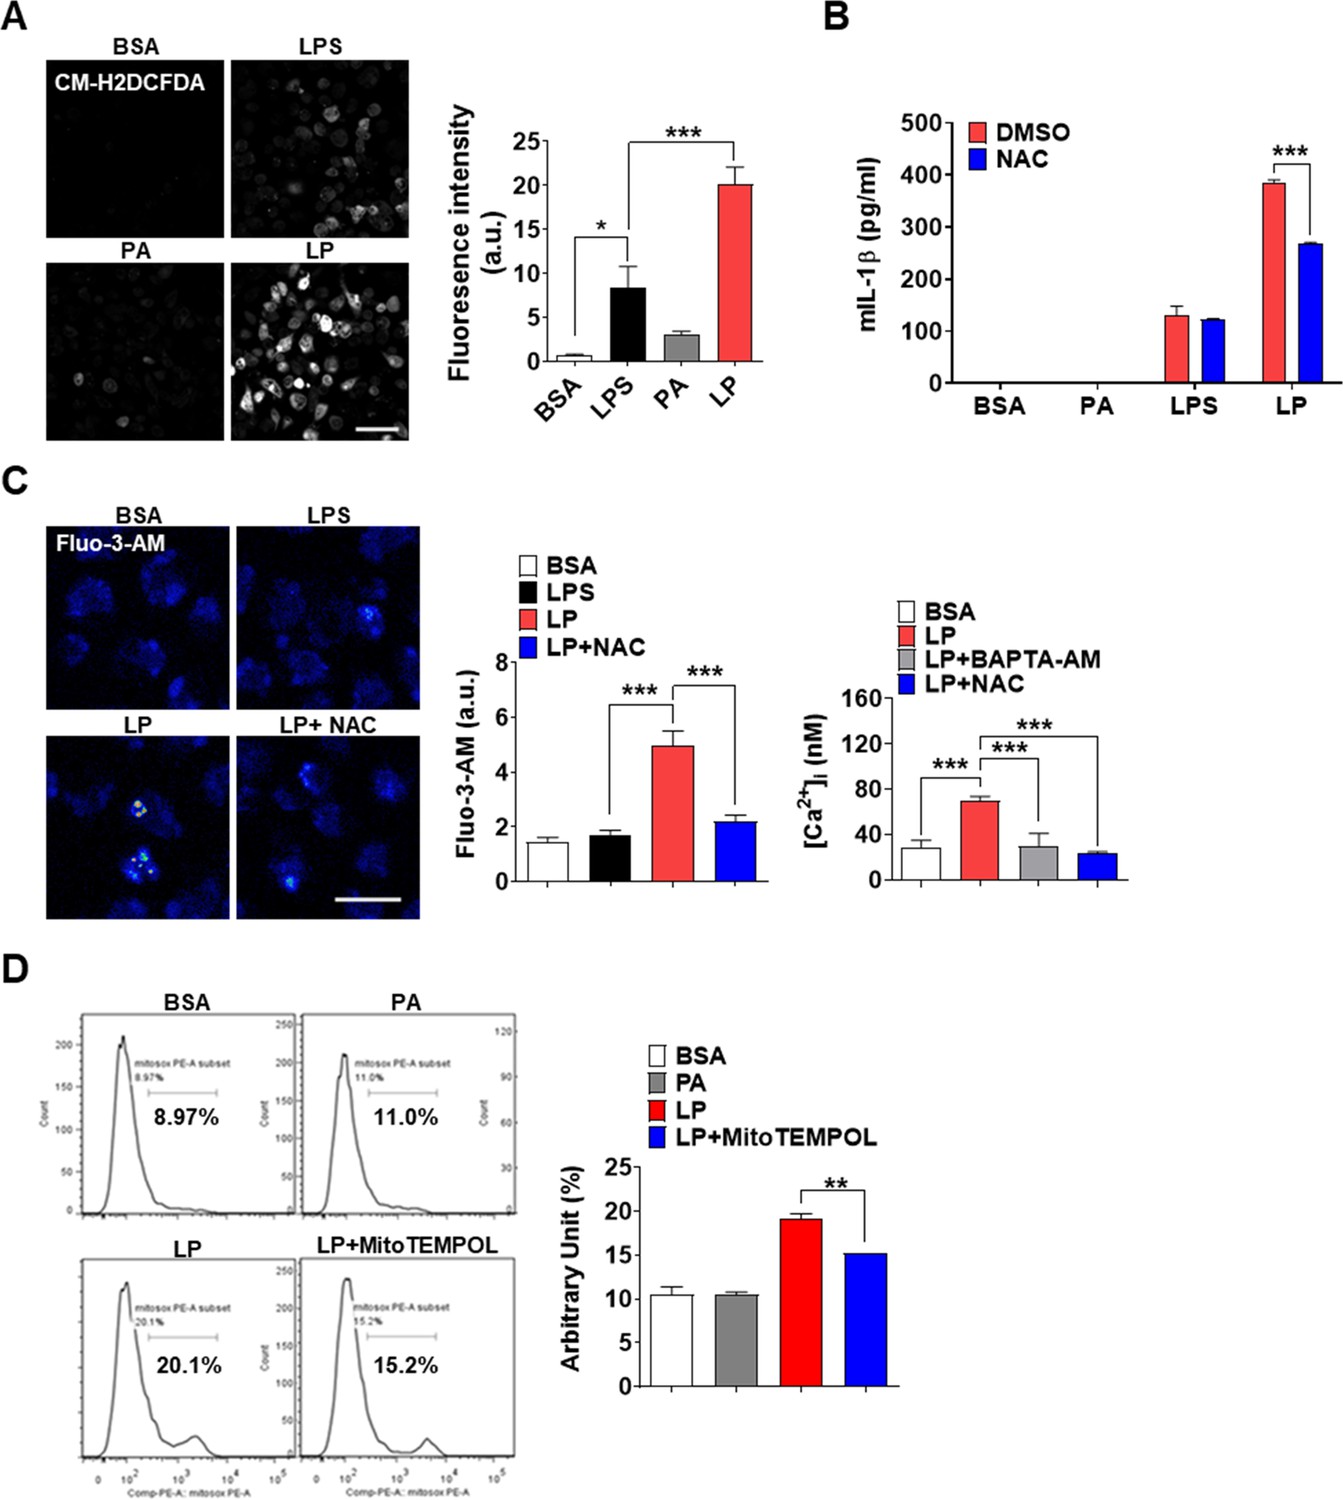
Mitochondrial reactive oxygen species (ROS) in inflammasome activation by lipopolysaccharide + palmitic acid (LPS + PA) (LP).
(A) Cellular ROS in peritoneal MΦs treated with LPS alone or PA alone for 21 hr, or LP for a total of 21 hr including LPS pretreatment for 3 hr, determined by confocal microscopy after CM-H2DCFDA loading (right). Representative confocal images (left) (scale bar, 50 μm). (B) IL-1β ELISA of culture supernatant after treating MΦs with LPS alone or PA alone for 21 hr, or with LP for a total of 21 hr including LPS pretreatment for 3 hr in the presence or absence of N-acetyl cysteine (NAC) (n = 3). (C) [Ca2+]i in MΦs treated with LPS alone for 4 hr or with LP for a total of 4 hr including LPS pretreatment for 3 hr in the presence or absence of NAC, determined by confocal microscopy after Fluo-3-AM loading (middle) or ratiometric measurement after Fura-2 loading (right). Representative Fluo-3 fluorescence images (left) (scale bar, 20 μm) (n = 13 for BSA, Fluo-3-AM; n = 12 for LPS, Fluo-3-AM; n = 26 for LP, Fluo-3-AM; n = 17 for LP + NAC, Fluo-3-AM; n = 19 for BSA, Fura-2; n = 23 for LP, Fura-2; n = 23 for LP + BAPTA-AM, Fura-2; n = 21 for LP + NAC, Fura-2). (D) Mitochondrial ROS in MΦs treated with PA alone for 21 hr or with LP for a total of 21 hr including LPS pretreatment for 3 hr in the presence or absence of MitoTEMPOL, determined by flow cytometry after MitoSOX staining (right). Representative histograms (left) (n = 3). Data shown as means ± SEM from more than three independent experiments. *p<0.05, **p<0.01, and ***p<0.001 by one-way ANOVA with Tukey’s test (A, C, D), or two-way ANOVA with Sidak test (B).
-
Figure 1—figure supplement 1—source data 1
Original data for fluorescence and ELISA.
- https://cdn.elifesciences.org/articles/87561/elife-87561-fig1-figsupp1-data1-v1.xlsx
Figure 2 with 1 supplement
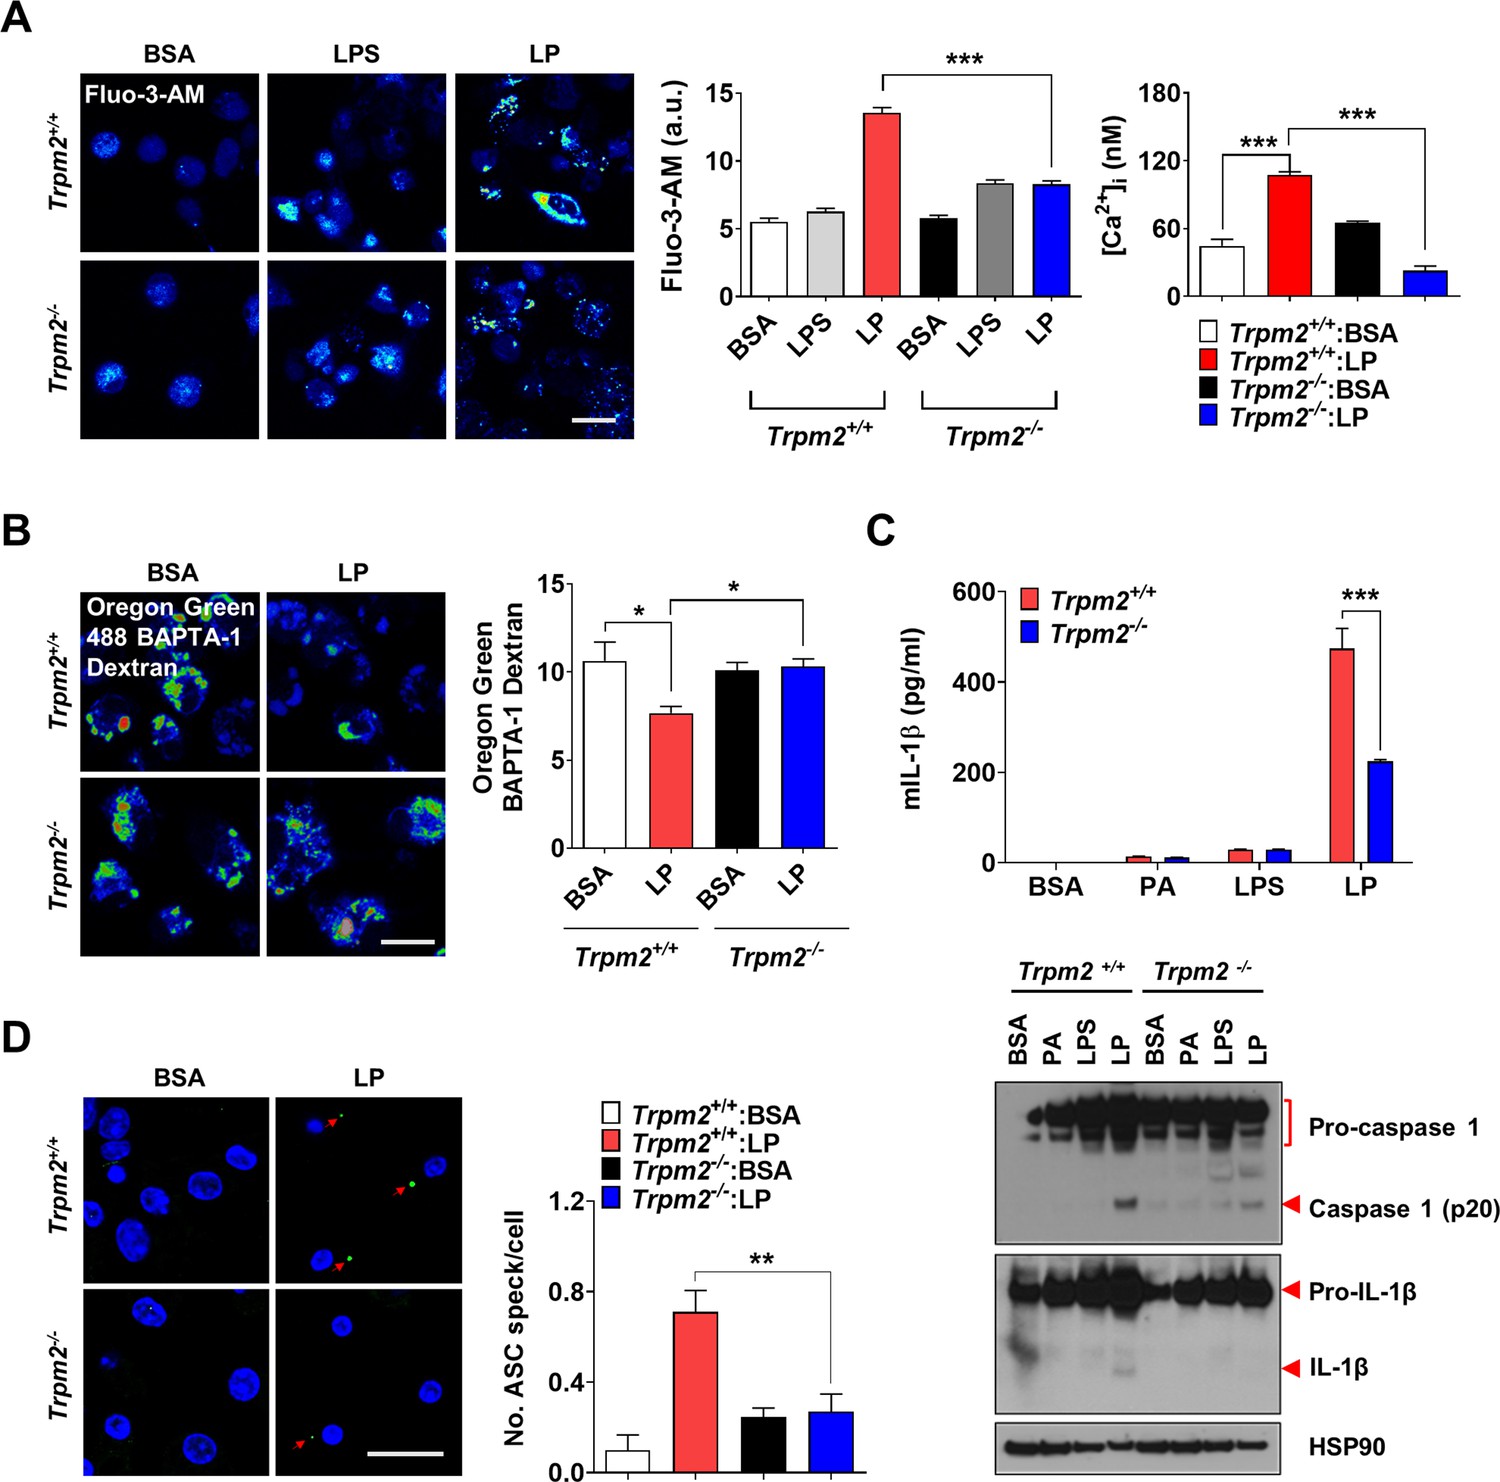
Lysosomal Ca2+ efflux through TRPM2 in inflammasome.
(A) [Ca2+]i in peritoneal MΦs treated with lipopolysaccharide (LPS) alone for 4 hr or with LP for a total of 4 hr including LPS pretreatment for 3 hr, determined using Fluo-3-AM (middle) or Fura-2 (right). Representative Fluo-3 images (left) (n = 8 for Fluo-3-AM; n = 9 for Fura-2). (B) [Ca2+]Lys in MΦs treated with LP for a total of 4 hr including LPS pretreatment for 3 hr, determined by Oregon Green BAPTA-1 Dextran (OGBD) loading (right). Representative fluorescence images (left) (n = 5) (C) IL-1β ELISA of culture supernatant (upper) and immunoblotting (IB) of cell lysate using indicated Abs after treatment of MΦs with LPS alone for 21 hr or LP for a total of 21 hr including LPS pretreatment for 3 (lower). (n = 4) (D) The number of ASC specks in MΦs treated with LP for a total of 21 hr including LPS pretreatment for 3 hr, determined by immunofluorescence using anti-ASC Ab (right). Representative confocal images (left) (n = 4 for Trpm2+/+:BSA; n = 5 for Trpm2+/+: LP; n = 5 for Trpm2-/-:BSA; n = 7 for Trpm2-/-:LP) Data shown as means ± SEM from more than three independent experiments. *p<0.05, **p<0.01, and ***p<0.001 by one-way ANOVA with Tukey’s test (A, B, D), or two-way ANOVA with Sidak test or Bonferroni test (C). Scale bars, 20 μm.
-
Figure 2—source data 1
Original data for fluorescence and ELISA.
- https://cdn.elifesciences.org/articles/87561/elife-87561-fig2-data1-v1.xlsx
-
Figure 2—source data 2
Original uncropped blot.
- https://cdn.elifesciences.org/articles/87561/elife-87561-fig2-data2-v1.pdf
Figure 2—figure supplement 1
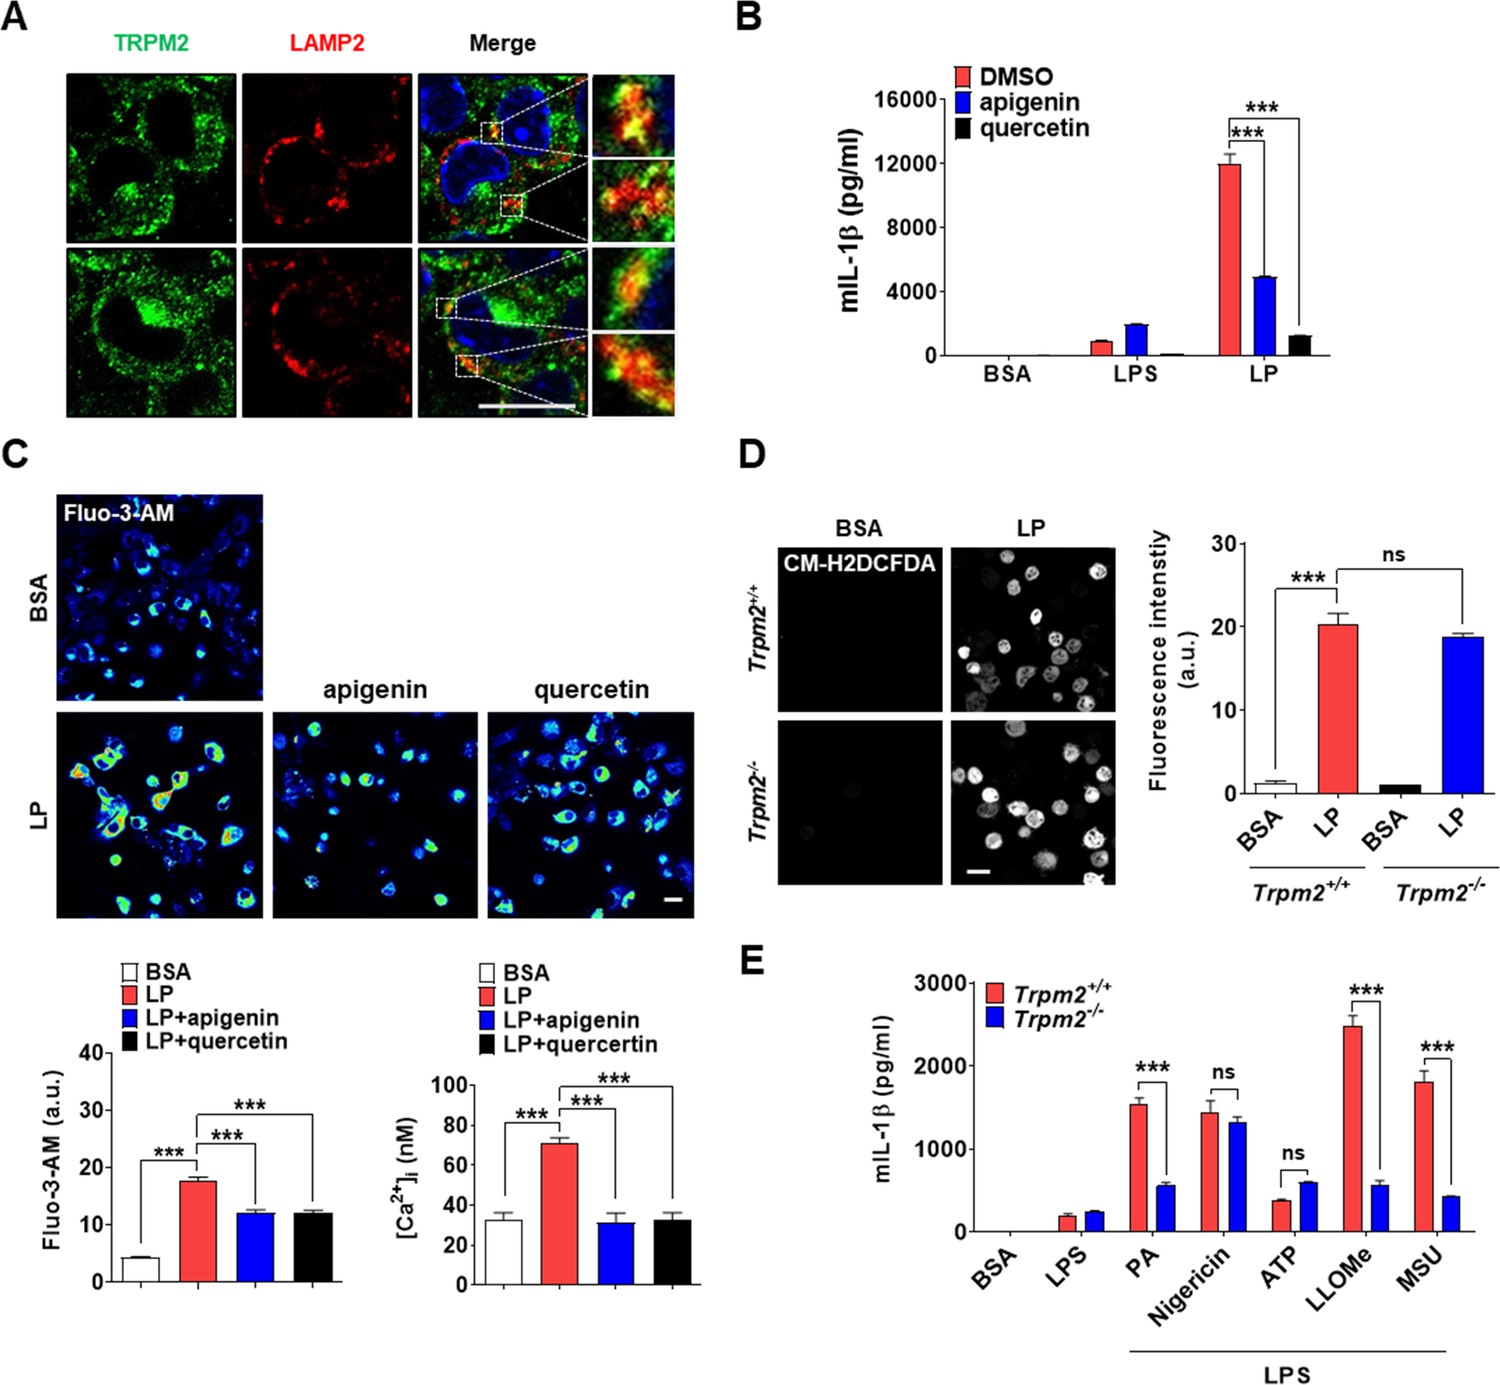
Effect of CD38 inhibitors and Trpm2 KO on inflammasome.
(A) Confocal microscopy was conducted after immunofluorescence staining of bone marrow-derived macrophages (BMDMs) using anti-TRPM2 and LAMP2 Abs. Yellow spots indicate TRPM2 on lysosome (rectangles were magnified). (B) IL-1β ELISA of culture supernatant after treating peritoneal MΦs with lipopolysaccharide (LPS) alone for 21 hr or with LP for a total of 21 hr including LPS pretreatment for 3 hr in the presence or absence of apigenin or quercetin (n = 3). (C) [Ca2+]i in peritoneal MΦs treated with LPS alone for 4 hr or with LP for a total of a 4 hr including LPS pretreatment for 3 hr in the presence or absence of apigenin or quercetin, determined by confocal microscopy after Fluo-3-AM loading (lower left) or ratiometric measurement after Fura-2 loading (lower right). Representative Fluo-3 fluorescence images (upper) (n = 4 for BSA, Fluo-3-AM; n = 4 for LP, Fluo-3-AM; n = 4 for LP + apigenin, Fluo-3-AM; n = 4 for LP + quercetin, Fluo-3-AM; n = 13 for BSA, Fura-2; n = 16 for LP, Fura-2; n = 20 for LP + apigenin, Fura-2; n = 13 for LP + quercetin, Fura-2). (D) Cellular reactive oxygen species (ROS) in MΦs from Trpm2+/+ or Trpm2-/- mice treated with LP for a total of 21 hr including LPS pretreatment for 3 hr, determined by CM-H2DCFDA staining (right). Representative fluorescence images (left) (n = 4). (E) IL-1β ELISA of culture supernatant of peritoneal MΦs from Trpm2+/+ or Trpm2-/- mice treated with PA, nigericin, ATP, L-leucyl-L-leucine methyl ester (LLOMe), and monosodium urate (MSU) for 18 hr, 45 min, 1 hr, 45 min, and 3 hr, respectively, after LPS pretreatment for 3 hr (n = 3). Data shown as means ± SEM from more than three independent experiments. ***p<0.001 by one-way ANOVA with Tukey’s test (C, D) or two-way ANOVA with Tukey’s test (B, E). Scale bar, 20 μm.
-
Figure 2—figure supplement 1—source data 1
Original data for fluorescence and ELISA.
- https://cdn.elifesciences.org/articles/87561/elife-87561-fig2-figsupp1-data1-v1.xlsx
Figure 3 with 1 supplement
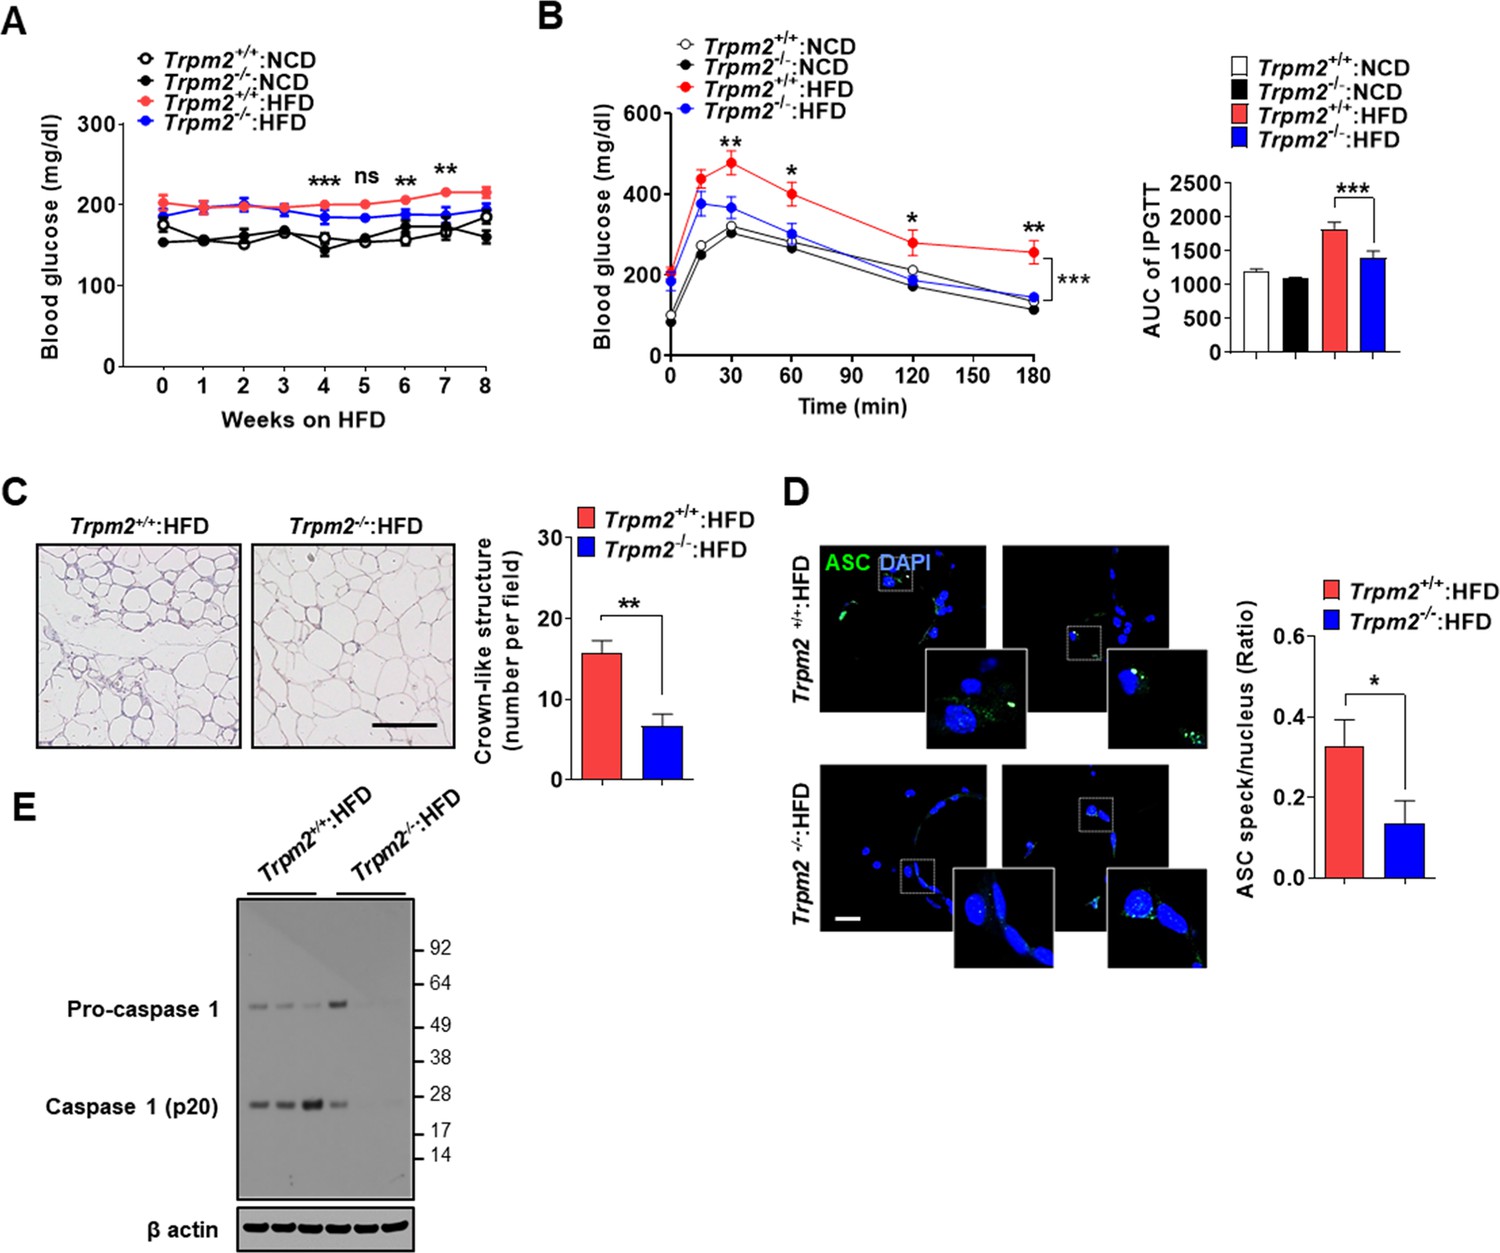
Ameliorated metabolic inflammation by Trpm2 KO.
(A) Nonfasting blood glucose of mice on normal chow diet (NCD) (n = 5 each) or high-fat diet (HFD) (n = 8 each). (*comparison between Trpm2+/+ and Trpm2-/- mice on HFD). (B) Intraperitoneal glucose tolerance test (IPGTT) after NCD (n = 5 each) or HFD (n = 8 each) feeding for 8 weeks (left). Area under the curve (AUC) (right). (C) The number of crown-like structures (CLS) in while adipose tissue (WAT) after HFD feeding for 8 weeks (right). Representative H&E sections (left) (scale bar, 50 μm) (n = 8 each). (D) The number of ASC specks in WAT after HFD feeding for 8 weeks, determined by immunofluorescence using anti-ASC Ab (right). Representative confocal images (left) (scale bar, 20 μm) (insets, magnified) (n = 7 each). (E) Immunoblotting (IB) of stromal vascular fraction (SVF) of WAT after HFD feeding for 8 weeks using indicated Abs (n = 3). Data shown as means ± SEM from more than three independent experiments. *p<0.05, **p<0.01, and ***p<0.001 by two-way ANOVA (B) or two-tailed Student’s t-test (A, C, D).
-
Figure 3—source data 1
Original data for blood glucose, and the number of CLS and ASC specks.
- https://cdn.elifesciences.org/articles/87561/elife-87561-fig3-data1-v1.xlsx
-
Figure 3—source data 2
Original uncropped blot.
- https://cdn.elifesciences.org/articles/87561/elife-87561-fig3-data2-v1.pdf
Figure 3—figure supplement 1
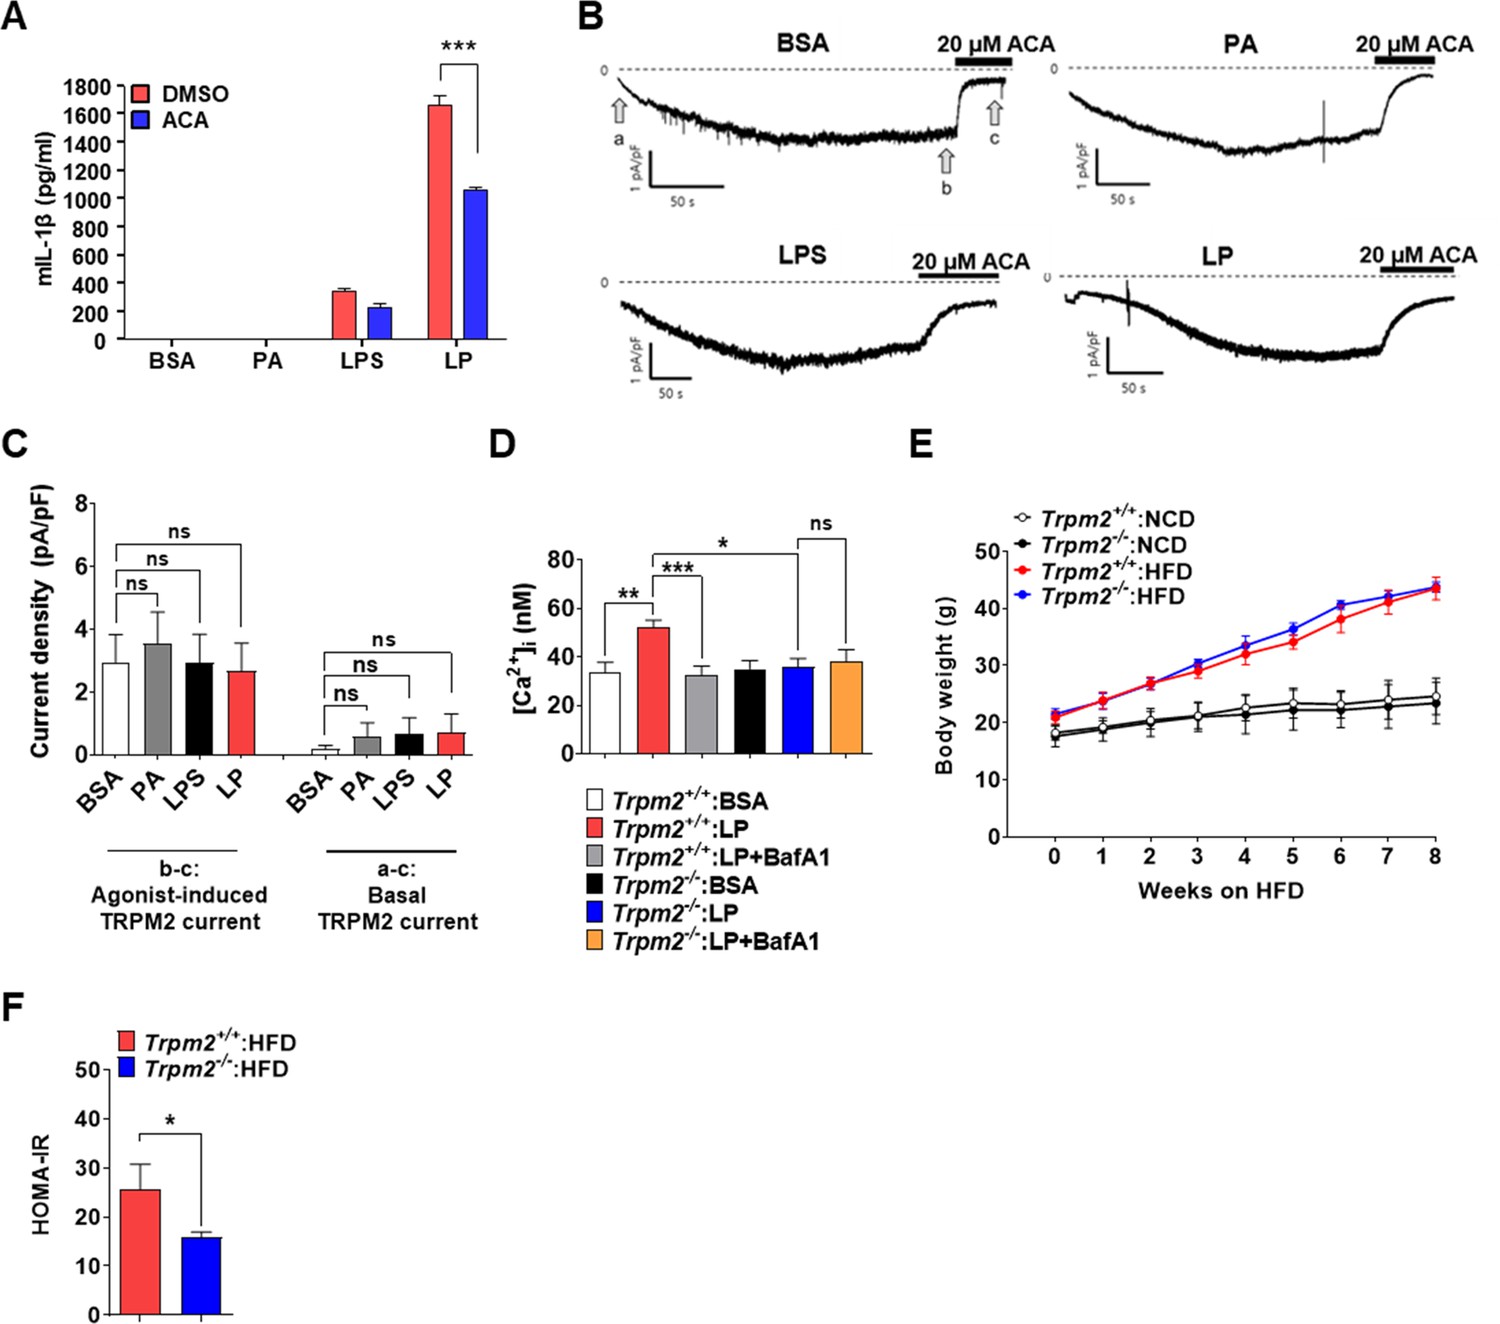
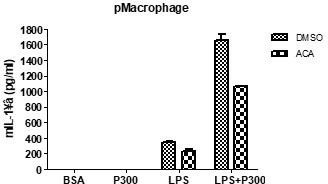
Plasma membrane TRPM2 current in MΦs and metabolic profile of Trpm2-KO mice.
(A) IL-1β ELISA of culture supernatant after treating MΦs with lipopolysaccharide (LPS) alone or palmitic acid (PA) alone for 21 hr, or with LP for a total of 21 hr including LPS pretreatment for 3 hr in the presence or absence of N‐(p‐amylcinnamoyl)anthranilic acid (ACA) (n = 3). (B) Whole-cell patch clamp recording with 200 μM of cyclic ADP-ribose (cADPR) in pipette solution. At - 60 mV of holding voltage, development of inward current representing activation of TRPM2 by diffusion of cADPR to the cytosol was monitored in MΦs treated with carrier alone (BSA), PA alone or LPS alone for 4 hr, or LP for a total of 4 hr including LPS pretreatment for 3 hr. Also, 20 μM of ACA, a selective inhibitor of TRPM2, was applied to bath solution after confirming the steady-state activity inward current. (C) Amplitude of cADPR-induced inward current (b–c in B) (left group of the bar graph), and that of basal inward current inhibited by ACA (a–c in B) (right group of the bar graph) (n = 19 for BSA; n = 9 for PA; n = 10 for LPS; n = 9 for LP). (D) [Ca2+]i in MΦs from Trpm2+/+ and Trpm2-/- mice treated with LP for 1 hr in the presence or absence of bafilomycin A1 emptying lysosomal Ca2+ reservoir after LPS pretreatment for 3 hr, determined by ratiometric measurement after Fura-2 loading (n = 10 for Trpm2+/+:BSA; n = 27 for Trpm2+/+:LP; n = 17 for Trpm2+/+:LP + BafA1; n = 10 for Trpm2-/-:BSA; n = 11 for Trpm2-/-:LP; n = 9 for Trpm2-/-:LP + BafA1) (BafA1, bafilomycin A1). (E) Body weight of Trpm2+/+ and Trpm2-/- mice on normal chow diet (NCD) (n = 5) or high-fat diet (HFD) (n = 8). (F) HOMA-IR index in Trpm2+/+ and Trpm2-/- mice fed HFD for 8 weeks (n = 5 for Trpm2+/+; n = 8 for Trpm2-/-). Data shown as means ± SEM from more than three independent experiments. *p<0.05, **p<0.01, and ***p<0.001 by one-way ANOVA with Tukey’s test (C, D, F) or two-way ANOVA with Tukey’s test (E).
-
Figure 3—figure supplement 1—source data 1
Original data for current, [Ca2+]i, body weight, and HOMA-IR.
- https://cdn.elifesciences.org/articles/87561/elife-87561-fig3-figsupp1-data1-v1.xlsx
Figure 4 with 1 supplement
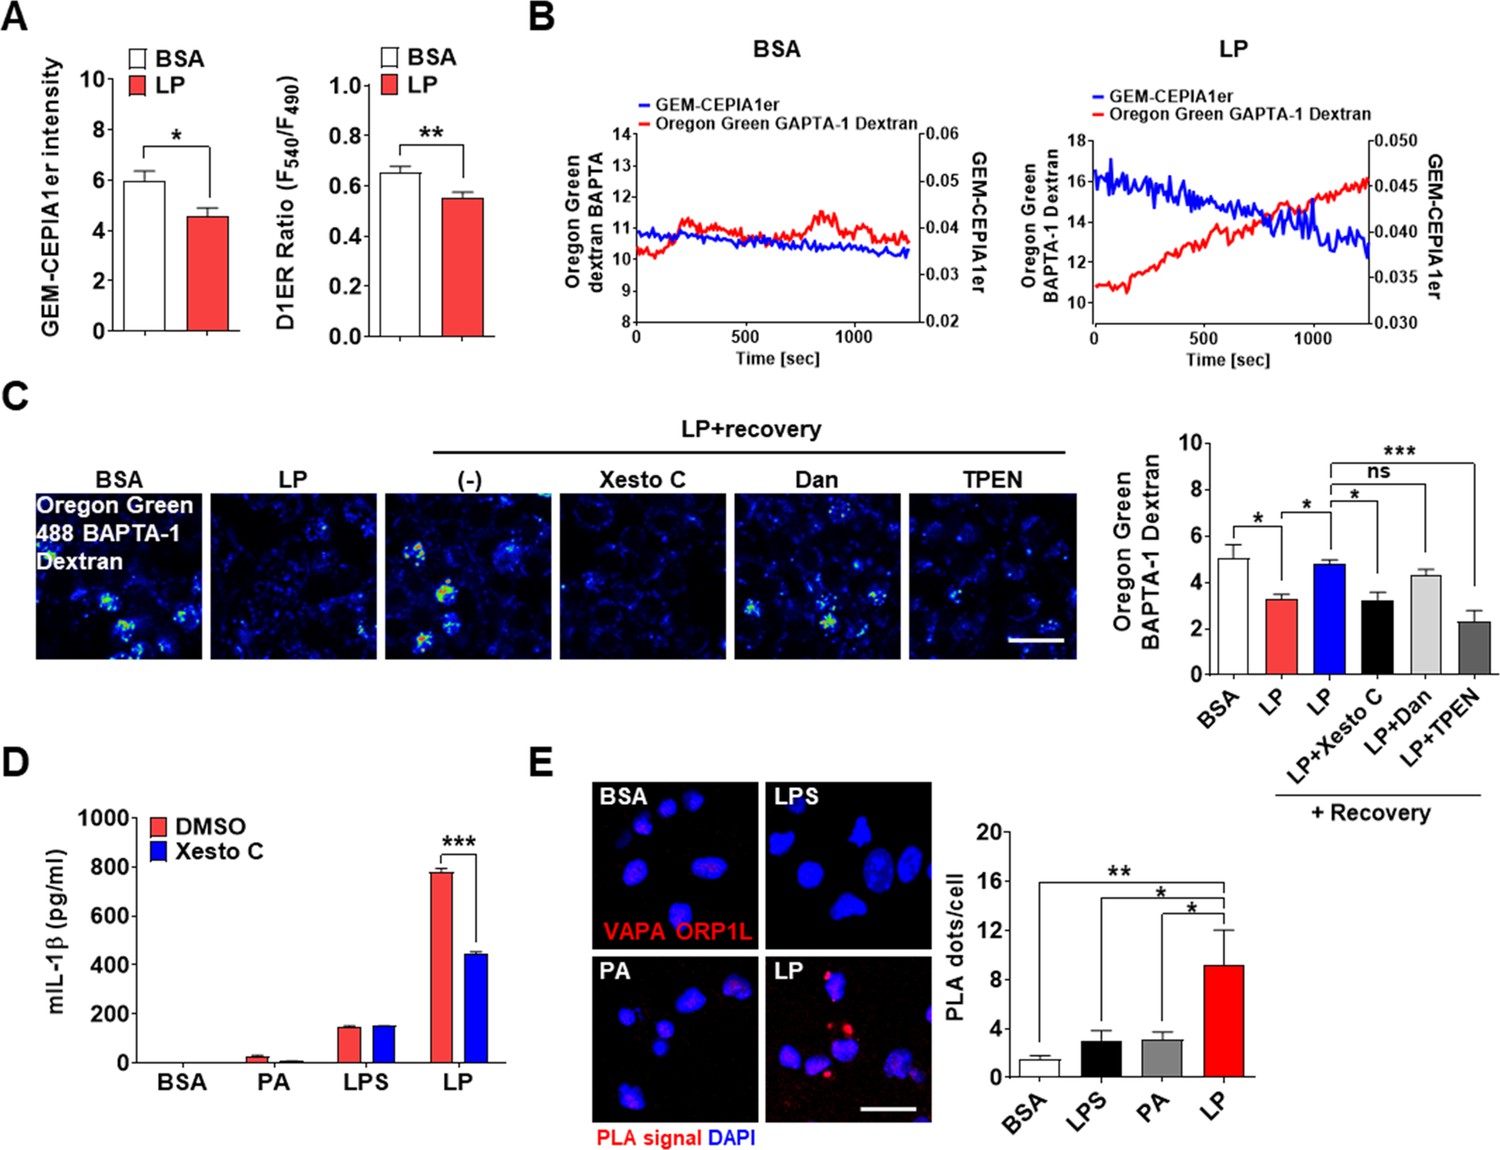
ER→lysosome Ca2+ refilling in inflammasome.
(A) [Ca2+]ER in GEM-CEPIA1er- (left) or D1ER-transfected bone marrow-derived macrophages (BMDMs) (right) treated with LP for 1 hr without extracellular Ca 2+ after lipopolysaccharide (LPS) pretreatment for 3 hr (n = 26 for BSA; n = 25 for LP). (B) BMDMs transfected with GEM-CEPIA1er and loaded with Oregon Green BAPTA-1 Dextran (OGBD) were treated with LP for 1 hr after LPS pretreatment for 3 hr (right) or BSA alone for 4 hr (left). Tracing of [Ca2+]Lys and [Ca2+]ER after change to a fresh medium without extracellular Ca2+ (n = 4 for BSA; n = 4 for LP). (C) OGBD-loaded BMDMs were treated with LP for 1 hr after LPS pretreatment for 3 hr. Recovery of [Ca2+]Lys after change to a fresh medium with or without Xestospongin C (Xesto C), dantrolene (Dan), or TPEN (right). Representative confocal images (left) (n = 9 for BSA; n = 8 for LP; n = 9 for LP + Recovery; n = 6 for LP + Recovery + Xesto C; n = 5 for LP + Recovery + Dan; n = 8 for LP + Recovery + TPEN). (D) IL-1β ELISA of culture supernatant after treating peritoneal MΦs with LPS alone or palmitic acid (PA) alone for 21 hr, or with LP for a total of 21 hr including LPS pretreatment for 3 hr, in the presence or absence of Xesto C (n = 4). (E) PLA in BMDMs treated with LPS alone or PA alone for 21 hr, or LP for a total of 21 hr including LPS pretreatment for 3 hr, using Abs to VAPA and ORP1L (right). Representative fluorescence images (left) (n = 4). Data shown as means ± SEM from more than three independent experiments. *p<0.05, **p<0.01, and ***p<0.001 by two-tailed Student’s t-test (A), one-way ANOVA with Tukey’s test (C, E) or two-way ANOVA with Sidak test (D). Scale bar, 20 μm.
-
Figure 4—source data 1
Original data for fluorescence (ratio), ELISA, and the number of PLT dots.
- https://cdn.elifesciences.org/articles/87561/elife-87561-fig4-data1-v1.xlsx
Figure 4—figure supplement 1
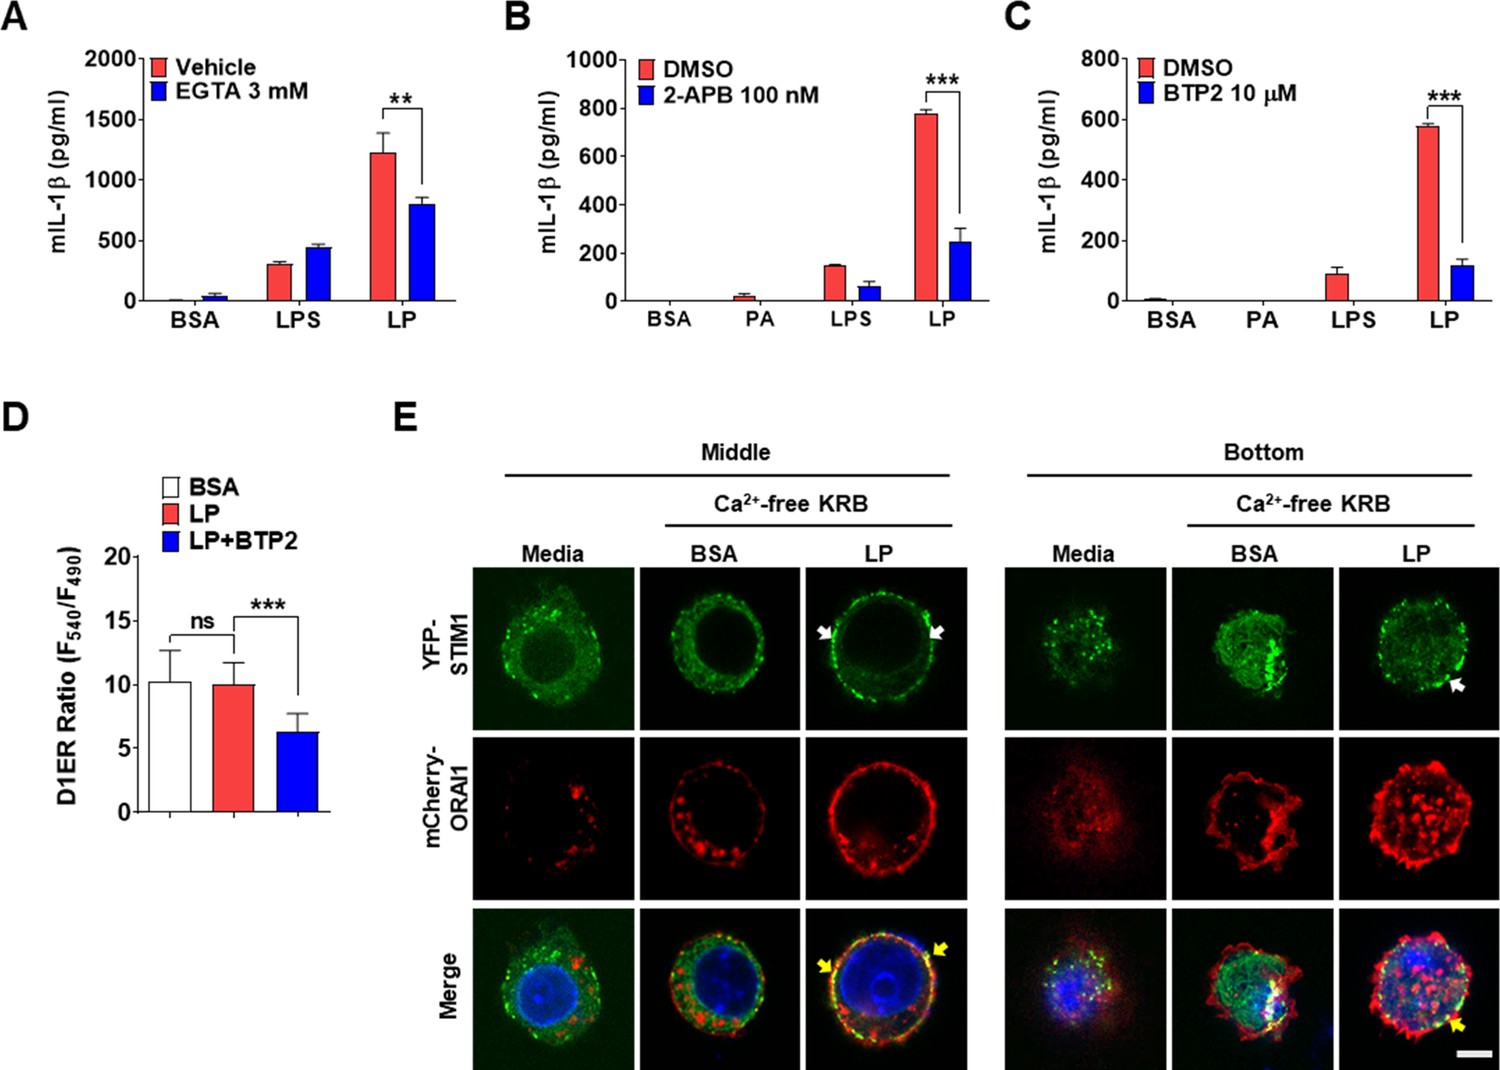
Store-operated Ca2+ entry (SOCE) in inflammasome by LP.
(A–C) IL-1β ELISA of culture supernatant after treating peritoneal MΦs with lipopolysaccharide (LPS) alone or palmitic acid (PA) alone for 21 hr, or with LP for a total of 21 hr including LPS pretreatment for 3 hr in the presence or absence of EGTA (A) (n = 4), 2-APB (B) (n = 4), or BTP2 (C) (n = 3). (D) [Ca2+]ER in D1ER-transfected bone marrow-derived macrophages (BMDMs) treated with LP for 1 hr in the presence or absence of BTP2 without removal of extracellular Ca2+ after LPS pretreatment for 3 hr (n = 19 for BSA; n = 16 for LP; n = 24 for LP + BTP2). (E) STIM1 aggregation (white arrows) and colocalization with ORAI1 (yellow arrows) at the middle and bottom levels of BMDMs that were transfected with YFP-STIM1 together with 3xFLAG-mCherry Red-Orai1/P3XFLAG7.1 and then treated with LP in Ca2+-free KRB buffer for 1 hr after LPS pretreatment for 3 hr, determined by confocal microscopy (scale bar, 5 mm). Data shown as means ± SEM from more than three independent experiments. **p<0.01 and ***p<0.001 by one-way ANOVA with Tukey’s test (D) or two-way ANOVA with Sidak test (A–C). Scale bar, 5 μm.
-
Figure 4—figure supplement 1—source data 1
Original data for ELISA and fluorescence ratio.
- https://cdn.elifesciences.org/articles/87561/elife-87561-fig4-figsupp1-data1-v1.xlsx
Figure 5 with 1 supplement
Coupling of K+ efflux and Ca2+ influx in inflammasome.
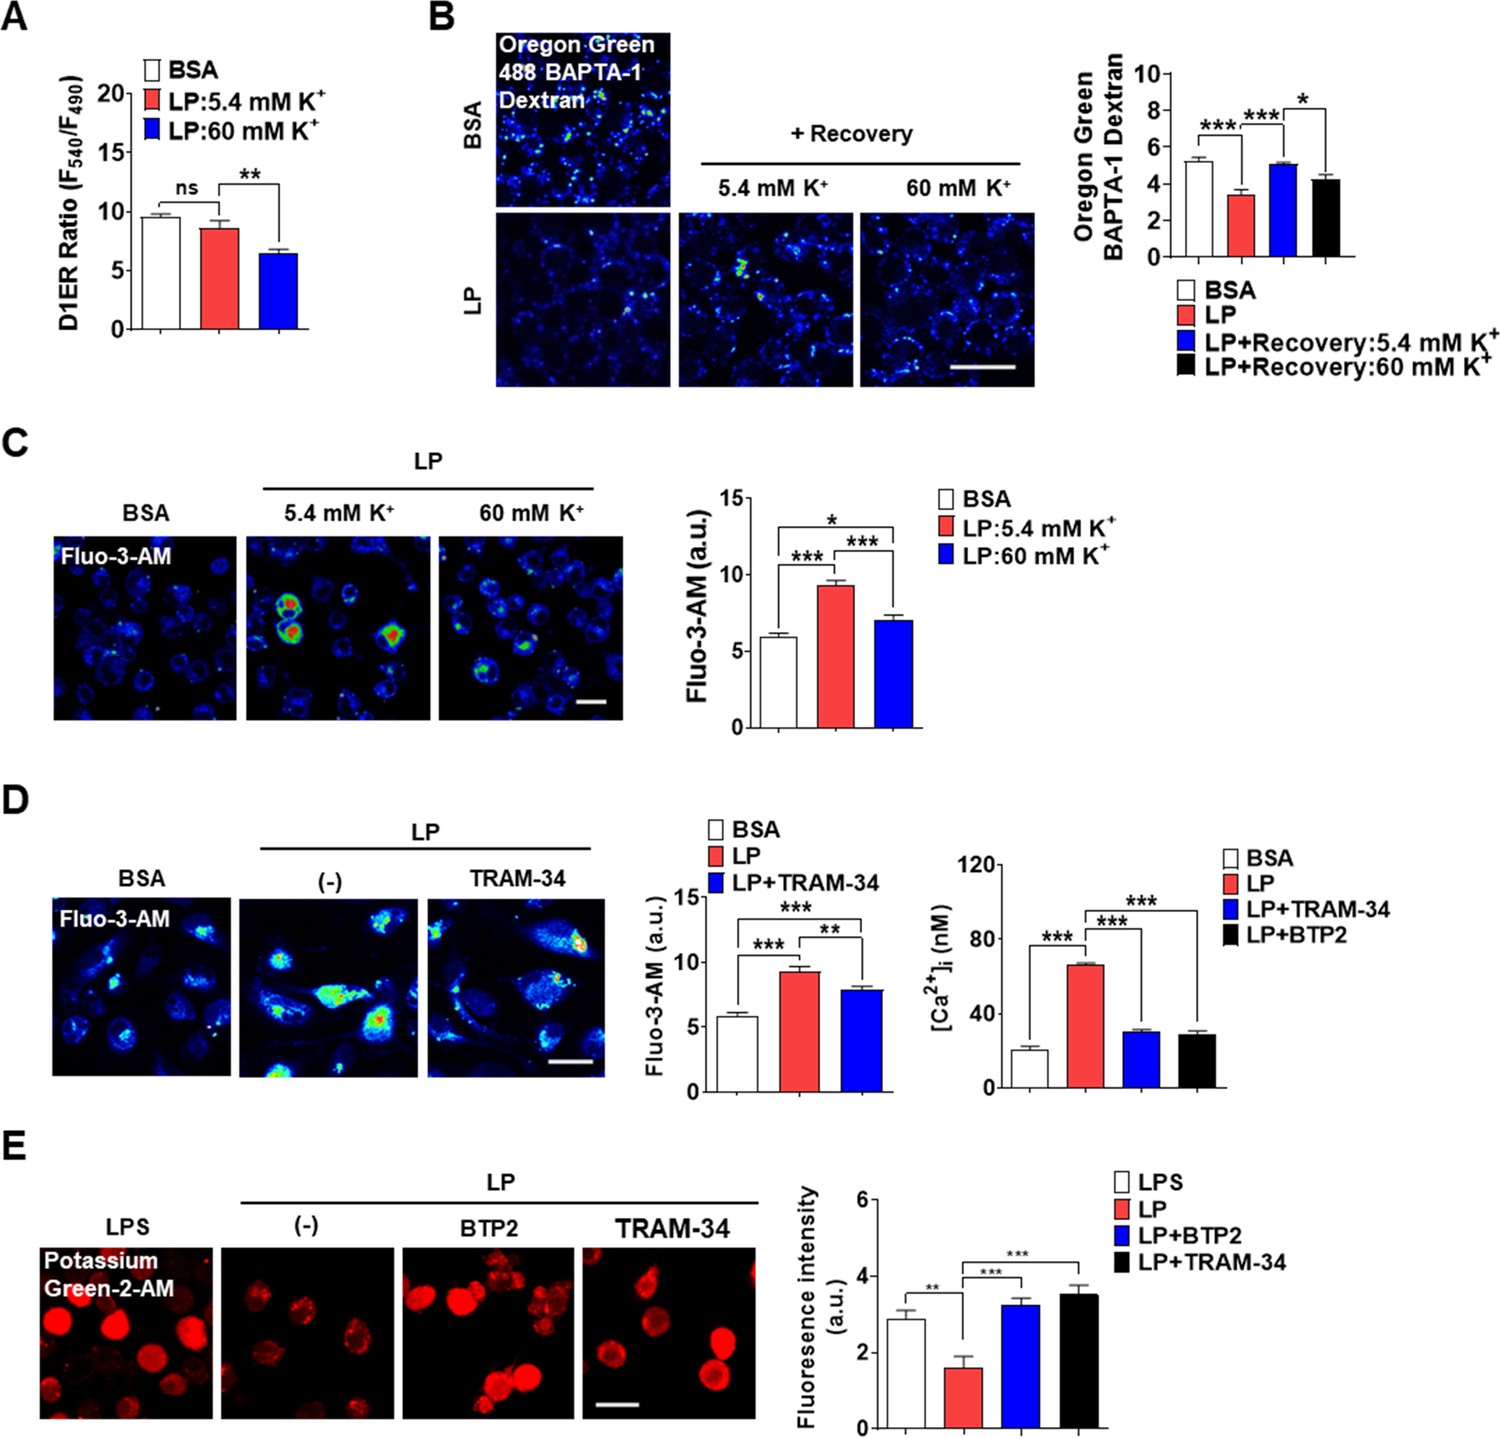
(A) [Ca2+]ER in D1ER-transfected bone marrow-derived macrophages (BMDMs) treated with LP for a total of 4 hr including lipopolysaccharide (LPS) pretreatment for 3 hr at [K+]e of 5.4 or 60 mM (n = 21 each). (B) Oregon Green BAPTA-1 Dextran (OGBD)-loaded MΦs were treated with LP for a total of 4 hr including LPS pretreatment for 3 hr. Recovery of [Ca2+]Lys in a fresh medium with 5.4 or 60 mM K+ (right). Representative fluorescence images (left) (n = 7 for BSA; n = 6 for LP; n = 7 for LP + Recovery:5.4 mM K+; n = 6 for LP + Recovery:60 mM K+). (C) [Ca2+]i in MΦs treated with LP for a total of 4 hr including after LPS pretreatment for 3 hr in a medium with 5.4 or 60 mM K+ (right). Representative Fluo-3 images (left) (n = 14 for BSA; n = 8 for LP:5.4 mM K+; n = 6 for LP:60 mM K+). (D) [Ca2+]i in MΦs treated with LP for 1 hr in the presence or absence of BTP2 or TRAM-34 after LPS pretreatment for 3 hr, determined using Fluo-3-AM (middle) or Fura-2 (right). Representative Fluo-3 images (left) (for Fluo-3-AM, n = 8) (for Fura-2, n = 13). (E) [K+]i after LP treatment for a total of 21 hr including LPS pretreatment for 3 hr in the presence or absence of BTP2 or TRAM-34 (right). Representative Potassium Green-2 images (left) (n = 5). Data shown as means ± SEM from more than three independent experiments. *p<0.05, **p<0.01, and ***p<0.001 by one-way ANOVA with Tukey’s test (A–E). Scale bar, 20 μm.
-
Figure 5—source data 1
Original data for fluorescence (ratio) and [Ca2+]i.
- https://cdn.elifesciences.org/articles/87561/elife-87561-fig5-data1-v1.xlsx
Figure 5—figure supplement 1
Effect of high extracellular K+ and inhibitors of K+ efflux channels on inflammasome.
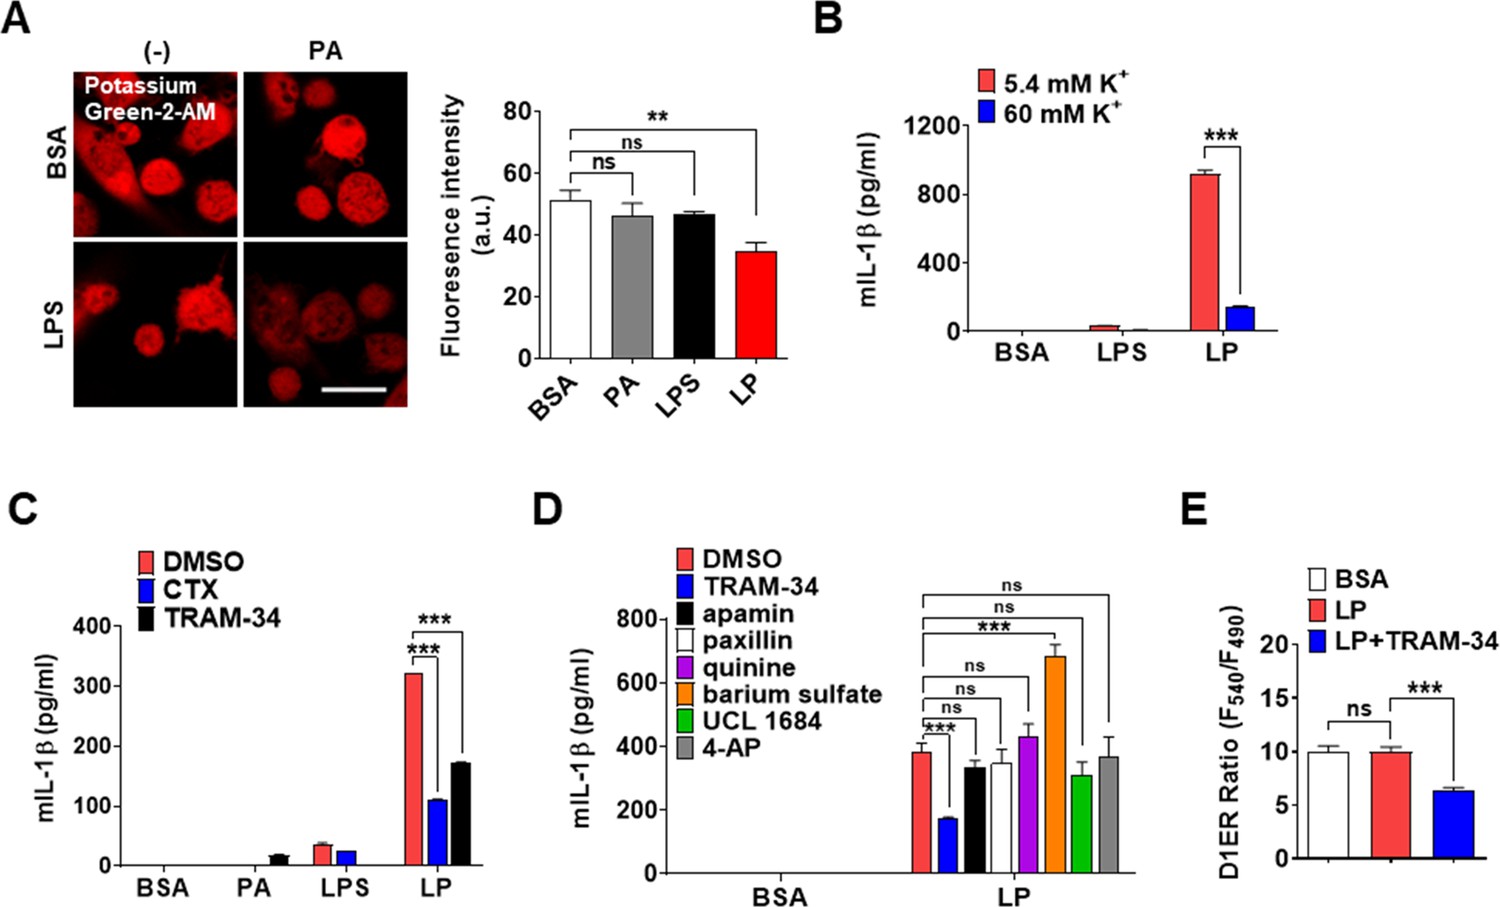
(A) [K+]i in MΦs treated with lipopolysaccharide (LPS) alone or palmitic acid (PA) alone for 21 hr, or LP for a total of 21 hr including LPS pretreatment for 3 hr (right), determined by confocal microscopy after Potassium Green-2-AM loading. Representative Potassium Green-2 fluorescence images (left) (n = 4 for BSA; n = 2 for PA; n = 4 for LPS; n = 4 for LP). (B) IL-1β ELISA of culture supernatant after treating MΦs with LPS alone for 21 hr or LP for a total of 21 hr including LPS pretreatment for 3 hr, at [K+]e of 5.4 (K+ concentration in RPMI medium) or 60 mM (n = 3 each). (C, D) IL-1β ELISA of culture supernatant after treating MΦs with LPS alone or PA alone for 21 hr, or LP for a total of 21 hr including LPS pretreatment for 3 hr in the presence or absence of charybdotoxin (CTX) or TRAM-34 (C) (n = 3), or several K+ efflux channel inhibitors (D) (n = 3). (E) [Ca2+]ER in D1ER-transfected bone marrow-derived macrophages (BMDMs) after LP treatment for 1 hr in the presence or absence of TRAM-34 without extracellular Ca2+ removal after LPS pretreatment for 3 hr (n = 16). Data shown as means ± SEM from more than three independent experiments. **p<0.01 and ***p<0.001 by one-way ANOVA with Tukey’s test (A, E) or two-way ANOVA with Sidak test or with Tukey’s test (B–D). Scale bar, 20 μm.
-
Figure 5—figure supplement 1—source data 1
Original data for fluorescence (ratio) and [Ca2+]i.
- https://cdn.elifesciences.org/articles/87561/elife-87561-fig5-figsupp1-data1-v1.xlsx
Figure 6 with 1 supplement
Role of KCa3.1 Ca2+-activated K+ channel in inflammasome.
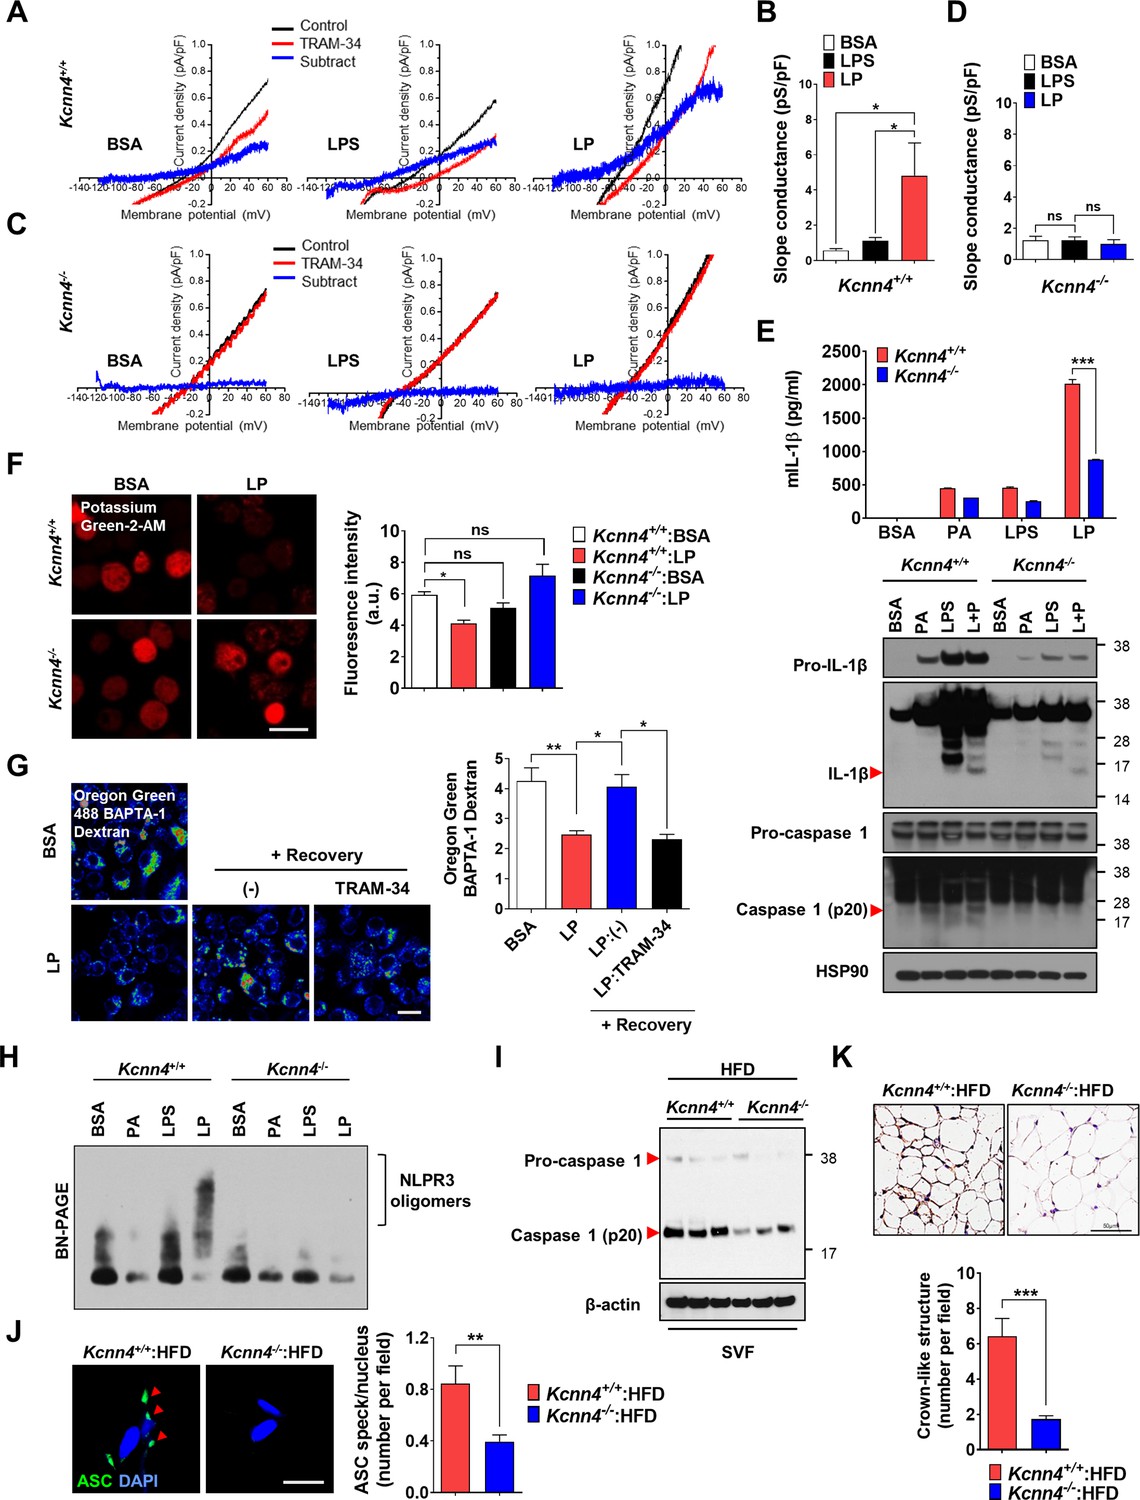
(A–D) Nystatin-perforated patch clamp and slope conductance of TRAM-34-sensitive I/V curve in Kcnn4+/+ (A, B) or Kcnn4-/- MΦs (C, D) treated with lipopolysaccharide (LPS) alone for 4 hr or with LP for a total of 4 hr including LPS pretreatment for 3 hr (B, D). Representative I/V curves (A, C). (n = 13 for each Kcnn4+/+ group; n = 4 for Kcnn4-/-:BSA; n = 5 for Kcnn4-/-:LPS; n = 4 for Kcnn4-/-:LP). (E) IL-1β ELISA of culture supernatant (upper) and immunoblotting (IB) of cell lysate using indicated Abs (lower) after treating Kcnn4+/+ or Kcnn4-/- MΦs with palmitic acid (PA) alone or LPS alone for 21 hr, or LP for a total of 21 hr including LPS pretreatment for 3 hr (n = 3). (F) [K+]i in Kcnn4+/+ or Kcnn4-/- MΦs treated with LP for a total of 21 hr including LPS pretreatment for 3 hr (right). Representative Potassium Green-2 images (left) (n = 5). (G) Oregon Green BAPTA-1 Dextran (OGBD)-loaded bone marrow-derived macrophages (BMDMs) were treated with LP for a total of 4 hr including LPS pretreatment for 3 hr. [Ca2+]Lys recovery after LP removal with or without TRAM-34 (right). Representative fluorescence images (left) (n = 11 for BSA; n = 8 for LP; n = 6 for LP:(-); n = 9 for LP:TRAM-34). (H) BN gel electrophoresis and subsequent IB of lysate of MΦs treated with LPS alone for 21 hr or with LP for a total of 21 hr including LPS pretreatment for 3 hr using indicated Ab. (I) IB of stromal vascular fraction (SVF) of while adipose tissue (WAT) from mice fed high-fat diet (HFD) for 8 weeks using indicated Abs (n = 3). (J) The number of ASC specks in WAT of mice of (I) identified by ASC immunofluorescence (right). Representative ASC specks (red arrow heads) (left) (scale bar, 20 μm) (n = 28 for Kcnn4+/+:HFD; n = 22 for Kcnn4-/-:HFD). (K) The number of crown-like structures (CLS) in WAT of mice of (I) identified by F4/80 immunohistochemistry (lower). Representative F4/80 immunohistochemistry (upper) (scale bar, 50 μm) (n = 12 for Kcnn4+/+:HFD; n = 11 for Kcnn4-/-:HFD). Data shown as means ± SEM from more than three independent experiments. *p<0.05, **p<0.01, and ***p<0.001 by one-way ANOVA with Tukey’s test (B, D, F, G), or two-way ANOVA with Sidak test (E). Scale bar, 20 μm.
-
Figure 6—source data 1
Original data for slope conductance, fluorescence, and the numbers of ASC specks and CLS.
- https://cdn.elifesciences.org/articles/87561/elife-87561-fig6-data1-v1.xlsx
-
Figure 6—source data 2
Original uncropped blot.
- https://cdn.elifesciences.org/articles/87561/elife-87561-fig6-data2-v1.pdf
Figure 6—figure supplement 1
Effects of Kcnn4 KO on metabolic profile and inflammasome.
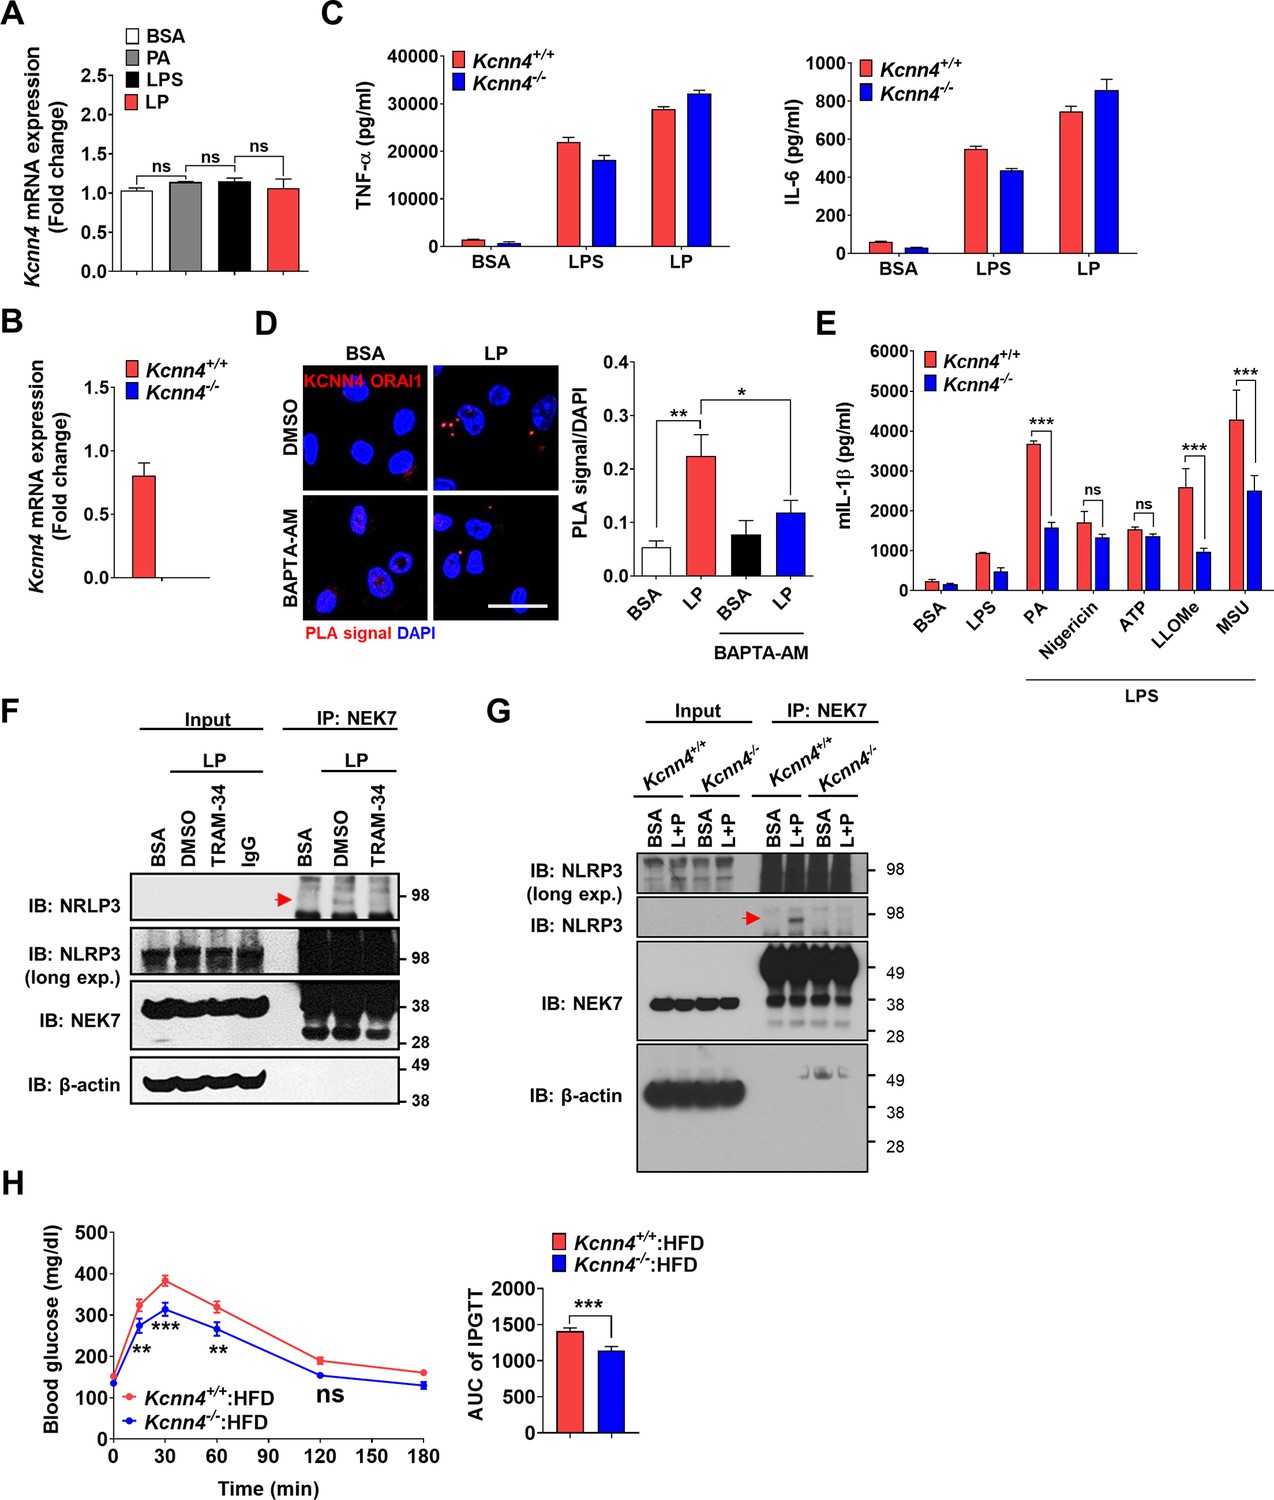
(A) Real-time RT-PCR of Kcnn4 using mRNA from MΦs treated with palmitic acid (PA) alone or lipopolysaccharide (LPS) alone for 21 hr, or LP for a total of 21 hr including LPS pretreatment for 3 hr (n = 3). (B) Real-time RT-PCR of Kcnn4 using mRNA from MΦs of Kcnn4+/+ or Kcnn4-/- mice (n = 3). (C) TNF-α and IL-6 ELISA of culture supernatant after treating MΦs from Kcnn4+/+ or Kcnn4-/- mice with LPS alone for 21 hr or with LP for a total of 21 hr including LPS pretreatment for 3 hr (n = 3). (D) Proximity ligation assay (PLA) in MΦs treated with LP for a total of 21 hr including LPS pretreatment for 3 hr in the presence or absence of BAPTA-AM, using Abs specific for KCNN4 and ORAI1 (right). Representative fluorescence images (left) (scale bar, 20 μm) (n = 10 for BSA; n = 16 for LP; n = 10 for BSA + BAPTA-AM; n = 16 for LP + BAPTA-AM). (E) IL-1β ELISA of culture supernatant after treating MΦs from Kcnn4+/+ or Kcnn4-/- mice with PA, nigericin, ATP, L-Leucyl-L-Leucine methyl ester (LLOMe) , and monosodium urate (MSU) for 18 hr, 45 min, 1 hr, 45 min and 3 hr, respectively, after LPS pretreatment for 3 hr (n = 6). (F) Immunoprecipitation (IP) of MΦs treated with LP for a total of 21 hr including LPS pretreatment for 3 hr in the presence or absence of TRAM-34 using anti-NEK7 Ab and protein G beads. After bead heating in a sample buffer, collected supernatant was subjected to immunoblotting (IB) using indicated Abs (red arrow, band of the correct size). (G) Immunoprecipitation of MΦs from Kcnn4+/+ or Kcnn4-/- mice treated with LP for a total of 21 hr including LPS pretreatment for 3 hr using anti-NEK7 Ab and protein G beads. After bead heating in a sample buffer, collected supernatant was subjected to IB using indicated Abs (red arrow, band of the correct size). (H) Intraperitoneal glucose tolerance test (IPGTT) in Kcnn4+/+ and Kcnn4-/- mice fed high-fat diet (HFD) for 8 weeks (left). Area under the curve (AUC) (right) (n = 9). Data shown as means ± SEM from more than three independent experiments. *p<0.05, **p<0.01, and ***p<0.001 by one-way ANOVA with Tukey’s test (A, D), two-tailed Student’s t-test (B, H), or two-way ANOVA with Sidak test (C, E).
-
Figure 6—figure supplement 1—source data 1
Original data for fold change of mRNA expression, ELISA, the number of PLA dots, and blood glucose.
- https://cdn.elifesciences.org/articles/87561/elife-87561-fig6-figsupp1-data1-v1.xlsx
-
Figure 6—figure supplement 1—source data 2
Original uncropped blot.
- https://cdn.elifesciences.org/articles/87561/elife-87561-fig6-figsupp1-data2-v1.pdf
Figure 7 with 1 supplement
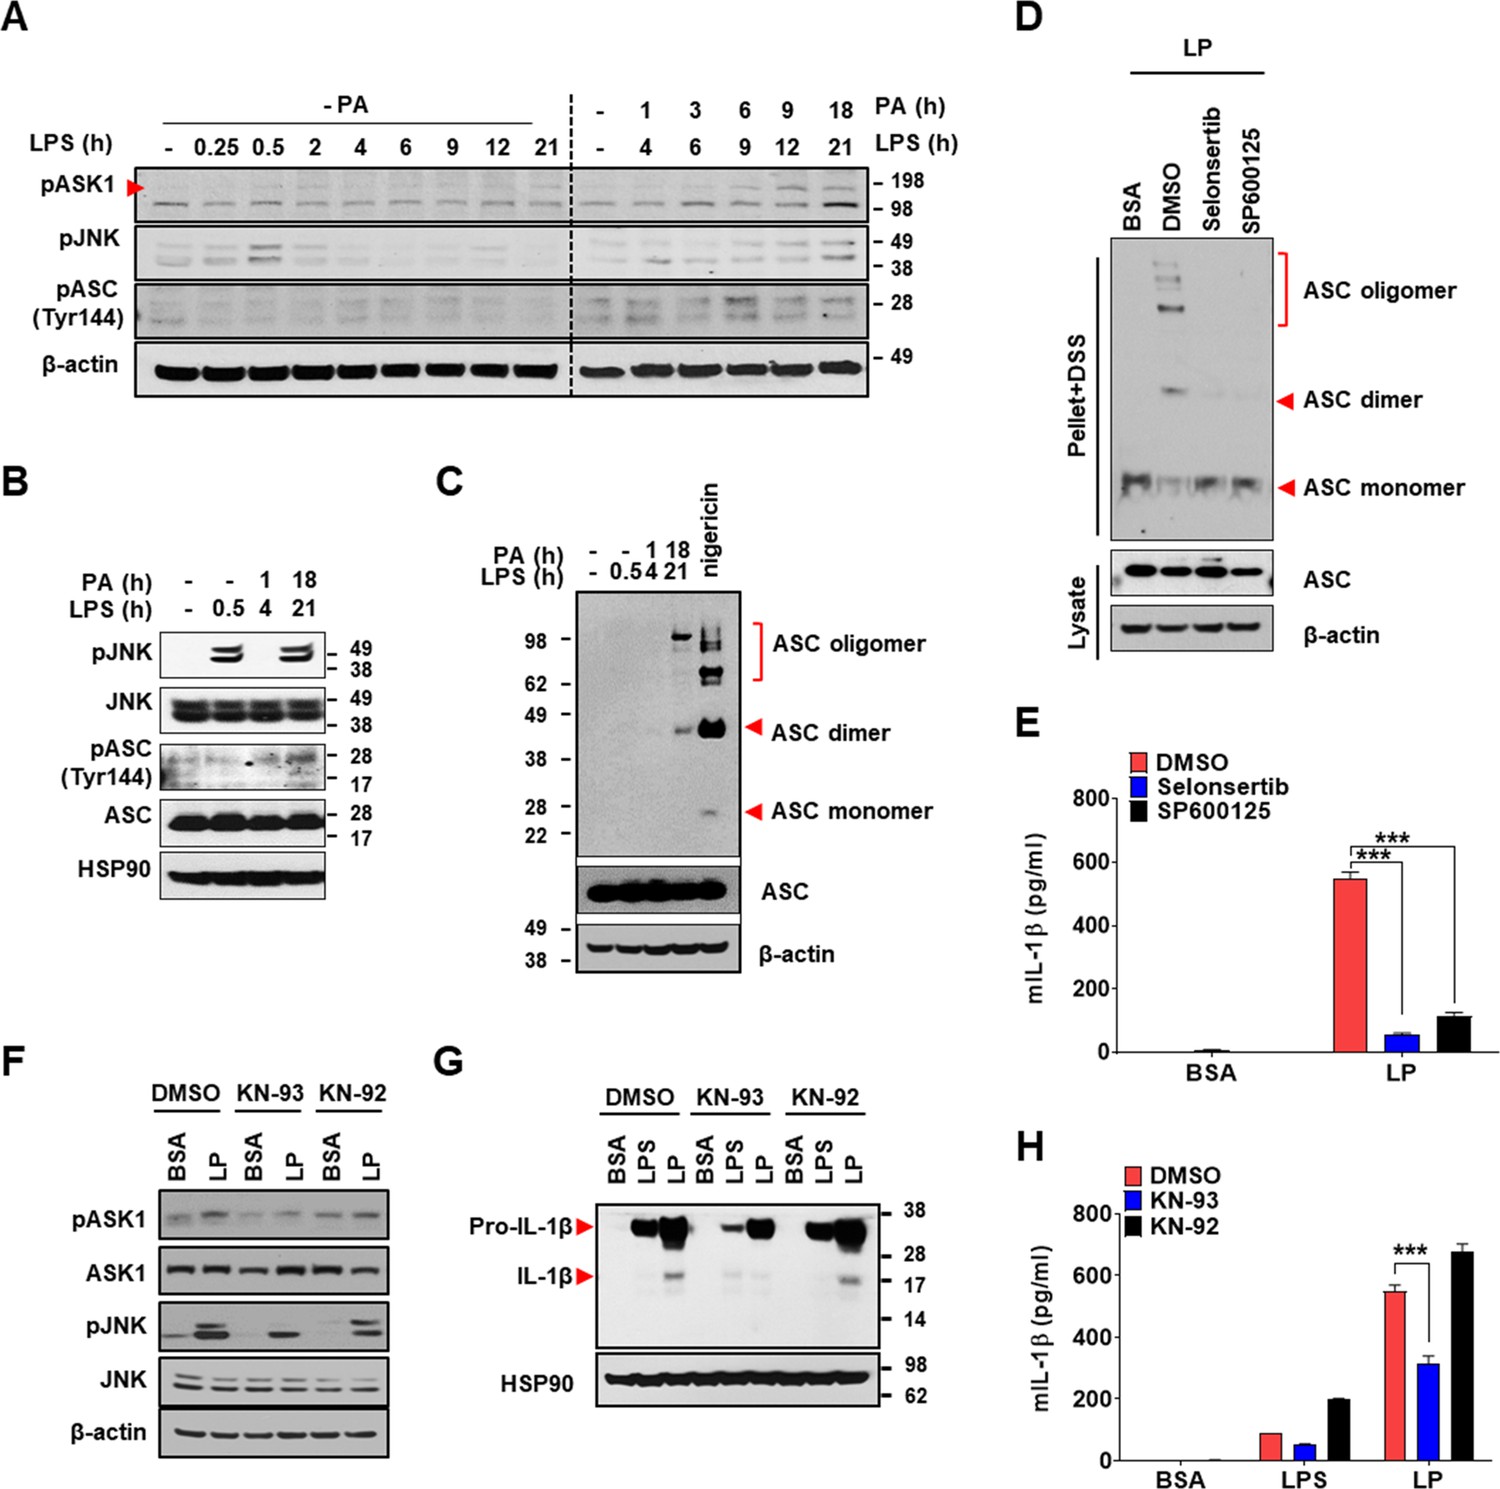
Mechanism of Ca2+-mediated inflammasome.
(A) Immunoblotting (IB) of bone marrow-derived macrophages (BMDMs) treated with lipopolysaccharide (LPS) alone without palmitic acid (PA) (‘- PA’) for indicated time period (left half) or with ‘PA’ (together with LPS) for indicated time period after LPS pretreatment for 3 hr (right half) (hence, the numbers indicating LPS treatment time in the right half are 3+PA treatment time), using indicated Abs. (B) IB of BMDMs treated with LPS alone for 0.5 hr or ‘PA’ (together with LPS) for 1 or 18 hr after LPS pretreatment for 3 hr (hence, the numbers indicating LPS treatment time of 4 or 21 hr are 3+PA treatment time), using indicated Abs. (C) BMDMs were treated with LPS alone for 0.5 hr, ‘PA’ (together with LPS) for 1 or 18 hr after LPS pretreatment for 3 hr (hence, the numbers indicating LPS treatment time of 4 or 21 hr are 3+PA treatment time) or nigericin for 45 min after LPS pretreatment for 3 hr. IB using indicated Abs after disuccinimidyl suberate (DSS) crosslinking. (D) BMDMs were treated with LP for a total of 21 hr including LPS pretreatment for 3 hr in the presence or absence of ASK1 (selonsertib) or JNK inhibitor (SP600125). IB using indicated Abs after DSS crosslinking. (E) IL-1β ELISA of culture supernatant after treating BMDMs with LP for a total of 21 hr including LPS pretreatment for 3 hr in the presence or absence of selonsertib or SP600125. (F–H) IB using indicated Abs (F, G) and IL-1β ELISA of culture supernatant (H) after treating BMDMs with LPS alone for 21 hr or with LP for a total of 21 hr including LPS pretreatment for 3 hr in the presence or absence of KN-93 or -92 (n = 3). Data shown as means ± SEM from more than three independent experiments. ***p<0.001 by two-way ANOVA with Tukey’s test (E, H).
-
Figure 7—source data 1
Original data for ELISA.
- https://cdn.elifesciences.org/articles/87561/elife-87561-fig7-data1-v1.xlsx
-
Figure 7—source data 2
Original uncropped blot.
- https://cdn.elifesciences.org/articles/87561/elife-87561-fig7-data2-v1.pdf
Figure 7—figure supplement 1
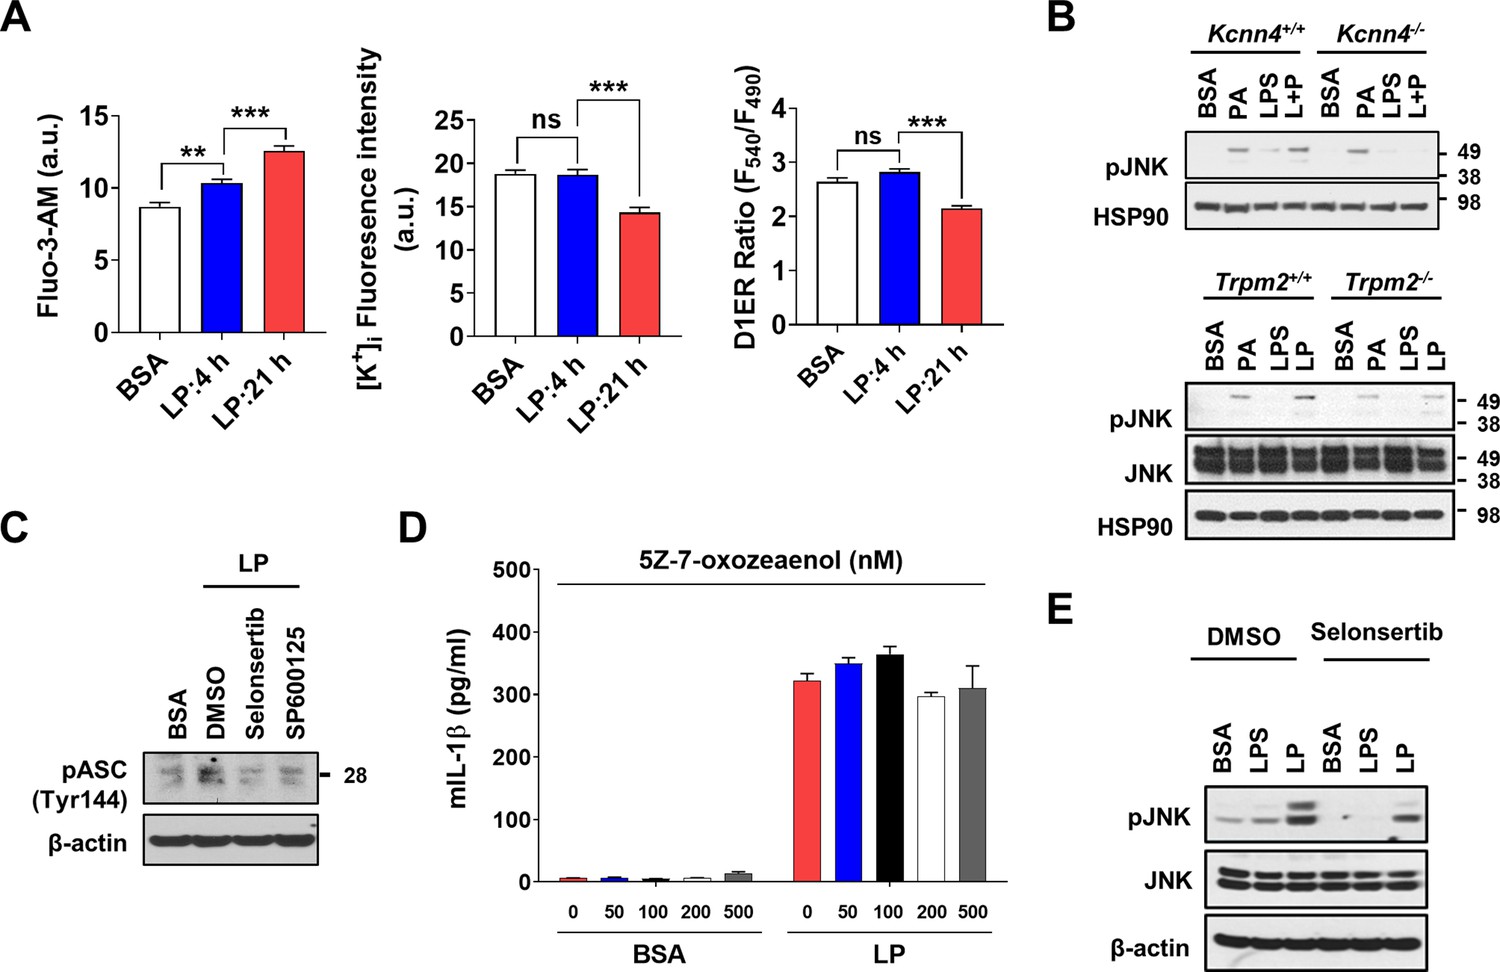
Effect of Kcnn4 KO and inhibitor of TAK1 or ASK1 on activation of inflammasome and JNK.
(A) [Ca2+]i (left), [K+]i (middle) and [Ca2+]ER (right) determined by Flou-3-AM staining, Potassium Green-2-AM staining and D1ER transfection, respectively, after treatment with LP for a total of 4 or 21 hr including lipopolysaccharide (LPS) pretreatment for 3 hr (n = 10 for Fluo-3-AM; n = 10 for Potassium Green-2-AM; n = 50 for D1ER). (B) Immunoblotting (IB) of lysate of MΦs from Kcnn4+/+ and Kcnn4-/- mice (upper) or Trpm2+/+ and Trpm2-/- mice (lower) treated with palmitic acid (PA) alone for 21 hr, LPS alone for 21 hr or LP for a total of 21 hr including LPS pretreatment for 3 hr, using indicated Abs. (C) IB of lysate of bone marrow-derived macrophages (BMDMs) treated with LP for a total of 21 hr including LPS pretreatment for 3 hr in the presence or absence of ASK1 (selonsertib) or JNK inhibitor (SP600125) using indicated Ab. (D) IL-1β ELISA of culture supernatant after treating BMDMs with LP for a total of 21 hr including LPS pretreatment for 3 hr in the presence or absence of 5Z-7-oxozeaenol (n = 3). (E) IB of lysate of BMDMs treated with LPS alone for 21 hr or with LP for a total of 21 hr including LPS pretreatment for 3 hr in the presence or absence of selonsertib using indicated Abs. Data shown as means ± SEM from more than three independent experiments*p<0.05, **p<0.01, and ***p<0.001 by one-way ANOVA with Tukey’s test (A), or two-way ANOVA with Tukey’s test (D).
-
Figure 7—figure supplement 1—source data 1
Original data for fluorescence (ratio) and ELISA.
- https://cdn.elifesciences.org/articles/87561/elife-87561-fig7-figsupp1-data1-v1.xlsx
-
Figure 7—figure supplement 1—source data 2
Original data blot.
- https://cdn.elifesciences.org/articles/87561/elife-87561-fig7-figsupp1-data2-v1.pdf
Figure 8

Graphic summary.
LP, an effector combination activating inflammasome related to metabolic inflammation, induces generation of mitochondrial reactive oxygen species (ROS), which activates TRPM2 channel on lysosome and releases lysosomal Ca2+. ER→lysosome Ca2+ refilling facilitated by ER-lysosome tethering replenishes diminished lysosomal Ca2+ content and supports sustained lysosomal Ca2+ release. ER emptying due to ER→lysosome Ca2+ refilling activates SOCE. SOCE, in turn, is positively modulated by K+ efflux through KCa3.1, a Ca2+-activated K+ efflux channel, mediating hyperpolarization-induced acceleration of extracellular Ca2+ influx. Ca2+ release from lysosome activates CaMKII, which induces delayed activation of ASK1 and JNK. Delayed JNK activation leads to ASC phosphorylation and oligomerization, leading to the formation of inflammasome complex together with NLRP3 and NEK7. K+ efflux changes intracellular milieu and induces structural changes of NLRP3 or NLRP3 binding to PI(4)P on dispersed Golgi network, facilitating inflammasome activation. Golgi complex and microtubule-organizing center (MTOC) are not shown for clarity (CASP1, caspase 1).
Author response image 1

Author response image 2
Additional files
Download links
A two-part list of links to download the article, or parts of the article, in various formats.
Downloads (link to download the article as PDF)
Open citations (links to open the citations from this article in various online reference manager services)
Cite this article (links to download the citations from this article in formats compatible with various reference manager tools)
ER-to-lysosome Ca2+ refilling followed by K+ efflux-coupled store-operated Ca2+ entry in inflammasome activation and metabolic inflammation
eLife 12:RP87561.
https://doi.org/10.7554/eLife.87561.3


