Replisome loading reduces chromatin motion independent of DNA synthesis
- Department of Biology, Technical University of Darmstadt, Germany
- Biomedical Computer Vision Group, BioQuant, IPMB, Heidelberg University, Germany
- Institute of Cytology RAS, Russian Federation
- EMBL Australia Node in Single Molecule Science, University of New South Wales, Australia
- Department of Physics & Astronomy, University of Denver, United States
- Department of Biology II, Ludwig Maximilians University, Germany
Figures
Figure 1
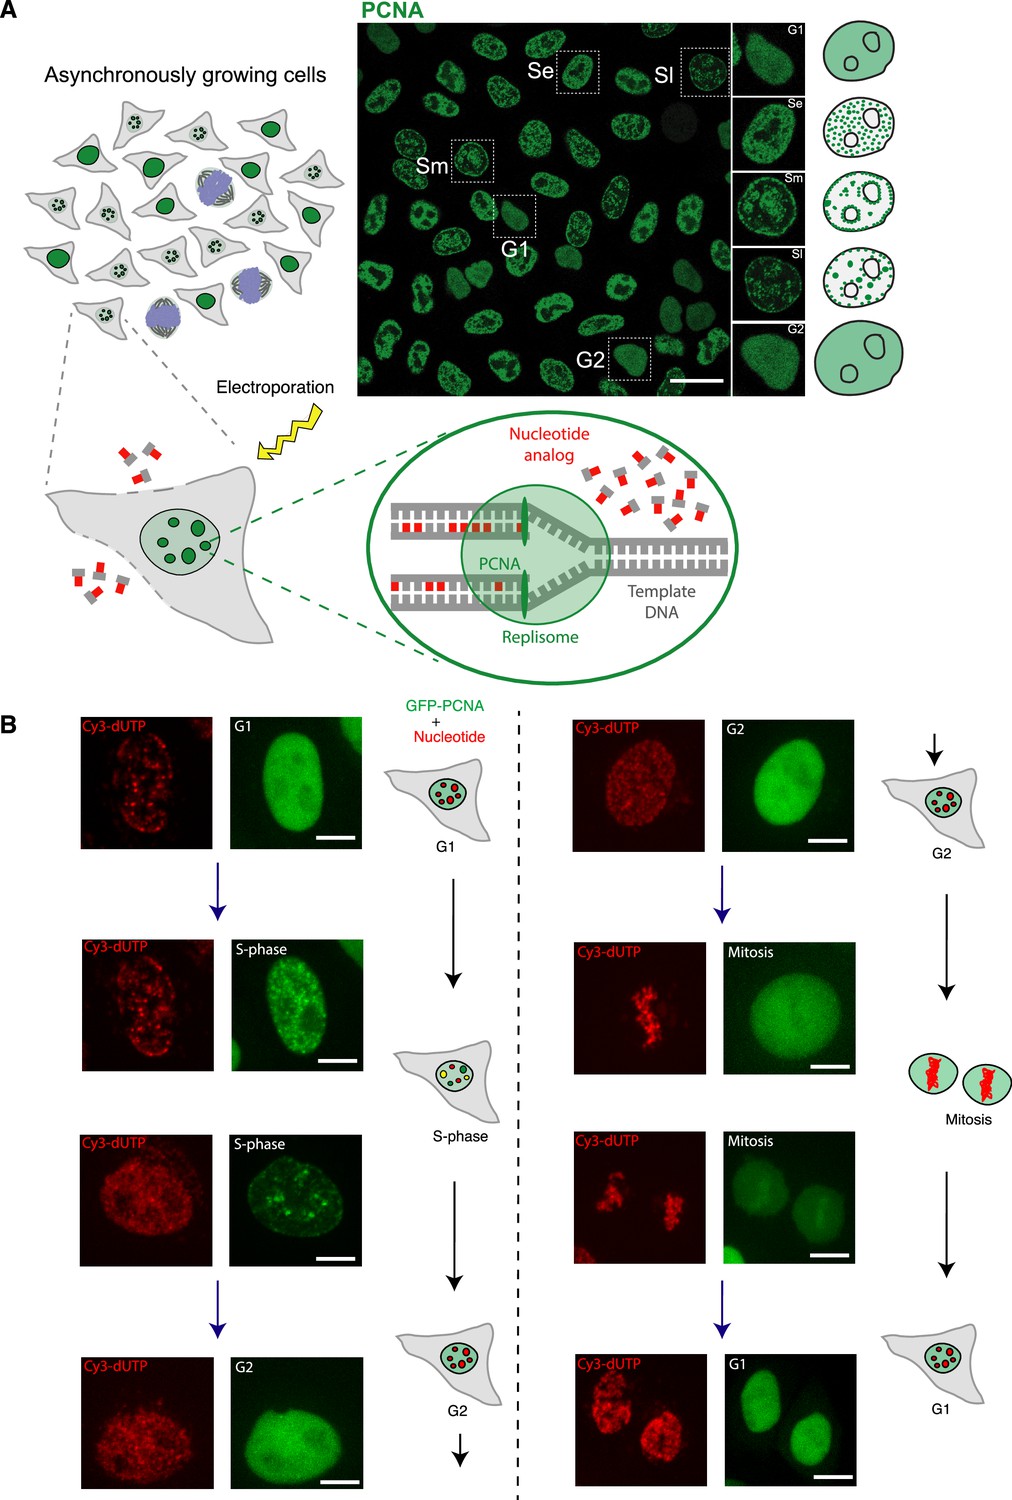
Incorporation of Cy3-dUTP in HeLa cell nuclei labels the whole genome randomly and with equal probability.
(A) Schematic illustration of the labeling system for monitoring chromatin mobility and cell cycle progression. During S-phase, proliferating cell nuclear antigen (PCNA) accumulates within the nucleus at sites of active DNA replication and exhibits a distinct puncta pattern. During G1 and G2, GFP-PCNA is diffusely distributed throughout the nucleus. Asynchronously growing populations of cells were exposed to electroporation to promote the uptake of Cy3-dUTP. In cells undergoing DNA replication, this fluorescent nucleotide is incorporated into nascent DNA strands at sites of active DNA replication, resulting in the direct fluorescent labeling of genomic segments. Based on the PCNA pattern, different cell cycle stages can be differentiated as shown in the image on the right (Se – early S, Sm – mid S, SL – late S, G1/G2 – gap phases, green – PCNA). (B) After Cy3-dUTP labeling (shown in red), cells were followed by time-lapse microscopy to identify the cell cycle (sub)stages and their progression. The representative images of different cells using time-lapse microscopy were shown to depict the patterns of PCNA (shown in green) in each sub-stage and their change over time (co-localized signals in yellow). This was used to classify cells in G1, S, and G2 phases of the cell cycle for motion analysis. Approximately 18–24 hr after nucleotide electroporation, Cy3-dUTP-labeled cells were imaged for motion analysis (see also Videos 1–5). The contrast of the images was adjusted linearly for visualization purposes. Scale bar: 5 µm.
Figure 2 with 1 supplement
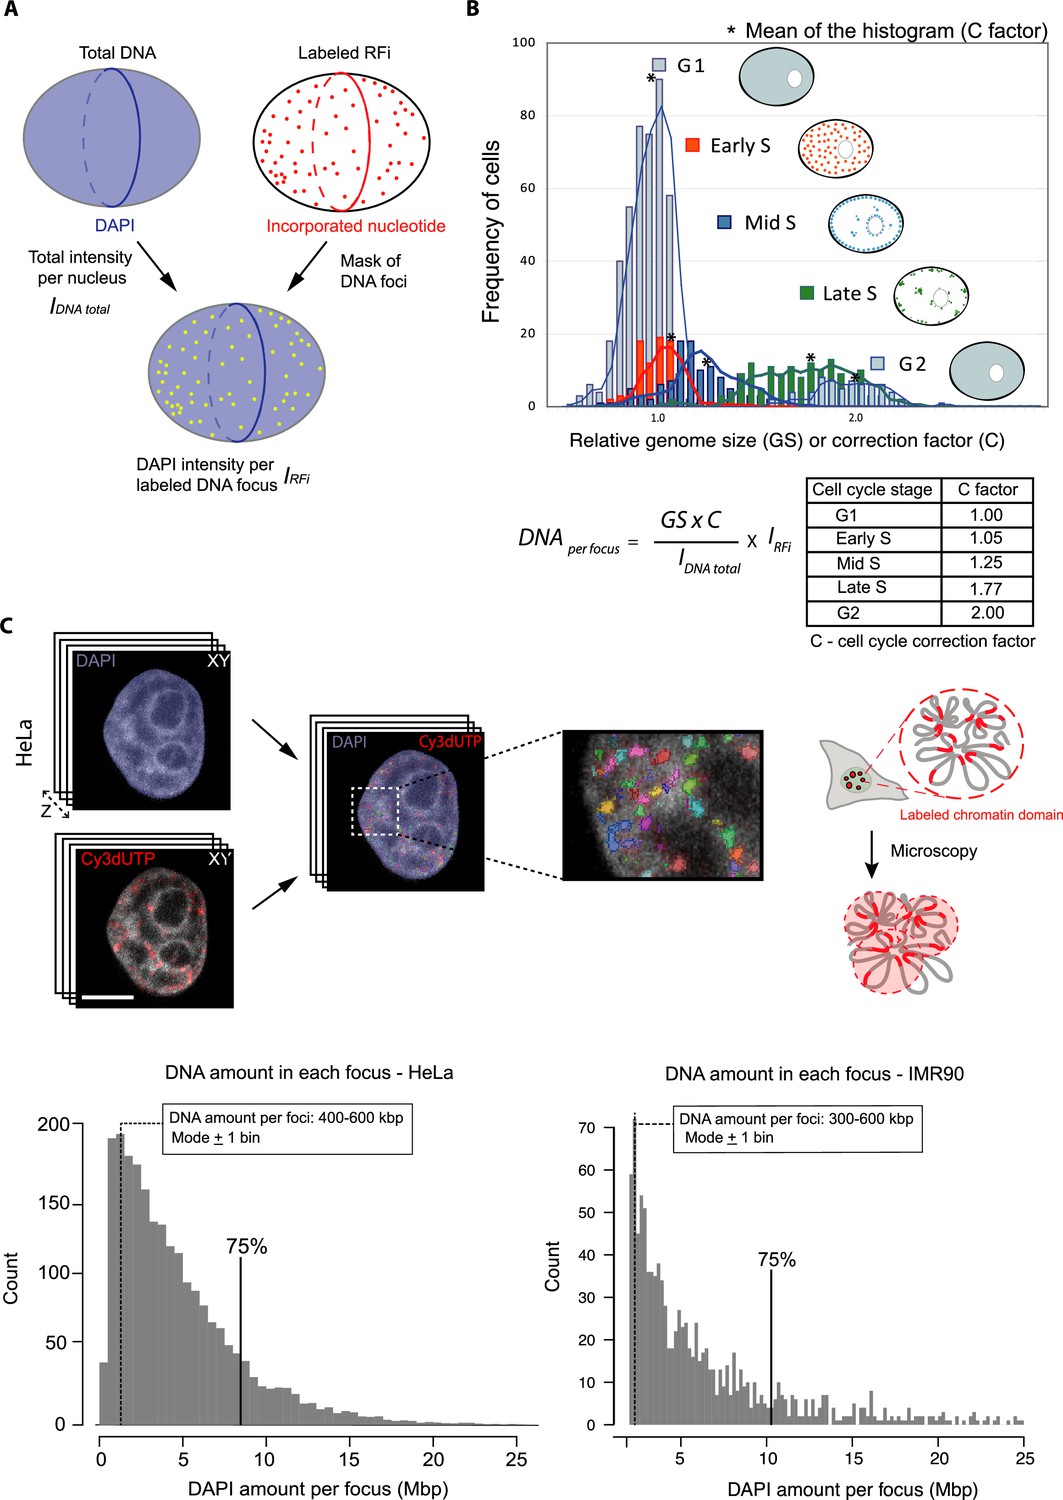
Principle of measuring DNA content per labeled DNA focus using confocal data.
(A) To determine the amount of DNA per labeled DNA focus, we used the total DAPI signal (DNA amount) of the segmented whole nucleus (IDNA TOTAL). The DNA intensity per labeled DNA focus within the segmented foci is obtained (IRFi) by masking the replication foci and estimating the corresponding portion of DAPI signal. (B) Throughout the S-phase progression the amount of DNA increases twofold from early to late S-phase. The amount of DNA present in the nucleus at a particular cell cycle stage can be determined by measuring the DNA amount in the population of cells, while using the proliferating cell nuclear antigen (PCNA) pattern to determine the cell cycle stage and S-phase sub-stage (see also Figure 1). The relative mean amount of DNA of each of the cell cycle (sub-)stages is used to calculate the cell cycle correction factor. The cell cycle correction factor (C/cell cycle stage) was estimated as: 1.0/G1; 1.05/early S-phase; 1.25/mid-S-phase; 1.77/late S-phase, 2/G2. The G1 genome size (GS) for HeLa cells is 9.7 Gbp (Chagin et al., 2016). The amount of DNA per labeled focus is the ratio of IRFi and IDNA TOTAL multiplied by C × GS. (C) The illustration on right depicts the imaging of labeled replication foci using confocal microscopy. DNA quantification of replication labeled foci in tumor HeLa and normal diploid IMR90 cells was done by imaging full Z-stacks volume of chromatin labeled with Cy3-dUTP and DNA with DAPI and imaged using confocal spinning disk microscopy (Figure 2—figure supplement 1, Supplementary file 1e). The histogram represents the DNA amount per focus for labeled S-phase cells (N=30 cells) for HeLa and IMR90 cells. The mode ±1 bin of the histogram represents the highest frequency of average size of replication domains labeled (300–600 kbp). Scale bar: 5 µm.
Figure 2—figure supplement 1

Pipeline and controls for DNA quantification of labeled replication foci using confocal data.
(A) All image sequences were acquired using spinning disk microscopy (60× objective, 1.45 numerical aperture). For analysis, the (16 bit) images were imported from ImageJ into PerkinElmer Volocity 6.3 software. Using the DAPI channel, nuclear segmentation (object recognition) was performed to obtain a mask for the whole nuclear volume and determine the total DNA intensity (mask highlighted with blue). The labeled chromatin foci (Cy3-dUTP) were detected using the intensity and segmented in 3D (highlighted in color palette). The sum DAPI intensity within the segmented foci (IRFi) were also obtained. The ratio of DNA amount per focus and total DNA in the nucleus corrected for cell cycle stage gives the DNA amount per focus. For quantification see Figure 2. The intensity values of the total DAPI intensity within each segmented replication foci (IRFi) are plotted as a histogram. (B) HeLa Kyoto cells, either synchronously (magenta) (Materials and methods) or asynchronously growing (green), were seeded on coverslips. The sum DAPI (DNA profile) of cells was plotted individual and in an overlap histogram (brown).
Figure 3 with 1 supplement
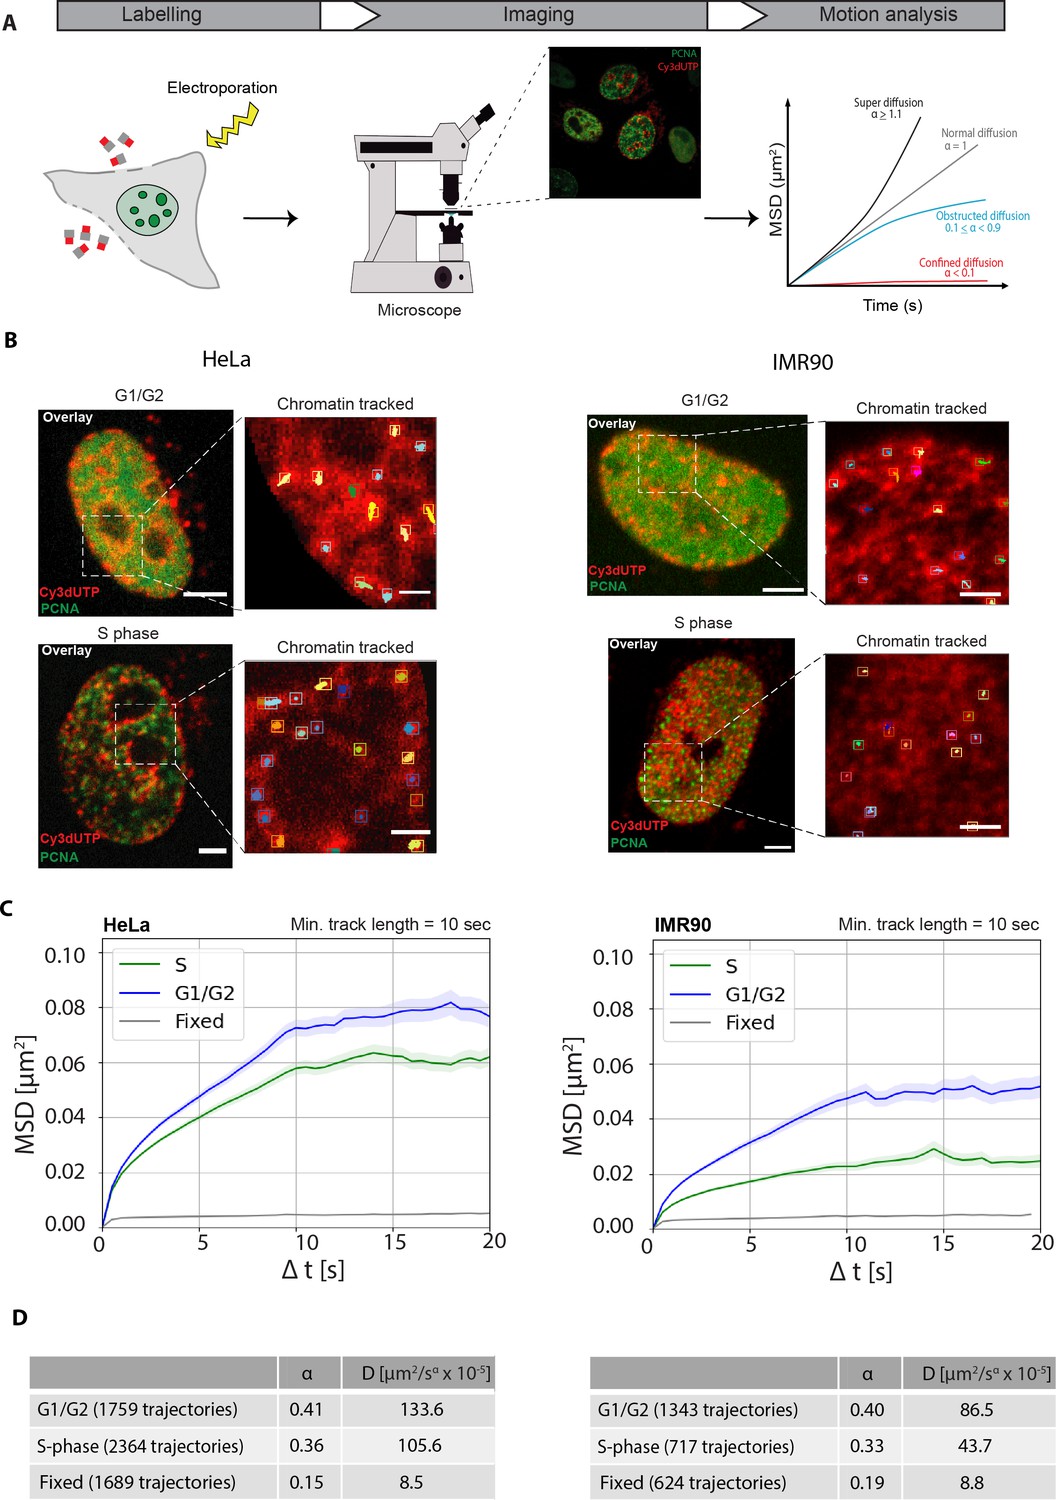
Single-particle motion analysis of labeled chromatin throughout the cell cycle.
(A) Brief schematics of the main steps of motion analysis starting with chromatin labeling using fluorescently labeled nucleotides via electroporation, followed the next day (i.e., cell cycle) by confocal time-lapse imaging of the chromatin channel and performing motion analysis on computed tracks to determine the diffusion rates of chromatin (Materials and methods). (B) Overlay images of HeLa Kyoto and IMR90 cells expressing GFP/miRFP proliferating cell nuclear antigen (PCNA) and labeled chromatin (Cy3dUTP) in different cell cycle stages (G1/G2 – diffused PCNA, S-phase – PCNA puncta). Cropped region (white box) showing the chromatin tracks of individual foci in both G1/G2 and S-phase cells. The aggregates of Cy3-dUTP that are found in cytoplasm are excluded from the analysis using a nuclear mask. See also Videos 1–5. (C) Result of motion analysis of computed chromatin tracks for different cell cycle stages (Figure 3—figure supplement 1) for HeLa and IMR90 cells. Mean square displacement (MSD, μm2) curves were plotted over time (s). MSD curves for G1/G2, S-phase, fixed cells with a minimum track length of 10 s, and a total time of 20 s were plotted with error bars (SEM – standard error of the mean) representing the deviations between the MSD curves for an image sequence in transparent color around the curve. Scale bar: 5 µm. Insets scale bar: 1 µm. (D) The tables provide the detailed information on the number of trajectories per condition along with average diffusion rates and anomalous α coefficient showing subdiffusion.
Figure 3—figure supplement 1

Workflow of chromatin motion and proximity analysis for confocal data.
(A) Raw images of chromatin and proliferating cell nuclear antigen (PCNA) were first segmented to remove the background noise outside the nucleus. In case of IMR90 cells, affine image registration was performed to address the stronger cell movement compared to HeLa cells (Materials and methods). The probabilistic tracking method was then performed which includes detection of chromatin particles and tracking over the time to obtain trajectories. The tracks were then used to plot mean square displacement (MSD) curves or perform proximity analysis with PCNA. (B) Result of motion analysis of computed chromatin tracks for G1, G2, S-phase cell cycle stages (Figure 3) for HeLa and IMR90 cells. MSD (μm2) curves were plotted over time (s). MSD curves for G1/G2, S-phase, fixed cells with a minimum track length of 10 s, and a total time of 20 s were plotted with error bars (SEM – standard error of the mean) representing the deviations between the MSD curves for an image sequence in transparent color around the curve. Scale bar: 10 µm.
Figure 4 with 1 supplement
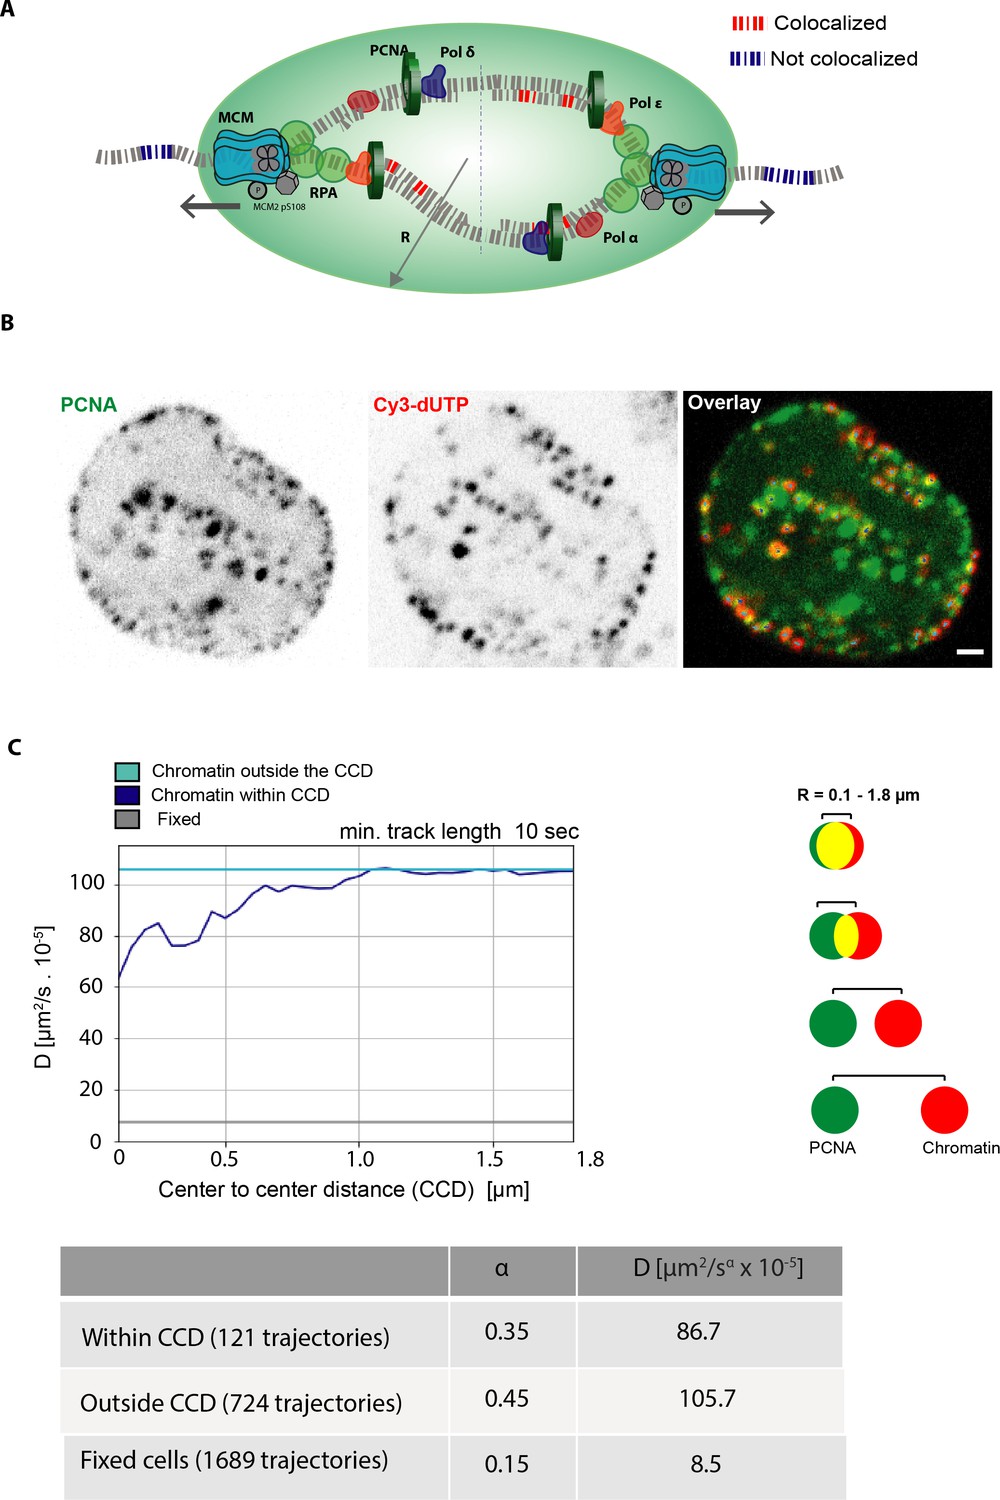
Analysis of chromatin mobility versus distance (proximity) to the DNA replication machinery.
(A) Schematic illustration of replisome components (helicase, replication protein A, proliferating cell nuclear antigen [PCNA]) actively replicating chromatin. The geometric centers of the labeled chromatin foci and labeled replication sites were first defined. The chromatin within the defined center-to-center distance (CCD) to a PCNA-labeled replication site is defined as chromatin that is within CCD and, otherwise, is defined as outside the CCD. (B) In order to obtain mobility information of labeled chromatin in the proximity of PCNA foci (active replication sites) one frame of PCNA channel was acquired followed by 50 frames of the chromatin channel with a frame rate of 0.5 s. The images show the spatial distribution of PCNA and chromatin foci (Cy3-dUTP). (C) The graph represents the average diffusion rates of the mean square displacement curves (MSD) of chromatin within the CCD and chromatin outside the CCD with increasing distance (R) measured between the centers of PCNA and chromatin foci (Figure 4—figure supplement 1).The table below provides the detailed information on number of trajectories per individual sample along with average diffusion rates (µm2/s × 10–5) and anomalous α coefficient showing subdiffusion at 0.5 µm CCD. Scale bar: 1 µm.
Figure 4—figure supplement 1
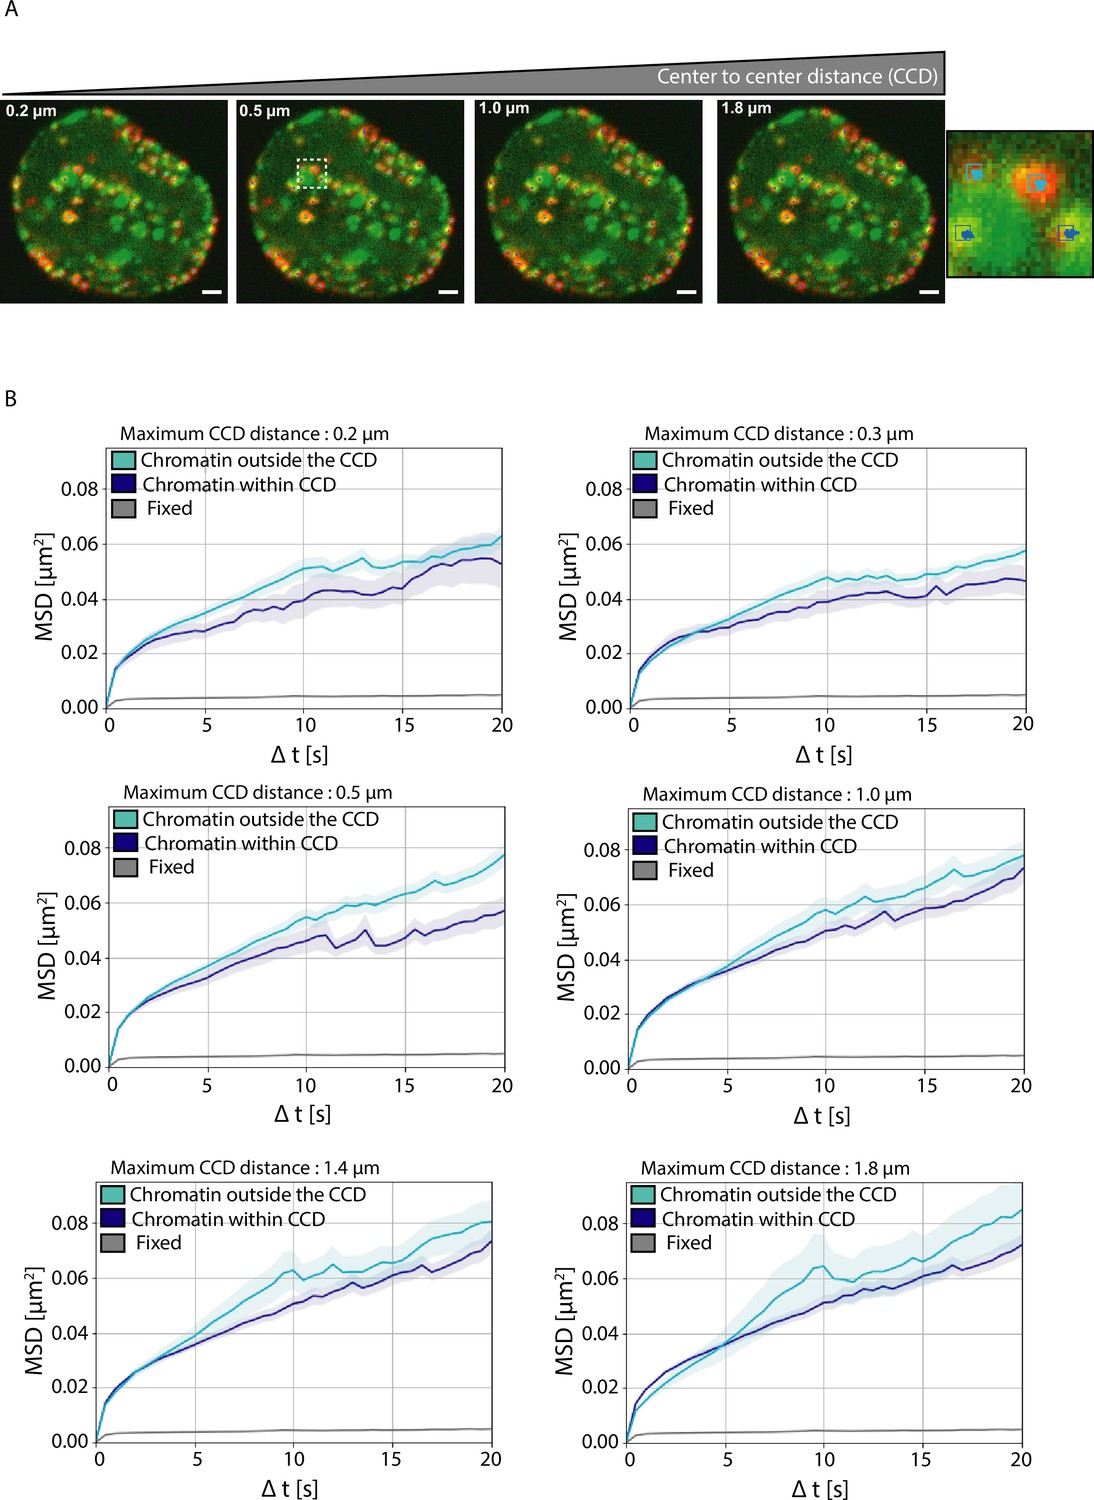
Mean square displacement (MSD) analysis of labeled chromatin in the proximity of active replication sites at varying center-to-center distances (CCD).
(A) Overlay images of GFP-proliferating cell nuclear antigen (PCNA) (active replication sites, green) and labeled chromatin (red). Chromatin outside the CCD is highlighted with cyan dots and chromatin within CCD is highlighted with dark blue dots within the magnified inset (demarcated by a white box). (B) MSD curves of chromatin outside the CCD and chromatin within CCD along with fixed cell control with increasing distance from 0.2 μm to 1.8 μm. This allows us to analyze the effect of replication factors on chromatin mobility at increasing distances. The MSD curves were plotted with error bars (standard deviation) represented in transparent color around the curve. Scale bar: 1 µm.
Figure 5 with 8 supplements
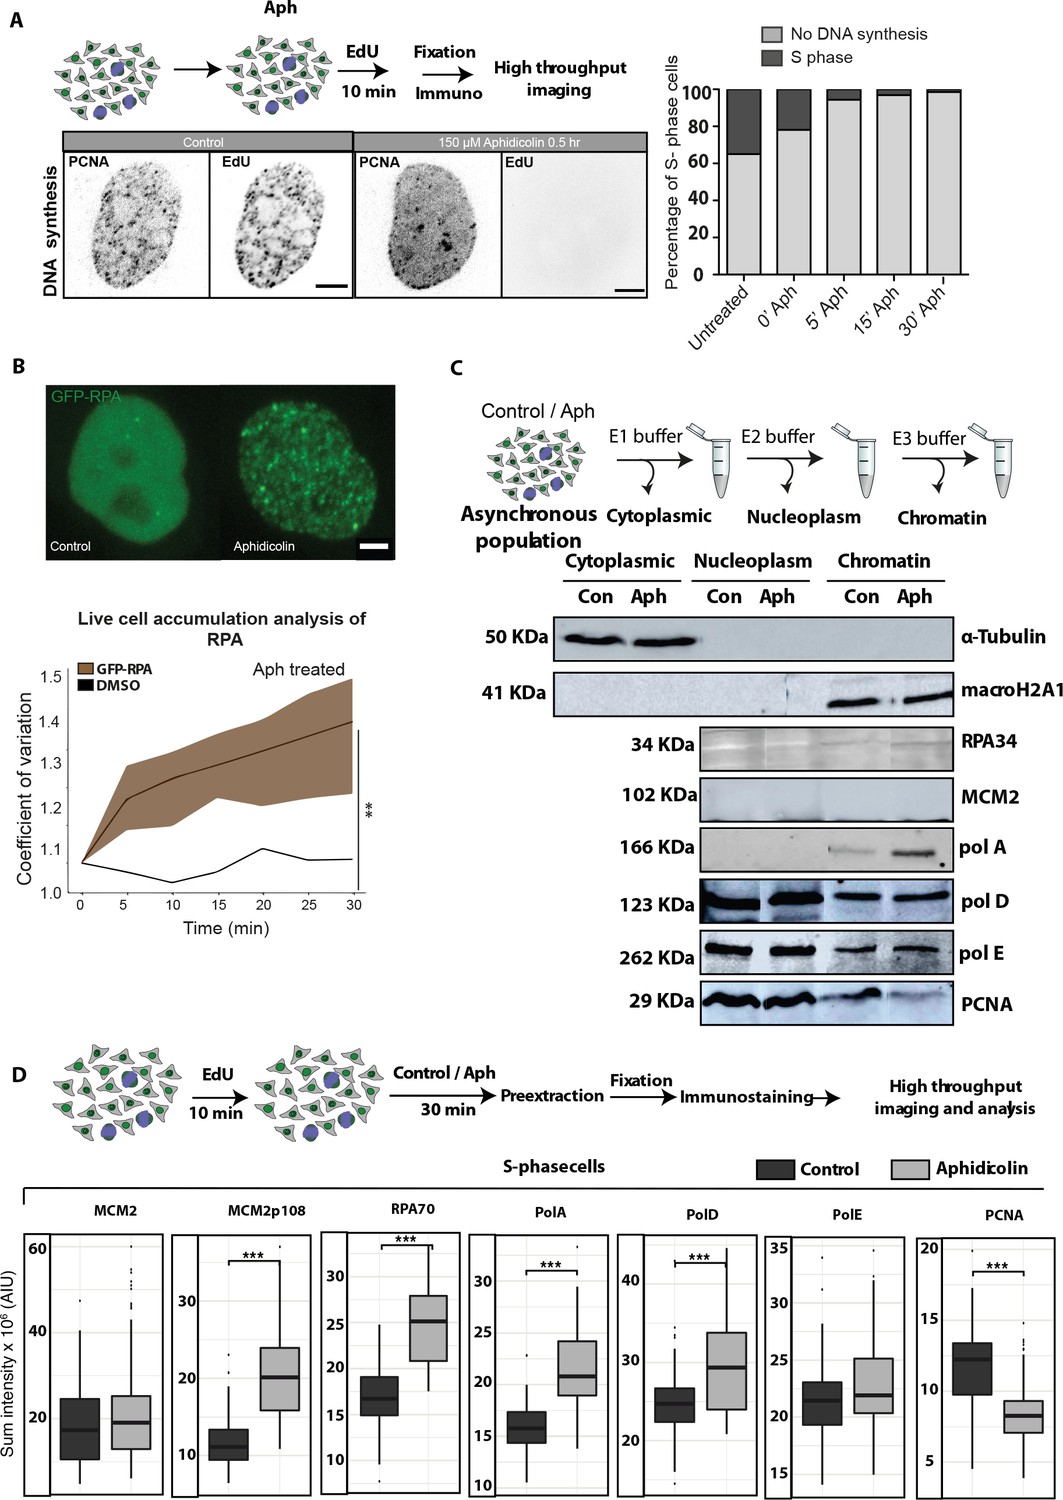
Dissecting the kinetics of replisome components after inhibition of DNA synthesis.
(A) The use of thymidine nucleotide analogs like 5-ethynyl-2′-deoxyuridine (EdU), which is incorporated into replicating DNA, allows us to estimate the time needed for complete inhibition of DNA synthesis. The representative images show no incorporation of EdU in S-phase cells upon aphidicolin (Aph) treatment for 30 min. The plots below the images depict the % of cells with no DNA synthesis as scored by the EdU signal and the corresponding % of cells still replicating DNA (Figure 5—figure supplement 1, Figure 5—figure supplement 2). (B) The line plot shows the live cell accumulation analysis showing the normalized average RPA70 accumulation at replication sites (coefficient of variation ± standard deviation in transparent color) of HeLa cells stably expressing GFP-RPA34 (Figure 5—figure supplements 3–5). (C) Western blots of cytoplasm, nucleoplasm, and chromatin fractions of asynchronous population of HeLa cells probed for different replication factors. The western blots shown are cropped from the same replicates for easier visualization without contrast adjustment and the full blots are shown and highlighted in Figure 5—figure supplement 6. (D) HeLa cells were pulsed with EdU for 10 min to identify S-phase cells and pre-extracted to detect chromatin-bound proteins and different replication factors were detected using immunofluorescence. High-throughput imaging and image analysis were performed (Figure 5—figure supplements 7 and 8). Box plots depict the accumulation of the replisome factors indicated at DNA replication sites. Same Y-axis scale plots are shown in Figure 5—figure supplement 8. The box plot lower and upper hinges correspond to the first and third quartiles (the 25th and 75th percentiles), the upper whisker extends from the hinge to the largest value no further than 1.5× IQR from the hinge (where IQR is the interquartile range, or distance between the first and third quartiles). The lower whisker extends from the hinge to the smallest value at most 1.5× IQR of the hinge. The horizontal line represents the median value. The outliers plotted individually as separate dots outside of the whiskers. ***p<0.001 by Wilcoxon rank-sum test, for aphidicolin-treated versus control sample. Scale bar: 5 µm.
-
Figure 5—source data 1
The original full image files of western blots in Figure 5C.
- https://cdn.elifesciences.org/articles/87572/elife-87572-fig5-data1-v1.zip
-
Figure 5—source data 2
The original full image files of western blots in Figure 5C.
- https://cdn.elifesciences.org/articles/87572/elife-87572-fig5-data2-v1.zip
-
Figure 5—source data 3
The original full image files of western blots in Figure 5C.
- https://cdn.elifesciences.org/articles/87572/elife-87572-fig5-data3-v1.zip
-
Figure 5—source data 4
The original full image files of western blots in Figure 5C.
- https://cdn.elifesciences.org/articles/87572/elife-87572-fig5-data4-v1.zip
-
Figure 5—source data 5
The original full image files of western blots in Figure 5C.
- https://cdn.elifesciences.org/articles/87572/elife-87572-fig5-data5-v1.zip
-
Figure 5—source data 6
The original full image files of western blots in Figure 5C.
- https://cdn.elifesciences.org/articles/87572/elife-87572-fig5-data6-v1.zip
-
Figure 5—source data 7
The original full image files of western blots in Figure 5C.
- https://cdn.elifesciences.org/articles/87572/elife-87572-fig5-data7-v1.zip
-
Figure 5—source data 8
The original full image files of western blots in Figure 5C.
- https://cdn.elifesciences.org/articles/87572/elife-87572-fig5-data8-v1.zip
Figure 5—figure supplement 1

Time course analysis of inhibition of DNA synthesis upon aphidicolin treatment.
(A) HeLa cells stably expressing GFP-proliferating cell nuclear antigen (PCNA) were treated with aphidicolin (150 µm). Time course of treatments depicting the distribution of PCNA as well as the incorporation of the thymidine analog EdU is shown. EdU was used to detect DNA synthesis. For quantification see Figure 5A. Scale bar: 100 µm.
Figure 5—figure supplement 2
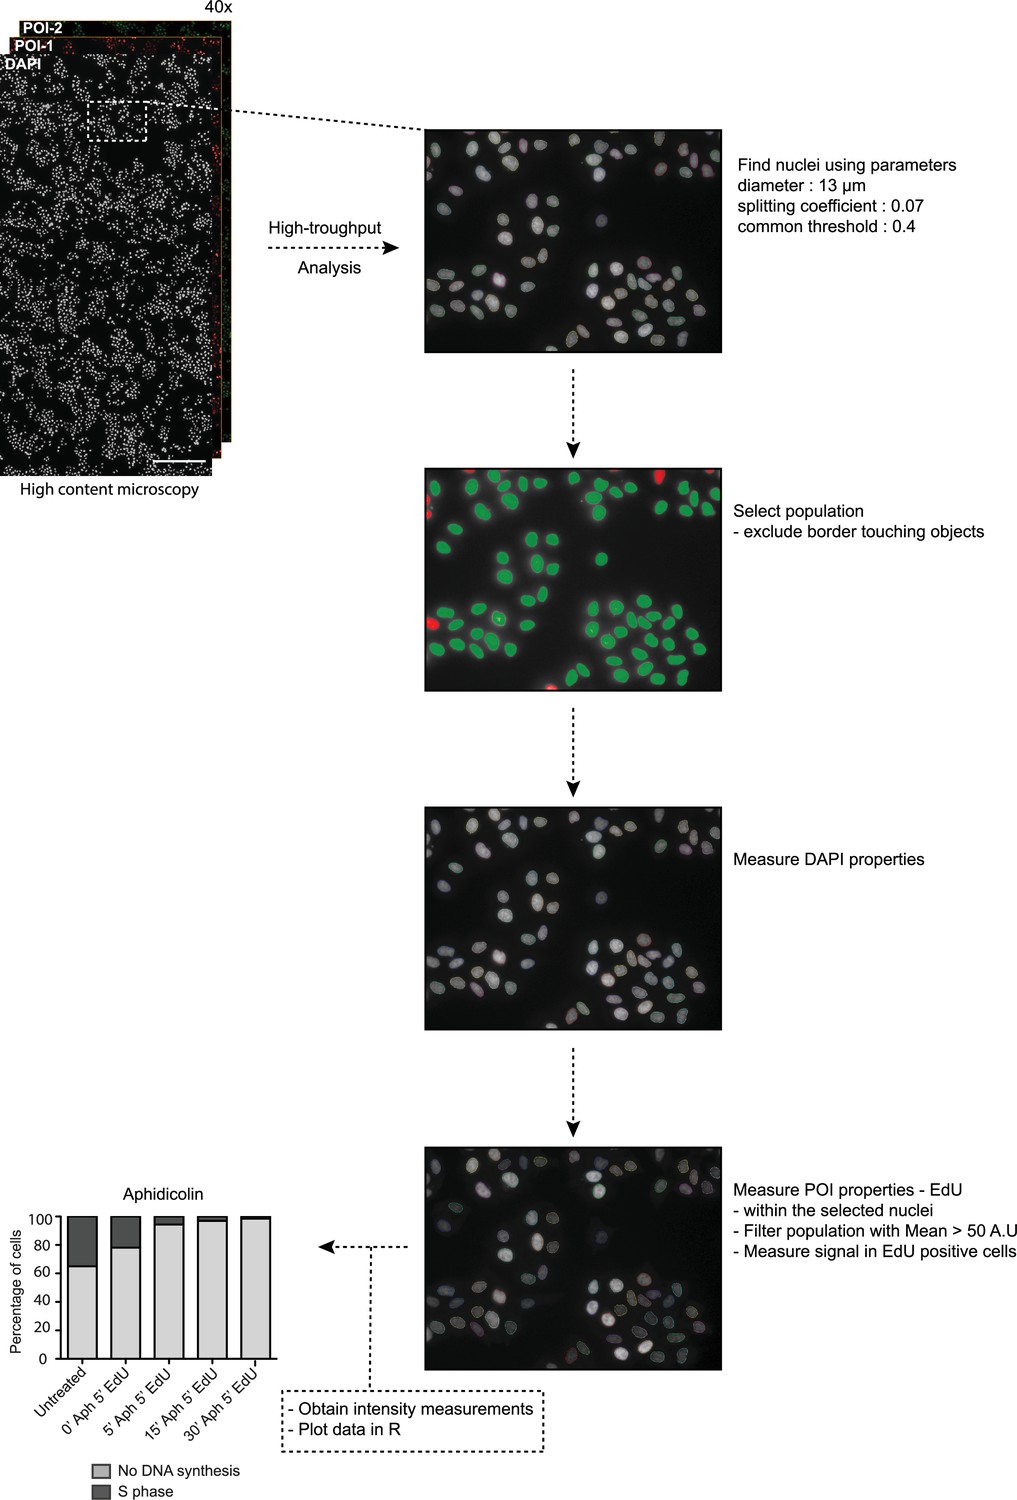
Schematic overview of the high-throughput analysis pipeline of DNA synthesis inhibition by aphidicolin.
Images were obtained using the 40× objective (numerical aperture 0.95) in the DAPI and EdU channels. Once the images were acquired, they were analyzed using the Harmony software from PerkinElmer. Briefly, the DAPI channel was used to segment nuclei using properties including diameter, splitting coefficient, and threshold. Once the nuclei were segmented, the population cells were then selected for analysis by removing the objects either touching the border or fused. In the population of cells selected, the properties including mean, median, standard deviation, and sum intensities were measured in the DAPI and EdU channels. The data measurements were then imported to R and visualized for the EdU positive population. Scale bar: 500 μm.
Figure 5—figure supplement 3
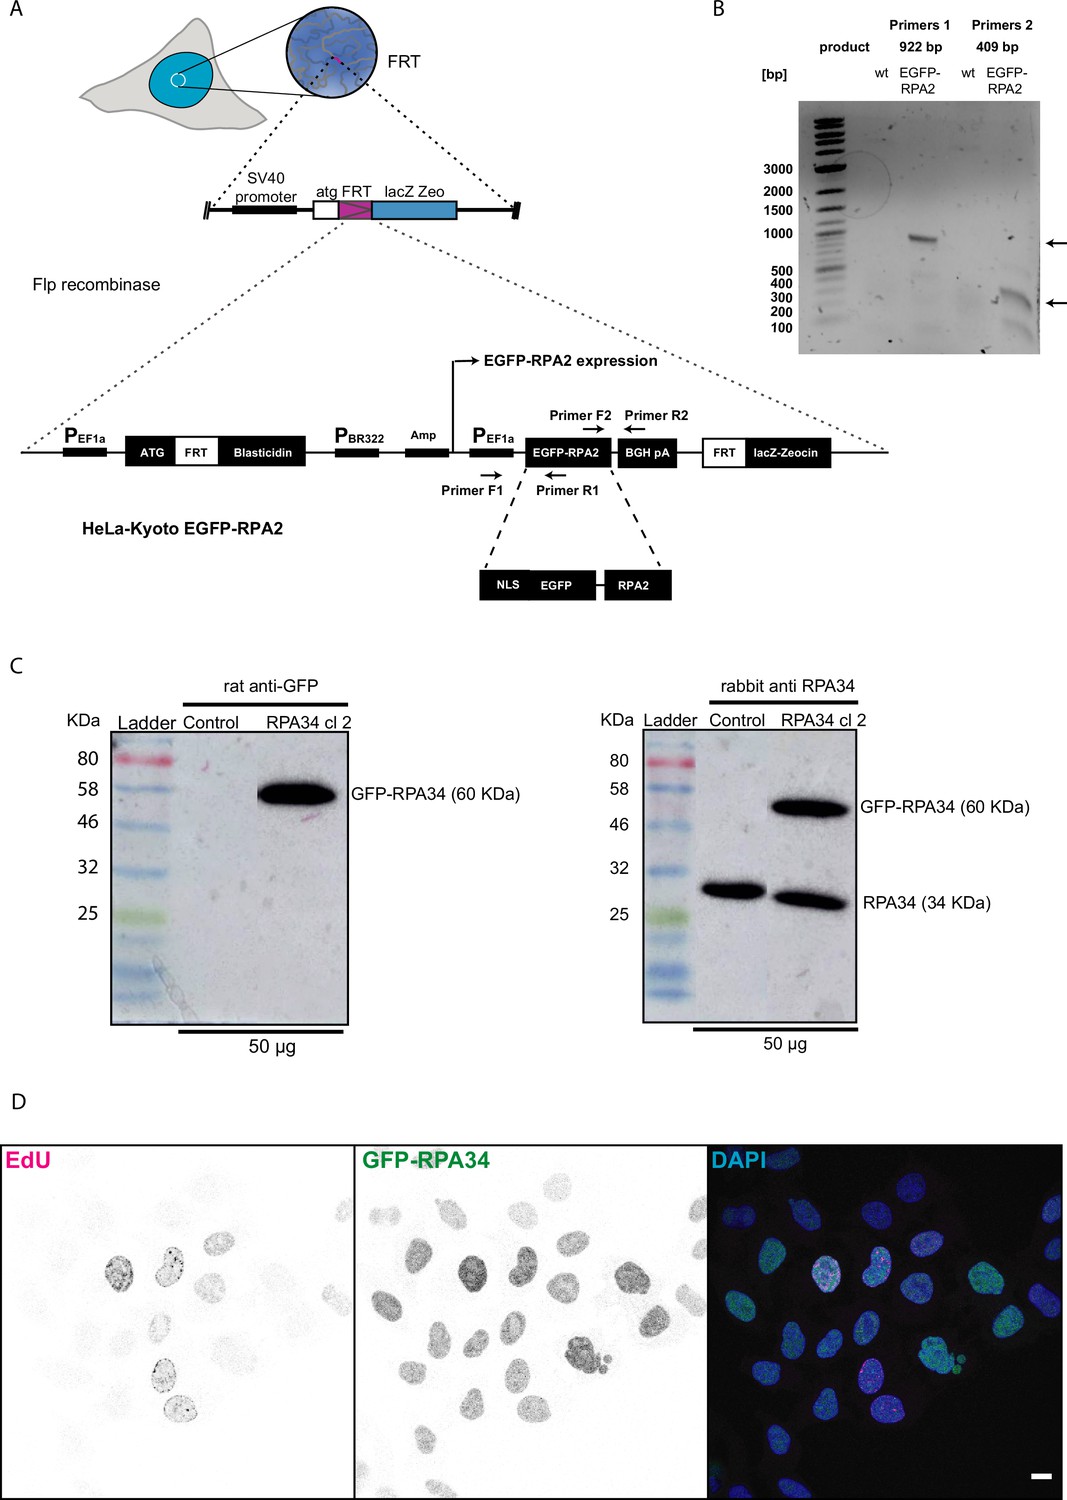
HeLa GFP-RPA cell line characterization after generation using the Flp-recombinase system.
(A) Schematic representation of the insertion of fluorescently tagged RPA34 (aka RPA2) encoding plasmid DNA using the chromosomally inserted FRT site in the previously generated HeLa Kyoto FRTLacZ (Materials and methods). Positive clones were selected using 1 μg/ml blasticidin in media. (B) PCR was performed on genomic DNA isolated from wild type and GFP-RPA34 clones using different primer pairs as indicated. (C) Cells from the positive clones were collected to perform a western blot using the anti-GFP antibody to test the level of GFP-RPA34 and an anti-RPA34 antibody was used to detect and compare both endogenous and fusion protein levels in control versus the positive clone. (D) The cells were seeded on glass coverslips, fixed and imaged to validate the protein localization relative to active DNA replication sites labeled EdU as well as DNA labeled with DAPI. Scale bar: 5 µm.
Figure 5—figure supplement 4

Live cell time-lapse microscopy of HeLa GFP-RPA34 cells to determine RPA accumulation at replication sites upon aphidicolin treatment.
(A) Confocal time-lapse microscopy of HeLa cells stably expressing GFP-RPA34 treated with DMSO (control) and aphidicolin. Videos were acquired at a frame rate of 5 min and at every time a Z-stack was acquired. A single Z-plane at different time points was shown as a representative image for all three conditions. The time-lapse images were imported to PerkinElmer Volocity 6.3 for analysis and the accumulation of GFP-RPA34 at replication foci was measured over time. (B) Representative images of live HeLa cells stably expressing GFP-proliferating cell nuclear antigen (PCNA) or GFP-RPA34 are shown in gray scale before and after aphidicolin treatment. Scale bar: 5 µm.
Figure 5—figure supplement 5
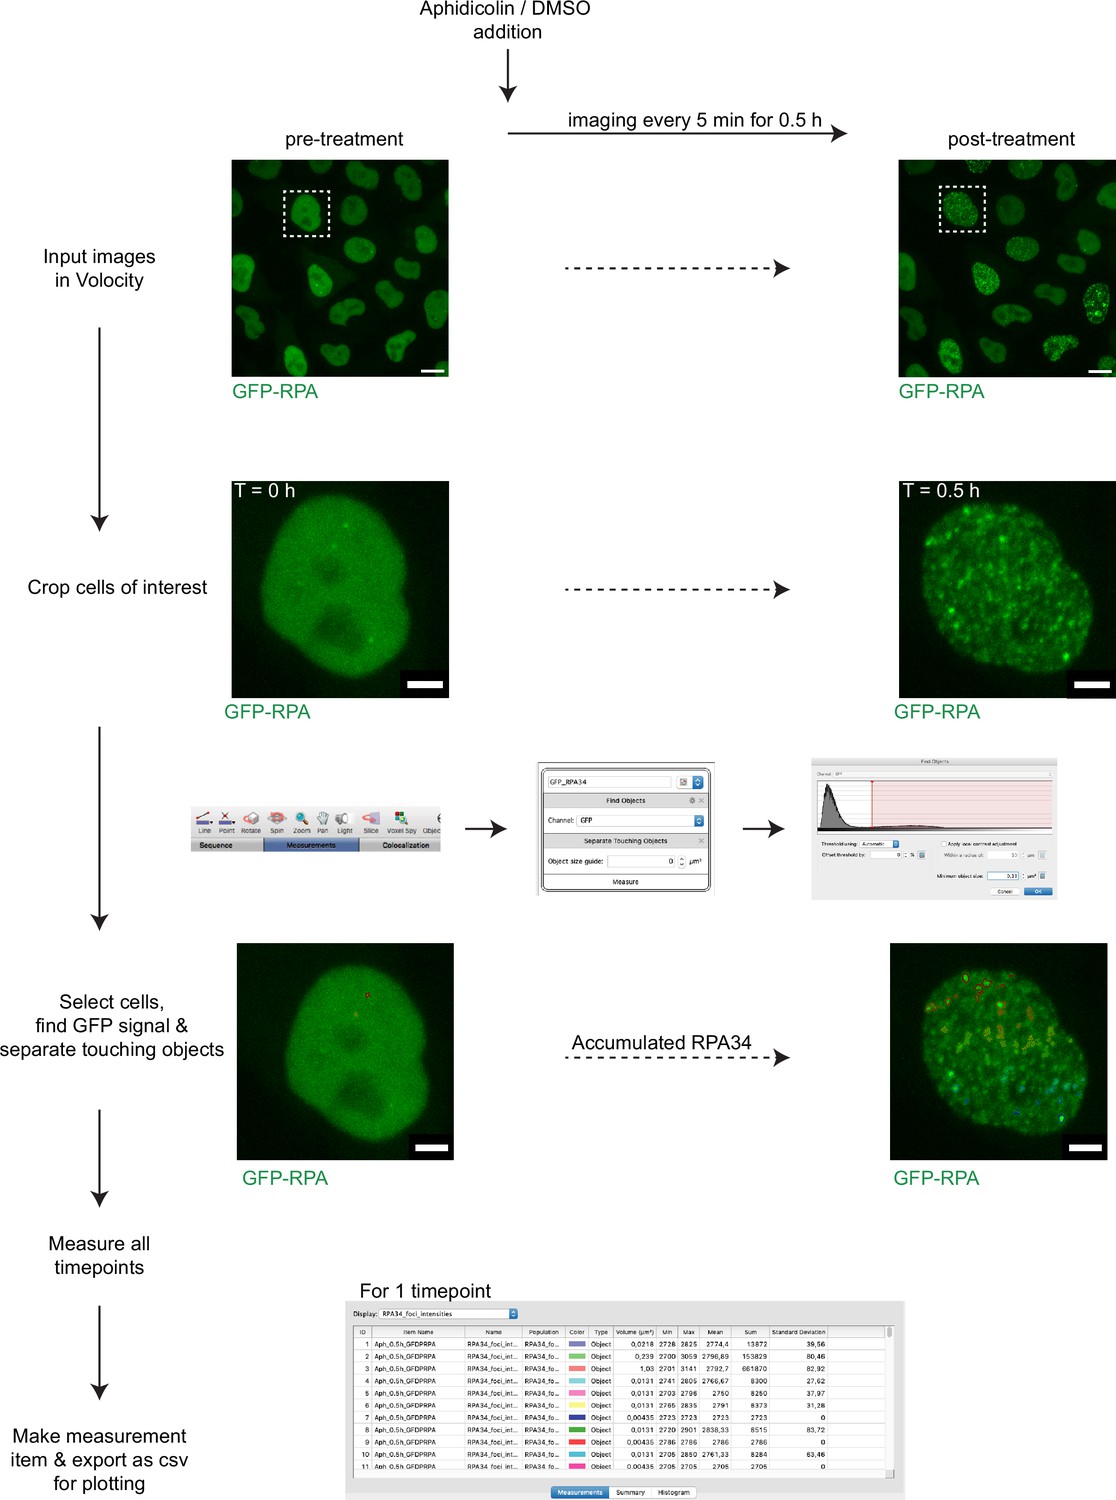
Pipeline for the analysis of RPA enrichment at replication sites in living cells.
The enrichment or accumulation analysis was performed using PerkinElmer Volocity 6.3 software. Briefly cells of interest (white inserts) were cropped and Z-stacks along with different time points were imported together. The GFP-RPA34 intensities at different time points for aphidicolin (every 5 min/0.5 hr) were measured and the coefficient of variation Cv was calculated (Materials and methods, Accumulation analysis). The intensity values were exported as CSV files for further analysis. The plots were generated in RStudio. Scale bar: 5 μm. Cropped cells scale bar: 1 μm.
Figure 5—figure supplement 6
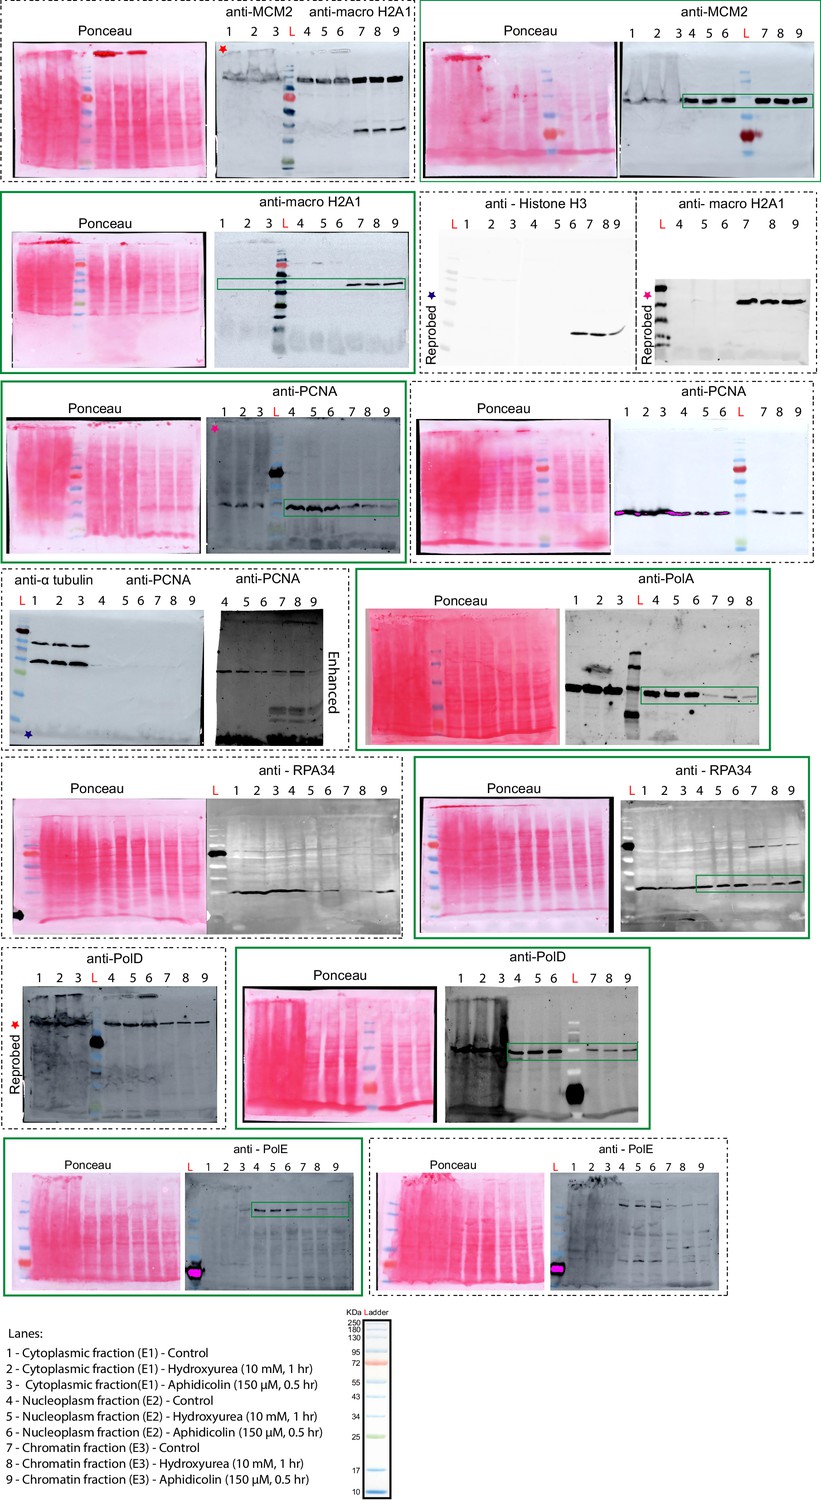
Full-length western blots probed for different replication factors with cytoplasm, nucleoplasm, and chromatin fractions.
The blots that are reprobed with a different antibody are highlighted with color stars. The blots highlighted with green inserts are the full length and single contrast blots that are cropped for easier visualization in Figure 5C. The loading order of samples and ladder are different and samples are highlighted with numbers 1-9 and are summarized in Figure 5C.
Figure 5—figure supplement 7
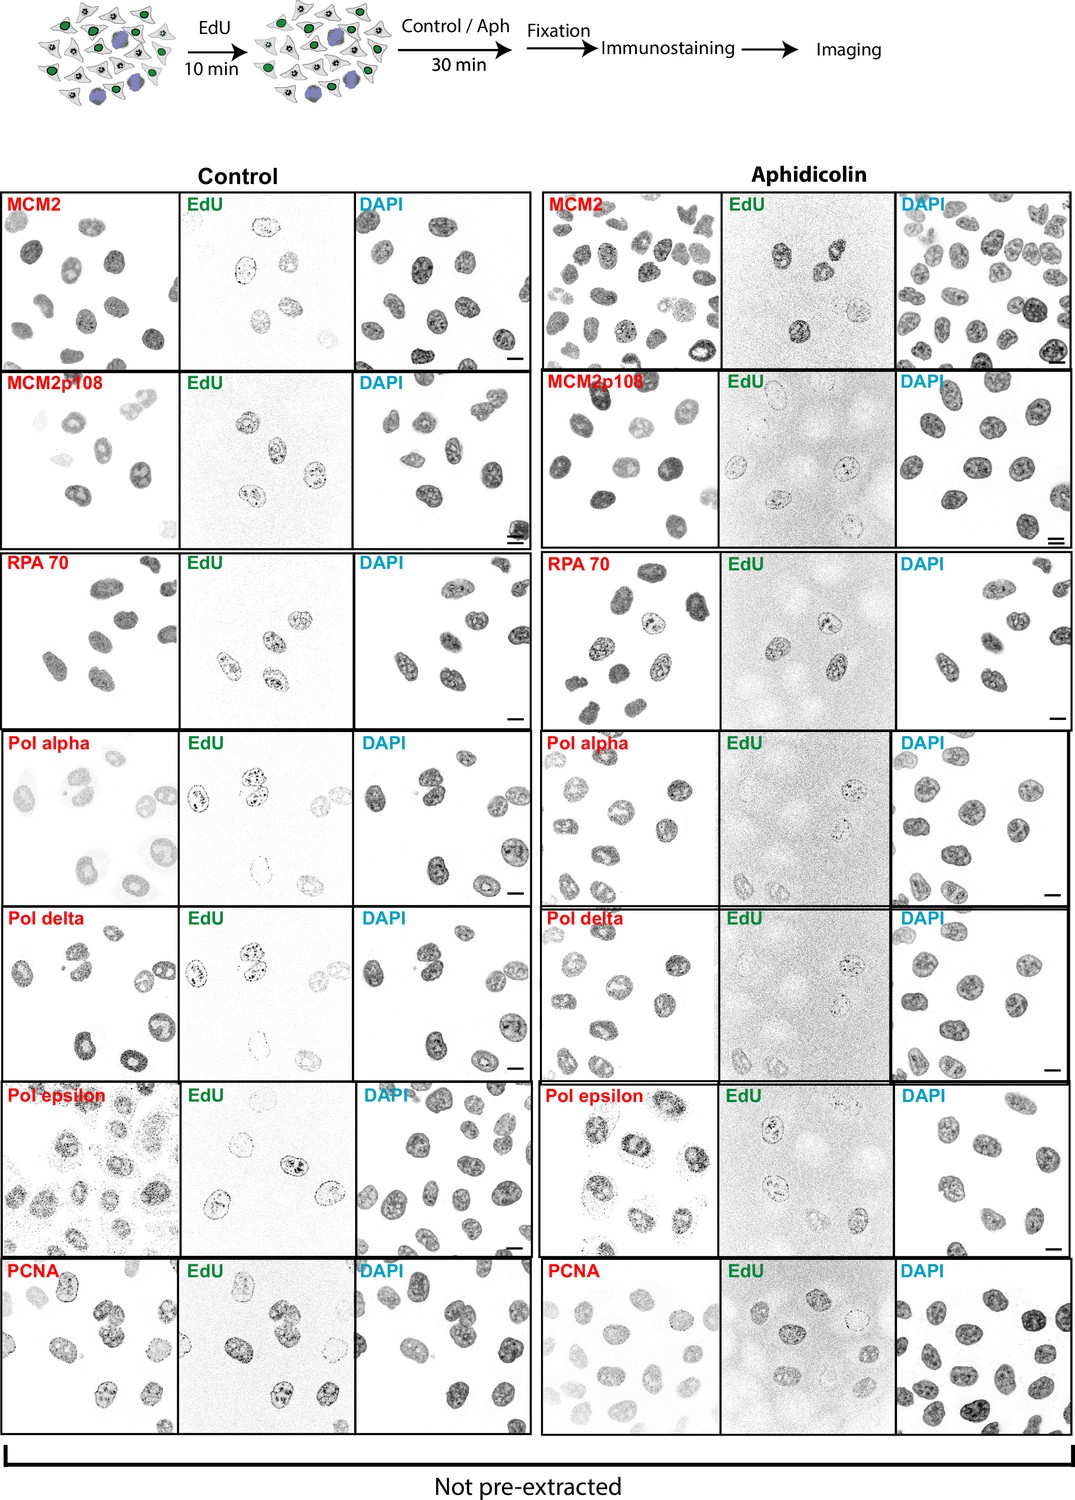
Analysis of replisome component enrichment at replication sites upon replication stress.
Spatial localization and accumulation analysis of DNA replication factors such as DNA helicase subunit MCM2 and active MCM2 phosphorylated at S108, polymerase clamp protein (proliferating cell nuclear antigen [PCNA]), single-stranded binding protein (RPA), and DNA polymerases (α, δ, ε) catalytic subunits using immunostainings. The cells in S-phase were identified using an EdU pulse before the treatment. Representative low-magnification images of protein localization in control and aphidicolin-treated HeLa cells. For quantification see Figure 5D. Scale bar: 10 µm.
Figure 5—figure supplement 8

Pipeline for the analysis of replisome components on chromatin upon stress.
(A) The accumulation analysis was performed. The channels were separated, the DAPI channel was used for creation of nuclear mask, the EdU and replication proteins channels were used for replication foci segmentation. The nuclear mask was overlaid with the replication foci mask, so that only foci inside of the nuclear area were selected. The replication foci parameters were measured as follows: focus intensity parameters, focus area, foci number per nucleus (Materials and methods, High-throughput image analysis of replisome component). The replication foci values per nucleus together with the DAPI nuclear intensity were exported for further analysis. The plots were generated in RStudio. (B) Box plots from Figure 5D are shown here at the same Y axis scale.
Figure 6 with 2 supplements
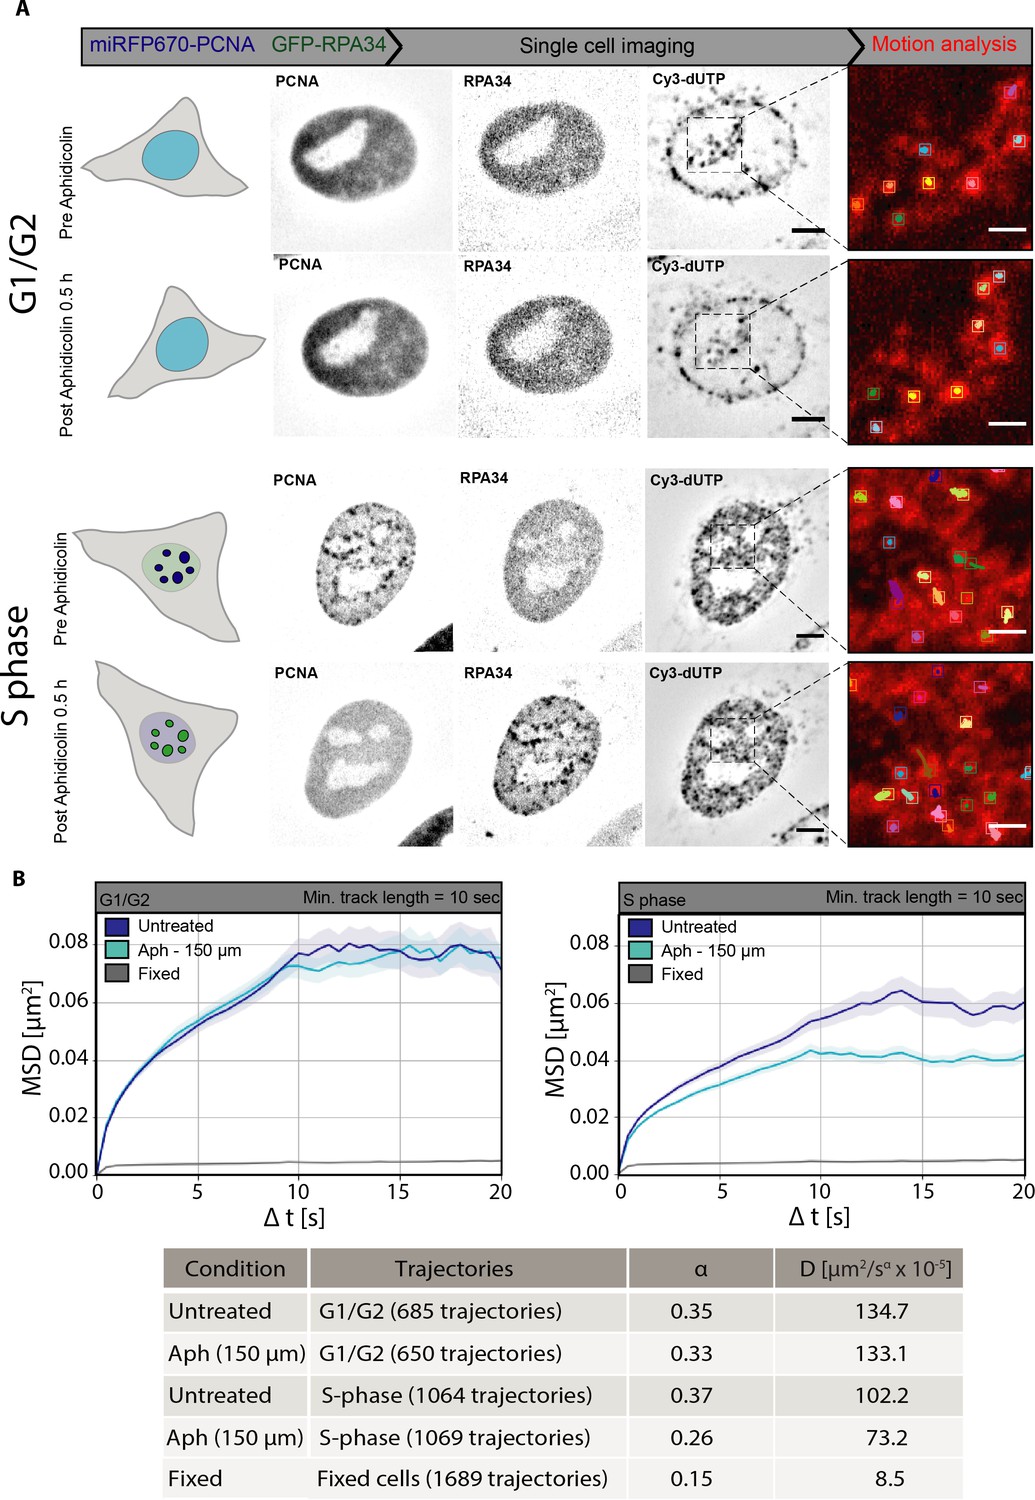
Inhibition of DNA synthesis by aphidicolin further restricts chromatin mobility in S-phase but not in G1/G2 cells.
(A) Representative images of HeLa GFP-RPA34 cells transfected with a construct coding for miRFP670-proliferating cell nuclear antigen (PCNA) and Cy3-dUTP nucleotides for both G1/G2 and S-phase cells pre- and post-aphidicolin (Aph) treatment. The chromatin foci were imaged using the spinning disk microscope. The image sequences were used to perform motion analysis. The cropped region (black dashed lines) shows the motion analysis of chromatin tracks before and after treatment of the same cells (see also Videos 6 and 7). (B) Mean square displacement (MSD) curves over time were plotted for all chromatin tracks for untreated and aphidicolin-treated (150 µM) cells in G1/G2 and S-phase. The error bars are represented in transparent color around the curve. The table below provides the detailed information on number of trajectories per individual sample along with average diffusion rates (µm2/s × 10–5) and anomalous α coefficient showing subdiffusion. The MSD were plotted with error bars (standard deviation) represented in transparent color around the curve. Scale bar: 5 µm. Insets scale bar: 1 µm.
Figure 6—figure supplement 1
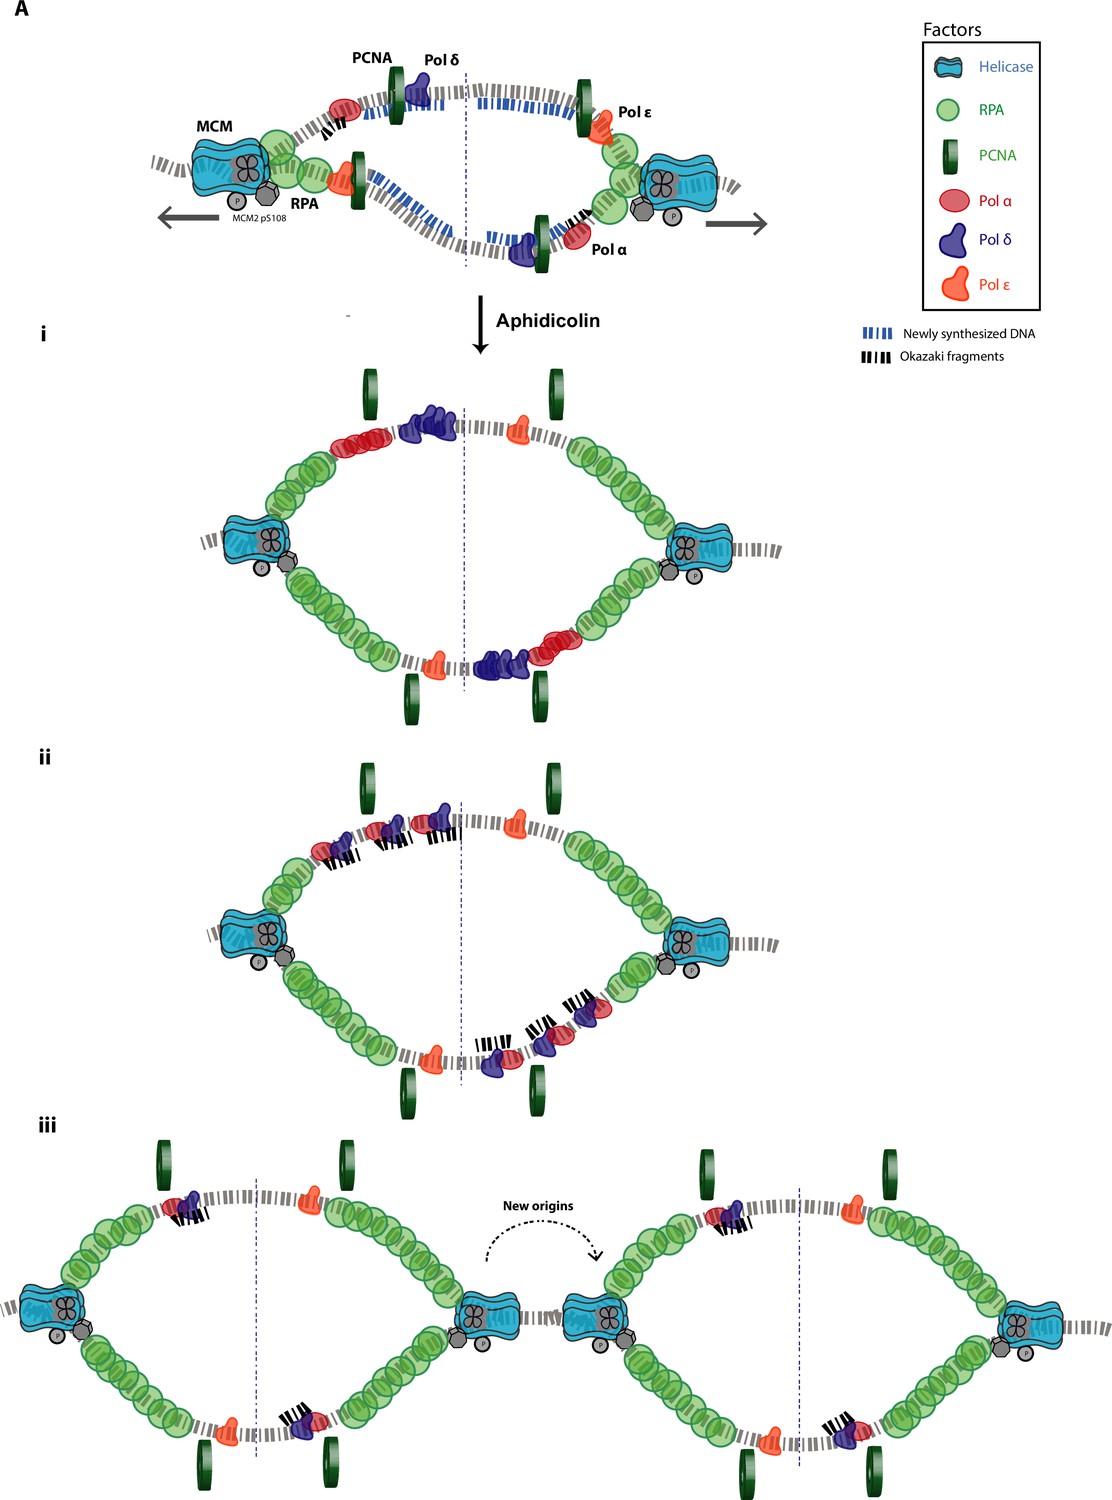
Model describing the different scenarios of replisome response to stress.
Figure 6—figure supplement 2
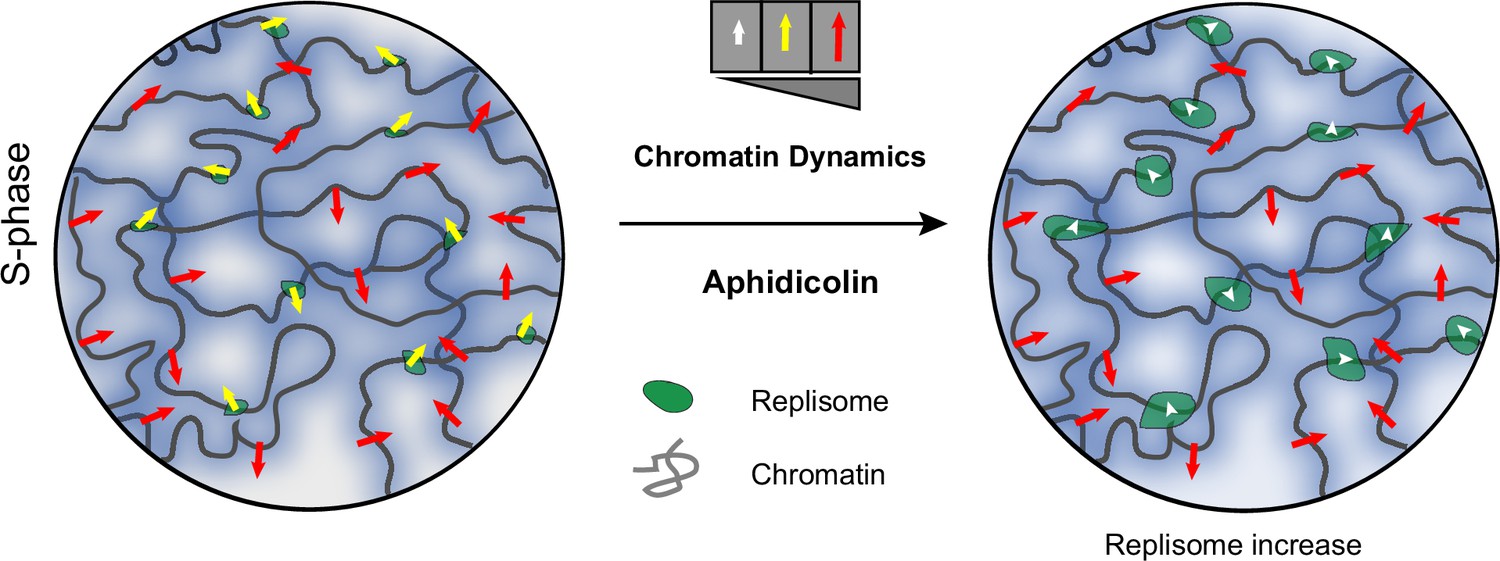
Graphical abstract showing chromatin dynamics during S-phase and replication stress.
Videos
Video 1
Time-lapse microscopy of HeLa K cells in G1 phase expressing fluorescent proliferating cell nuclear antigen (PCNA) (green) and labeled chromatin (red).
Scale bar: 5 µm.
Video 2
Time-lapse microscopy of HeLa K cells in G2 phase expressing fluorescent proliferating cell nuclear antigen (PCNA) (green) and labeled chromatin (red).
Scale bar: 5 µm.
Video 3
Time-lapse microscopy of HeLa K cells in S-phase expressing fluorescent proliferating cell nuclear antigen (PCNA) (green) and labeled chromatin (red).
Scale bar: 5 µm.
Video 4
Time-lapse microscopy of IMR90 cells in G1 phase expressing fluorescent proliferating cell nuclear antigen (PCNA) (green) and labeled chromatin (red).
Scale bar: 5 µm.
Video 5
Time-lapse microscopy of IMR90 cells in S-phase expressing fluorescent proliferating cell nuclear antigen (PCNA) (green) and labeled chromatin (red).
Scale bar: 5 µm.
Video 6
Time-lapse microscopy of HeLa K cells pre- and post-aphidicolin treatment in G1/G2 phase expressing fluorescent proliferating cell nuclear antigen (PCNA) and RPA and labeled chromatin (red).
Scale bar: 5 µm.
Video 7
Time-lapse microscopy of HeLa K cells pre- and post-aphidicolin treatment in S-phase expressing fluorescent proliferating cell nuclear antigen (PCNA) and RPA and labeled chromatin (red).
Scale bar: 5 µm.
Additional files
-
Supplementary file 1
The Supplementary file 1 contains tables 1a–1i, which describes the materials, software, and datasets.
- https://cdn.elifesciences.org/articles/87572/elife-87572-supp1-v1.docx
Download links
A two-part list of links to download the article, or parts of the article, in various formats.
Downloads (link to download the article as PDF)
Open citations (links to open the citations from this article in various online reference manager services)
Cite this article (links to download the citations from this article in formats compatible with various reference manager tools)
Replisome loading reduces chromatin motion independent of DNA synthesis
eLife 12:RP87572.
https://doi.org/10.7554/eLife.87572.3


