Long-read single-cell sequencing reveals expressions of hypermutation clusters of isoforms in human liver cancer cells
- Department of Pathology, University of Pittsburgh, United States
- High Throughput Genome Center, University of Pittsburgh, United States
- Pittsburgh Liver Research Center, University of Pittsburgh, United States
- Element Biosciences Inc, United States
- Biostatistics, University of Pittsburgh, United States
Figures
Figure 1

Schema of the workflow for the single-cell LoopSeq assay.
A total of 200–300 live cells per sample were co-partitioned with Gel Beads and subsequently lysed. The captured mRNAs were reverse-transcribed and barcoded using Chromium Next GEM 3' reagent 3.1 kit (10x Genomics). The cellular barcoded cDNAs were ligated with a LoopSeq Adapter (Element Biosciences) and enriched by human core exome capturing (Twist Biosciences). This was followed by amplification and intramolecular distribution of the LOOP unique molecular identifier (UMI) located on the LoopSeq Adapter. The LOOP UMI barcoded cDNAs were then fragmented and ligated with an adaptor to generate a short-read sequencing library before sequencing.
Figure 2
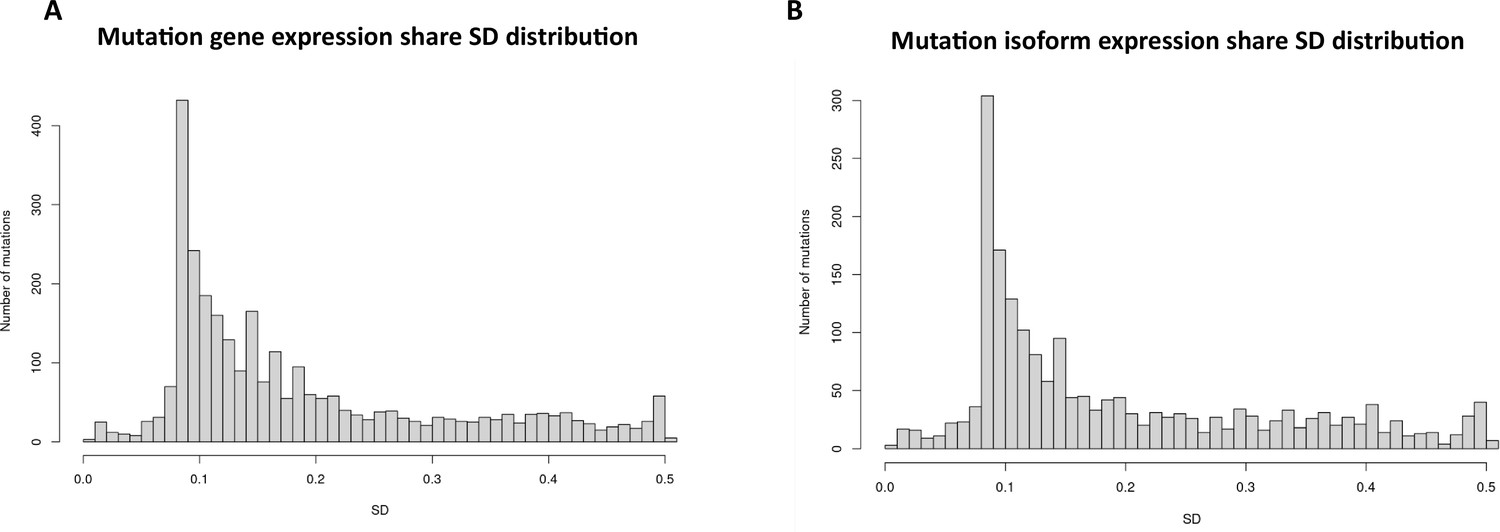
Mutation expression standard deviations.
(A) Mutational gene expressions share standard deviation across all transcriptomes. (B) Mutational isoform expression share standard deviation across all transcriptomes.
Figure 3 with 1 supplement
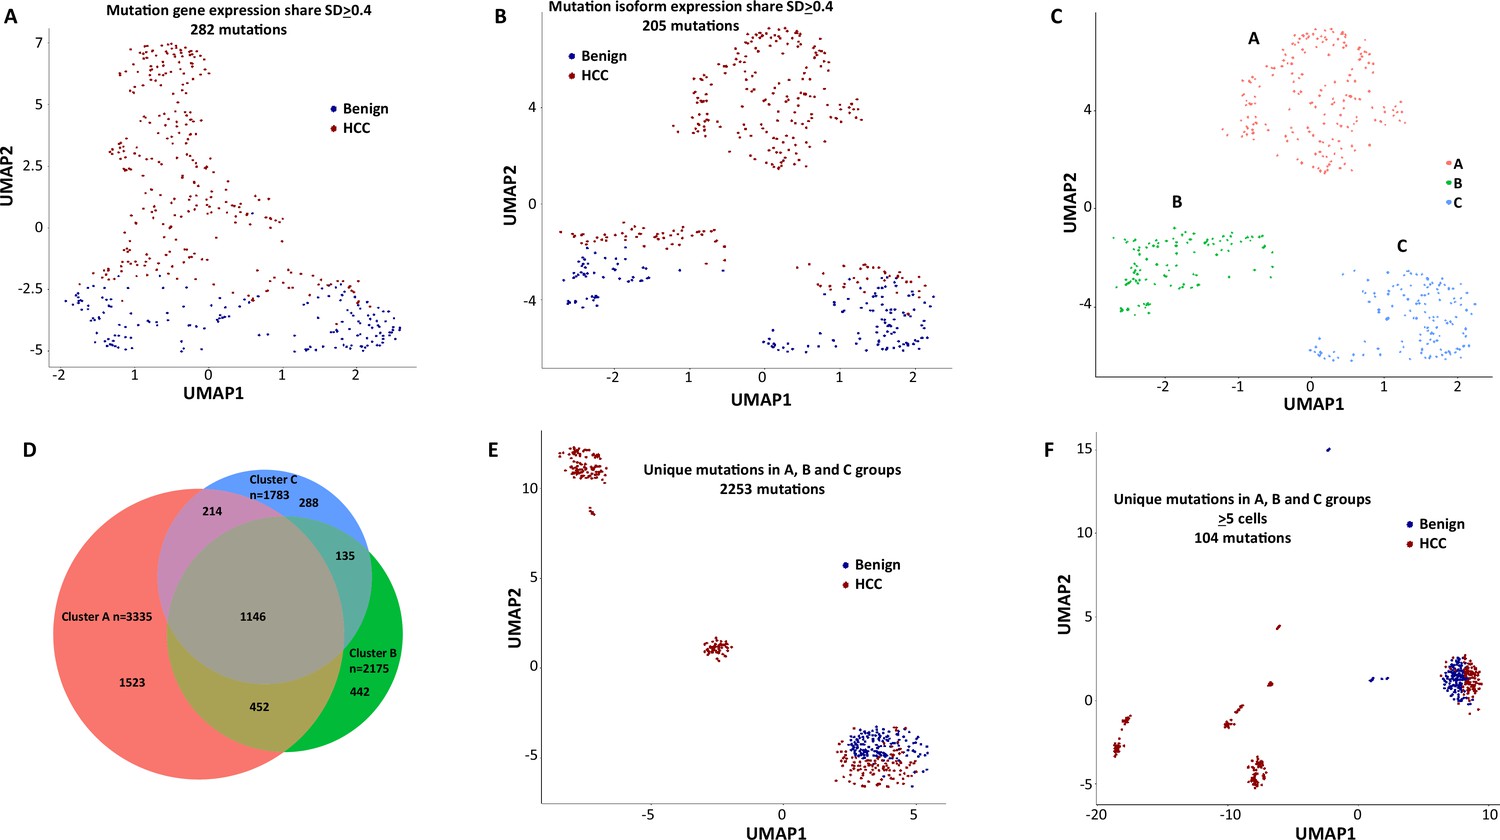
Mutation expression clustering of cells from hepatocellular carcinoma (HCC) and its benign liver counterpart.
(A) Uniform Manifold Approximation and Projection (UMAP) clustering of cells from the HCC and benign liver, based on mutational gene expressions shares with standard deviations ≥ 0.4. Red cells are from HCC; Blue cells are from benign liver. (B) UMAP clustering of cells from the HCC and benign liver based on mutational isoform expression shares with standard deviations ≥ 0.4. (C) Relabeling of clusters from (B) as ‘A’, ‘B’, and ‘C’. (D) Venn diagram of mutational isoform expressions in cells from clusters A, B, and C. (E) UMAP clustering of cells from the HCC and benign liver based on the mutational isoform expressions from clusters A, B, and C. (F) UMAP clustering of cells from the HCC and benign liver based on the mutational isoform expression in at least five cells from clusters A, B, and C.
Figure 3—figure supplement 1
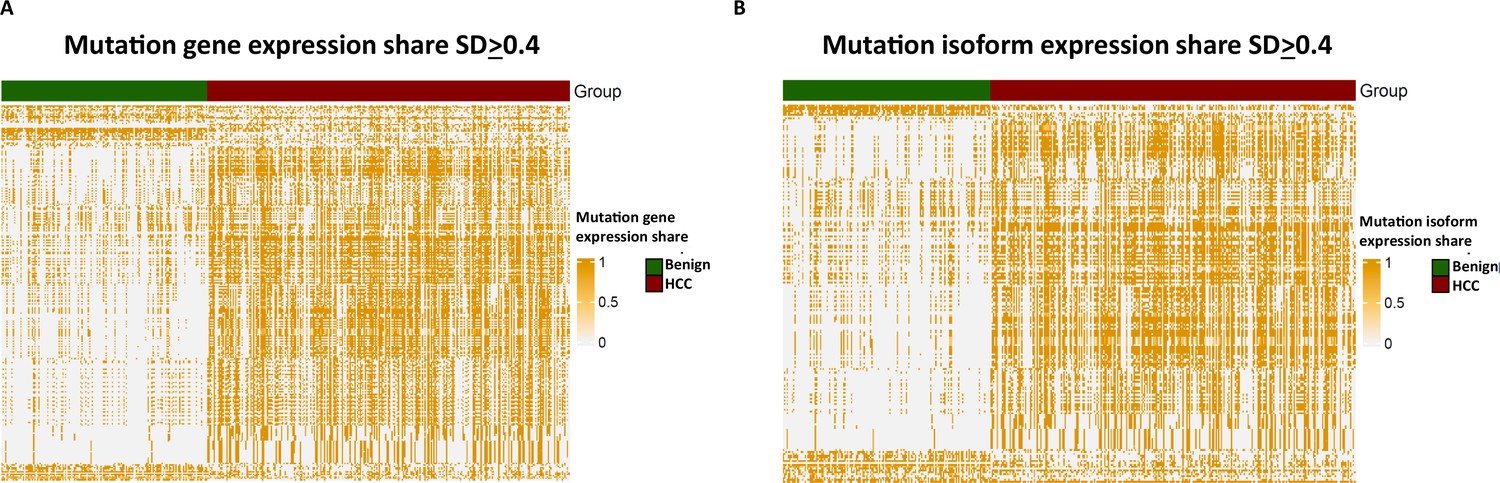
Heatmaps of mutational gene expression.
(A) Heatmap of mutational gene expression share with standard deviations ≥ 0.4. Cells from the hepatocellular carcinoma (HCC) and benign liver are indicated. (B) Heatmap of mutational isoform expression shares with standard deviation ≥ 0.4. Cells from the HCC and benign liver are indicated.
Figure 4
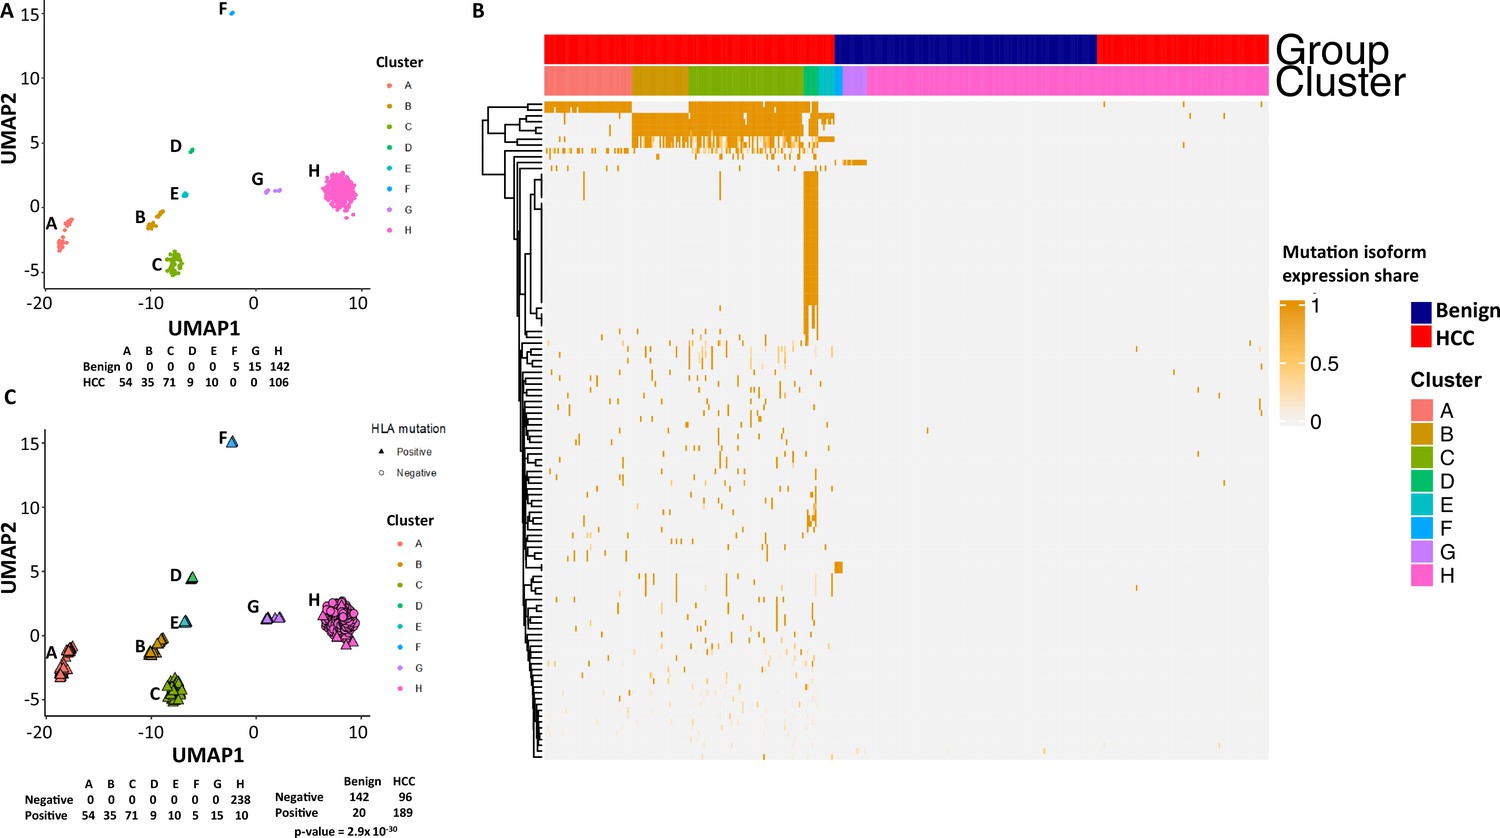
Mutations in human leukocyte antigen (HLA) molecules dominated the landscape of hepatocellular carcinoma (HCC) mutational isoform expressions.
(A) The Uniform Manifold Approximation and Projection (UMAP) clusters from Figure 2F are relabeled as A–H groups as indicated. Cells from HCC and benign liver in each cluster are indicated. (B) Heatmap of 104 mutational isoform expressions in the HCC and benign liver and clusters A–H. (C) Relabeling of UMAP clusters from (A), with cells expressing mutation HLA isoforms in triangles. Cells expressing mutation HLA isoforms in each cluster are indicated.
Figure 5

Evolution of mutations in HLA-DQB1 molecule.
(A) Somatic mutations in single molecules of HLA-DQB1 NM_002123. The position of mutation is indicated at the bottom of the graph. The mutation is numerically numbered from C-terminus to N-terminus. The numbers of cells expressing these mutation isoforms from each cluster (indicated at the top) or sample of origin (indicated at the bottom) are shown in the right panel. Close circle, mutation codon; open circle, wild-type codon; open rectangle, double single-nucleotide mutation in the same codon. (B) Pathway flowchart of mutation accumulation in single molecules of HLA-DQB1. The area of the circle is proportional to the accumulated number of mutations in a molecule. The scale on the left indicates the number of mutations in a single molecule but is not mathematically scaled. The arrow indicates the potential pathways of mutation accumulation in these molecules. The number of white text indicates specific mutation(s) in a molecule. The number of red text indicates the number of cells expressing the mutation(s).
Figure 6
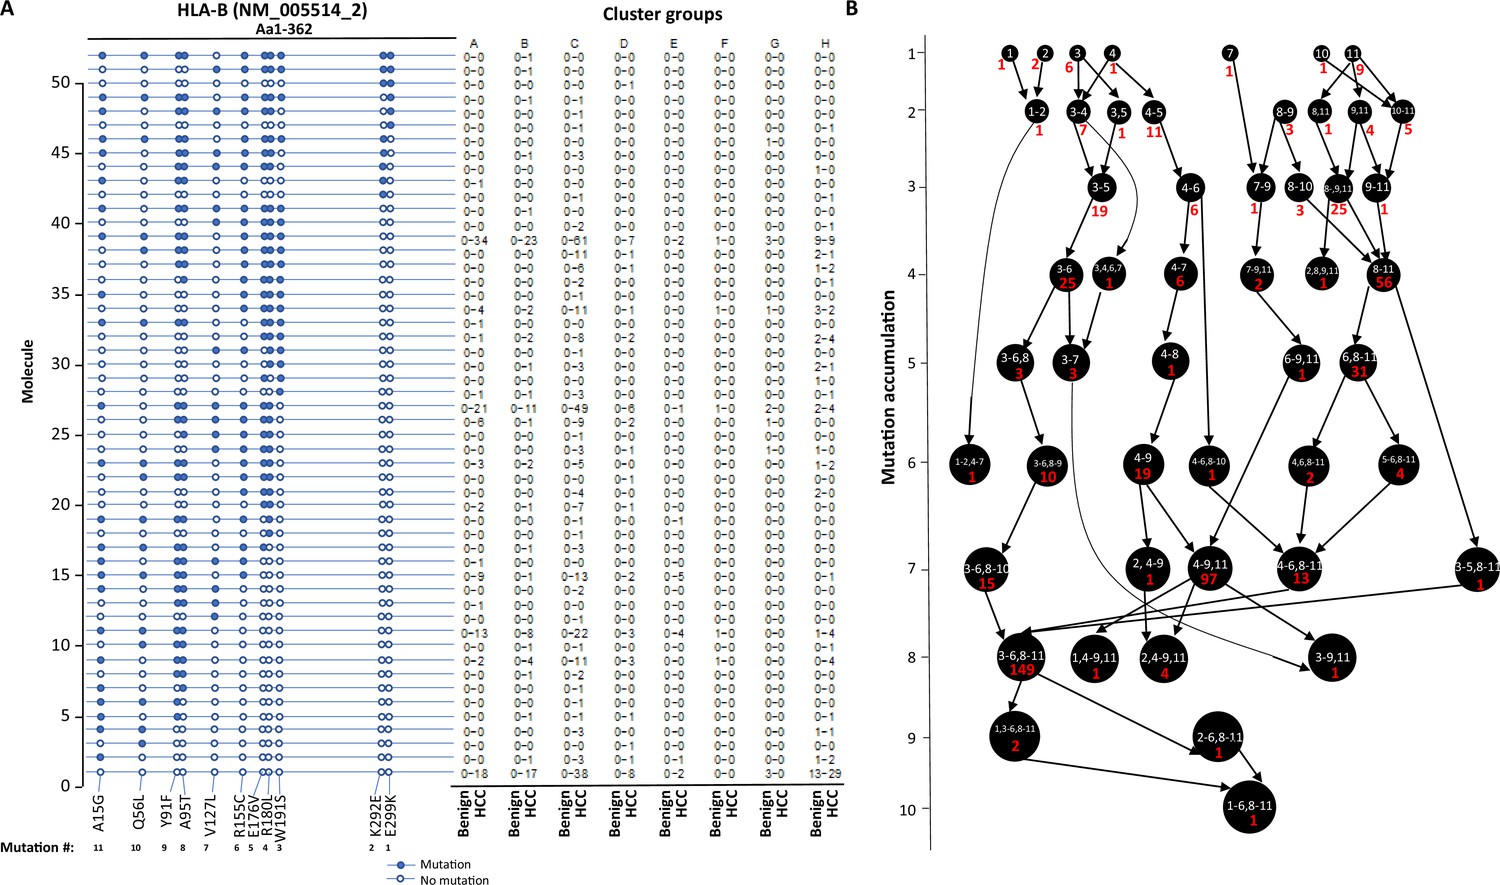
Evolution of mutations in HLA-B molecules.
(A) Somatic mutations in single molecules of HLA-B NM_005514_2. The position of the mutations is indicated at the bottom of the graph. Mutations are numerically numbered from C-terminus to N-terminus. The numbers of cells expressing these mutation transcripts from each cluster or sample are indicated in the right panel. Close circle, mutation codon; open circle, wild-type codon. (B) Pathway flowchart of mutation accumulation in single molecules of HLA-B. The area of the circle is proportional to the accumulated number of mutations in a molecule. The scale on the left indicates the number of mutations in a single molecule but is not mathematically scaled. The arrow indicates the potential pathways of mutation accumulation in these molecules. The number in white text indicates the specific mutation(s) in a molecule. The number in red text indicates the number of cells expressing the mutation(s).
Figure 7
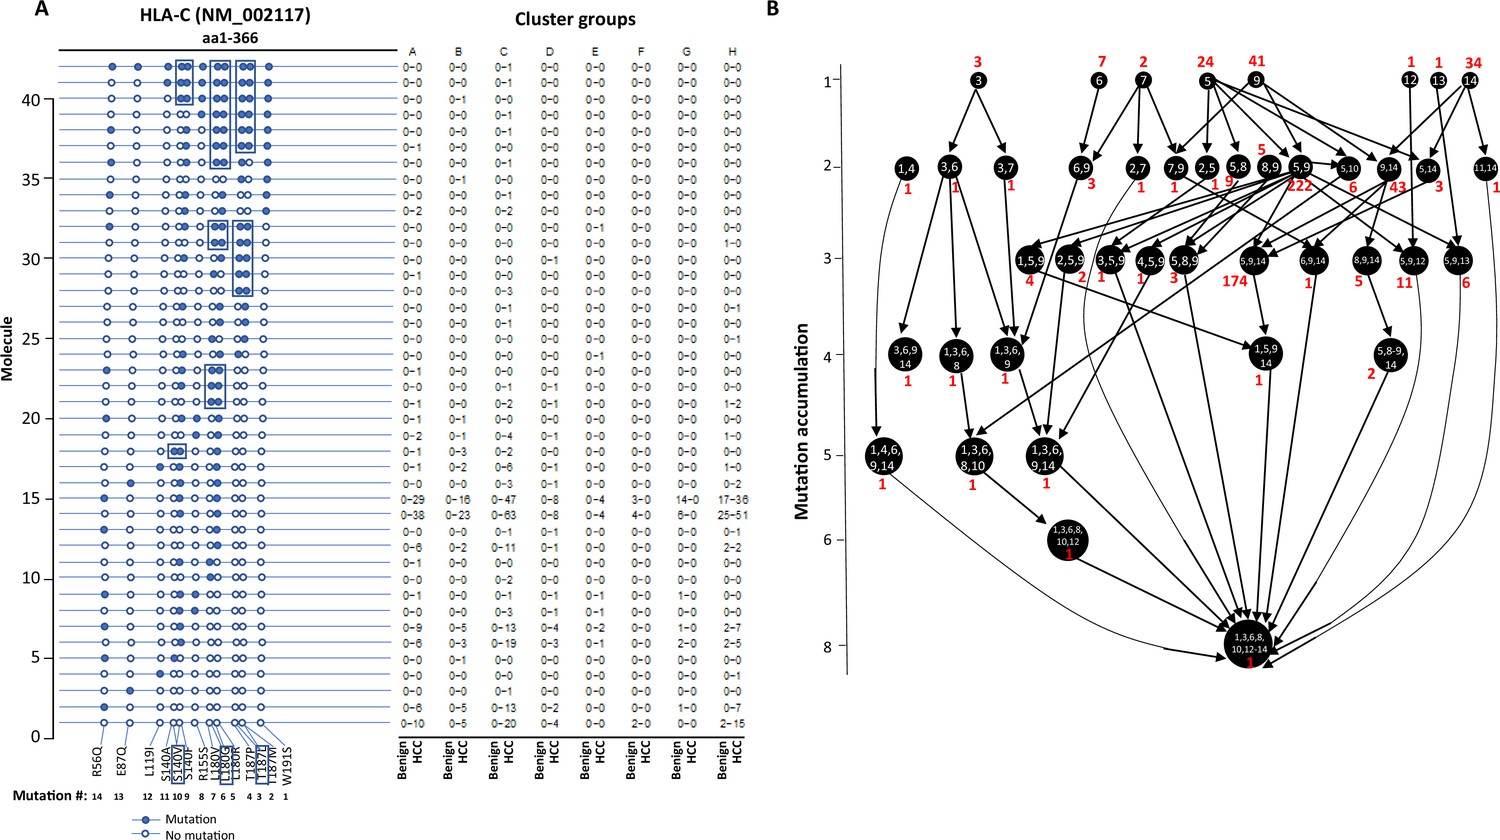
Evolution of mutations in HLA-C molecules.
(A) Somatic mutations in single molecules of HLA-C NM_002117. The position of the mutation is indicated at the bottom of the graph. The mutation is numerically numbered from C-terminus to N-terminus. The numbers of cells expressing these mutation transcripts from each cluster or sample are indicated in the right panel. Close circle, mutation codon; open circle, wild-type codon; open rectangle, double single-nucleotide mutation in the same codon. (B) Pathway flowchart of mutation accumulation in single molecules of HLA-C. The area of the circle is proportional to the accumulated number of mutations in a molecule. The scale on the left indicates the number of mutations in a single molecule but is not mathematically scaled. The arrow indicates the potential pathways of mutation accumulation in these molecules. The number in white text indicates specific mutation(s) in a molecule. The number in red text indicates the number of cells expressing the mutation(s).
Figure 8
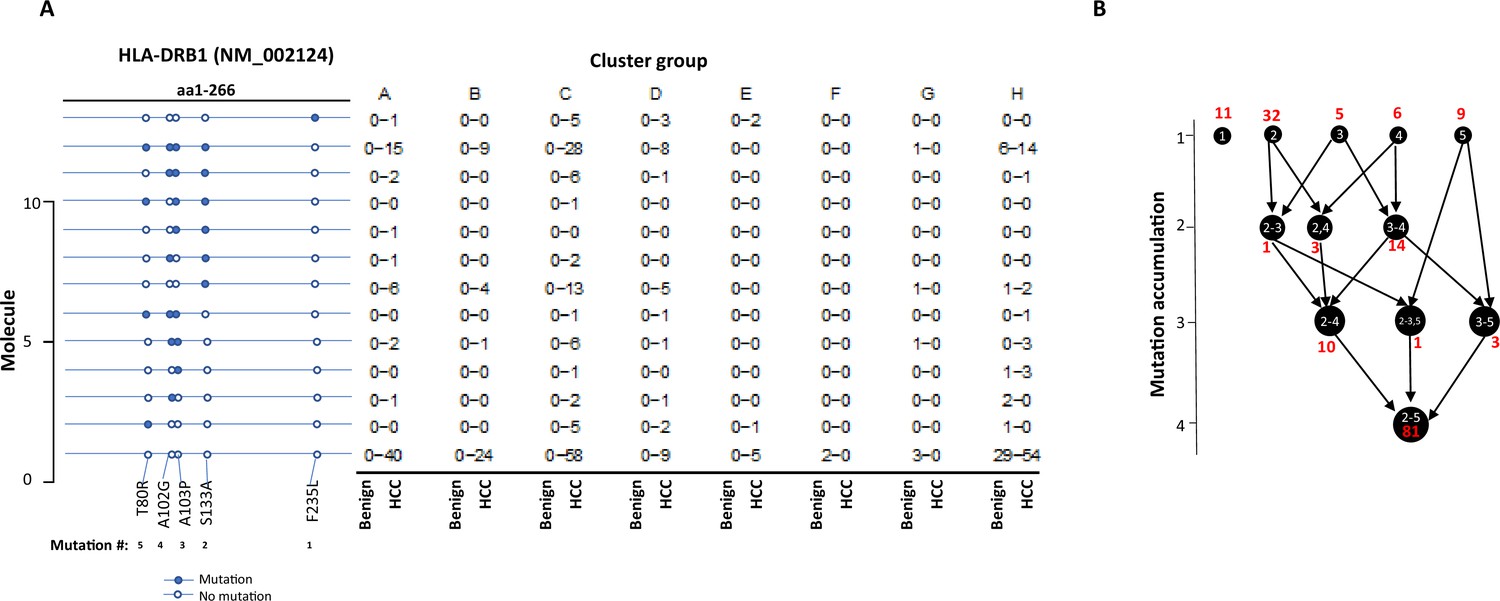
Evolution of mutations in HLA-DRB1 molecules.
(A) Somatic mutations in single molecules of HLA-DRB1 NM_002124. The position of mutation is indicated at the bottom of the graph. The mutation is numerically numbered from C-terminus to N-terminus. The numbers of cells expressing these mutation transcripts from each cluster or sample are indicated in the right panel. Close circle, mutation codon; open circle, wild-type codon. (B) Pathway flowchart of mutation accumulation in single molecules of HLA-DRB1. The area of the circle is proportional to the accumulated number of mutations in a molecule. The scale on the left indicated the number of mutations in a single molecule but is not mathematically scaled. The arrow indicates the potential pathways of mutation accumulation in these molecules. The number in white text indicates specific mutation(s) in a molecule. The number in red text indicates the number of cells expressing the mutation(s).
Figure 9 with 1 supplement

Mutation isoform expression of DOCK8 and STEAP4.
(A) Heatmap of wild-type and mutation isoform expressions of DOCK8. The number of transcript, the position of mutation, and the specific isoforms is indicated. Some transcripts have multiple assignment due to detection of partial transcripts. *Prediciton based on sequence of NM_203447. (B) Heatmap of wild-type and mutation isoform expression of STEAP4. The number of transcript, the position of mutation, and the specific isoforms is indicated.
Figure 9—figure supplement 1
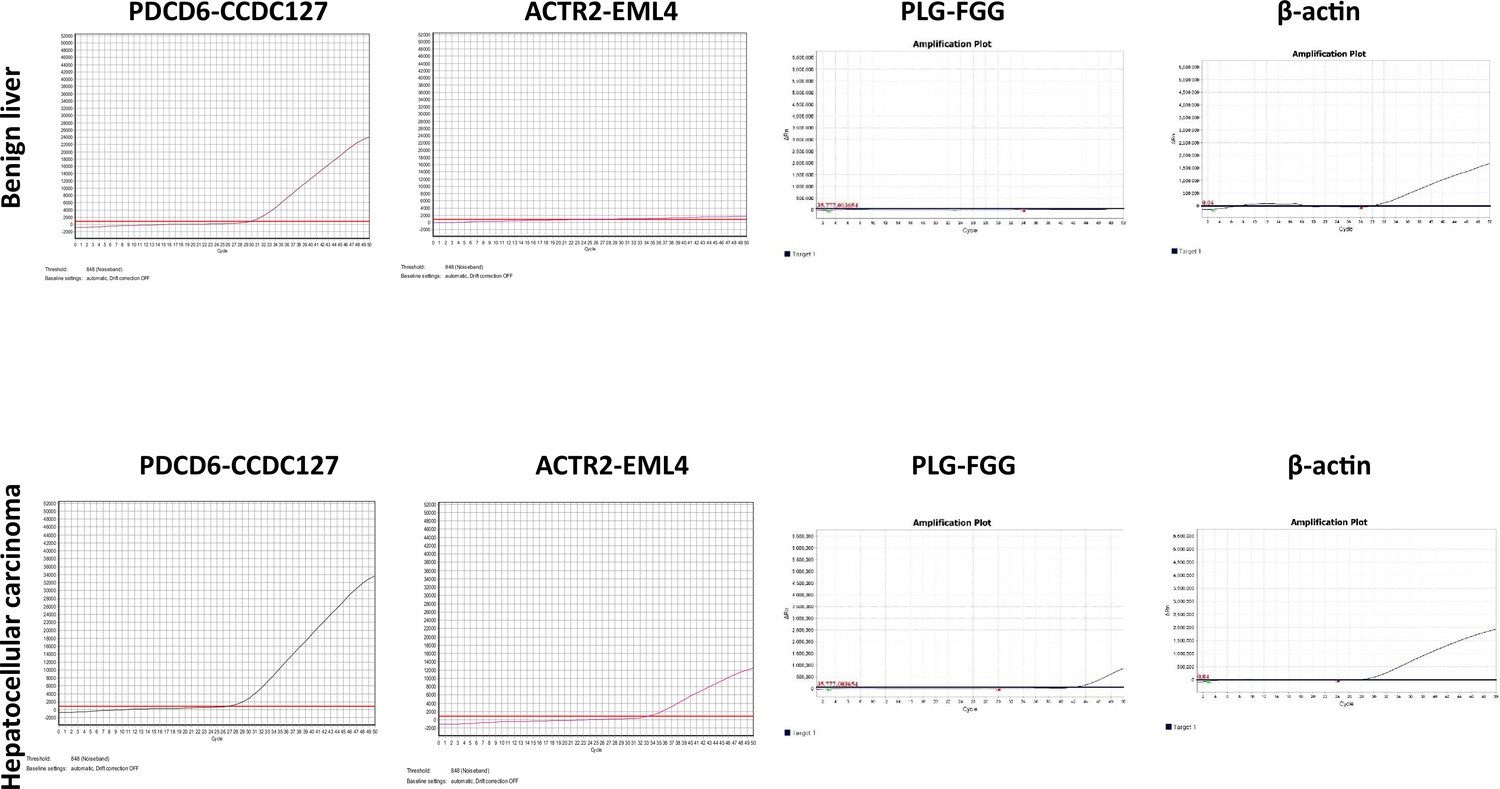
TaqMan RT-PCR of fusion transcripts in hepatocellular carcinoma (HCC) and benign liver samples.
Top panel: TaqMan RT-PCR results of PDCD6-CCDC127, ACTR2-EML4, PLG-FGG, and β-actin from the benign liver sample. Bottom panel: TaqMan RT-PCR results of PDCD6-CCDC127, ACTR2-EML4, PLG-FGG, and β-actin from the HCC sample.
Figure 10

Fusion gene expression validation in hepatocellular carcinoma (HCC) sample.
Left panel: ACTR2-EML4 fusion. Top: chromosome organization of EML4 and ACTR2 exons. The directions of transcriptions are indicated. Second from the top: exon representations in ACTR2-EML4 fusion transcript, EML4 NM001145076.3, and ACTR2 NM001005386.3. Middle: chromogram of Sanger sequencing. The segments for ACTR2 and EML4 are indicated. Bottom: protein domain and motif organizations of EML4, ACTR2, and ACTR2-EML4 fusion. Middle panel: PDCD6-CCDC127 fusion. Top: chromosome organization of CCDC127 and PDCD6 exons. The directions of transcriptions are indicated. Second from the top: exon representations in PDCD6-CCDC127 fusion transcript, CCDC127 NM145265.3, and PDCD6 NM013232.4. Middle: chromogram of Sanger sequencing. The segments for PDCD6 and CCDC127 are indicated. Bottom: protein domain and motif organizations of CCDC127, PDCD6, and PDCD6-CCDC127 fusion. Right panel: PLG-FGG fusion. Top: chromosome organization of PLG and FGG exons. The directions of transcriptions are indicated. Second from the top: exon representations in PLG-FGG fusion transcript, PLG NM000301.5, and FGG NM000509.6. Middle: chromogram of Sanger sequencing. The segments for PLG and FGG are indicated. Bottom: protein domain and motif organizations of PLG, FGG, and PLG-FGG fusion. The open-reading frame of FGG was eliminated due to frameshift in PLG-FGG fusion. Unrelated four additional amino acids were added to the truncated N-terminus of PLG.
Figure 11

The impact of fusion gene expressions on the cell clustering generated by mutational isoform expressions.
(A) Uniform Manifold Approximation and Projection (UMAP) cluster analysis of cells from hepatocellular carcinoma (HCC) and benign liver based on 104 mutational isoform expressions and 20 fusion gene expressions. (B) Relabeling of clusters from (A) as clusters A–H. (C) Heatmap of mutational isoform expressions and fusion gene expression shares for clusters A–H. The cells from HCC and benign liver are indicated.
Figure 12 with 8 supplements

Uniform Manifold Approximation and Projection (UMAP) cluster analyses of cells from the hepatocellular carcinoma (HCC) and benign liver based on gene expressions with different standard deviation cutoffs.
(A) UMAP clustering of cells based on gene expression with standard deviations at least 0.5, 0.8, 1.0, or 1.4. The numbers of genes employed in the UMAP analysis are indicated. Blue dot, cell from the benign liver; red dot, cell from HCC. (B) UMAP clustering of cells based on isoform expressions with standard deviations at least 0.5, 0.8, 1.0, or 1.4. The numbers of genes employed in the UMAP analysis are indicated. Blue dot, cell from the benign liver; red dot, cell from HCC.
Figure 12—figure supplement 1
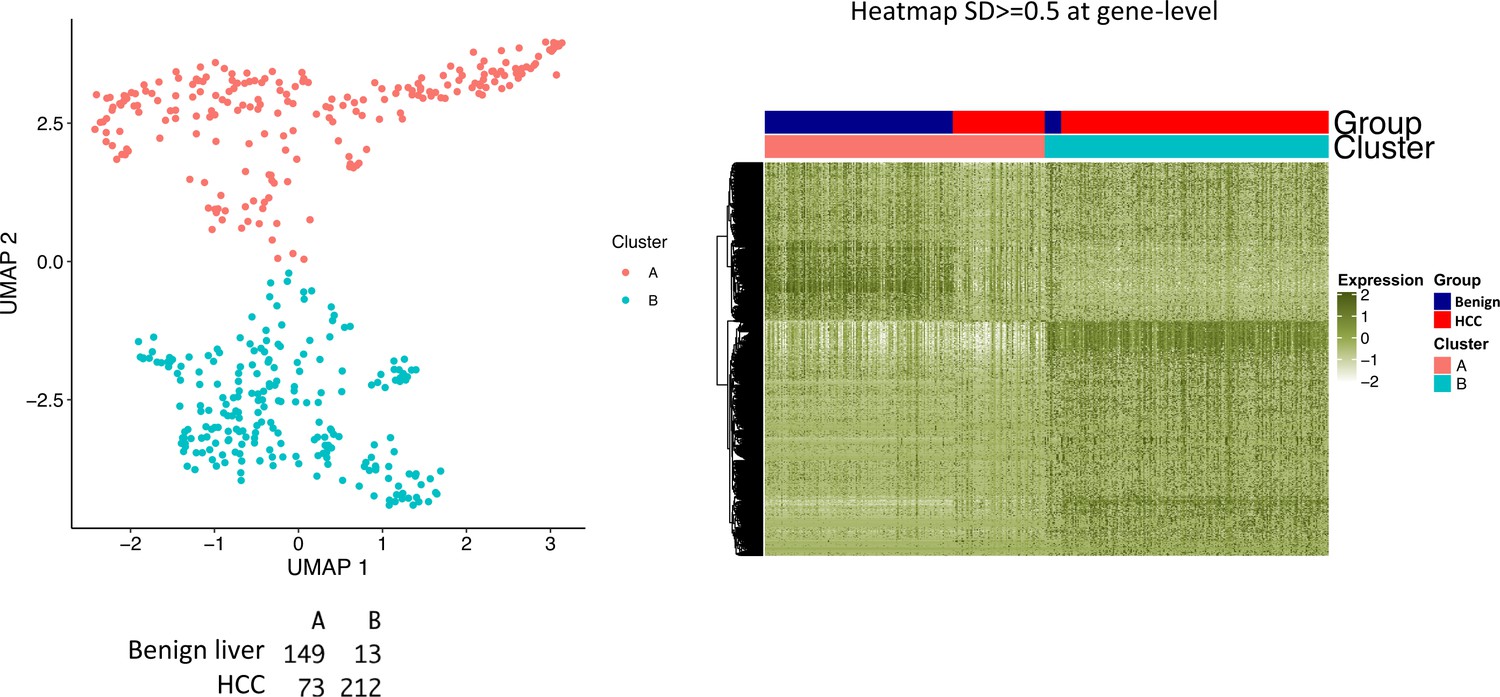
Segregation of cells between hepatocellular carcinoma (HCC) and benign liver samples.
Relabeling of clusters as ‘A’ and ‘B’ based on gene expressions with a standard deviation ≥ 0.5. Left panel: Uniform Manifold Approximation and Projection (UMAP) clustering. The numbers of cells from the HCC and benign liver samples in each cluster are indicated. Right panel: heatmap of clusters A and B. Cells from HCC and benign liver are indicated.
Figure 12—figure supplement 2
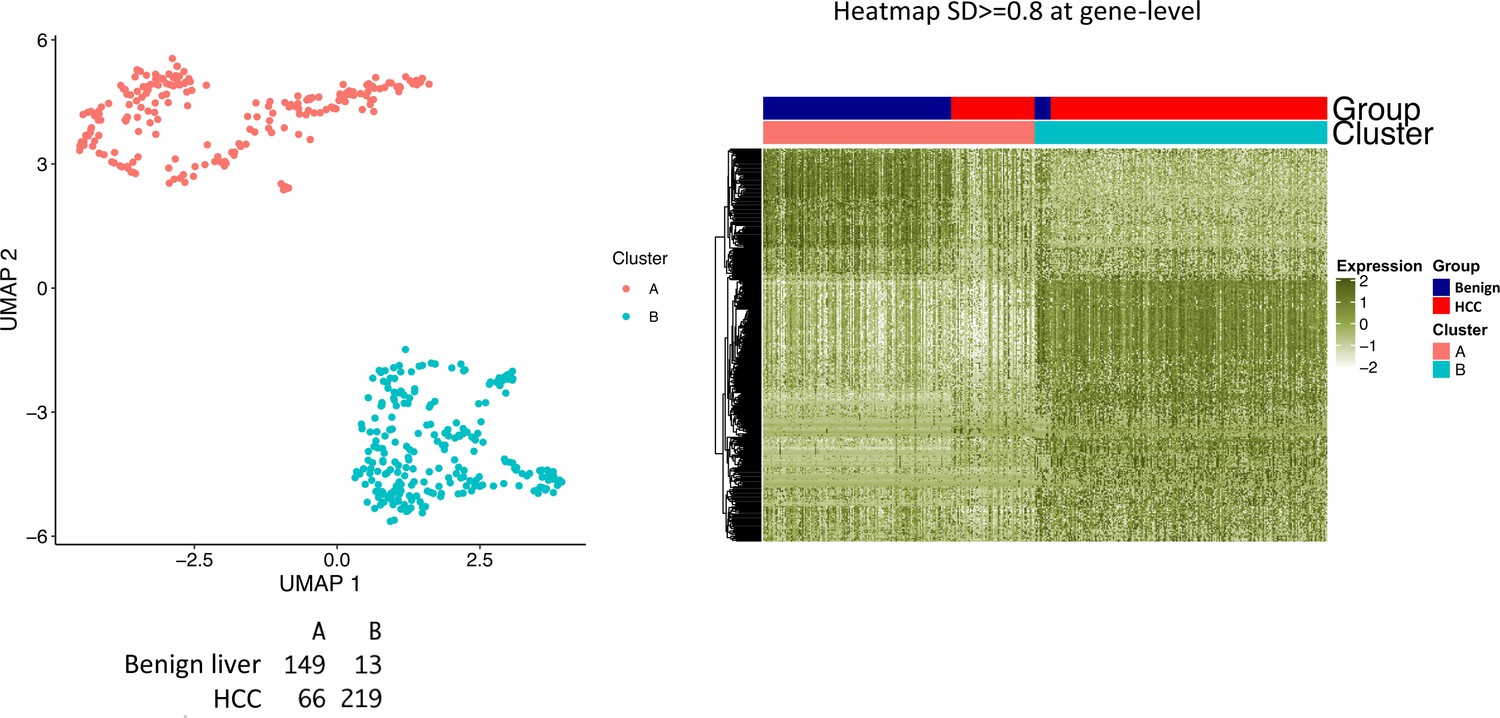
Segregation of cells between hepatocellular carcinoma (HCC) and benign liver samples.
Relabeling of clusters as ‘A’ and ‘B’ based on gene expressions with a standard deviation ≥ 0.8. Left panel: Uniform Manifold Approximation and Projection (UMAP) clustering. The numbers of cells from HCC and benign liver in each cluster are indicated. Right panel: heatmap of clusters A and B. Cells from HCC and benign liver are indicated.
Figure 12—figure supplement 3
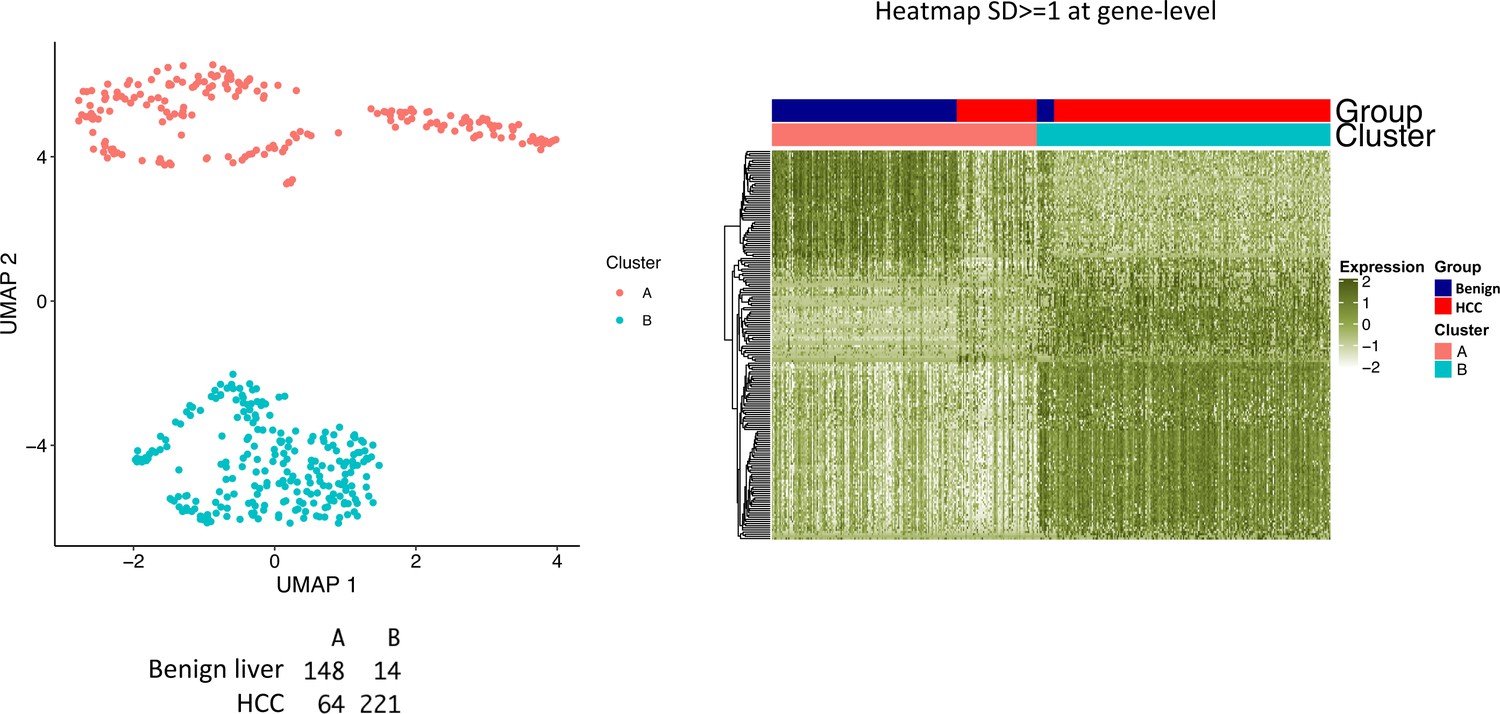
Segregation of cells between hepatocellular carcinoma (HCC) and benign liver samples.
Relabeling of clusters as ‘A’ and ‘B’ based on gene expressions with a standard deviation ≥ 1.0. Left panel: Uniform Manifold Approximation and Projection (UMAP) clustering. The numbers of cells from HCC and benign liver in each cluster are indicated. Right panel: heatmap of clusters A and B. Cells from HCC and benign liver are indicated.
Figure 12—figure supplement 4
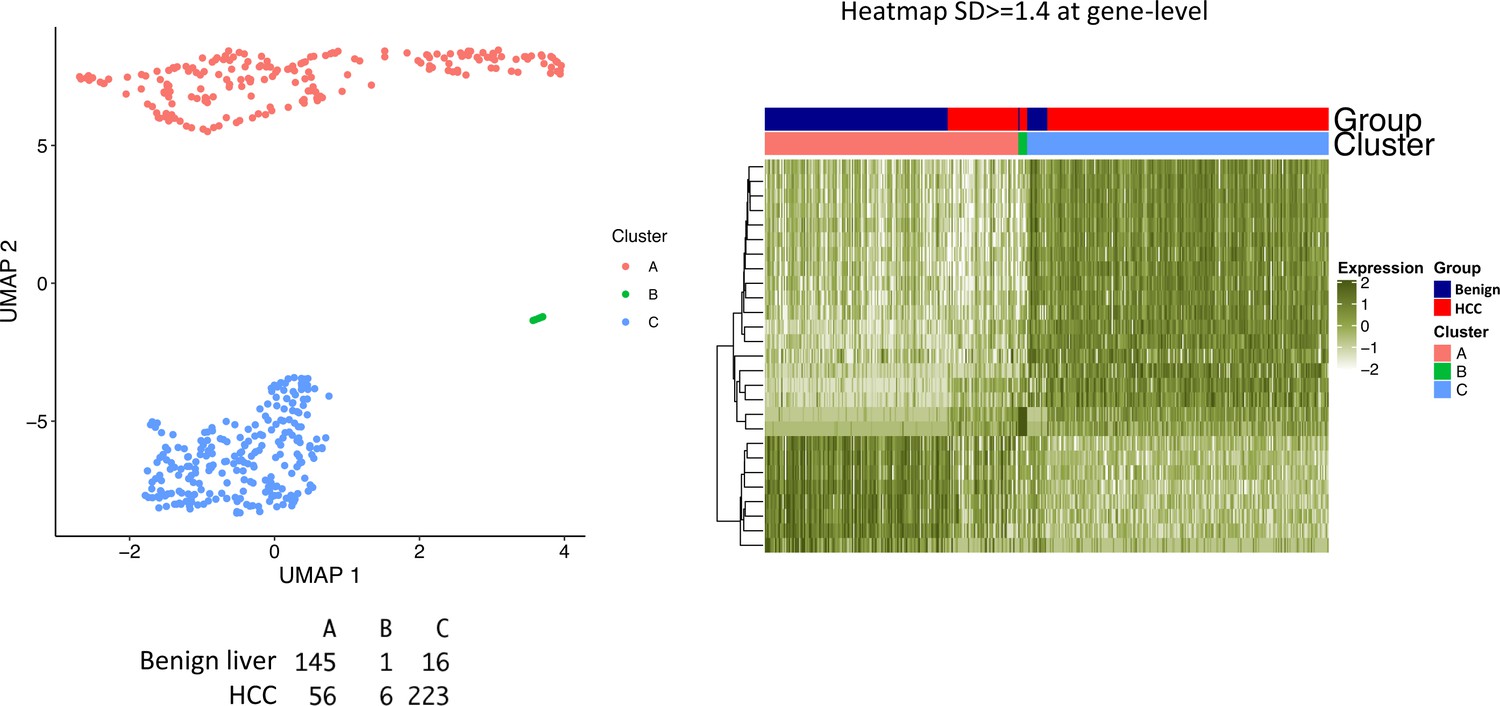
Segregation of cells between hepatocellular carcinoma (HCC) and benign liver samples.
Relabeling of clusters as ‘A’, ‘B’, and ‘C’ based on gene expressions with a standard deviation ≥ 1.4. Left panel: Uniform Manifold Approximation and Projection (UMAP) clustering. The numbers of cells from HCC and benign liver in each cluster are indicated. Right panel: heatmap of clusters A, B, and C. Cells from HCC and benign liver are indicated.
Figure 12—figure supplement 5
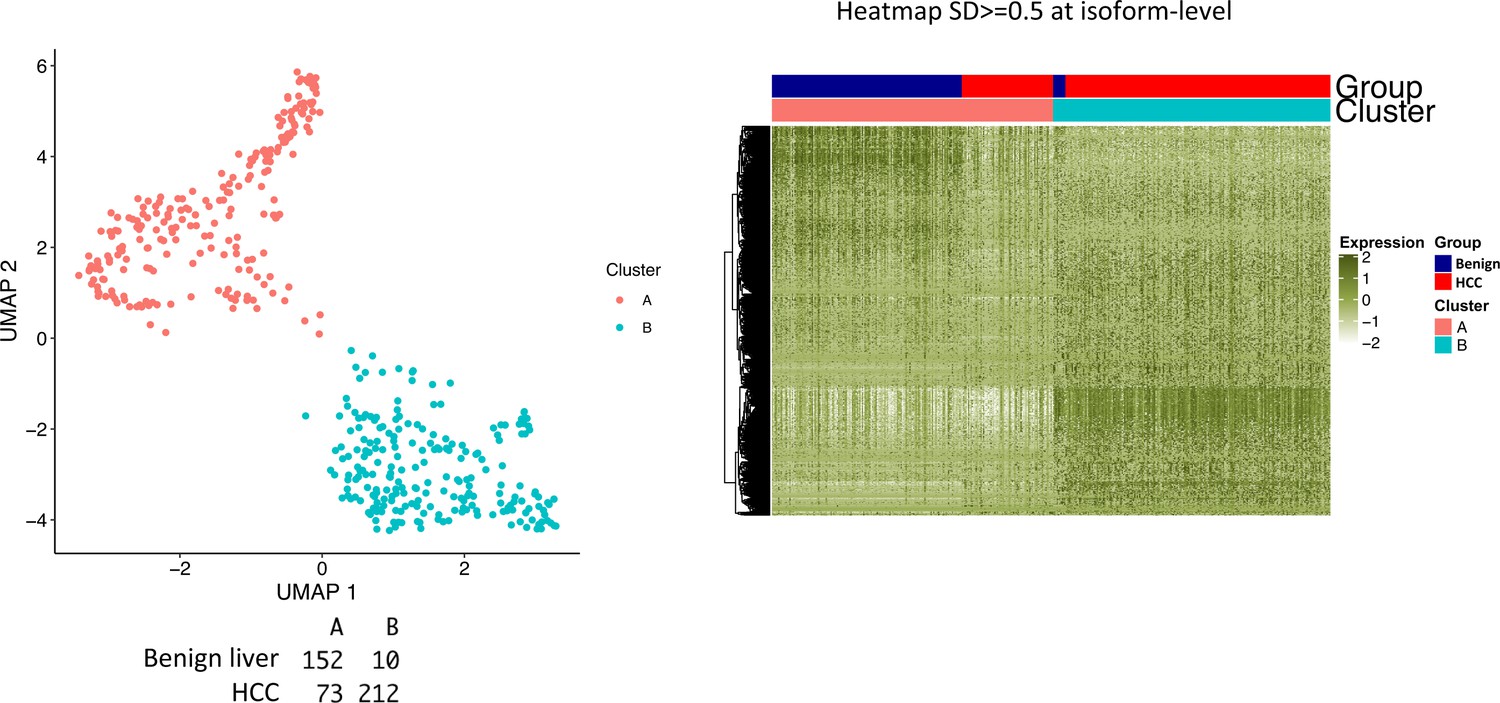
Segregation of cells between hepatocellular carcinoma (HCC) and benign liver samples.
Relabeling of clusters as ‘A’ and ‘B’ based on isoform expressions with a standard deviation ≥ 0.5. Left panel: Uniform Manifold Approximation and Projection (UMAP) clustering. The numbers of cells from HCC and benign liver in each cluster are indicated. Right panel: heatmap of clusters A and B. Cells from HCC and benign liver are indicated.
Figure 12—figure supplement 6
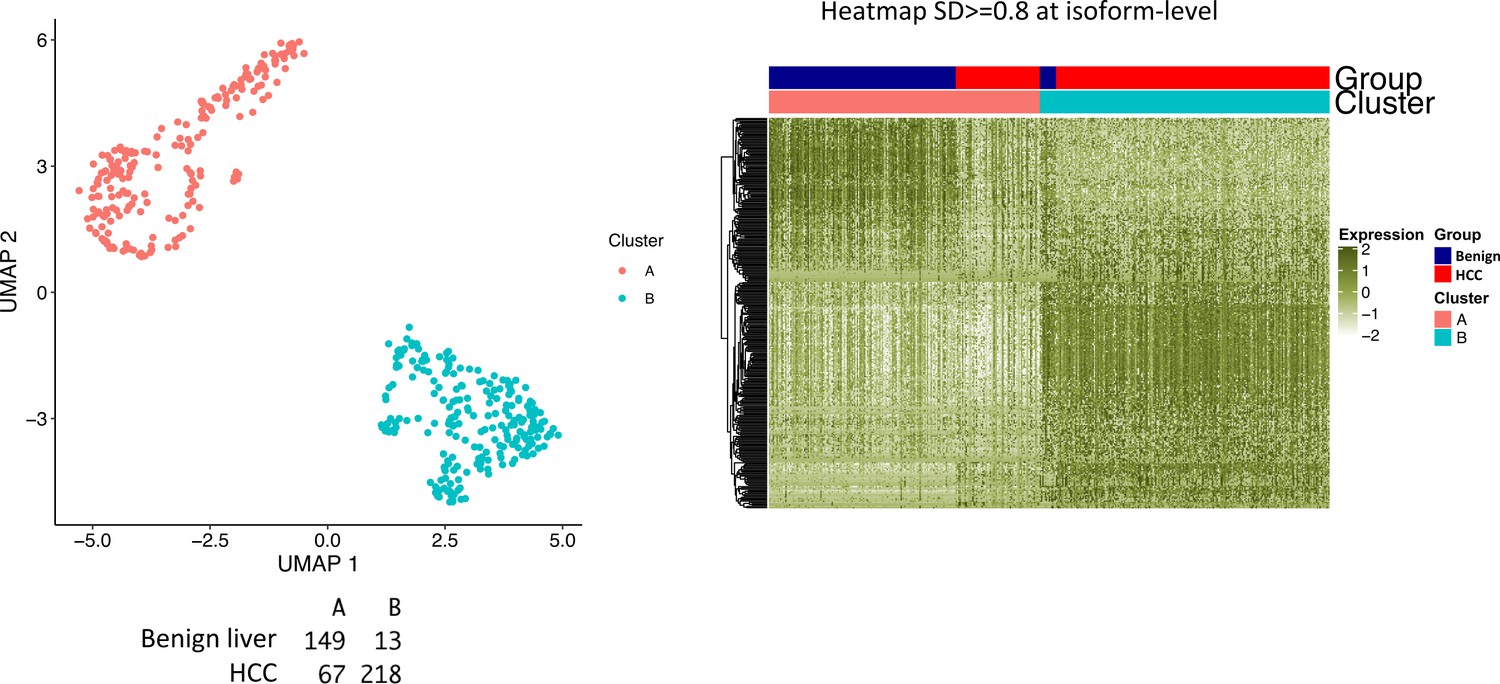
Segregation of cells between hepatocellular carcinoma (HCC) and benign liver samples.
Relabeling of clusters as ‘A’ and ‘B’ based on isoform expressions with a standard deviation ≥ 0.8. Left panel: Uniform Manifold Approximation and Projection (UMAP) clustering. The numbers of cells from HCC and benign liver in each cluster are indicated. Right panel: heatmap of clusters A and B. Cells from HCC and benign liver are indicated.
Figure 12—figure supplement 7
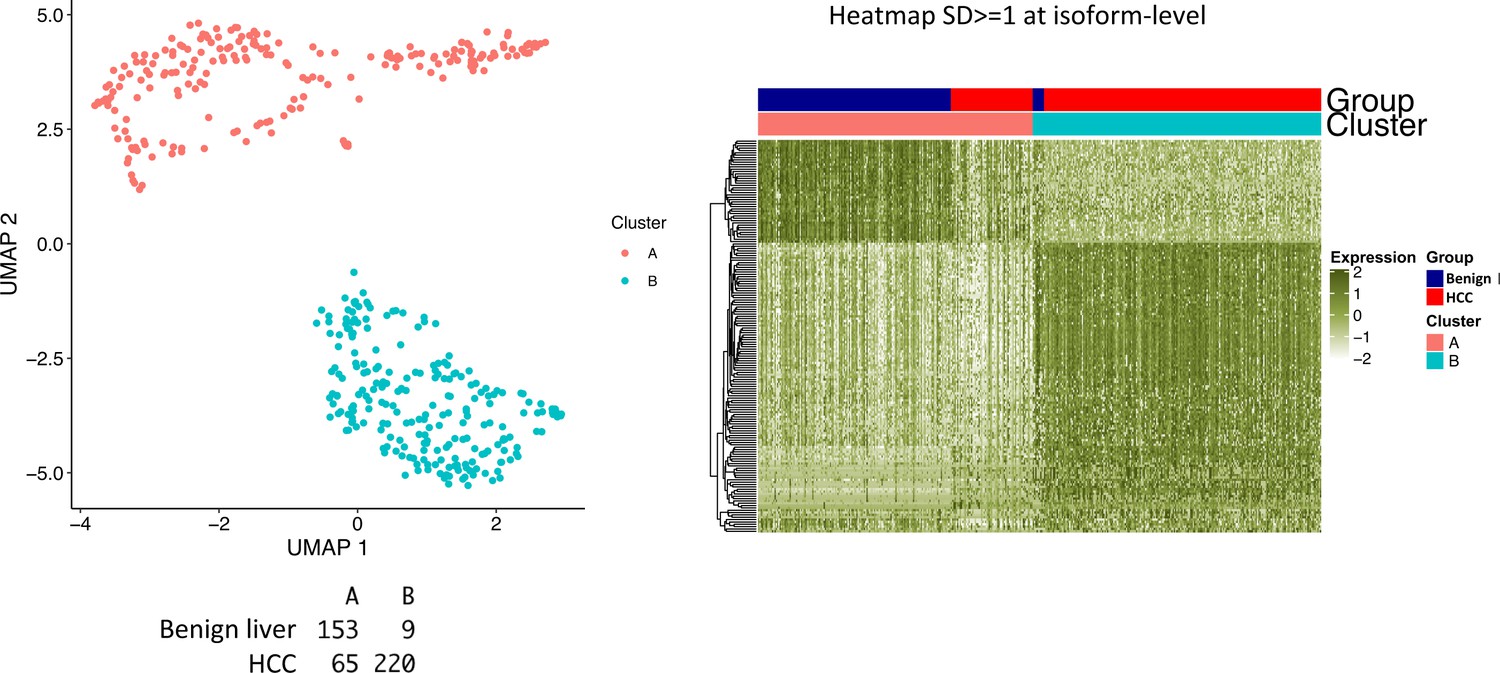
Segregation of cells between hepatocellular carcinoma (HCC) and benign liver samples.
Relabeling of clusters as ‘A’ and ‘B’ based on isoform expressions with a standard deviation ≥ 1.0. Left panel: Uniform Manifold Approximation and Projection (UMAP) clustering. The numbers of cells from HCC and benign liver in each cluster are indicated. Right panel: heatmap of clusters A and B. Cells from HCC and benign liver are indicated.
Figure 12—figure supplement 8
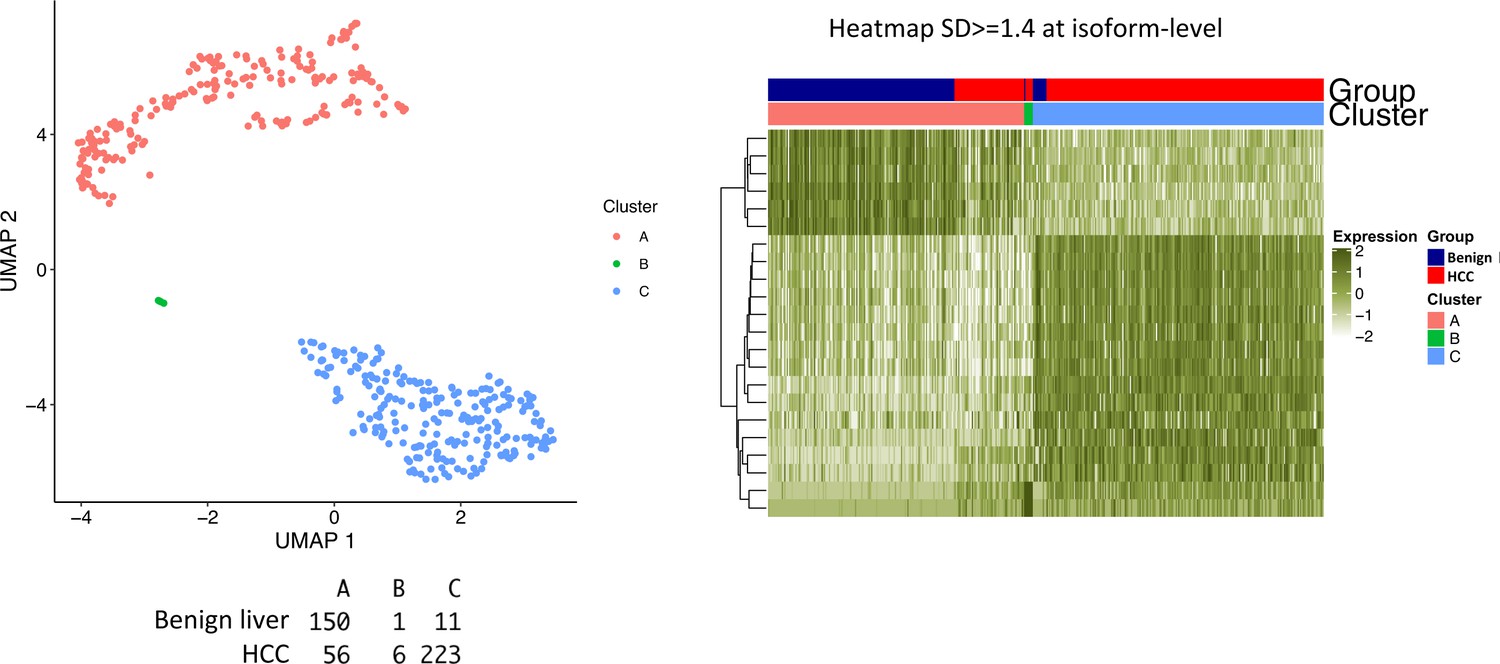
Segregation of cells between hepatocellular carcinoma (HCC) and benign liver samples.
Relabeling of clusters as ‘A’, ‘B’, and ‘C’ based on isoform expressions with a standard deviation ≥ 1.4. Left panel: Uniform Manifold Approximation and Projection (UMAP) clustering. The numbers of cells from HCC and benign liver in each cluster are indicated. Right panel: Heatmap of clusters A, B, and C. Cells from HCC and benign liver are indicated.
Figure 13
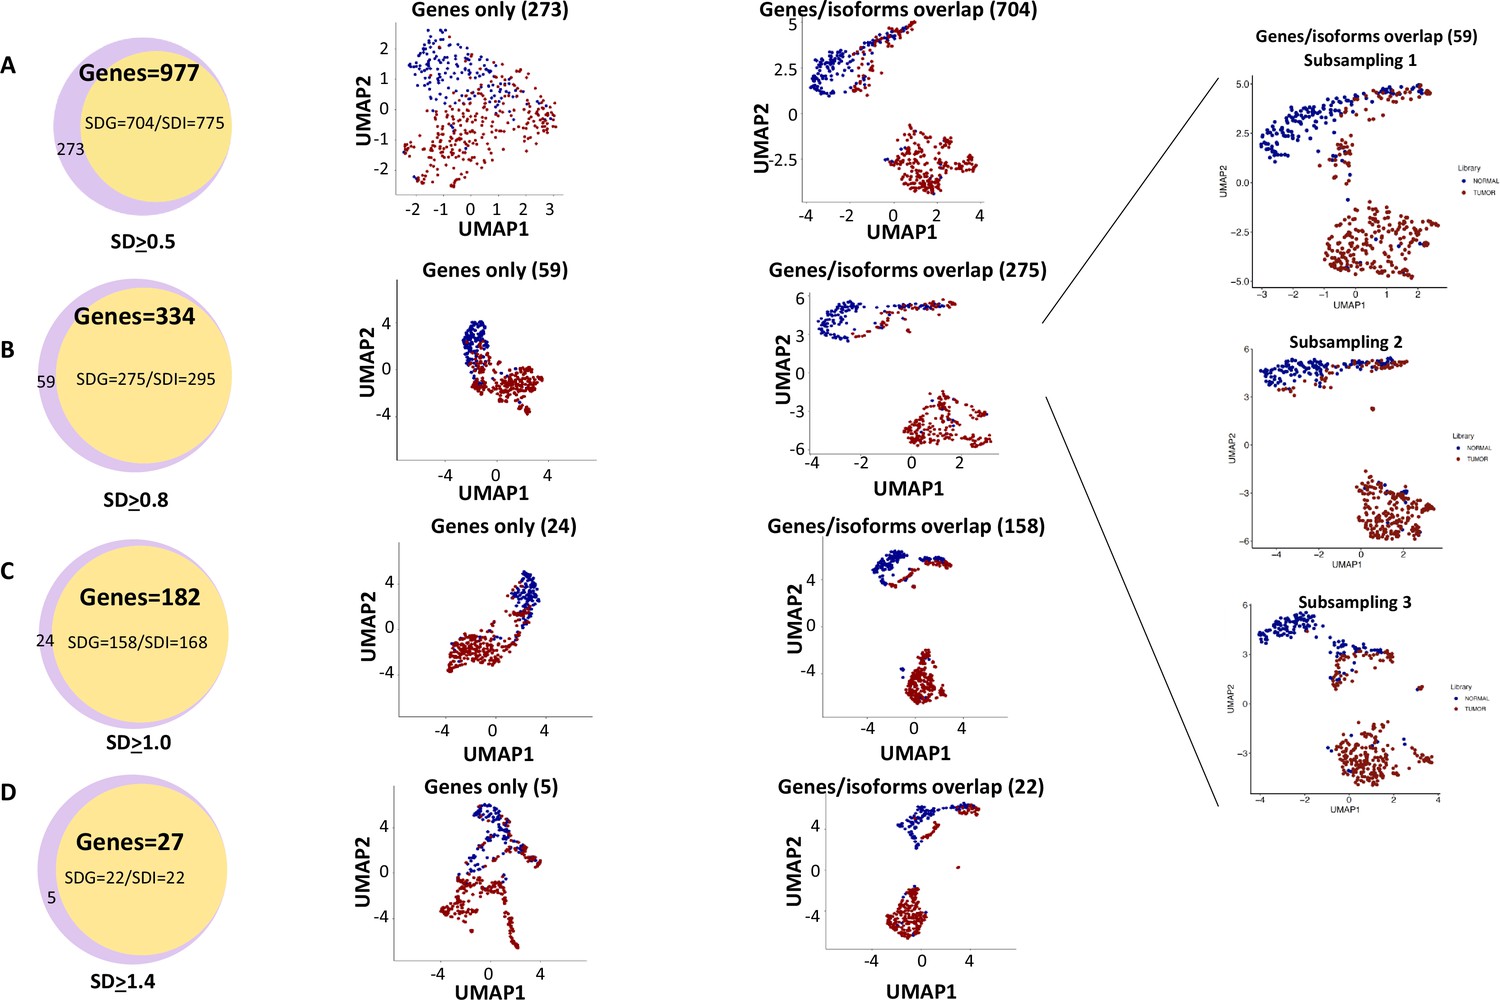
Genes with isoform expression alterations played key roles in segregating cells between the hepatocellular carcinoma (HCC) and benign liver samples.
(A) The role of isoform expressions in segregating cells between the HCC and benign liver when the standard deviation was ≥0.5. Left panel: Venn diagram between gene expressions and isoform expressions with standard deviations ≥ 0.5. Middle panel: Uniform Manifold Approximation and Projection (UMAP) clustering with genes not overlapping with isoforms. Right panel: UMAP clustering with genes overlapping with isoforms. (B) The role of isoform expressions in segregating cells between the HCC and benign liver when the standard deviation was ≥0.8. Left panel: Venn diagram between gene expressions and isoform expressions with standard deviations ≥ 0.8. Middle panel: UMAP clustering with genes not overlapping with isoforms. Right panel: UMAP clustering with genes overlapping with isoforms. Blowup panel: UMAP clustering with genes overlapping with isoforms in three subsampling trials. (C) The role of isoform expression in segregating cells between the HCC and benign liver when the standard deviation ≥ 1.0. Left panel: Venn diagram between gene expressions and isoform expressions with standard deviations ≥ 1.0. Middle panel: UMAP clustering with genes not overlapping with isoforms. Right panel: UMAP clustering with genes overlapping with isoforms. (D) The role of isoform expression in segregating cells between the HCC and benign liver when the standard deviation was ≥1.4. Left panel: Venn diagram between gene expressions and isoform expressions with a standard deviation ≥ 1.4. Middle panel: UMAP clustering with genes not overlapping with isoforms. Right panel: UMAP clustering with genes overlapping with isoforms.
Figure 14
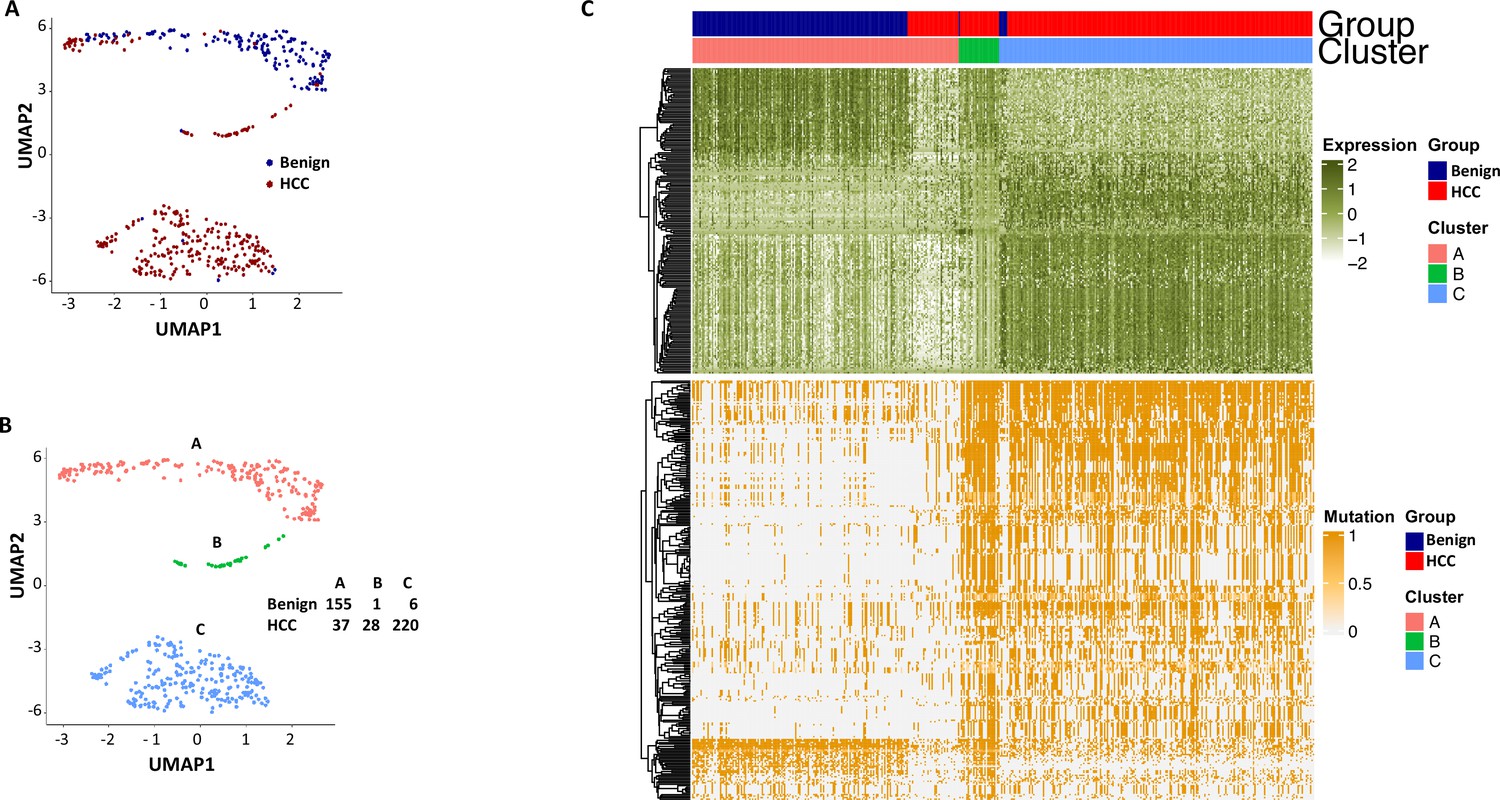
Uniform Manifold Approximation and Projection (UMAP) clustering of cells from hepatocellular carcinoma (HCC) and benign liver based on the combination of normal gene expressions and mutational gene expression shares.
(A) UMAP clustering of cells from the HCC and benign liver samples based on 182 gene expressions with standard deviations ≥ 1.0 and 282 mutational gene expression shares with standard deviations ≥ 0.4, (B) Relabeling of clusters from (A) as clusters A, B, and C. The numbers of cells from the HCC and benign liver in each cluster are indicated. (C) Heatmap of 182 gene expressions and 282 shares for cells from clusters A, B, and C. Cells from the HCC and benign liver mutational gene expressions are indicated.
Figure 15
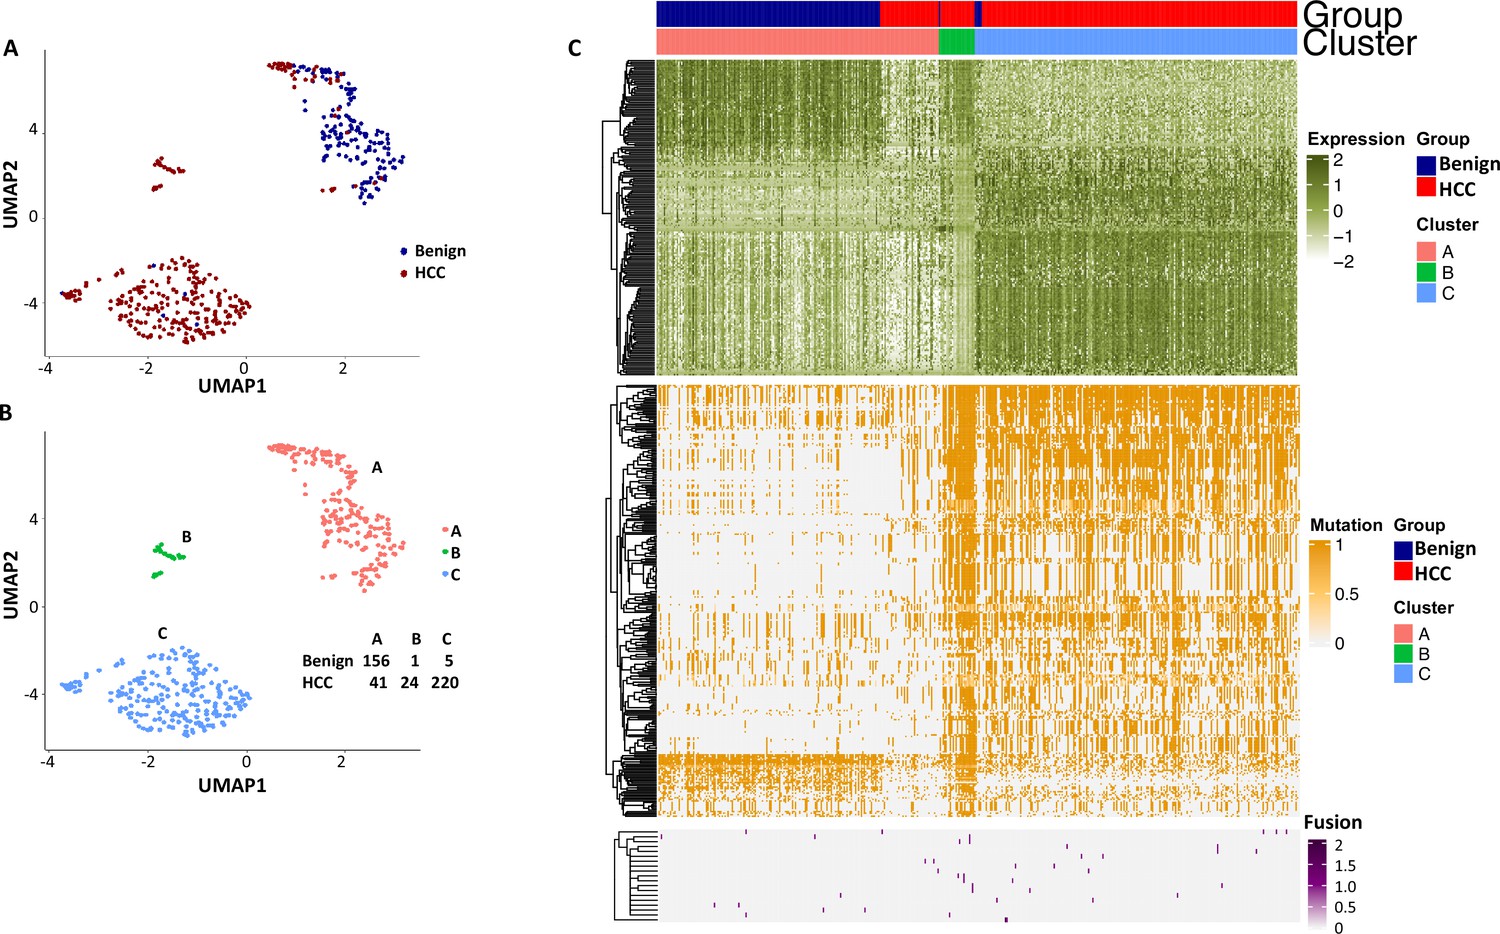
Uniform Manifold Approximation and Projection (UMAP) clustering of cells from the hepatocellular carcinoma (HCC) and benign liver based on the combination of normal gene expression, mutational gene expression share, and fusion gene expression share.
(A) UMAP clustering of cells from HCC and benign liver samples based on 182 gene expressions with a standard deviation ≥ 1, 282 mutational gene expression shares with standard deviations ≥ 0.4, and 20 fusion gene expression shares of any standard deviation. (B) Relabeling of clusters from (A) as clusters ‘A’, ‘B’, and ‘C’. The number of cells from HCC and benign liver in each cluster is indicated. (C) Heatmap of 182 gene expressions, 282 mutational gene expression shares, and 20 fusion genes expression shares for cells from clusters ‘A’, ‘B’, and ‘C’. Cells from the HCC and benign liver are indicated.
Figure 16
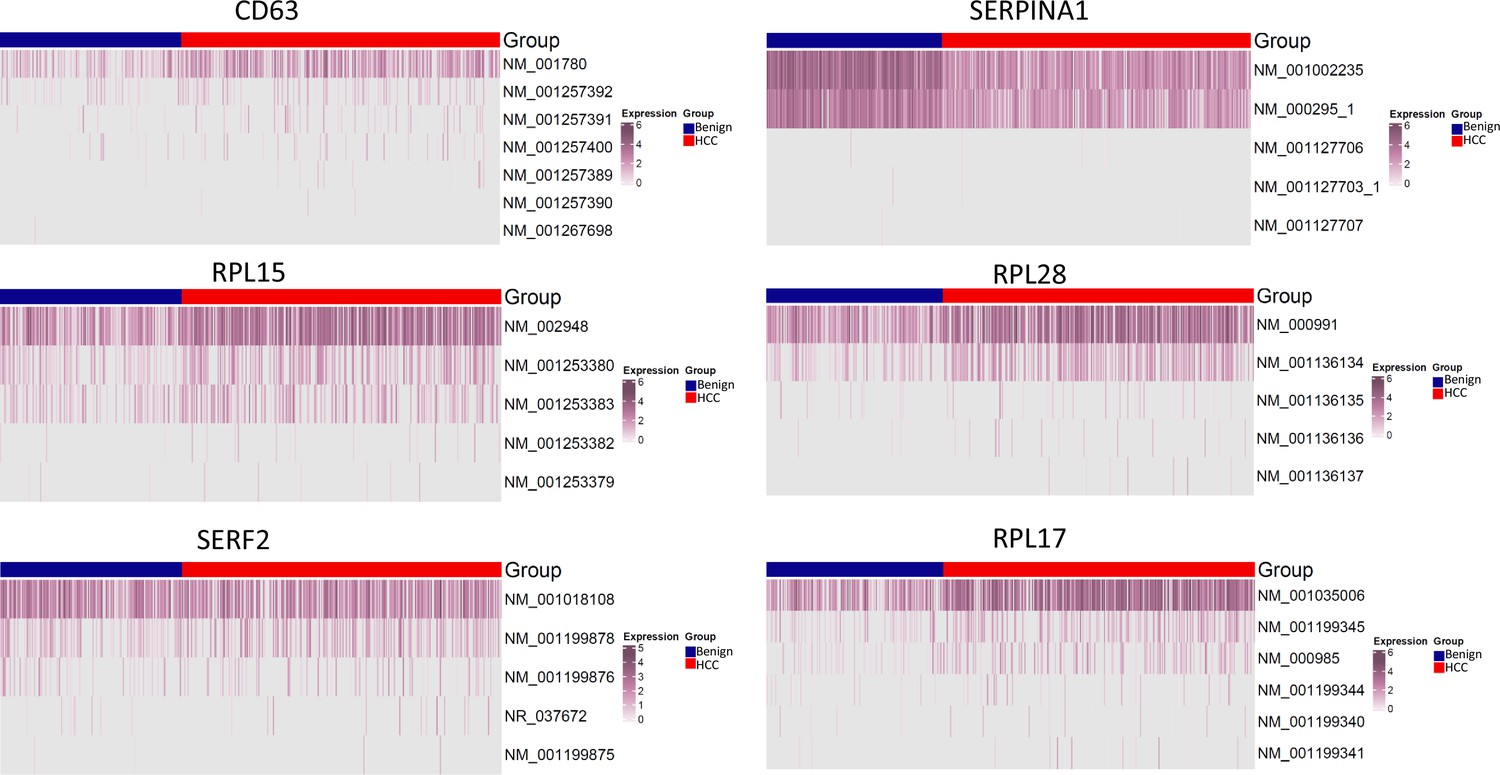
Isoform distribution of CD63, SERPINA1, RPL10, RPL28, SERF2, and RPL17.
The expression levels of known isoforms are shown.
Additional files
-
Supplementary file 1
Mutation gene expressions.
- https://cdn.elifesciences.org/articles/87607/elife-87607-supp1-v1.xlsx
-
Supplementary file 2
Mutation isoform expressions.
- https://cdn.elifesciences.org/articles/87607/elife-87607-supp2-v1.xlsx
-
Supplementary file 3
Mutation isoform expressions in ≥ 5 transcriptomes.
- https://cdn.elifesciences.org/articles/87607/elife-87607-supp3-v1.xlsx
-
Supplementary file 4
Genes with SD ≥ 0.5.
- https://cdn.elifesciences.org/articles/87607/elife-87607-supp4-v1.xlsx
-
Supplementary file 5
Genes with SD ≥ 0.8.
- https://cdn.elifesciences.org/articles/87607/elife-87607-supp5-v1.xlsx
-
Supplementary file 6
Genes with SD ≥ 1.0.
- https://cdn.elifesciences.org/articles/87607/elife-87607-supp6-v1.xlsx
-
Supplementary file 7
Genes with SD ≥ 1.4.
- https://cdn.elifesciences.org/articles/87607/elife-87607-supp7-v1.xlsx
-
Supplementary file 8
Isoforms with SD ≥ 0.5.
- https://cdn.elifesciences.org/articles/87607/elife-87607-supp8-v1.xlsx
-
Supplementary file 9
Isoforms with SD ≥ 0.8.
- https://cdn.elifesciences.org/articles/87607/elife-87607-supp9-v1.xlsx
-
Supplementary file 10
Isoforms with SD ≥ 1.0.
- https://cdn.elifesciences.org/articles/87607/elife-87607-supp10-v1.xlsx
-
Supplementary file 11
Isoforms with SD ≥ 1.4.
- https://cdn.elifesciences.org/articles/87607/elife-87607-supp11-v1.xlsx
-
Supplementary file 12
Gene expressions with SD ≥ 1.0, mutation gene expressions with SD ≥ 0.4 and 19 fusion genes.
- https://cdn.elifesciences.org/articles/87607/elife-87607-supp12-v1.xlsx
-
Supplementary file 13
Signaling pathways impacted by differential gene expressions.
- https://cdn.elifesciences.org/articles/87607/elife-87607-supp13-v1.xlsx
-
MDAR checklist
- https://cdn.elifesciences.org/articles/87607/elife-87607-mdarchecklist1-v1.pdf
Download links
A two-part list of links to download the article, or parts of the article, in various formats.
Downloads (link to download the article as PDF)
Open citations (links to open the citations from this article in various online reference manager services)
Cite this article (links to download the citations from this article in formats compatible with various reference manager tools)
Long-read single-cell sequencing reveals expressions of hypermutation clusters of isoforms in human liver cancer cells
eLife 12:RP87607.
https://doi.org/10.7554/eLife.87607.3


