Multiple dynamic interactions from basal ganglia direct and indirect pathways mediate action selection
- Molecular Neurobiology Laboratory, The Salk Institute for Biological Studies, United States
- Center for Motor Control and Disease, Key Laboratory of Brain Functional Genomics, East China Normal University, China
- NYU–ECNU Institute of Brain and Cognitive Science, New York University Shanghai, China
Figures
Figure 1 with 3 supplements
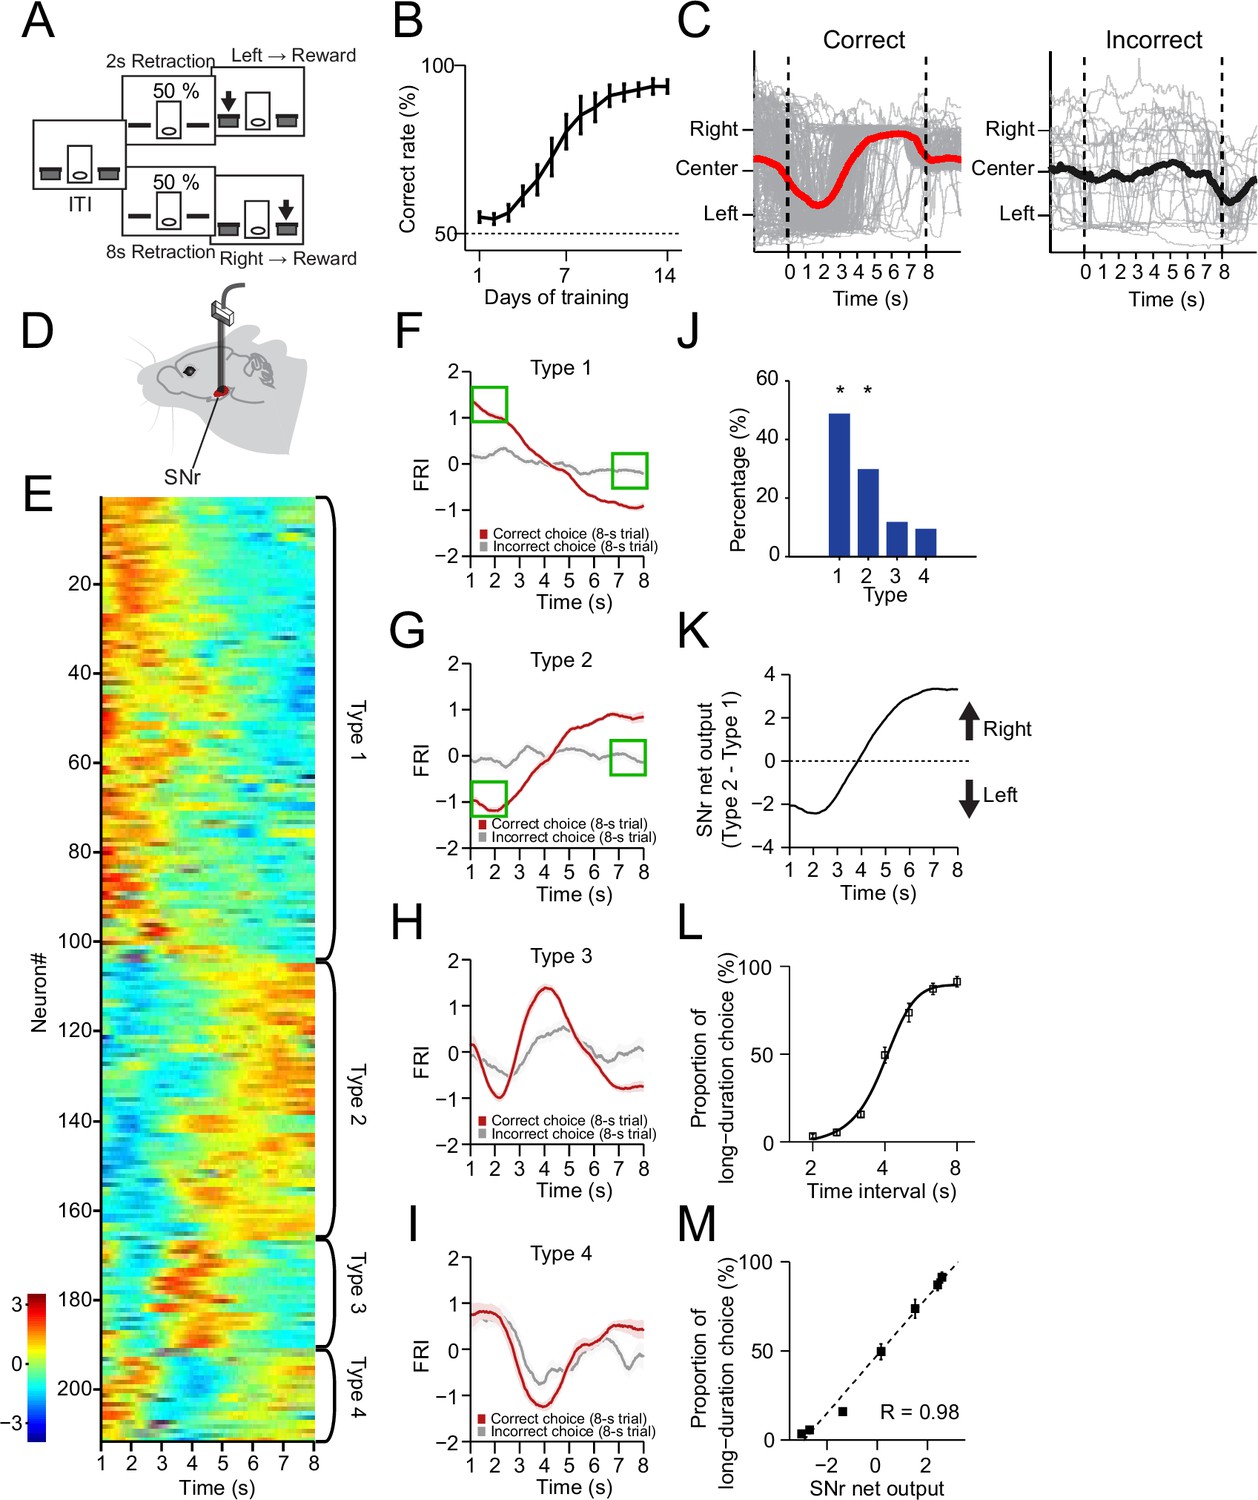
The neuronal dynamics in substantia nigra pars reticulata (SNr) during the 2–8 s action selection task.
(A) Schematic diagram for the design of 2–8 s task. (B) Correct rate for wild-type mice across 14 days’ training (n=10 mice, one-way repeated-measures ANOVA, significant effect of training days, F13,117 = 32.54, p<0.0001). (C) Movement trajectory of an example mouse in correct (left panel) and incorrect (right panel) 8 s trials (gray line: trajectory of each trials; red/black line: the average trajectory). (D) Diagram of electrode array implanted into SNr. (E) Firing rate index (FRI) of neuronal activity for all task-related SNr neurons in correct 8 s trials. The magnitude of FRI is color coded and the SNr neurons are classified as four different types based on the activity dynamics. (F–I) Averaged FRI for Type 1 (F, green squares indicating activities related to left choice), Type 2 (G, green squares indicating activities related to left choice), Type 3 (H), Type 4 (I) of SNr neurons in correct (red) and incorrect 8 s trials (gray). (J) The proportion of four types of SNr neurons. Type 1 and Type 2 are major types and significantly more than Type 3 and Type 4 (Z-test, p<0.05). (K) SNr net output defined as the subtraction of averaged FRI between Type 1 and Type 2 SNr neurons. (L) Averaged psychometric curve (n=10 mice) of choice behavior. (M) The correlation between the Type 1 and Type 2 FRI subtraction and the behavioral choice (R=0.98, p<0.0005). Error bars denote s.e.m., same for below unless stated otherwise.
Figure 1—figure supplement 1
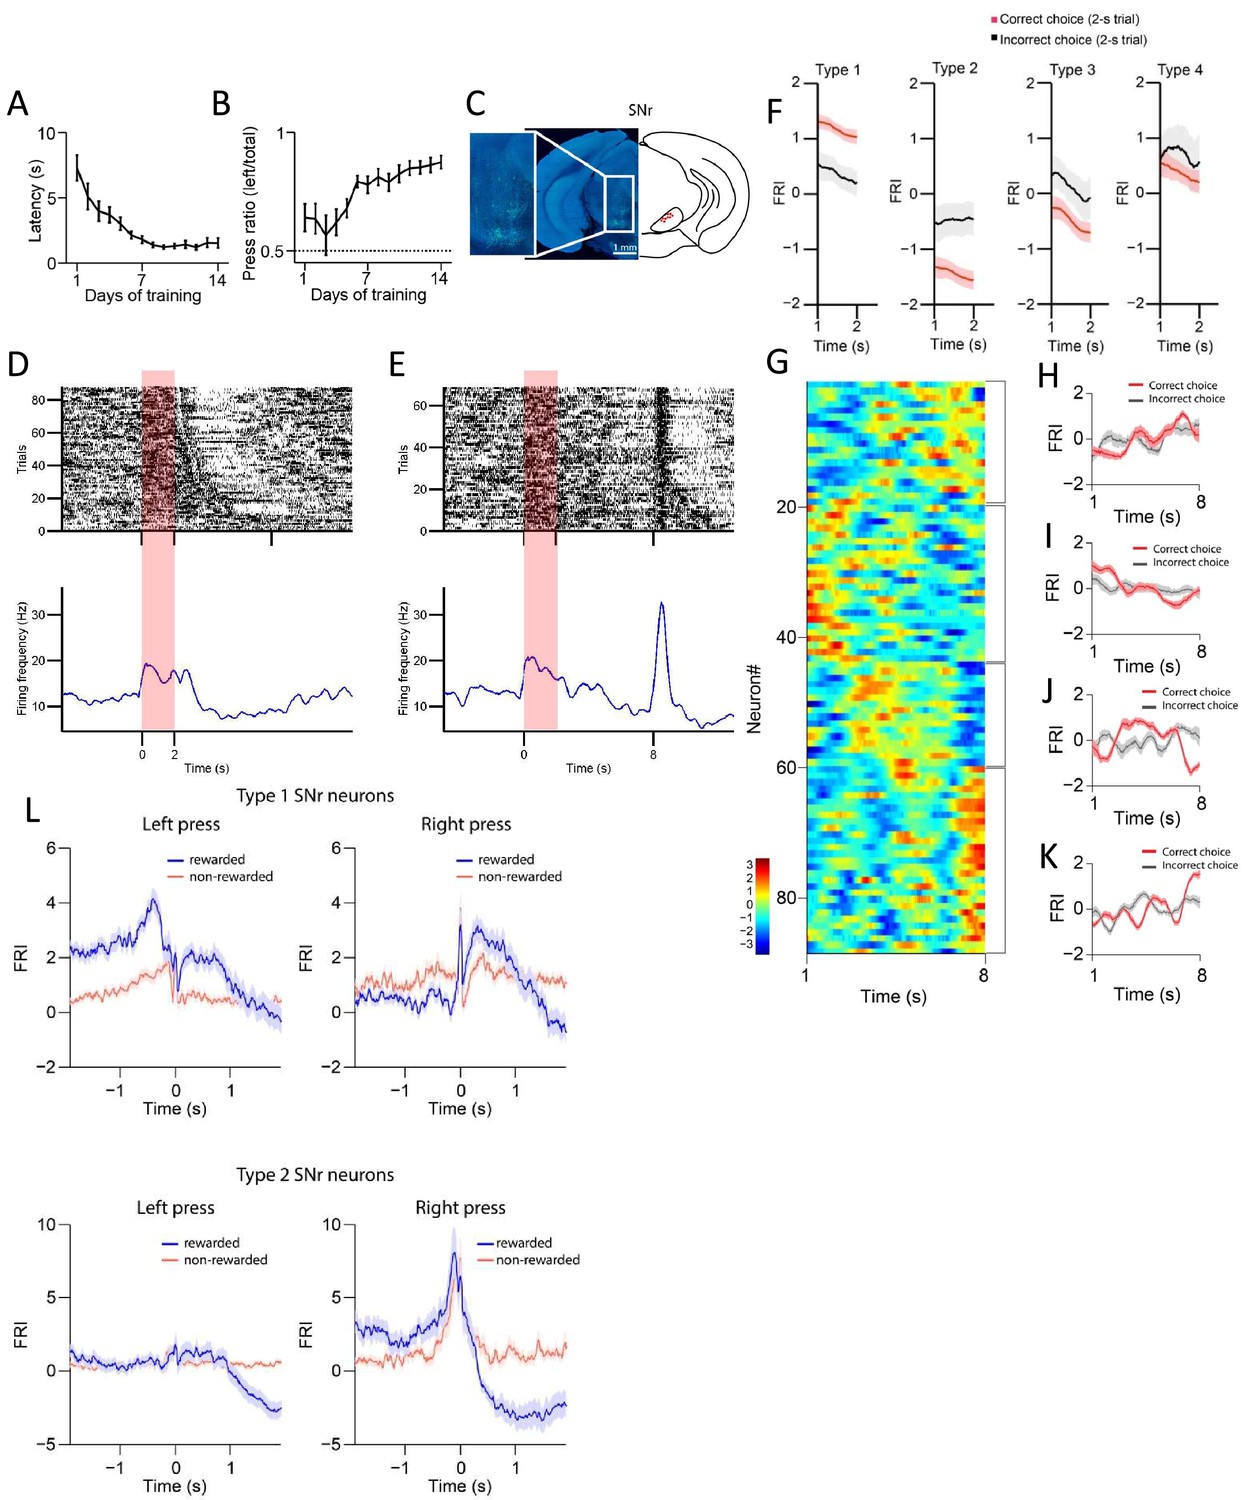
Behavioral performance across 14 days of training and the substantia nigra pars reticulata (SNr) neuronal recording on day 1.
(A) Lever press latency after lever extension for wild-type mice across 14 days’ training (n=10 mice, one-way repeated-measures ANOVA, effect of training days, F13,117=21.32, p<0.0001). (B) Lever press ratio for wild-type mice across 14 days training (n=10 mice, one-way repeated-measures ANOVA, effect of training days, F13,117=6.472, p<0.0001). (C) Example of recording array placement in SNr (left) and validation of array placement in a cohort of wild-type mice (right). Inset better demonstrates small tracts formed by the array implant. (D, E) Firing activities of an example SNr neuron in correct 2 s (D) and 8 s trials (E) after 14 days’ training. Top panels: Raster plot of spikes across trials aligned to lever retraction at time 0. Bottom panel: Peristimulus time histogram (PETH) plot. Red shaded areas highlight the initial 2 s period after the lever retraction in 2 s (D) and 8 s trials (E). (F) Averaged FRI for Type 1, Type 2, Type 3, and Type 4 of SNr neurons in correct (red) and incorrect 2 s trials (gray). (G) Firing rate index (FRI) of neuronal activity for all task-related SNr neurons in correct 8 s trials on day 1 of training. The magnitude of FRI is color coded and the SNr neurons are categorized as four subgroups based on the activity dynamics. (H–K) Averaged FRI of SNr neurons in correct (red) and incorrect 8 s trials (gray) on day 1 of training. (L) Averaged FRI for Type 1 and Type 2 of SNr neurons responding to rewarded and non-rewarded left/right lever presses.
Figure 1—figure supplement 2
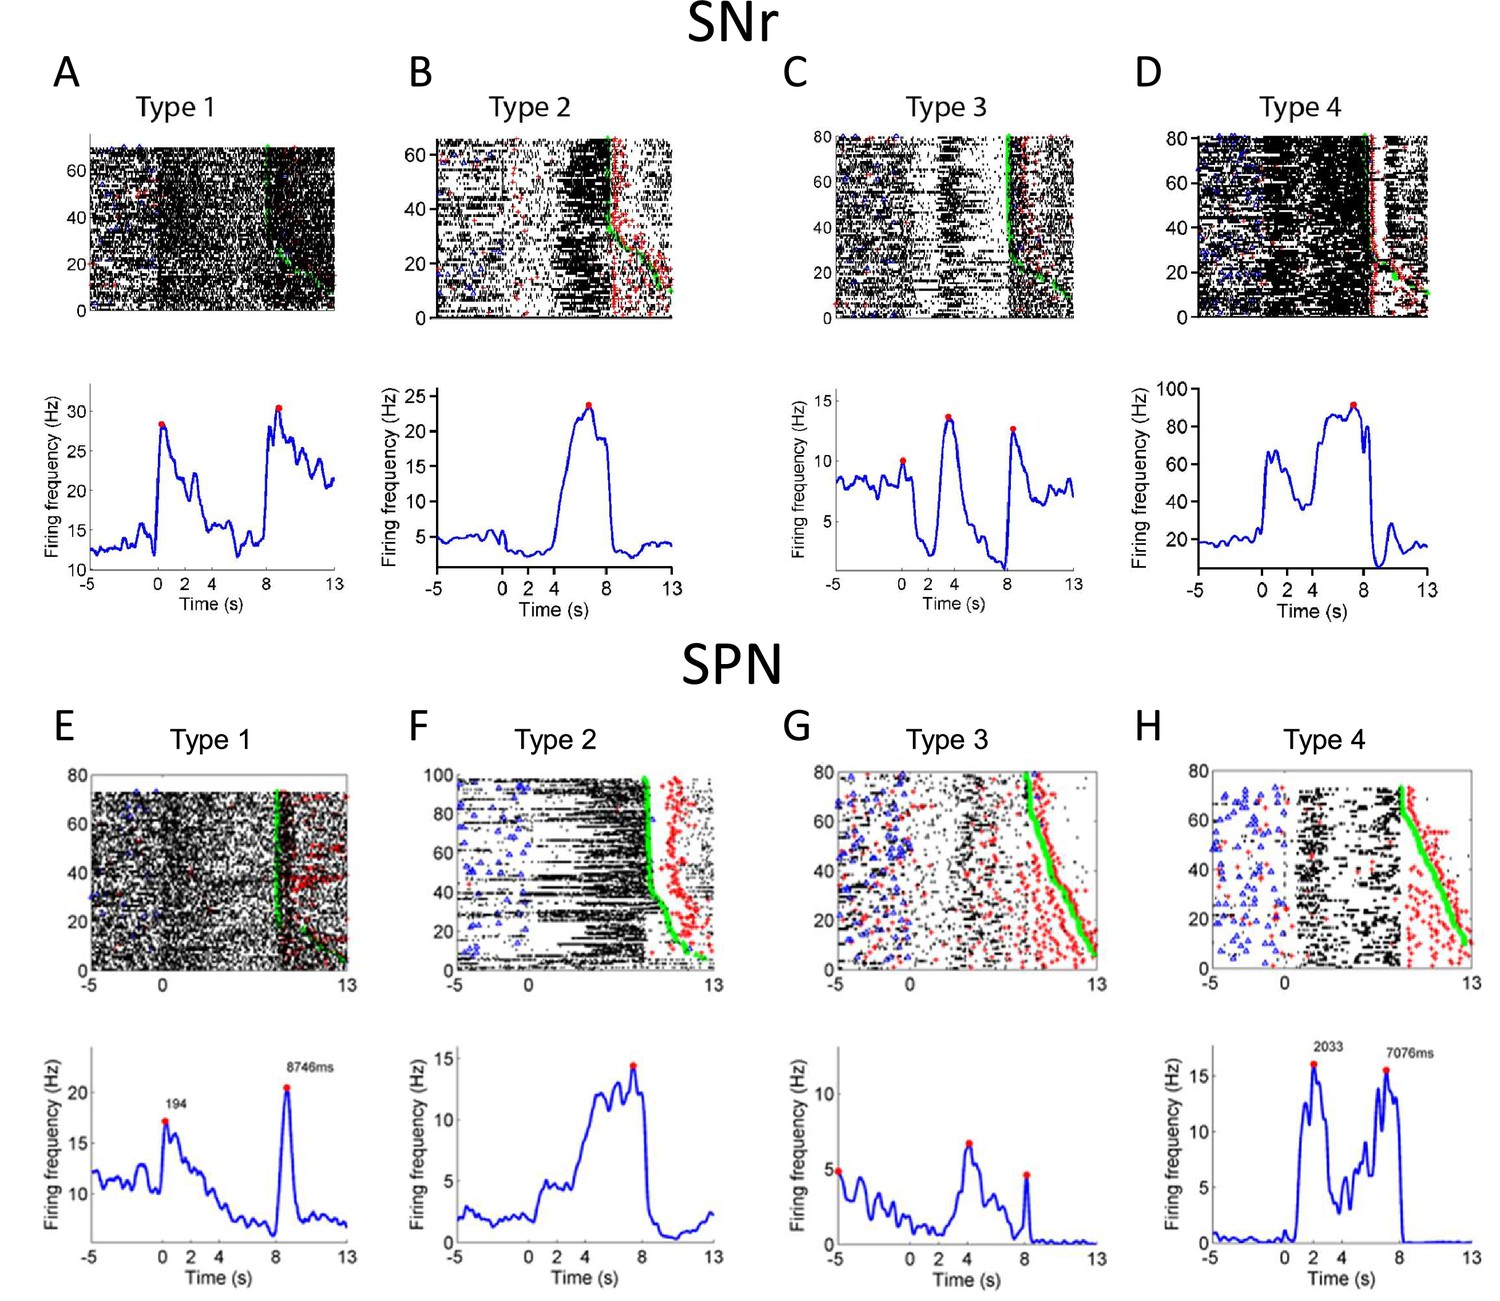
Examples of substantia nigra pars reticulata (SNr) neuron and spiny projection neuron (SPN) subtypes.
(A–D) Firing activities of example SNr neurons of Type 1 (A), Type 2 (B), Type 3 (C), and Type 4 (D) in correct 8 s trials after 14 days training. Top panels: Raster plot of spikes across trials aligned to lever retraction at time 0 (blue triangle: lever press; green triangle: reward; red cross: head entry). Bottom panel: Peristimulus time histogram (PETH) plot. (E–H) Firing activities of example striatal projection neurons of Type 1 (E), Type 2 (F), Type 3 (G), and Type 4 (H) in correct 8 s trials after 14 days’ training. Top panels: Raster plot of spikes across trials aligned to lever retraction at time 0 (blue triangle: lever press; green triangle: reward; red cross: head entry). Bottom panel: PETH plot.
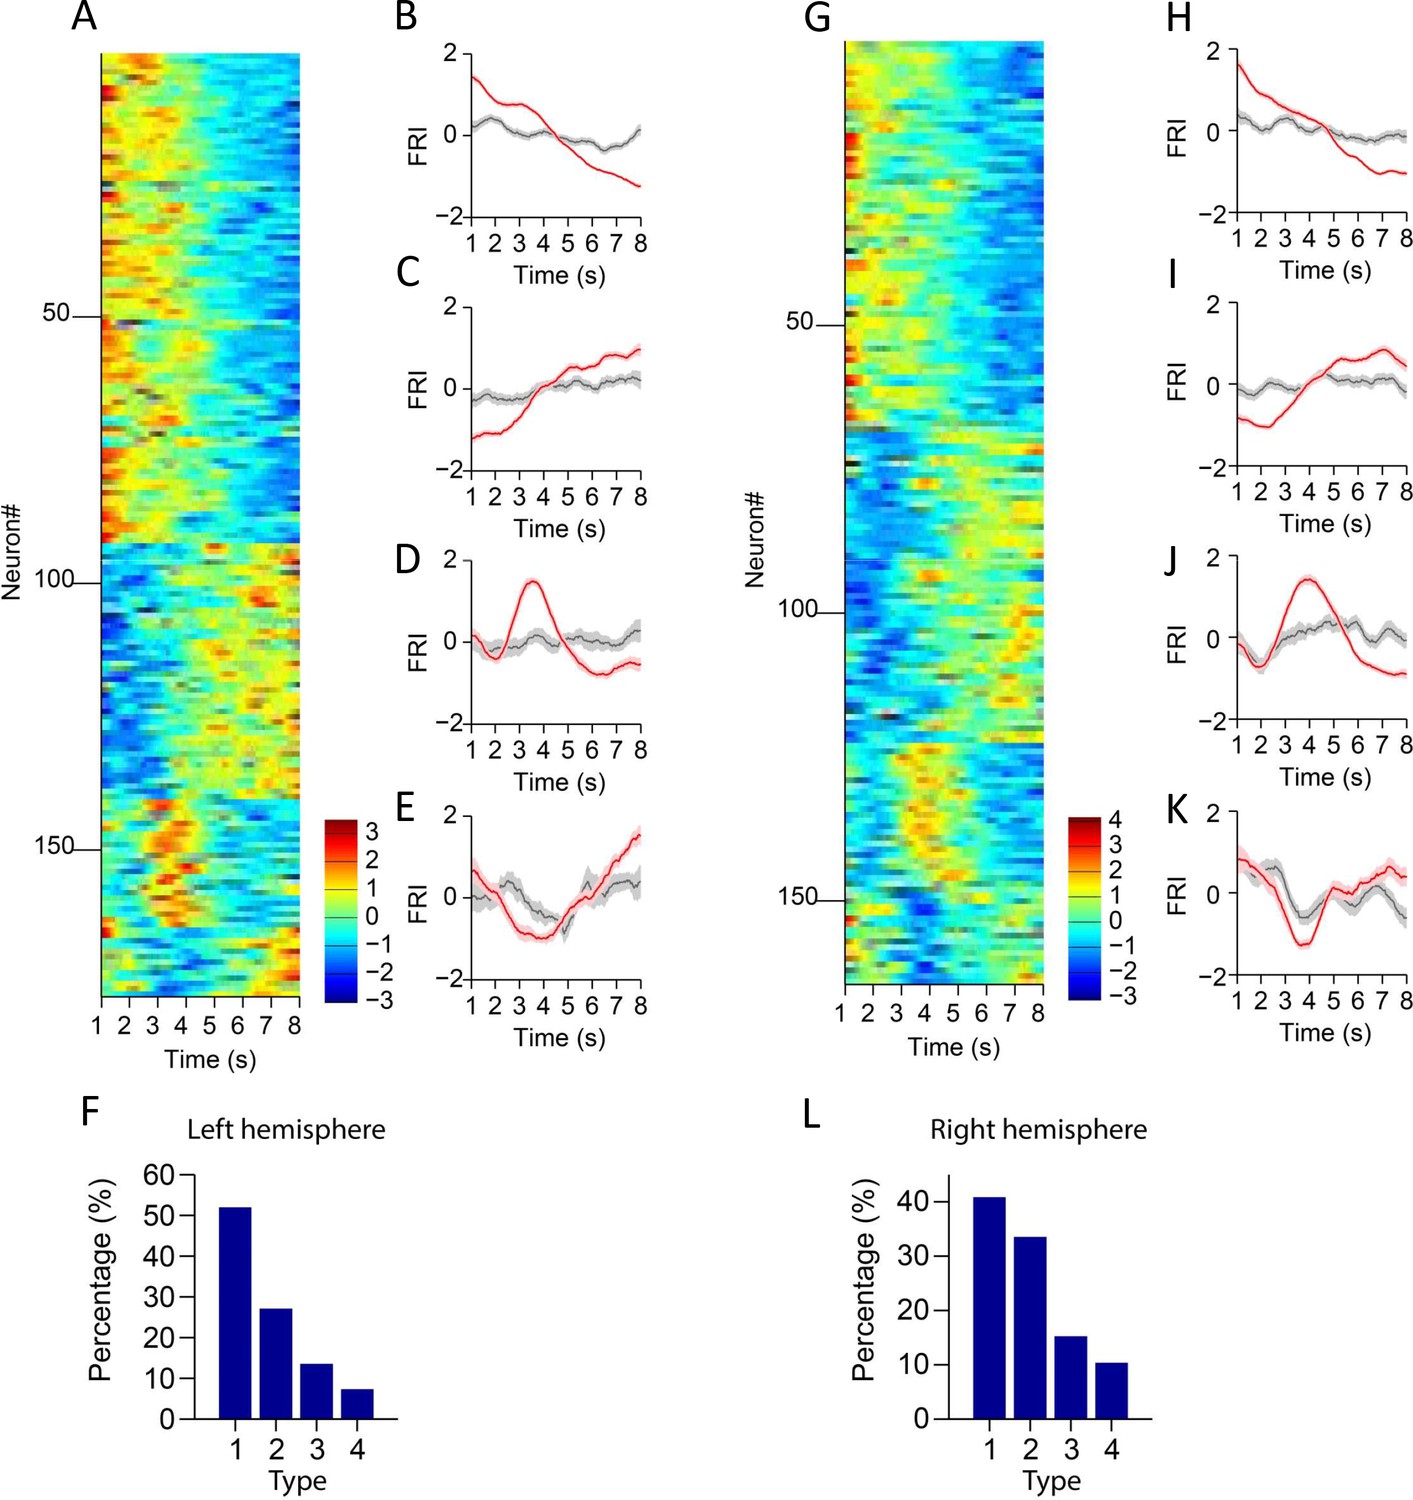
Figure 1—figure supplement 3

Substantia nigra pars reticulata (SNr) neuron activities in left and right hemisphere.
(A) Firing rate index (FRI) of neuronal activity for all task-related SNr neurons in correct 8 s trials recorded in the left hemisphere. The magnitude of FRI is color coded and the SNr neurons are classified as four different types based on the activity dynamics. (B–E) Averaged FRI for Type 1 (B), Type 2 (C), Type 3 (D), Type 4 (E) of SNr neurons in correct (red) and incorrect 8 s trials (gray). (F) The proportion of four types of SNr neurons. Type 1 (57/108, 52.8%), Type 2 (36/108, 33.3%), Type 3 (9/108, 8.3%), Type 4 (6/108, 5.6%). (G) FRI of neuronal activity for all task-related SNr neurons in correct 8 s trials recorded in the right hemisphere. The magnitude of FRI is color coded and the SNr neurons are classified as four different types based on the activity dynamics. (H–K) Averaged FRI for Type 1 (H), Type 2 (I), Type 3 (J), Type 4 (K) of SNr neurons in correct (red) and incorrect 8 s trials (gray). (L) The proportion of four types of SNr neurons. Type 1 (46/103, 44.7%), Type 2 (27/103, 26.2%), Type 3 (16/103, 15.5%), Type 4 (14/103, 13.6%).
Figure 2 with 1 supplement
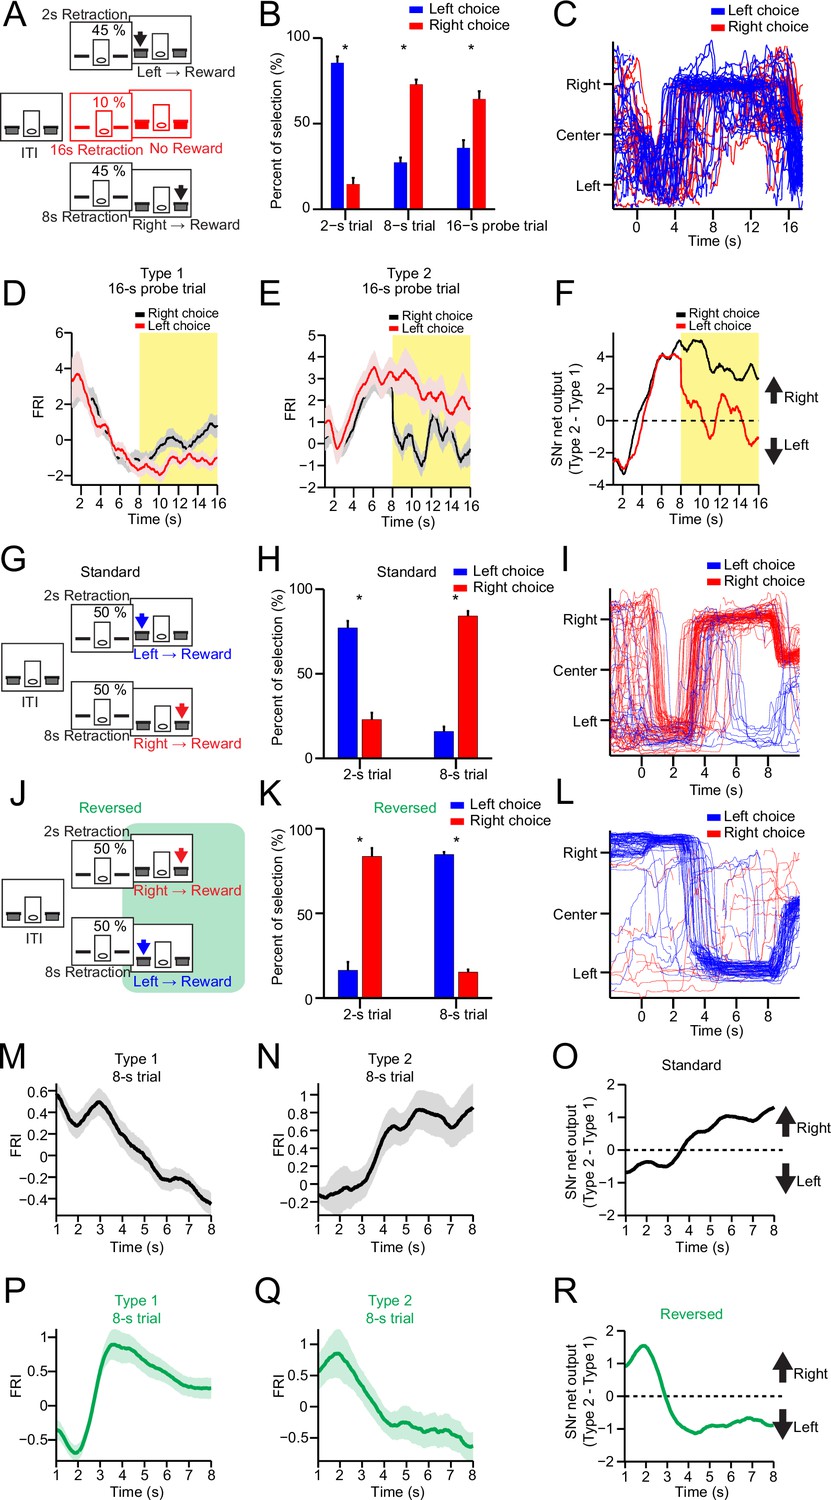
Substantia nigra pars reticulata (SNr) neuronal dynamics reflect action selection but not interval time or reward value.
(A) Task diagram of 2–8 s control task with 10% 16 s probe trials. (B) Percentage of behavioral choice in 2 s, 8 s, and 16 s trials (blue: left choice; red: right choice) (n=9 mice, paired t-test, p<0.05). (C) Movement trajectory of an example mouse in 16 s trials (blue: left choice; red: right choice). (D) Averaged SNr Type 1 firing rate index (FRI) in 16 s trials (red: left choice; black: right choice). Firing rates from 8 s to 16 s (highlighted area) are compared between left and right choice (n=26 neurons, two-way repeated-measures ANOVA, significant difference between left and right choices, F1,25=6.646, p=0.016). (E) Averaged SNr Type 2 FRI in 16 s trials (red: left choice; black: right choice). Firing rates from 8 s to 16 s are compared between left and right choice (n=16 neurons, two-way repeated-measures ANOVA, significant difference between left and right choices, F1,15=5.785, p=0.029). (F) Subtraction of FRI for SNr Type 1 and Type 2 neurons in 16 s probe trials (red: left choice; black: right choice). (G) Task design of 2–8 s standard task. (H) Percentage of behavioral choice in 2 s and 8 s trials (blue: left choice; red: right choice) (n=6 mice, paired t-test, p<0.05). (I) Movement trajectory of an example mouse in 8 s trials (blue: left choice; red: right choice). (J) Task design of reversed 2–8 s task. (K) Percentage of behavioral choice in 2 s and 8 s trials in the reversed 2–8 s task (blue: left choice; red: right choice) (n=6 mice, paired t-test, p<0.05). (L) Movement trajectory of the same mouse as (I) in 8 s trials in the reversed 2–8 s task (blue: left choice; red: right choice). (M) Averaged FRI of the SNr Type 1 neurons in correct 8 s trials (n=14 neurons). (N) Averaged FRI of the SNr Type 2 neurons in correct 8 s trials (n=11 neurons). (O) SNr net output as the subtraction of FRI for SNr Type 1 (M) and Type 2 neurons (N) in the standard 2–8 s task. (P) Averaged FRI of the same neurons as (M) in correct 8 s trials of the reversed 2–8 s task. (Q) Averaged FRI of the same neurons as (N) in correct 8 s trials of the reversed 2–8 s task. (R) SNr net output as the subtraction of FRI for SNr Type 1 (P) and Type 2 neurons (Q) in the reversed 2–8 s task.
Figure 2—figure supplement 1

Behavioral statistics and neuronal dynamics of substantia nigra pars reticulata (SNr) neurons in the standard and reversed 2–8 s tasks.
(A) Correct rates of the same group of mice both in the standard and reversed 2–8 s tasks (n=6 mice, paired t-test, p=0.33). (B) Lever press ratios of the same group of mice both in the standard and reversed 2–8 s tasks (n=6 mice, paired t-test, p<0.05). (C) Averaged firing rate index (FRI) of the SNr Type 3 neurons in correct 8 s trials of the standard 2–8 s task. (D) Averaged FRI of the SNr Type 3 neurons in correct 8 s trials of the reversed 2–8 s task. (E) Averaged FRI of the SNr Type 4 neurons in correct 8 s trials of the standard 2–8 s task. (F) Averaged FRI of the SNr Type 4 neurons in correct 8 s trials of the reversed 2–8 s task.
Figure 3 with 2 supplements

Neuronal activity of striatal D1- and D2-expressing spiny projection neurons (D1- and D2-SPNs) during action selection.
(A) Firing rate index (FRI) of neuronal activity for all task-related SPNs in correct 8 s trials. SPNs were classified as Types 1–4. (B–E) Averaged FRI for Type 1 (B), Type 2 (C), Type 3 (D), Type 4 (E) of SPNs in correct (red) and incorrect 8 s trials (gray). (F) Diagram of simultaneous neuronal recording and optogenetic identification of D1- vs. D2-SPNs in dorsal striatum. (G) Top panel: Raster plot for a representative D1-SPN response to 100 ms optogenetic stimulation. Each row represents one trial and each black dot represents a spike. Bottom panel: Peristimulus time histogram (PETH) aligned to light onset at time zero. (H) PETH for the same neuron as shown in (G) with a finer time scale. (I) Distribution of light response latencies for D1- and D2-SPNs. (J) Action potential waveforms of the same neuron in (G) for spontaneous (black) and light-evoked (orange) spikes (R=0.998, p<0.0001, Pearson’s correlation). (K) Principal component analysis (PCA) of action potential waveforms showing the overlapped clusters of spontaneous (black) and light-evoked (orange) spikes. (L) Proportion of D1-SPN subtypes. Type 1 neurons are significantly more than other three types of neurons in D1-SPNs (Z-test, p<0.05). (M) Averaged FRI for Type 1 (blue) and Type 2 (red) D1-SPNs in correct 8 s trials. (N) Proportion of D2-SPN subtypes. (O) Averaged FRI for Type 1 (blue) and Type 2 (red) D2-SPNs in correct 8 s trials.
Figure 3—figure supplement 1

Striatum neuronal recording on day 1 of training, recording array, and optic fiber placement validation.
(A) Averaged FRI for Type 1, Type 2, Type 3, and Type 4 of spiny projection neurons (SPNs) in correct (red) and incorrect 2 s trials (gray). (B) Firing rate index (FRI) of neuronal activity for all task-related SPNs in correct 8 s trials on day 1 of training. The magnitude of FRI is color coded and the SPNs are categorized as four subgroups based on the activity dynamics. (C–F) Averaged FRI of SPNs in correct (red) and incorrect 8 s trials (gray). (G) Recording array affixed with a cannula implanted in D1-Ai32 or A2a-Ai32 mice. Light emitted by optic fiber placed through the attached cannula is in close proximity to the tips of the recording array. (H) Top-down view of the array implantation. (I) Example of array placement in dorsal striatum of a D1-Ai32 mouse (left) and validation of fiber placement in a cohort of D1-Ai32 mice (right). Inset better demonstrates the tract formed by the array implant. (J) Example of array placement in dorsal striatum of an A2a-Ai32 mouse (left) and validation of fiber placement in a cohort of A2a-Ai32 mice (right). Inset better demonstrates the tract formed by the array implant. (K) Example of fiber placement in dorsal striatum of a D1-cre mouse with AAV5-DIO-ChR2-mcherry injected (left) and validation of fiber placement in a cohort of D1-cre mice (right). Inset better demonstrates the tract formed by the fiber implant. (L) Example of fiber placement in dorsal striatum of a A2a-cre mouse with AAV5-DIO-ChR2-mcherry injected (left) and validation of fiber placement in a cohort of A2a-cre mice (right). Inset better demonstrates the tract formed by the fiber implant.
Figure 3—figure supplement 2
Striatal projection neuron activities in left and right hemisphere.
(A) Firing rate index (FRI) of neuronal activity for all task-related spiny projection neurons (SPNs) in correct 8 s trials recorded in the left hemisphere. The magnitude of FRI is color coded and the SPNs are classified as four different types based on the activity dynamics. (B–E) Averaged FRI for Type 1 (B), Type 2 (C), Type 3 (D), Type 4 (E) of SPNs in correct (red) and incorrect 8 s trials (gray). (F) The proportion of four types of SPNs. Type 1 (92/177, 52.0%), Type 2 (48/177, 27.1%), Type 3 (24/177, 13.6%), Type 4 (13/177, 7.3%). (G) FRI of neuronal activity for all task-related SPNs in correct 8 s trials recorded in the right hemisphere. The magnitude of FRI is color coded and the SPNs are classified as four different types based on the activity dynamics. (H–K) Averaged FRI for Type 1 (H), Type 2 (I), Type 3 (J), Type 4 (K) of SPNs in correct (red) and incorrect 8 s trials (gray). (L) The proportion of four types of SPNs. Type 1 (67/164, 40.9%), Type 2 (55/164, 33.5%), Type 3 (25/164, 15.2%), Type 4 (17/164, 10.4%).
Figure 4 with 1 supplement
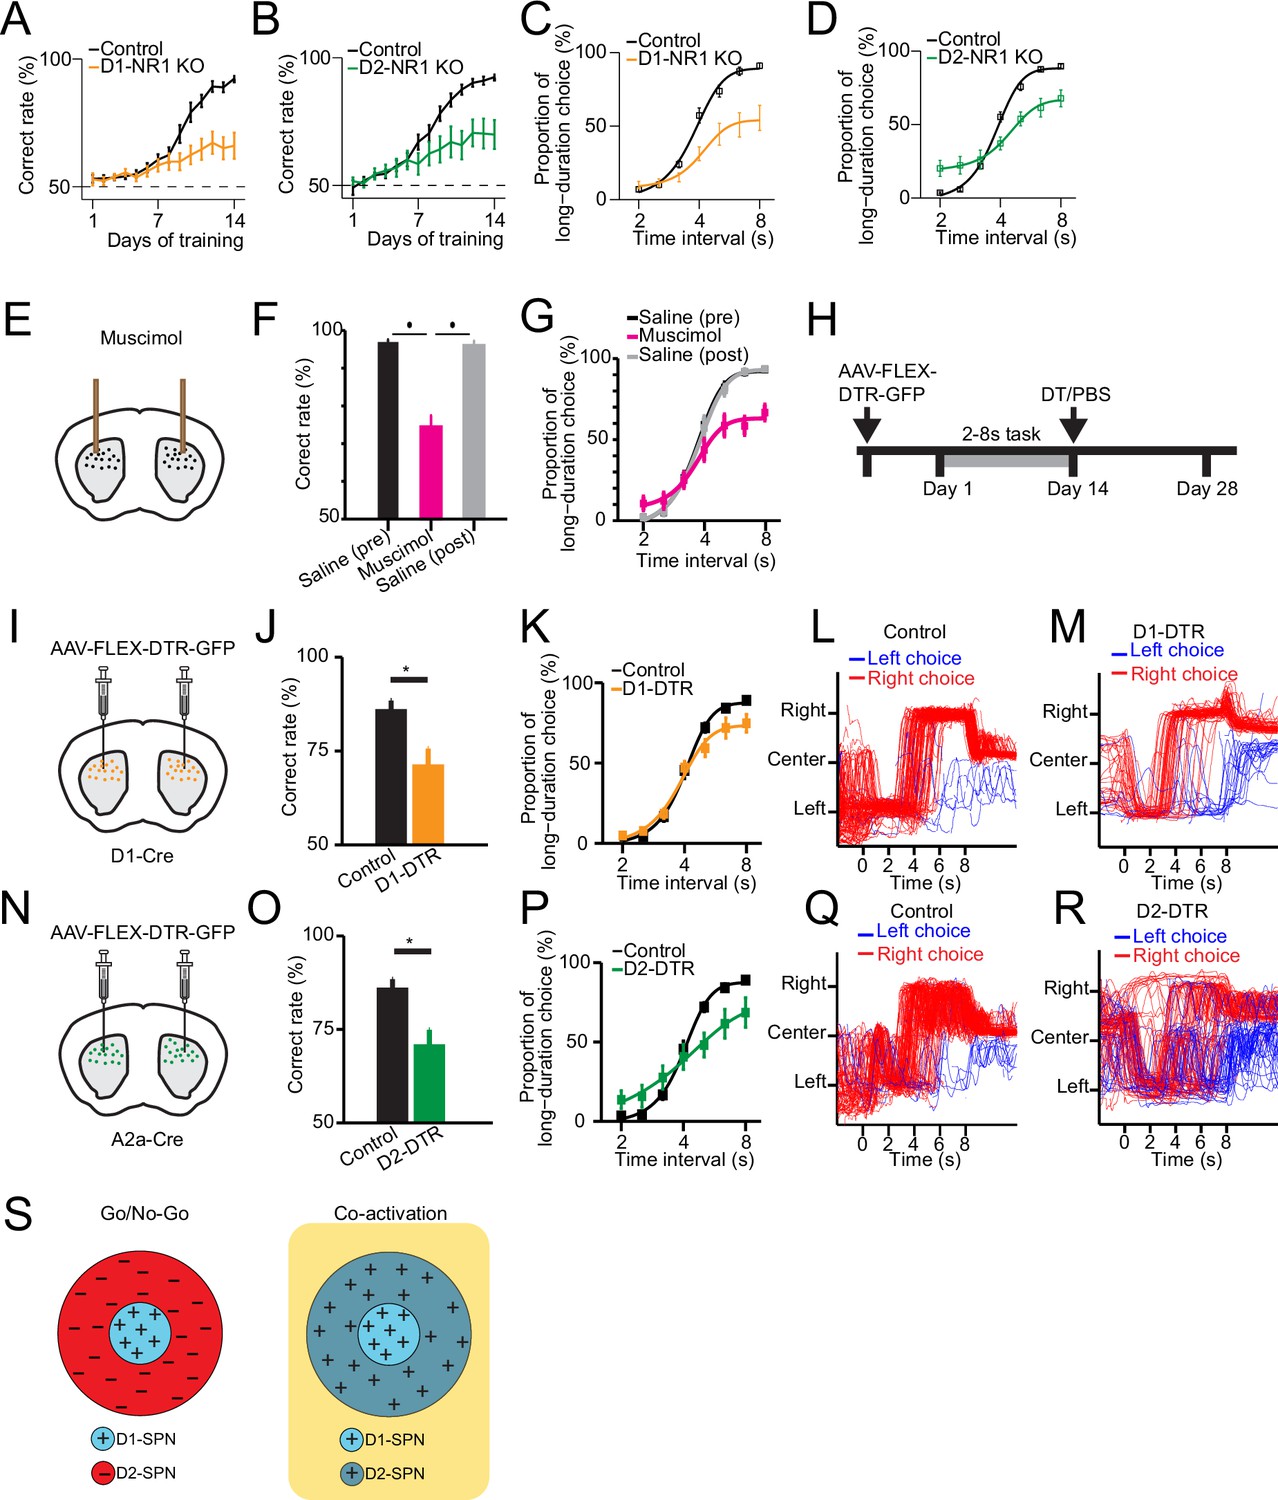
Selective genetic knockout and ablation of D1- or D2-expressing spiny projection neurons (D1- or D2-SPNs) distinctly alters action selection.
(A) Correct rate of control (n=11 mice) and D1-NR1 KO mice (n=16) in 2–8 s task during 14 days’ training (two-way repeated-measures ANOVA, significant difference between control and KO mice, F1,25=10.8, p=0.003). (B) Correct rate of control (n=17) and D2-NR1 KO mice (n=10) in 2–8 s task during 14 days’ training (two-way repeated-measures ANOVA, significant difference between control and KO mice, F1,25=8.728, p=0.007). (C) The psychometric curve for control (n=11) and D1-NR1 KO mice (n=16) (two-way repeated-measures ANOVA, significant difference between control and KO mice, F1,25=12.27, p=0.002). (D) The psychometric curve for control (n=17) and D2-NR1 KO mice (n=10) (two-way repeated-measures ANOVA, significant difference between control and KO mice, F1,25=9.64, p=0.005). (E) Schematic of muscimol infusion into the dorsal striatum in trained mice. (F) Correct rate for control (black: pre-muscimol, gray: post-muscimol) and mice with muscimol infusion (magenta) in dorsal striatum (n=9 mice, paired t-test, p<0.01). (G) The psychometric curve for control (n=9 mice, black: pre-muscimol, gray: post-muscimol control) and mice with muscimol infusion (n=9 mice, magenta) in dorsal striatum (two-way repeated-measures ANOVA, significant difference between control and muscimol infusion, F2,16=11.74, p=0.0007). (H) Timeline for selective diphtheria toxin (DT) ablation experiments. (I) Schematic of diphtheria toxin receptor (DTR) virus (AAV-FLEX-DTR-GFP) injection in dorsal striatum of D1-Cre mice. (J) Correct rate for control (n=9 mice) and mice with dorsal striatum D1-SPNs ablation (D1-DTR, n=8 mice) (two-sample t-test, p=0.0016). (K) The psychometric curve for control (n=9 mice) and D1-SPNs ablation mice (n=8 mice) (two-way repeated-measures ANOVA, main effect of ablation, F1,15=1.84, p=0.195; interaction between trial intervals and ablation, F6,90=4.14, p=0.001). (L) Movement trajectory of a control mouse in 8 s trials. (M) Movement trajectory of a D1-DTR mouse in 8 s trials. (N) Schematic of DTR virus (AAV-FLEX-DTR-GFP) injection in dorsal striatum of A2a-Cre mice. (O) Correct rate for control (n=8 mice) and mice with dorsal striatum D2-SPNs ablation (D2-DTR, n=8 mice) (two-sample t-test, p=0.005). (P) The psychometric curve for control (n=9 mice) and D2-SPNs ablation mice (n=8 mice) (two-way repeated-measures ANOVA, main effect of ablation, F1,15=0.477, p=0.5; interaction between trial intervals and ablation, F6,90=12.6, p<0.001). (Q) Movement trajectory of a control mouse in 8 s trials. (R) Movement trajectory of a D2-DTR mouse in 8 s trials. (S) Schematic of center-surround receptive field diagram for Go/No-Go (left) and Co-activation (right) models. ‘+’ indicates facilitating effect to selection. ‘-’ indicates inhibitory effect to selection.
Figure 4—figure supplement 1
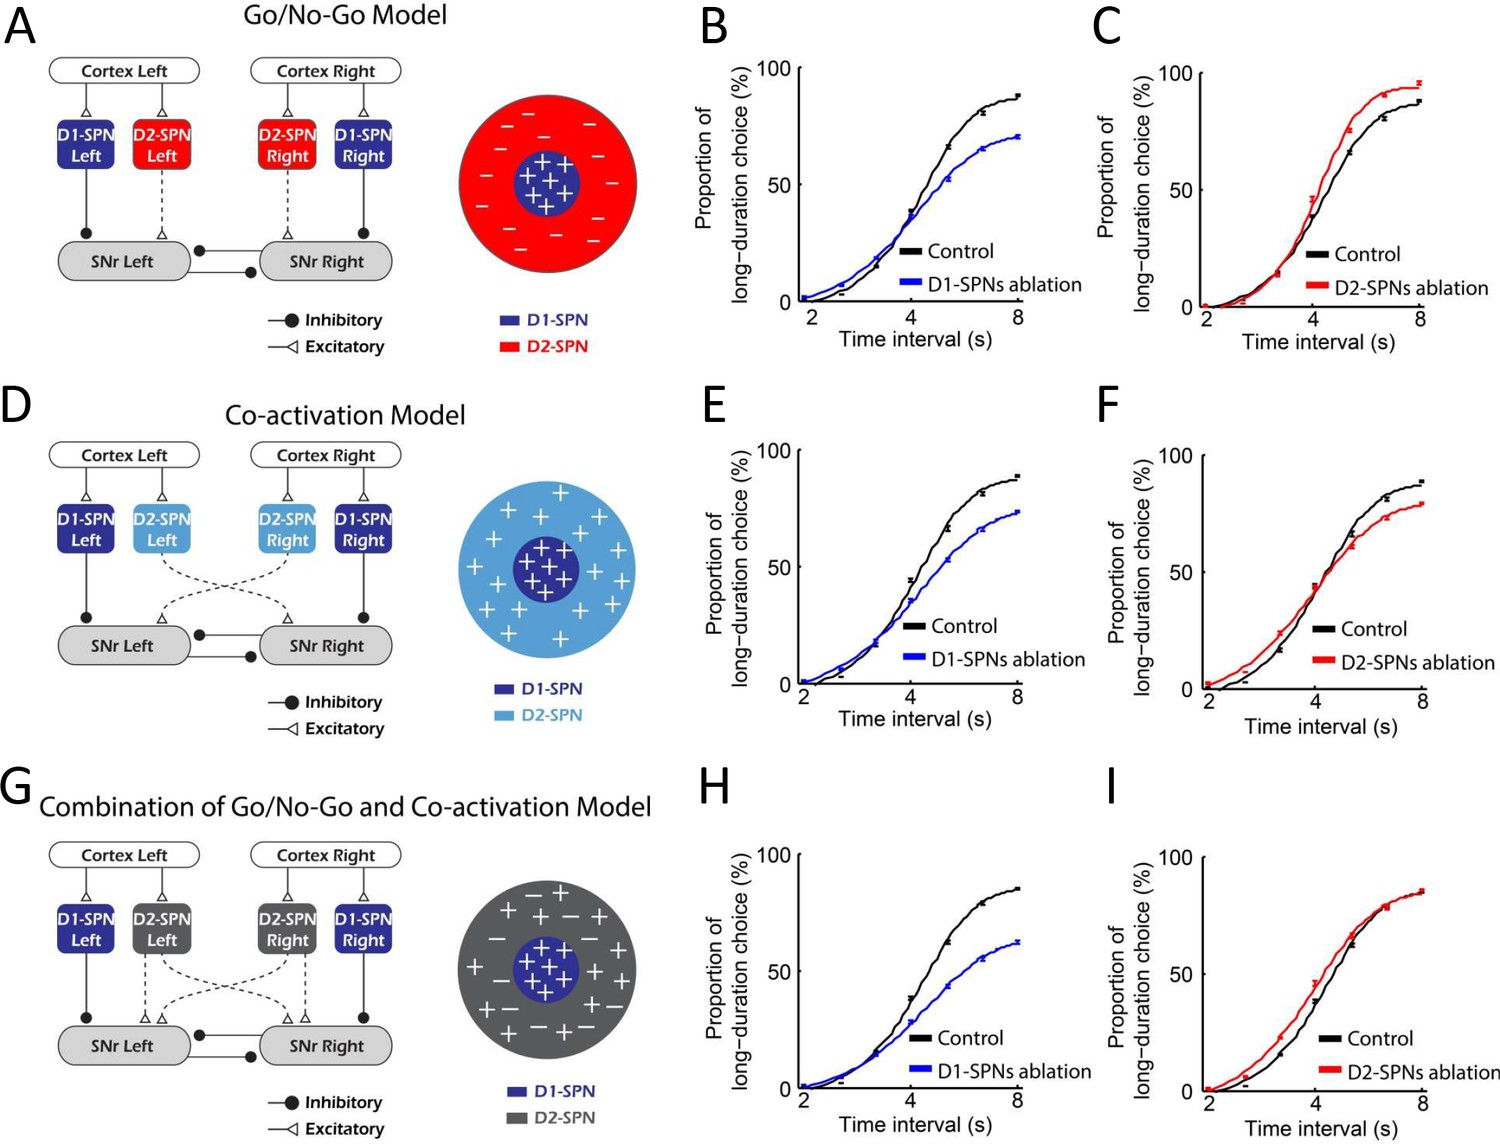
Simulation of lesion experiments in Go/No-Go, Co-activation, and combination models.
(A) Diagram of Go/No-Go model. (B) The psychometric curves of behavior outputs simulated by Go/No-Go model in control (black) and D1-expressing spiny projection neurons (D1-SPNs) ablation condition (blue). (C) The psychometric curves of behavior outputs simulated by Go/No-Go model in control (black) and D2-SPNs ablation condition (red). (D) Diagram of Co-activation model. (E) The psychometric curves of behavior outputs simulated by Co-activation model in control (black) and D1-SPNs ablation condition (blue). (F) The psychometric curves of behavior outputs simulated by Co-activation model in control (black) and D2-SPNs ablation condition (red). (G) Diagram of combination of Go/No-Go and Co-activation model. (H) The psychometric curves of behavior outputs simulated by combined model in control (black) and D1-SPNs ablation condition (blue). (I) The psychometric curves of behavior outputs simulated by combined model in control (black) and D2-SPNs ablation condition (red).
Figure 5 with 1 supplement
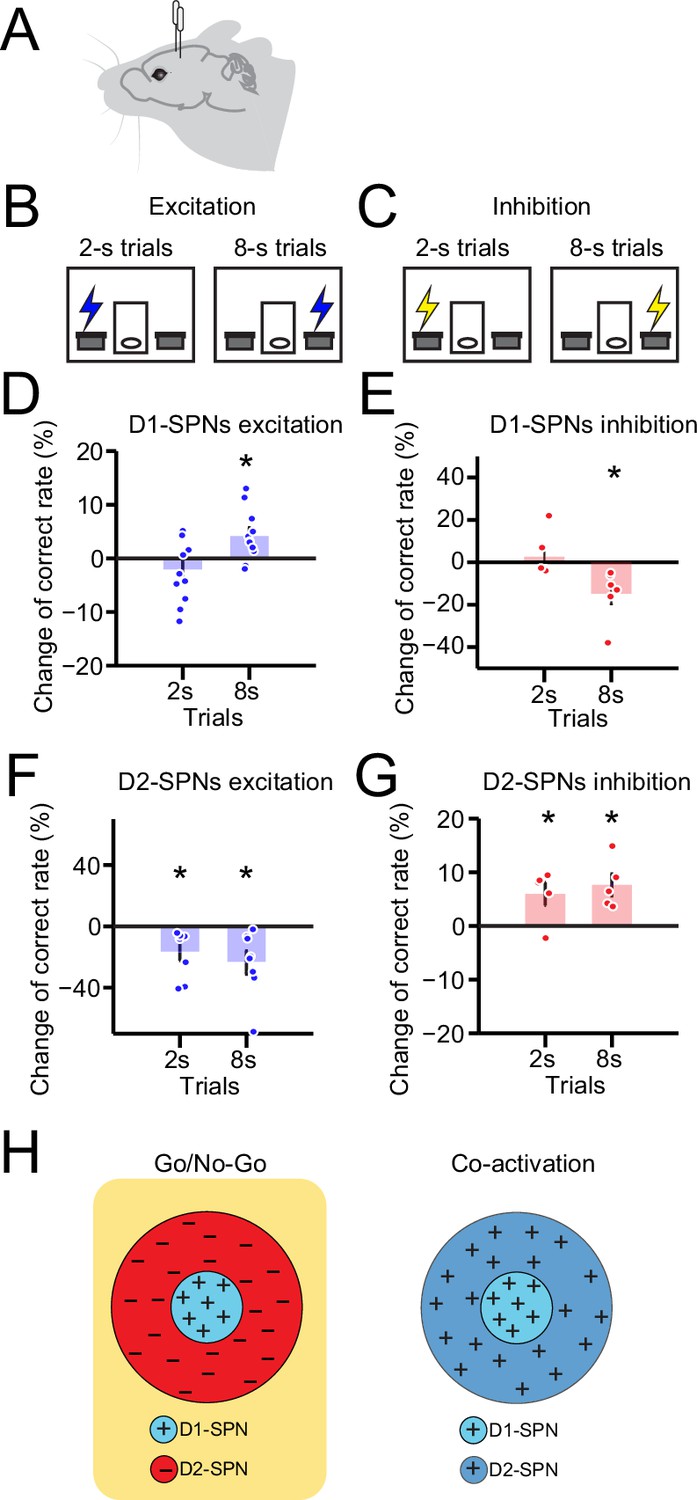
Optogenetic manipulation of D1- vs. D2-expressing spiny projection neurons (D1- vs. D2-SPNs) differently regulates action selection.
(A) Schematic of optic fiber implantation for experimentally optogenetic excitation or inhibition of D1- or D2-SPNs in the dorsal striatum. (B, C) Schematic for optogenetic excitation (B) and inhibition (C) of D1-/D2-SPNs for 1 s right before lever extension in 2–8 s task. (D) Change of correct rate for optogenetic excitation of D1-SPNs in 2 s and 8 s trials (n=11 mice, one-sample t-test, 2 s trials: p=0.248; 8 s trials: p<0.05). (E) Change of correct rate for optogenetic inhibition of D1-SPNs in 2 s and 8 s trials (n=6 mice, one-sample t-test, 2 s trials: p=0.557; 8 s trials: p<0.05). (F) Change of correct rate for optogenetic excitation of D2-SPNs in 2 s and 8 s trials (n=8 mice, one-sample t-test, 2 s trials: p<0.05; 8 s trials: p<0.05). (G) Change of correct rate for optogenetic inhibition of D2-SPNs in 2 s and 8 s trials (n=5 mice, one-sample t-test, 2 s trials: p<0.05; 8 s trials: p<0.05). (H) Schematic of center-surround receptive field diagram for Go/No-Go (left) and Co-activation (right) models. ‘+’ indicates facilitating effect to selection. ‘-’ indicates inhibitory effect to selection.
Figure 5—figure supplement 1
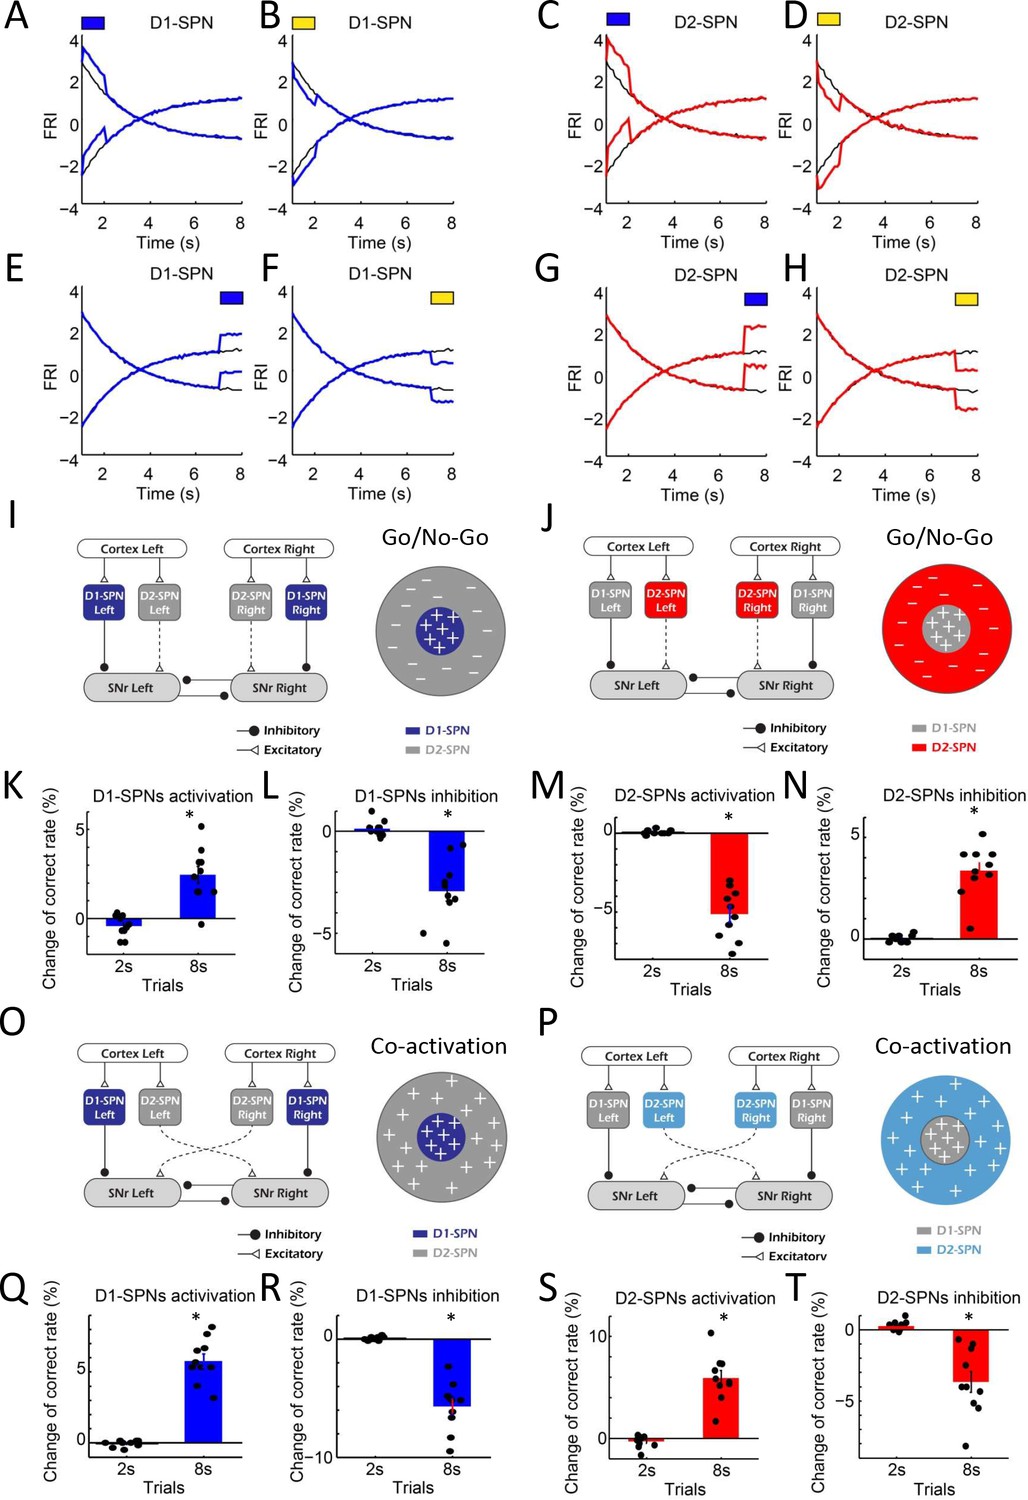
Simulation of optogenetic manipulation in Go/No-Go and Co-activation models.
(A, B) Simulating optogenetic activation (A) and inhibition (B) of D1-expressing spiny projection neurons (D1-SPNs) at 2 s. Blue bar above indicates optogenetic activation. Yellow bar above indicates optogenetic inhibition. (C, D) Simulating optogenetic activation (C) and inhibition (D) of D2-SPNs at 2 s. (E, F) Simulating optogenetic activation (E) and inhibition (F) of D1-SPNs at 8 s. (G, H) Simulating optogenetic activation (G) and inhibition (H) of D2-SPNs at 8 s. (I, J) Diagram of D1-SPN (I) and D2-SPN (J) manipulation in Go/No-Go model. (K, L) Change of correct rate in 2 s and 8 s trials when activating (K) and inhibiting (L) D1-SPNs in Go/No-Go model. (M, N) Change of correct rate in 2 s and 8 s trials when activating (M) and inhibiting (N) D2-SPNs in Go/No-Go model. (O, P) Diagram of D1-SPN (O) and D2-SPN (P) manipulation in Co-activation model. (Q, R) Change of correct rate in 2 s and 8 s trials when activating (Q) and inhibiting (R) D1-SPNs in Co-activation model. (S, T) Change of correct rate in 2 s and 8 s trials when activating (S) and inhibiting (T) D2-SPNs in Co-activation model. One-sample test for all the change of correct rate. *p<0.05.
Figure 6 with 3 supplements

A Triple-control computational model of basal ganglia direct and indirect pathways for action selection.
(A) Network structure of the cortico-basal ganglia model based on realistic anatomy and synaptic connectivity. Dashed lines indicate multi-synaptic connections. (B) Schematic of center-surround-context receptive field diagram for ‘Triple-control’ model. ‘+’ indicates facilitating effect to selection. ‘-’ indicates inhibitory effect to selection. (C) The psychometric curves of behavioral output in control (black) and D1-expressing spiny projection neurons (D1-SPNs) ablation condition (blue) in ‘Triple-control’ model (n=10, two-way repeated-measures ANOVA, main effect of ablation, F1,18=98.72, p<0.0001; interaction between trial intervals and ablation, F6,108=7.799, p<0.0001). (D) The psychometric curves of behavioral output in control (black) and D2-SPNs ablation condition (red) in ‘Triple-control’ model (n=10, two-way repeated-measures ANOVA, main effect of ablation, F1,18=99.54, p<0.0001; interaction between trial intervals and ablation, F6,108=177.6, p<0.0001). (E) Change of correct rate for optogenetic excitation of D1-SPNs in 2 s and 8 s trials (n=10, one-sample t-test, 2 s trials: p=0.407; 8 s trials: p<0.05). (F) Change of correct rate for optogenetic excitation of D2-SPNs in 2 s and 8 s trials (n=10, one-sample t-test, 2 s trials: p<0.05; 8 s trials: p<0.05). (G) Change of correct rate for optogenetic inhibition of D1-SPNs in 2 s and 8 s trials (n=10, one-sample t-test, 2 s trials: p=0.28; 8 s trials: p<0.05). (H) Change of correct rate for optogenetic inhibition of D2-SPNs in 2 s and 8 s trials (n=10, one-sample t-test, 2 s trials: p<0.05; 8 s trials: p<0.05).
Figure 6—figure supplement 1

The neuronal activities in the ‘Triple-control’ model and simulation of lesion experiments.
(A) The simulated neuronal dynamics quantified as firing rate index (FRI) for the cortical neurons in 8 s trials. (B) The simulated neuronal dynamics quantified as FRI for the D1-expressing spiny projection neuron (D1-SPN) in 8 s trials. (C) The simulated neuronal dynamics quantified as FRI for the D2-SPN 1 in 8 s trials. (D) The simulated neuronal dynamics quantified as FRI for the D2-SPN 2 in 8 s trials. (E) Schematic of selective ablation of D1-SPNs in the ‘Triple-control’ model. (F) The model’s Type 1 and Type 2 substantia nigra pars reticulata (SNr) FRI in control condition (black) and under D1-SPNs ablation (blue). (G) The subtraction of FRI between Type 1 and Type 2 SNr neurons in control (black) and D1-SPNs ablation condition (blue). (H) Schematic of selective ablation of D2-SPNs in the ‘Triple-control’ model. (I) The model’s Type 1 and Type 2 SNr FRI in control condition (black) and under D2-SPNs ablation (red). (J) The subtraction of FRI between Type 1 and Type 2 SNr neurons in control (black) and D2-SPNs ablation condition (red).
Figure 6—figure supplement 2
Optogenetic activation of D1- vs. D2-expressing spiny projection neurons (D1- vs. D2-SPNs) differently regulates substantia nigra pars reticulata (SNr) activities in model and experiments.
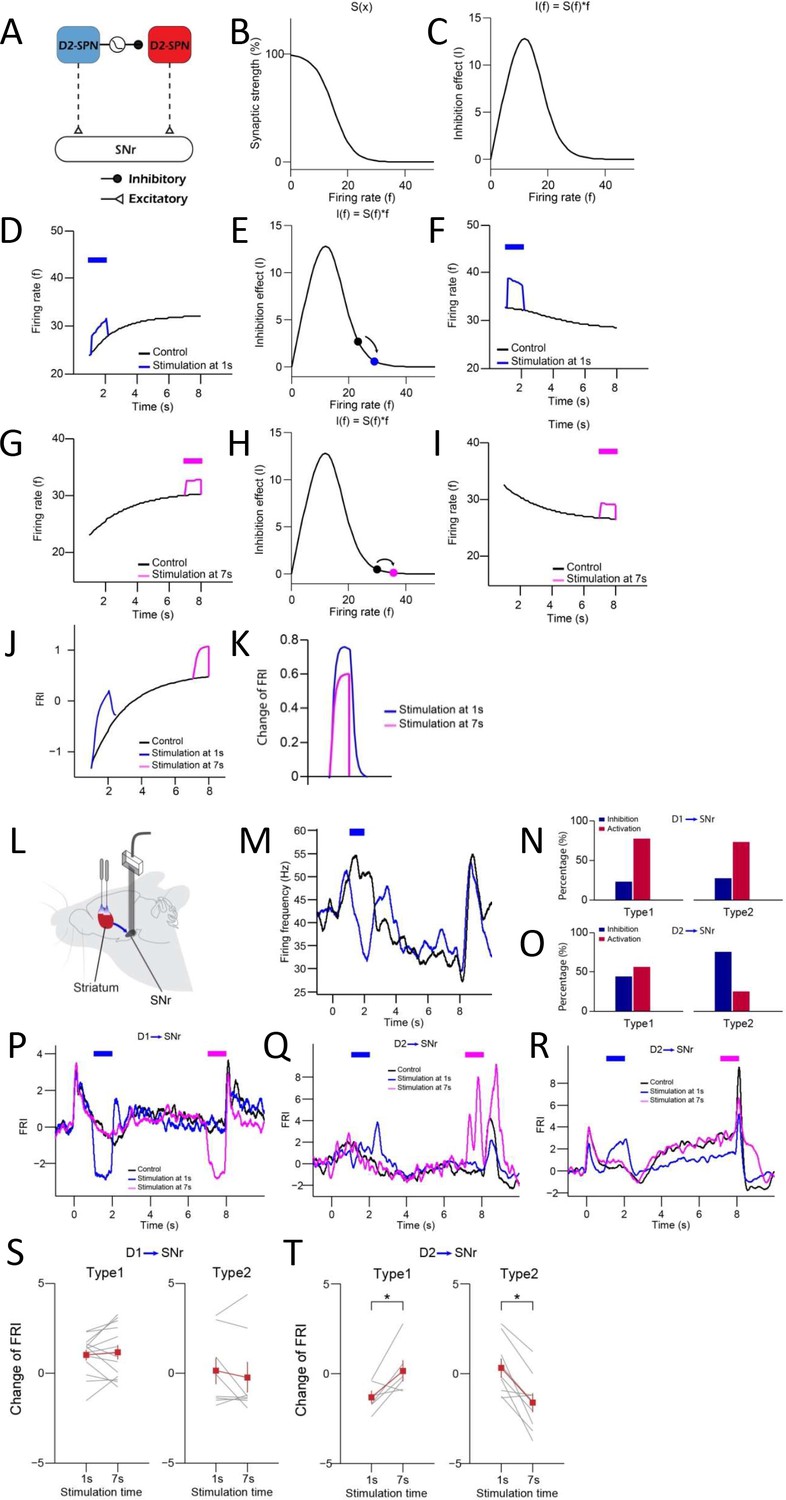
(A) A computational motif of indirect pathway with collateral inhibitory synapse D2-SPN 1→ D2-SPN 2. The collateral synapse between D2-SPNs exhibits short-term depression. (B) Relationship between synaptic strength of D2-SPN 1→ D2-SPN 2 and the firing rate of D2-SPN 1. (C) The inhibition effect of the collateral synapse between D2-SPNs. (D) Activation of presynaptic D2-SPN 1 at 1 s. (E) Synaptic inhibition effect D2-SPN 1→ D2-SPN 2 synapse when activating D2-SPN 1 at 1 s. (F) Activation of D2-SPN 2 at 1 s. (G) Activation of presynaptic D2-SPN 1 at 7 s. (H) Synaptic inhibition effect D2-SPN 1→ D2-SPN 2 synapse when activating D2-SPN 1 at 7 s. (I) Activation of D2-SPN 2 at 7 s. (J) SNr neuron activities responding to activation of D2-SPNs at 1 s (blue) and 7 s (purple). (K) Comparison of firing rate index (FRI) changes in SNr caused by activation of D2-SPNs at 1 s and 7 s. (L) Schematic of simultaneous optogenetic excitation of D1- or D2-SPNs in the dorsal striatum and recording in SNr during action selection. (M) Averaged neuronal activities of an example SNr Type 1 neuron responding to optogenetic activation of D1-SPNs at 1 s during 8 s trials. (N) The percentage of SNr Type 1 (left) and Type 2 (right) neurons showing excitation (blue) and inhibition (red) when stimulating D1-SPNs. (O) The percentage of SNr Type 1 (left) and Type 2 (right) neurons showing excitation (blue) and inhibition (red) when stimulating D2-SPNs. (P) Averaged neuronal activities of an example SNr Type 2 neuron responding to optogenetic activation of D1-SPNs at 1 s (blue) and 8 s (purple) during 8 s trials. (Q, R) Averaged neuronal activities of SNr Type 1 (Q) and Type 2 (R) neuron responding to optogenetic activation of D2-SPNs at 1 s (blue) and 7 s (purple) during 8 s trials. (S) Comparison of FRI changes in SNr Type 1 (left) and Type 2 (right) neurons caused by optogenetic activation of D1-SPNs at 1 s and 7 s. (T) Comparison of FRI changes in SNr Type 1 (left) and Type 2 (right) neurons caused by optogenetic activation of D2-SPNs at 1 s and 7 s (paired t-test, p<0.05).
Figure 6—figure supplement 3
Computational modeling of optogenetic manipulation reveals that D1- vs. D2-expressing spiny projection neurons (D1- vs. D2-SPNs) differently regulates substantia nigra pars reticulata (SNr) outputs in the ‘Triple-control’ model.
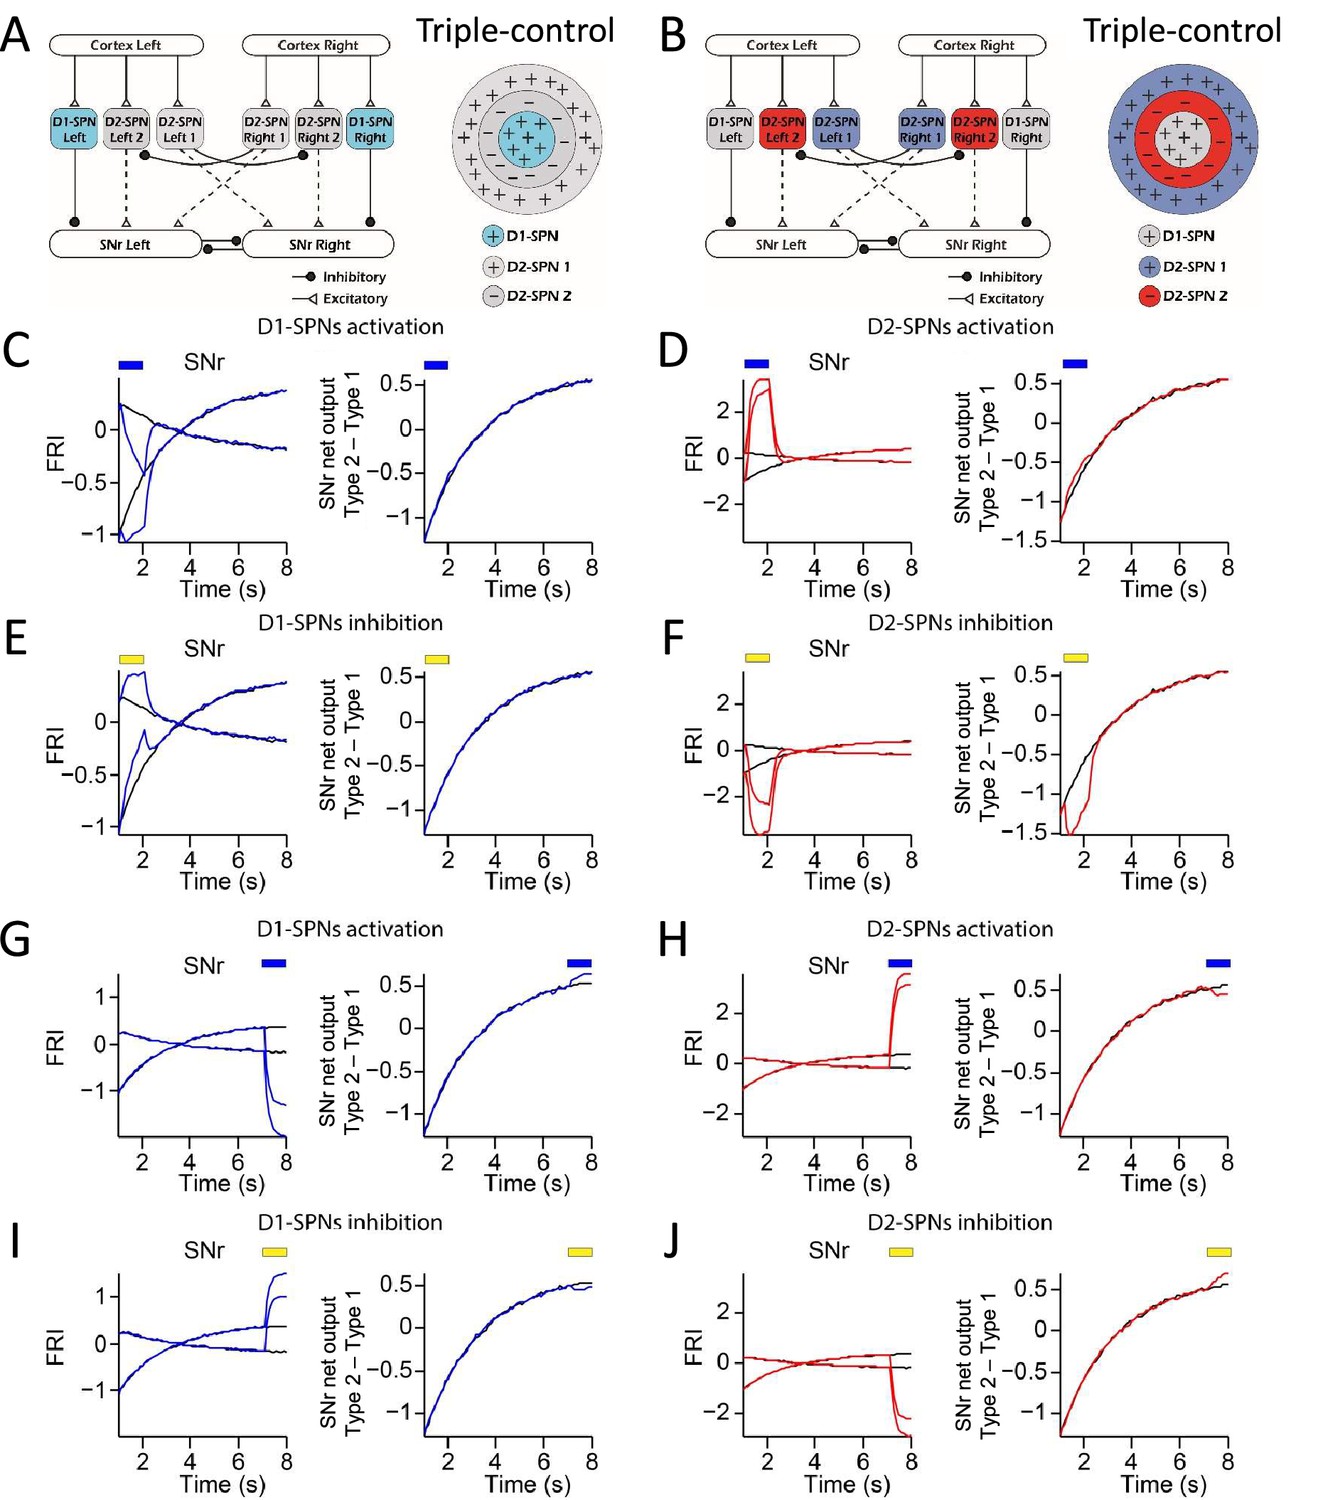
(A, B) Schematic for optogenetic manipulation of D1-SPNs (A) and D2-SPNs (B) in the ‘Triple-control’ model. (C) Modeling of neuronal dynamics of SNr Type 1/Type 2 (left panel) and net output (right panel) under control (black) and activation (blue) of D1-SPNs at 2 s. (D) Modeling of neuronal dynamics of SNr Type 1/Type 2 (left panel) and net output (right panel) under control (black) and activation (red) of D2-SPNs at 2 s. (E) Modeling of neuronal dynamics of SNr Type 1/Type 2 (left panel) and net output (right panel) under control (black) and inhibition (blue) of D1-SPNs at 2 s. (F) Modeling of neuronal dynamics of SNr Type 1/Type 2 (left panel) and net output (right panel) under control (black) and inhibition (red) of D2-SPNs at 2 s. (G) Modeling of neuronal dynamics of SNr Type 1/Type 2 (left panel) and net output (right panel) under control (black) and activation (blue) of D1-SPNs at 8 s. (H) Modeling of neuronal dynamics of SNr Type 1/Type 2 (left panel) and net output (right panel) under control (black) and activation (red) of D2-SPNs at 8 s. (I) Modeling of neuronal dynamics of SNr Type 1/Type 2 (left panel) and net output (right panel) under control (black) and inhibition (blue) of D1-SPNs at 8 s. (J) Modeling of neuronal dynamics of SNr Type 1/Type 2 (left panel) and net output (right panel) under control (black) and inhibition (red) of D2-SPNs at 8 s.
Figure 7 with 3 supplements
Computational modeling reveals direct and indirect pathways regulating action selection in a distinct manner.
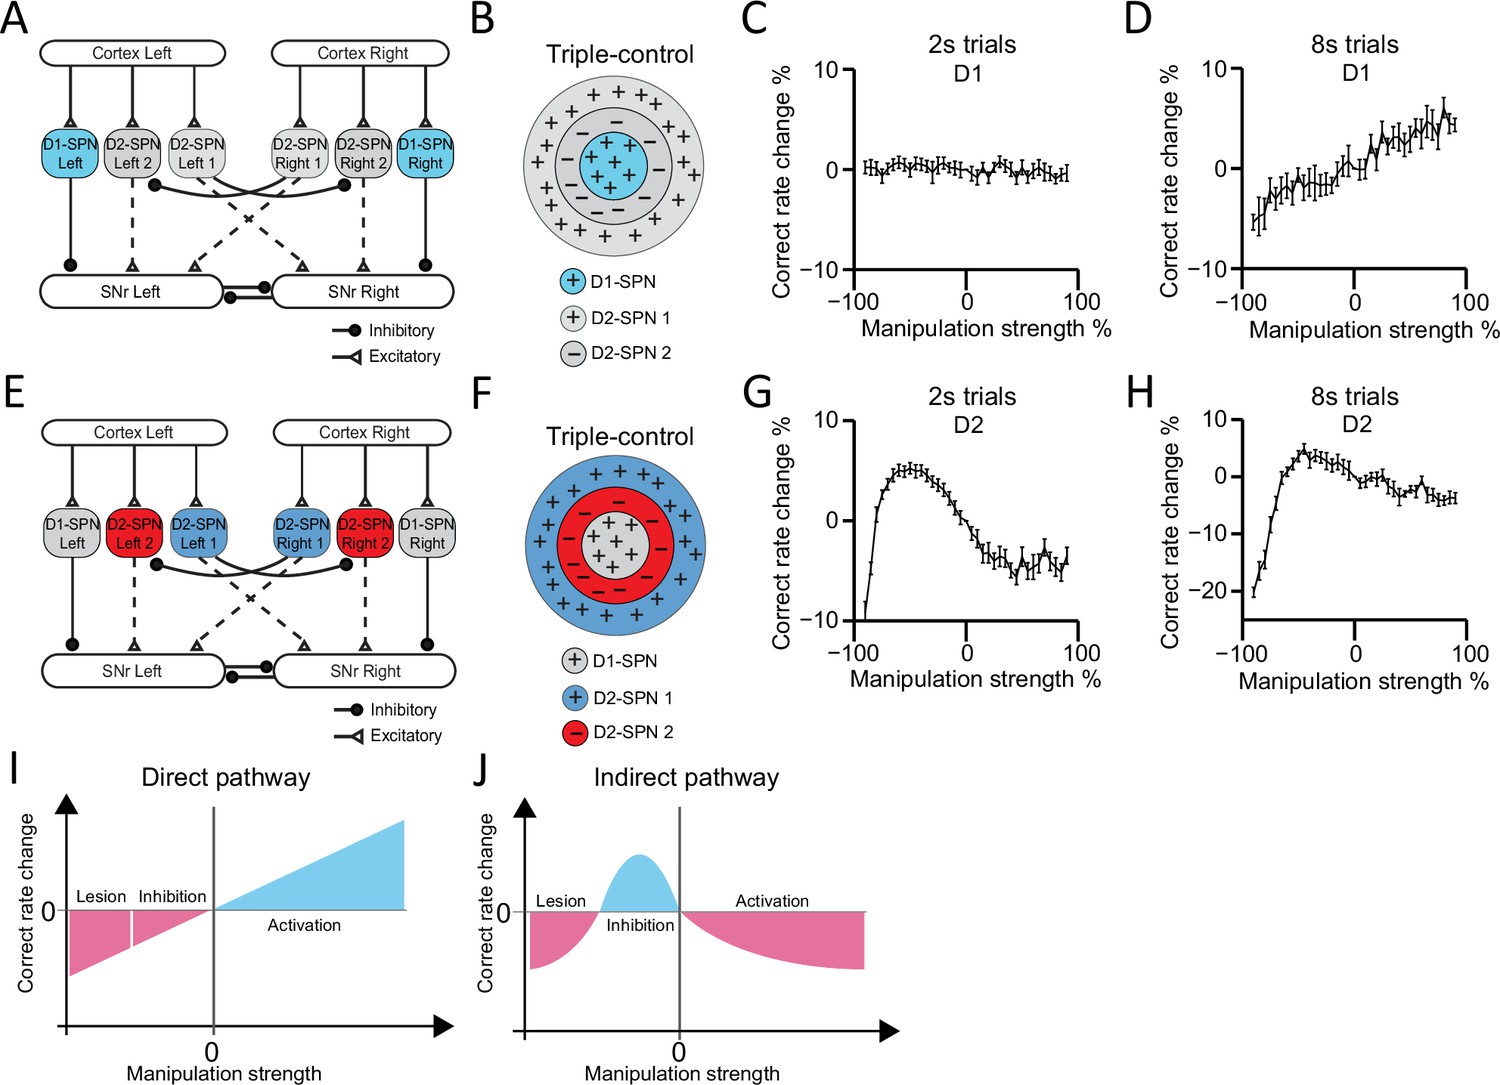
(A) Schematic for manipulation of D1-expressing spiny projection neurons (D1-SPNs) in ‘Triple-control’ model. (B) Schematic of manipulation of D1-SPNs in the center-surround-context receptive field diagram for ‘Triple-control’ model. ‘+’ indicates facilitating effect to selection. ‘-’ indicates inhibitory effect to selection. (C) Correct rate change in 2 s trials when manipulating D1-SPNs with different manipulation strengths (n=10, one-way repeated-measures ANOVA, effect of manipulation strength, F36,324=1.171, p=0.238). (D) Correct rate change in 8 s trials when manipulating D1-SPNs with different manipulation strengths (n=10, one-way repeated-measures ANOVA, effect of manipulation strength, F36,324=13.71, p<0.0001). (E) Schematic for optogenetic manipulation of D2-SPNs in ‘Triple-control’ model. (F) Schematic of manipulation of D2-SPNs in the center-surround-context receptive field diagram for ‘Triple-control’ model. ‘+’ indicates facilitating effect to selection. ‘-’ indicates inhibitory effect to selection. (G) Correct rate change in 2 s trials when manipulating D2-SPNs with different manipulation strengths (n=10, one-way repeated-measures ANOVA, effect of manipulation strength, F36,324=59.13, p<0.0001). (H) Correct rate change in 8 s trials when manipulating D2-SPNs with different manipulation strengths (n=10, one-way repeated-measures ANOVA, effect of manipulation strength, F36,324=40.75, p<0.0001). (I) Diagram of linear modulation of direct pathway. (J) Diagram of nonlinear modulation of indirect pathway.
Figure 7—figure supplement 1

Computational modeling of manipulation reveals that Go/No-Go and Co-activation model differently predicts the behavioral outcomes.
(A) Diagram of Go/No-Go model. (B) Diagram of Co-activation model. (C) Correct rate change in 2 s (left panel) and 8 s trials (right panel) when manipulating D1-expressing spiny projection neurons (D1-SPNs) in Go/No-Go model with different manipulation strengths. (D) Correct rate change in 2 s (left panel) and 8 s trials (right panel) trials when manipulating D1-SPNs in Co-activation model with different manipulation strengths. (E) Correct rate change in 2 s (left panel) and 8 s trials (right panel) when manipulating D2-SPNs in Go/No-Go model with different manipulation strengths. (F) Correct rate change in 2 s (left panel) and 8 s trials (right panel) trials when manipulating D2-SPNs in Co-activation model with different manipulation strengths.
Figure 7—figure supplement 2

Computational modeling reveals that the linear and nonlinear modulation of action selection by direct versus indirect pathway qualitatively hold with additional striatal collateral connections.
(A) Schematic for ‘Triple-control’ model with D1-D1 collateral connections. (B) Correct rate change in 2 s trials (upper panel) and 8 s trials (bottom panel) when manipulating D1-expressing spiny projection neurons (D1-SPNs) with different manipulation strengths (n=10, one-way repeated-measures ANOVA, effect of manipulation strength, 2 s trials: F40,369=1.328, p=0.0945; 8 s trials: F40,369=7.595, p<0.0001). Green lines: ‘Triple-control’ model with D1-D1 collateral connections. Gray lines: The same simulation results as shown in Figure 7C, G. (C) Correct rate change in 2 s trials (upper panel) and 8 s trials (bottom panel) when manipulating D2-SPNs with different manipulation strengths (n=10, one-way repeated-measures ANOVA, effect of manipulation strength, 2 s trials: F40,369=38.22, p<0.0001; 8 s trials: F40,369=34.29, p<0.0001). Green lines: ‘Triple-control’ model with D1-D1 collateral connections. Gray lines: The same simulation results as shown in Figure 7D, H. (D) Schematic for ‘Triple-control’ model with D1-D2 collateral connections. (E) Correct rate change in 2 s trials (upper panel) and 8 s trials (bottom panel) when manipulating D1-SPNs with different manipulation strengths (n=10, one-way repeated-measures ANOVA, effect of manipulation strength, 2 s trials: F40,369=0.9335, p=0.5893; 8 s trials: F40,369=8.778, p<0.0001). Purple lines: ‘Triple-control’ model with D1-D2 collateral connections. Gray lines: The same simulation results as shown in Figure 7C, G. (F) Correct rate change in 2 s trials (upper panel) and 8 s trials (bottom panel) when manipulating D2-SPNs with different manipulation strengths (n=10, one-way repeated-measures ANOVA, effect of manipulation strength, 2 s trials: F40,369=40.94, p<0.0001; 8 s trials: F40,369=26.61, p<0.0001). Purple lines: ‘Triple-control’ model with D1-D2 collateral connections. Gray lines: The same simulation results as shown in Figure 7D, H. (G) Schematic for ‘Triple-control’ model with D2-D1 collateral connections. (H) Correct rate change in 2 s trials (upper panel) and 8 s trials (bottom panel) when manipulating D1-SPNs with different manipulation strengths (n=10, one-way repeated-measures ANOVA, effect of manipulation strength, 2 s trials: F40,369=0.6827, p=0.9299; 8 s trials: F40,369=10.06, p<0.0001). Blue lines: ‘Triple-control’ model with D1-D2 collateral connections. Gray lines: The same simulation results as shown in Figure 7C, G. (I) Correct rate change in 2 s trials (upper panel) and 8 s trials (bottom panel) when manipulating D2-SPNs with different manipulation strengths (n=10, one-way repeated-measures ANOVA, effect of manipulation strength, 2 s trials: F40,369=153.3, p<0.0001; 8 s trials: F40,369=38.38, p<0.0001). Blue lines: ‘Triple-control’ model with D1-D2 collateral connections. Gray lines: The same simulation results as shown in Figure 7D, H.
Figure 7—figure supplement 3
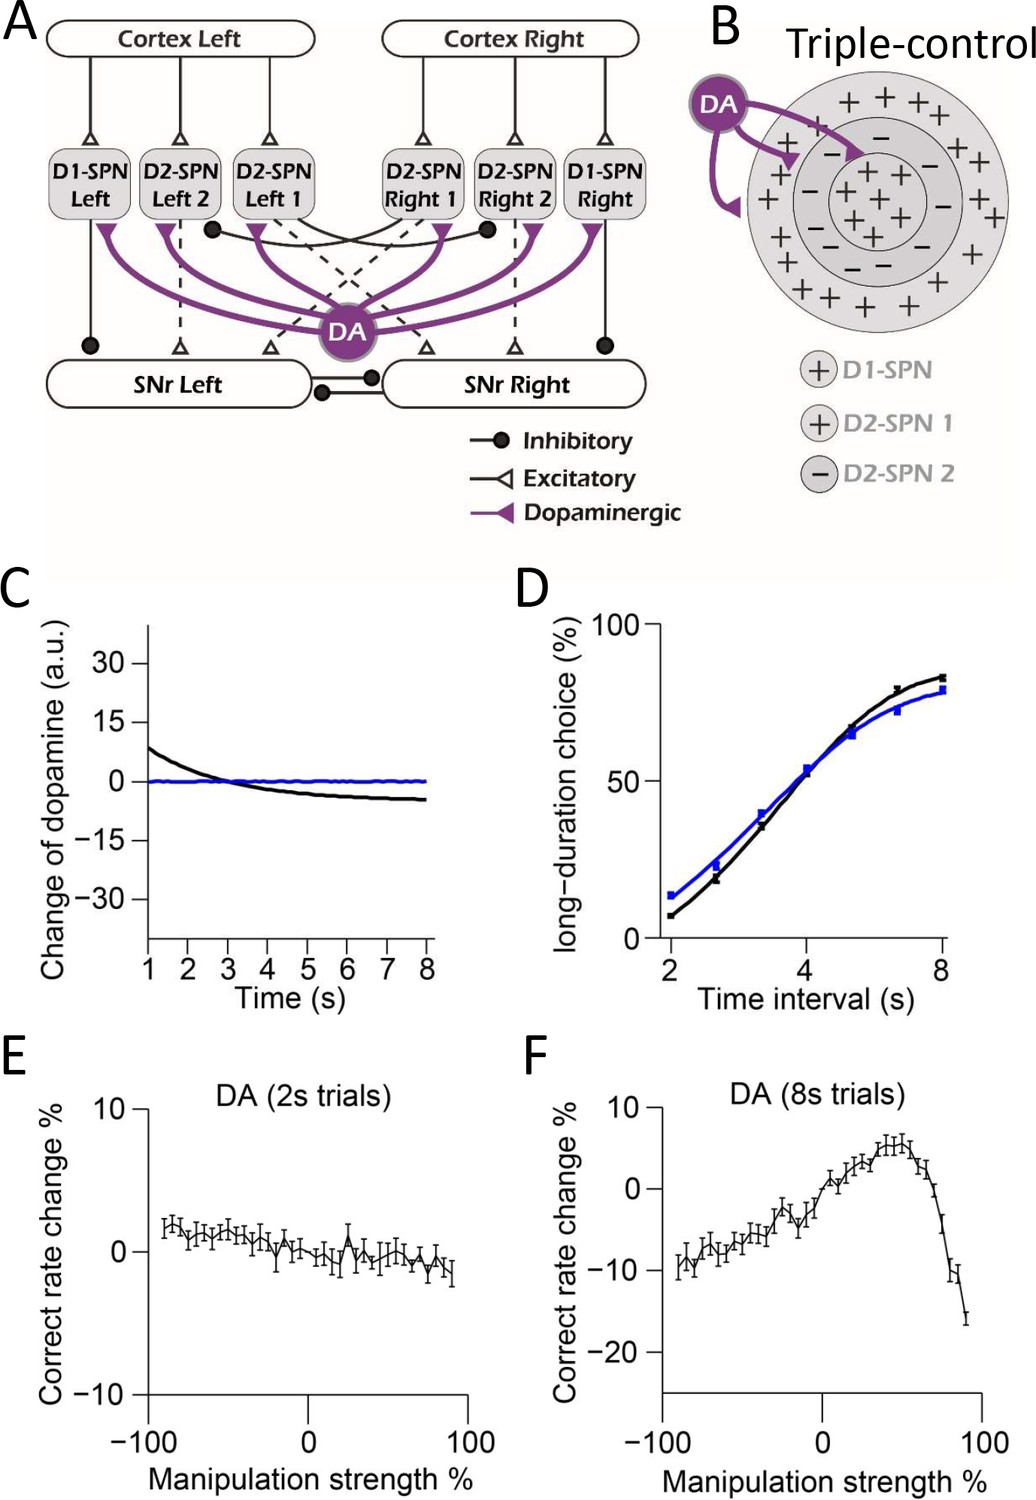
Computational modeling of dopaminergic modulation in the ‘Triple-control’ model.
(A) Diagram of Triple-control model with dopaminergic modulation on spiny projection neurons (SPNs). (B) Schematic of center-surround-context receptive field diagram with dopaminergic modulation added for ‘Triple-control’ model. ‘+’ indicates facilitating effect to selection. ‘-’ indicates inhibitory effect to selection. (C) Simulation of two types of dopamine dynamics (black: decreasing dopamine; blue: constant dopamine with no change) in 8 s trials. (D) Psychometric curves corresponding to each dopamine dynamics (n=10, two-way repeated-measures ANOVA, main effect of ablation, F1,18 = 0.8743, p=0.362; interaction between trial intervals and ablation, F6,108 = 8.261, p<0.0001). (E, F) Correct rate change in 2 s (E) and 8 s trials (F) trials when manipulating dopamine in ‘Triple-control’ model with different manipulation strengths (n=10, one-way repeated-measures ANOVA, effect of manipulation strength, 2 s trials: F36,324 = 3.868, p<0.0001; 8 s trials: F36,324 = 39.98, p<0.0001).
Videos
Video 1
Stereotypical behavior of a well-trained mouse in a successful 8 s trial.
Tables
Key resources table
| Reagent type (species) or resource | Designation | Source or reference | Identifiers | Additional information |
|---|---|---|---|---|
| Strain, strain background (adeno-associated virus) | AAV9-FLEX-DTR-GFP | Salk GT3 Core | N/A | |
| Strain, strain background (adeno-associated virus) | AAV5-EF1a-DIO-hChR2(H134R)-mCherry | University of North Carolina Vector Core | N/A | |
| Strain, strain background (adeno-associated virus) | AAV9-EF1a-DIO-hChR2(H134R)-eYFP | University of Pennsylvania Vector Core | Cat# AV-9-20298P | |
| Strain, strain background (adeno-associated virus) | AAV5-EF1a-DIO-eNpHR3.0-eYFP | University of North Carolina Vector Core | N/A | |
| Chemical compound, drug | Muscimol, GABAA receptor agonist | Sigma-Aldrich | Cat# M1523 | |
| Chemical compound, drug | Diphtheria toxin | List Biological Labs | Part# 150 | |
| Strain, strain background (Mus musculus) | Mouse: C57BL/6 | Envigo/Harlan | Code: 044 | |
| Strain, strain background (Mus musculus) | Mouse: NR1f/f (B6.129S4-Grin1tm2Stl/J) | Jackson Laboratory | Stock# 005246 | |
| Strain, strain background (Mus musculus) | Mouse: Ai32 (B6;129S-Gt(ROSA)26Sortm32(CAG-COP4*H134R/EYFP)Hze/J) | Jackson Laboratory | Stock# 012569 | |
| Strain, strain background (Mus musculus) | Mouse: D1-cre (B6.FVB(Cg)-Tg(Drd1a-cre)EY217Gsat/Mmucd) | MMRRC | RRID: MMRRC_034258-UCD | |
| Strain, strain background (Mus musculus) | Mouse: A2a-cre (B6.FVB(Cg)-Tg(Adora2a-cre)KG139Gsat/Mmucd) | MMRRC | RRID: MMRRC_036158-UCD | |
| Software, algorithm | GraphPad Prism | GraphPad Software | Version 7.03 | https://www.graphpad.com/scientific-software/prism/ |
| Software, algorithm | MATLAB | MathWorks | R2013a | https://www.mathworks.com/products/matlab.html |
| Software, algorithm | Med-PC | Med Associates | Cat# SOF-735 | https://med-associates.com/product/med-pc-v/ |
| Software, algorithm | Offline Sorter | Plexon | Version 3.3.3 | https://plexon.com/products/offline-sorter/ |
| Software, algorithm | OmniPlex | Plexon | Version 1.4.5 | https://plexon.com/products/omniplex-software/ |
| Software, algorithm | EthoVision | Noldus | Version 8.5 | |
| Other | Med Associates operant chamber | Med Associates | Cat# MED-307W-D1 | |
| Other | Electrode Array | Innovative Neurophysiology | N/A | |
| Other | 473 nm laser | LaserGlow Technologies | N/A | |
| Other | 532 nm laser | LaserGlow Technologies | N/A |
Additional files
Download links
A two-part list of links to download the article, or parts of the article, in various formats.
Downloads (link to download the article as PDF)
Open citations (links to open the citations from this article in various online reference manager services)
Cite this article (links to download the citations from this article in formats compatible with various reference manager tools)
Multiple dynamic interactions from basal ganglia direct and indirect pathways mediate action selection
eLife 12:RP87644.
https://doi.org/10.7554/eLife.87644.3


