A novel computational pipeline for var gene expression augments the discovery of changes in the Plasmodium falciparum transcriptome during transition from in vivo to short-term in vitro culture
- Section of Paediatric Infectious Disease, Department of Infectious Disease, Imperial College London, United Kingdom
- Department of Life Sciences, Imperial College London, South Kensington, United Kingdom
- Centre for Paediatrics and Child Health, Imperial College London, United Kingdom
- Bernhard Nocht Institute for Tropical Medicine, Bernhard-Nocht-Strasse, Germany
- Centre for Structural Systems Biology, Germany
- Biology Department, University of Hamburg, Germany
- Center for Medical Parasitology, Department of Immunology and Microbiology, University of Copenhagen, Denmark
- Department of Infectious Diseases, Copenhagen University Hospital, Denmark
- Department of Microbiology and Immunology, University of Melbourne, Australia
- School of Biomedical Sciences, Faculty of Medicine & Health, UNSW, Kensington, United Kingdom
- School of Infection & Immunity, MVLS, University of Glasgow, United Kingdom
- German Center for Infection Research (DZIF), partner site Hamburg-Borstel-Lübeck-Riems, Germany
Figures
Figure 1
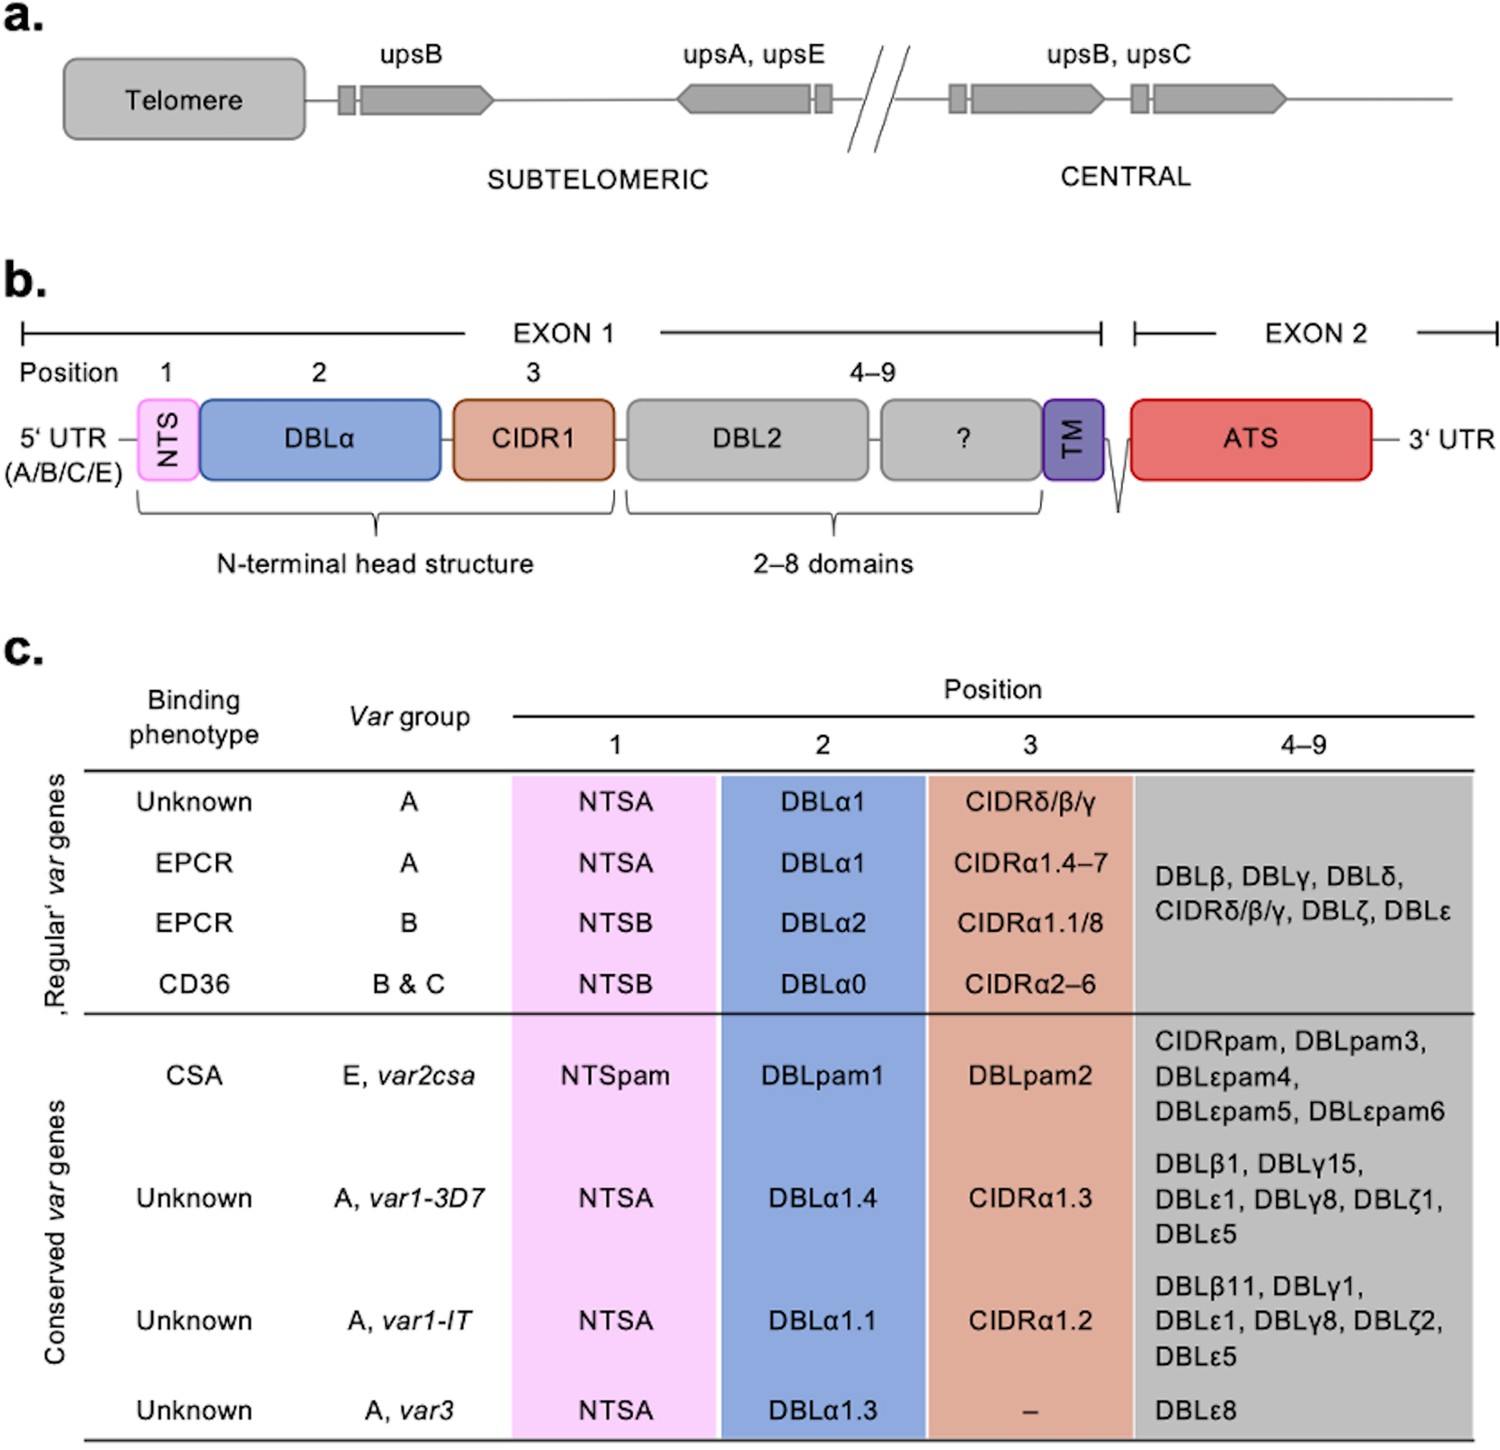
Summary of the var chromosomal location, var gene, PfEMP1 protein structure, and PfEMP1-binding phenotypes.
(a) Chromosomal position and transcriptional direction (indicated by arrows) of the different var gene groups, designated by the respective type of upstream sequence (Kraemer and Smith, 2003; Lavstsen et al., 2003). (b) Structure of the var gene which encodes the PfEMP1 protein. The var gene is composed of two exons, the first, around 3–9.4 kb, encodes the highly variable extracellular region and the transmembrane region (TM) of PfEMP1. Exon 2 is shorter with about 1.2 kb and encodes a semi-conserved intracellular region (acidic terminal segment [ATS]). The PfEMP1 protein is composed of an N-terminal segment (NTS), followed by a variable number of Duffy binding-like (DBL) domains and cysteine-rich interdomain regions (CIDR) (Rask et al., 2010). (c) Summary of PfEMP1 proteins encoded in the parasite genome, their composition of domain subtypes, and associated N-terminal binding phenotype. Group A and some B proteins have an EPCR-binding phenotype; the vast majority of group B and C PfEMP1 proteins bind to CD36. Group A proteins also include those that bind a yet unknown receptor, as well as VAR1 and VAR3 variants with unknown function and binding phenotype. VAR2CSA (group E) binds placental chondroitin sulphate A (CSA).
Figure 2 with 4 supplements
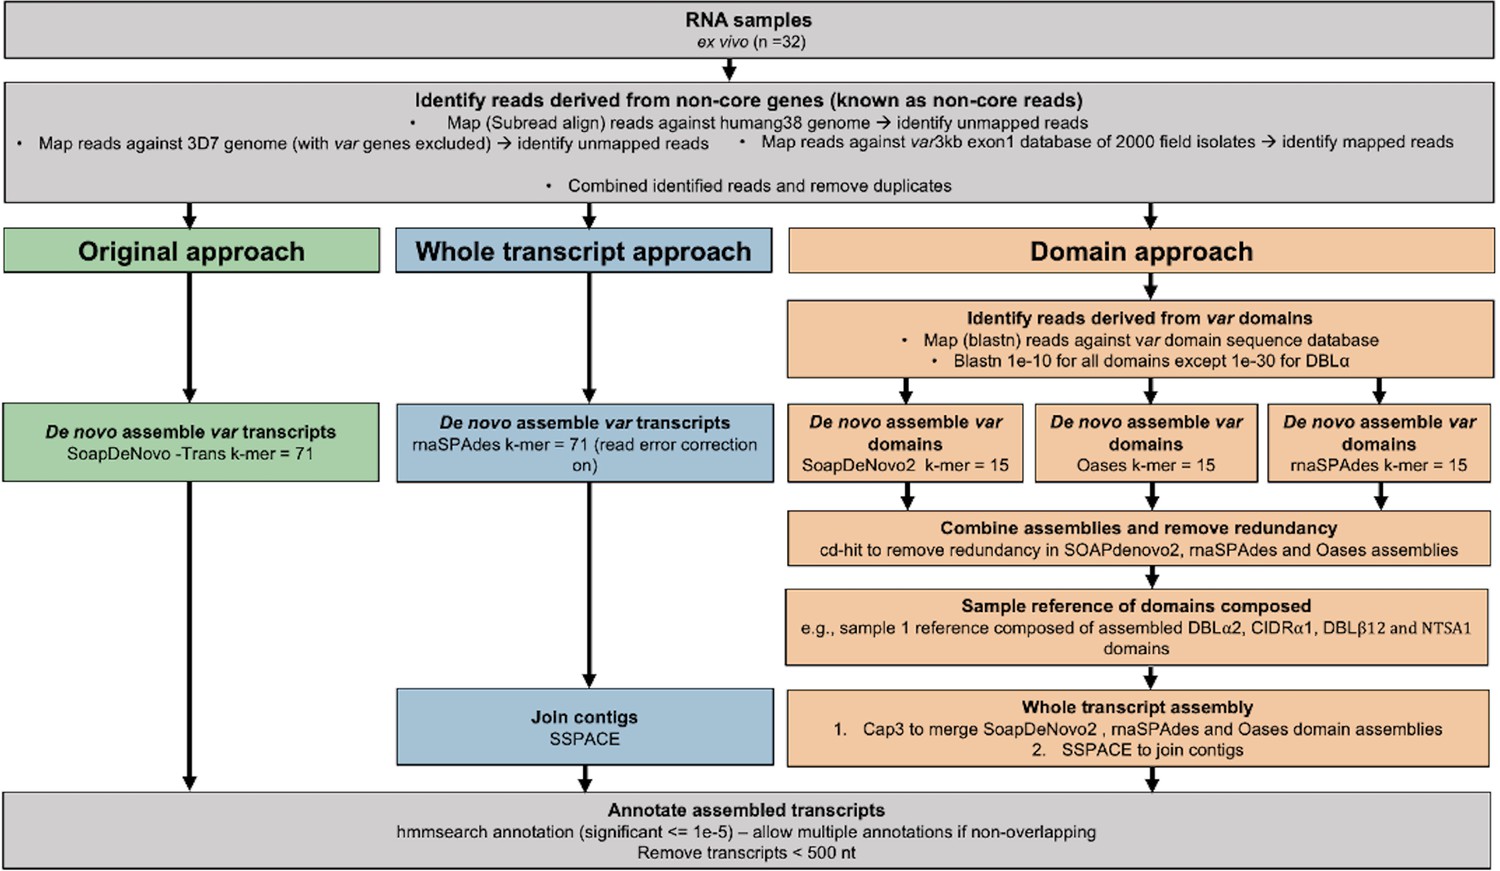
Overview of novel computational pipelines for assembling var transcripts.
The original approach (green) used SoapDeNovo-Trans (k=71) to perform whole var transcript assembly. The whole transcript approach (blue) focussed on assembling whole var transcripts from the non-core reads using rnaSPAdes (k=71). Contigs were then joined into longer transcripts using SSPACE. The domain approach (orange) assembled var domains first and then joined the domains into whole transcripts. Domains were assembled separately using three different de novo assemblers (SoapDeNovo2, Oases, and rnaSPAdes). Next, a reference of assembled domains was composed and cd-hit (at sequence identity = 99%) was used to remove redundant sequences. Cap3 was used to merge and extend domain assemblies. Finally, SSPACE was used to join domains together. Hidden Markov models (HMM) built on the Rask et al., 2010, dataset were used to annotate the assembled transcripts (Rask et al., 2010). The most significant alignment was taken as the best annotation for each region of the assembled transcript (significance ≤ 1e-5) identified using cath-resolve-hits0. Transcripts <500 nt were removed. A var transcript was selected if it contained at least one significantly annotated domain (in exon 1). Var transcripts that encoded only the more conserved exon 2 (acidic terminal segment [ATS] domain) were discarded. The three pipelines were run on the 32 malaria patient ex vivo samples from Wichers et al., 2021.
Figure 2—figure supplement 1

Performance of novel computational pipelines for var assembly on P. falciparum 3D7.
The three approaches (whole transcript: blue, domain approach: orange, original approach: green) were applied to a public RNA-sequencing dataset (European nucleotide archive [ENA]: PRJEB31535) of the intra-erythrocytic life cycle stages of three biological replicates of cultured P. falciparum 3D7, sampled at 8 hr intervals up until 40 hr post infection (hpi) and then at 4 hr intervals up until 48 hpi (Wichers et al., 2019). Boxplots show the data from the three biological replicates for each time point in the intra-erythrocytic life cycle: (a) alignment scores for the dominantly expressed var gene (PF3D7_0712600), (b) accuracy scores for the dominantly expressed var gene (PF3D7_0712600), (c) number of contigs required to assemble the dominant var gene (PF3D7_0712600), (d) alignment scores for a middle ranking expressed var gene (PF3D7_0937800), (e) alignment scores for the lowest expressed var gene (PF3D7_0200100). The first best blast hit (significance threshold = 1e-10) was chosen for each contig. The alignment score was used to evaluate the performance of each method. The alignment score represents ⎷accuracy* recovery. The accuracy is the proportion of bases that are correct in the assembled transcript and the recovery reflects what proportion of the true transcript was assembled. Assembly completeness of the dominant var gene (PF3D7_0712600, length = 6648 nt) for the three approaches was assessed for each biological replicate: (f) biological replicate 1, (g) biological replicate 2, (h) biological replicate 3. Dotted lines represent the start and end of the contigs required to assemble the var gene. Red bars represent assembled sequences relative to the dominantly expressed whole var gene sequence, where we know the true sequence (termed ‘reference transcript’).
Figure 2—figure supplement 2
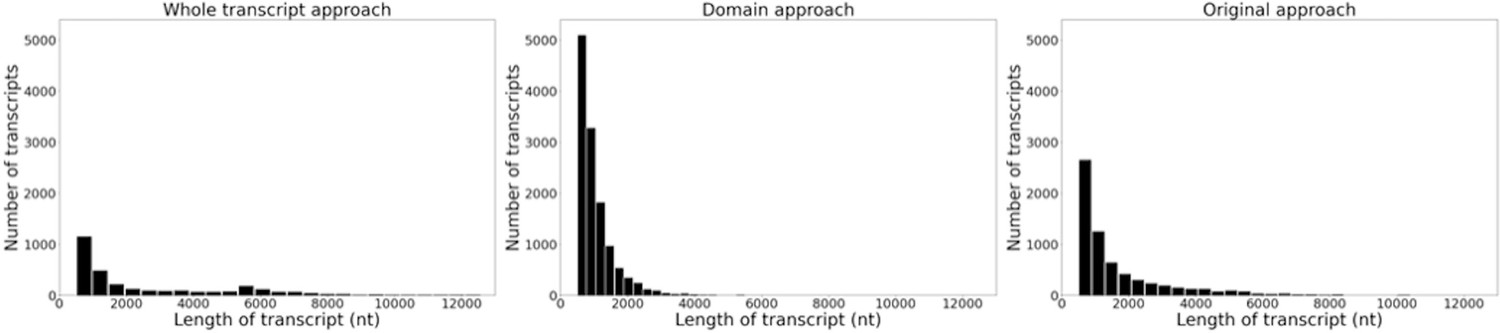
Histograms of the length and frequency of var transcripts produced by the different var assembly approaches.
Approaches were applied to ex vivo samples (n=32) from Wichers et al., 2021. Assembled var transcripts <500 nt and not containing a significantly annotated var domain were removed.
Figure 2—figure supplement 3
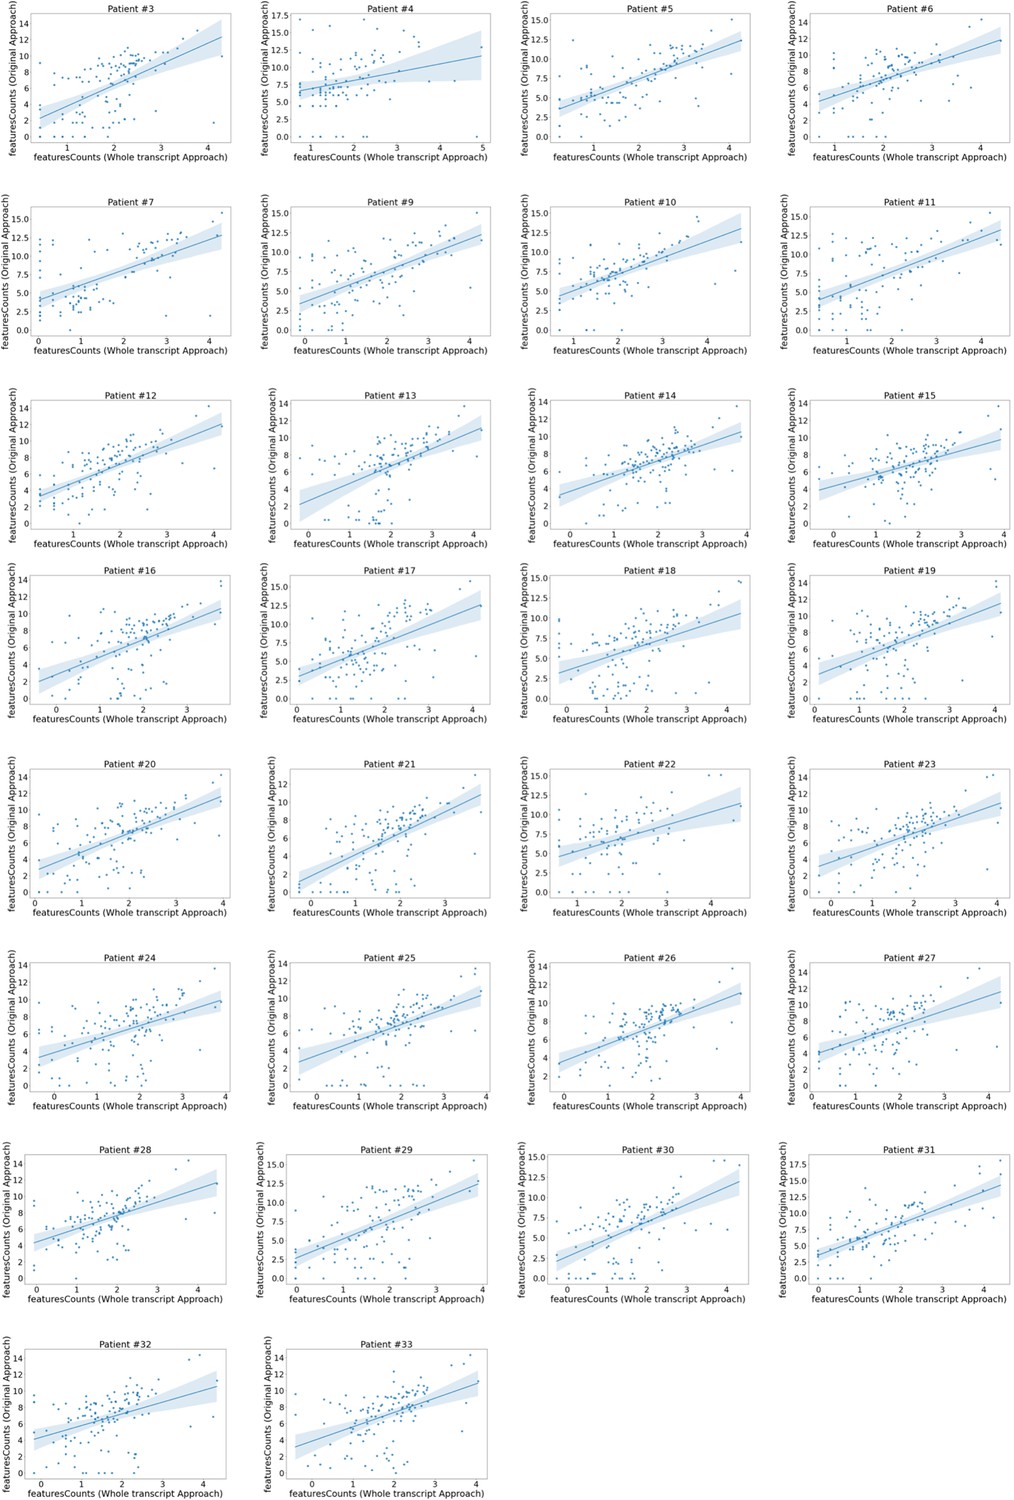
Domain expression correlation between the whole transcript approach and the original approach.
Correlation plots of the original approach var domain counts vs those produced by the whole transcript approach. Each plot represents a patient. Domain counts were determined using featureCounts in both approaches and counts for each domain aggregated. Plots show log2 transformed normalised counts. The line represents a linear regression model fit.
Figure 2—figure supplement 4
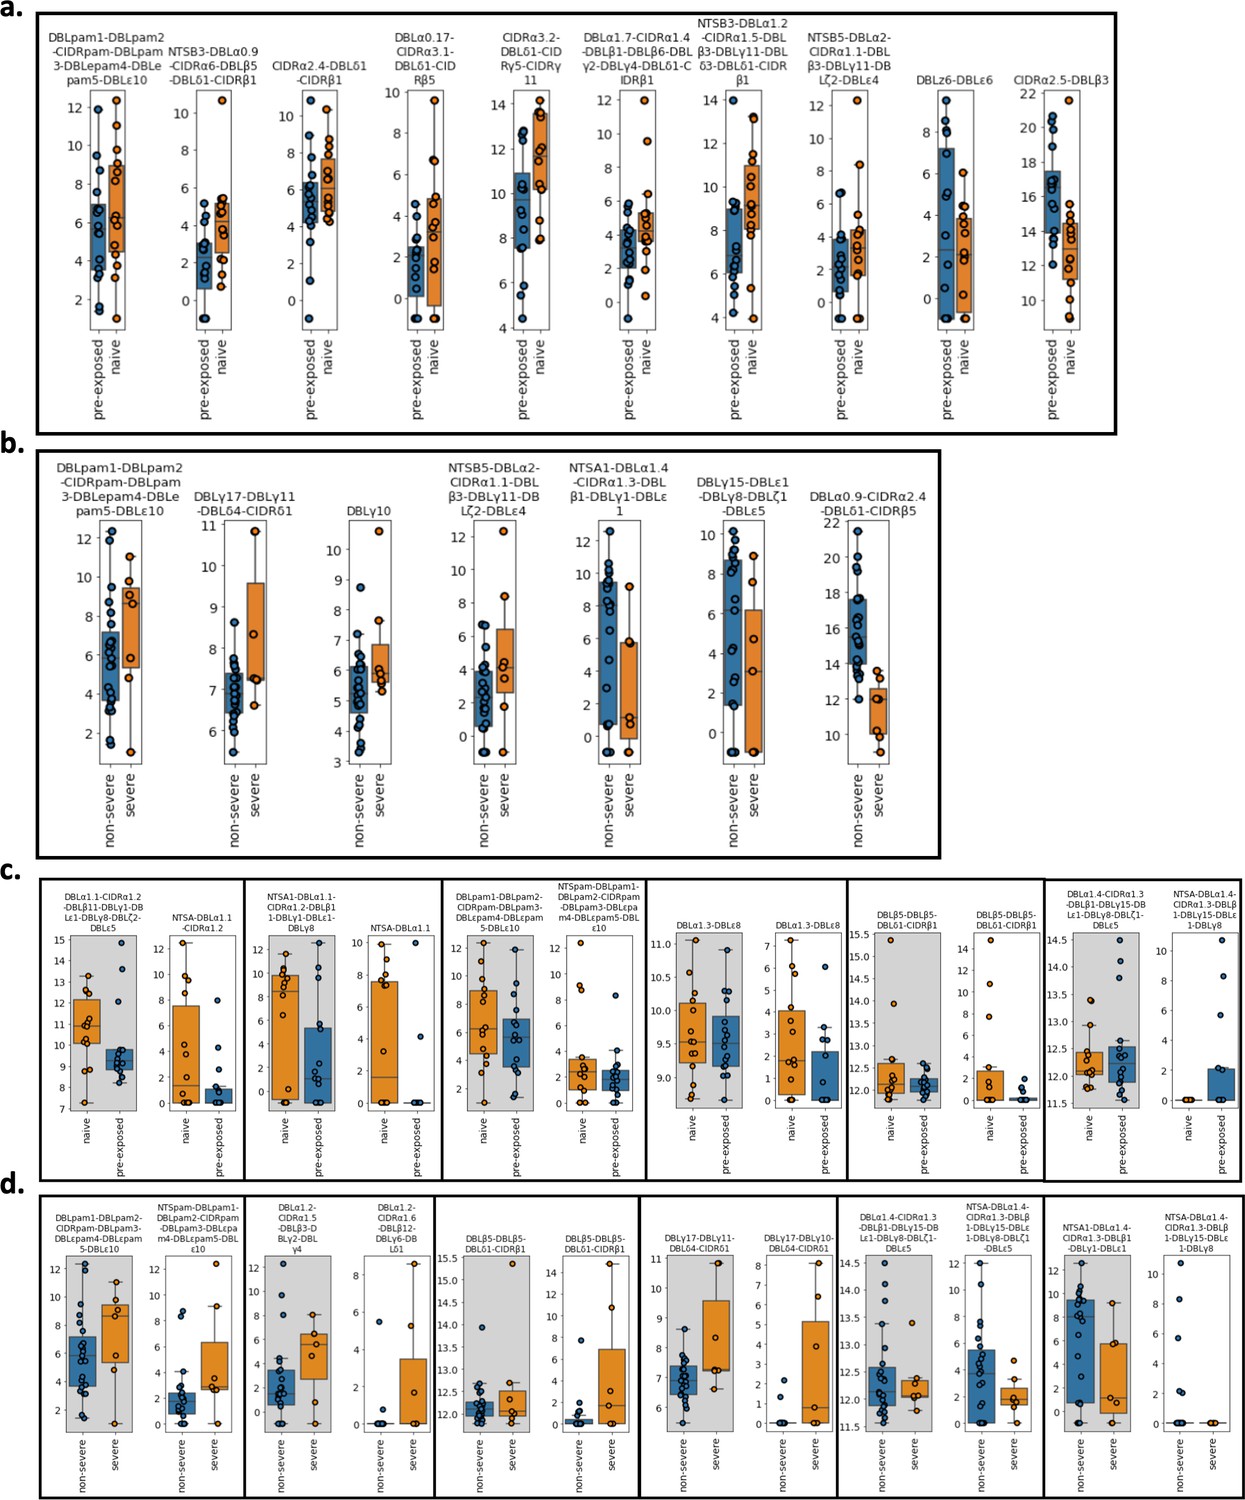
Var transcript expression differences derived from the whole transcript approach between (a) pre-exposed (n=17) (blue) vs naïve (n=15) (orange) cases and (b) severe (n=8) (orange) vs non-severe (n=24) (blue) cases.
Boxplots show log2 normalised Salmon counts adjusted for life cycle stage (derived from the mixture model approach). Comparison of var transcript expression differences found in the original approach with those assembled using the whole transcript approach. These transcripts were found to be significantly differentially expressed in the (c) pre-exposed (n=17) (blue) vs naïve (n=15) (orange) cases and (d) severe (n=8) (orange) vs non-severe (n=24) (blue) cases in the original analysis. Each box represents a comparison of the transcript assembled using the whole transcript approach (grey background) vs using the original approach (white background). Boxplots show log2 Salmon normalised counts. RNA-sequencing reads of each patient sample were matched to de novo assembled var contigs with varying lengths and domains using the whole transcript approach. Shown are significantly differently expressed var transcripts. Differential expression analysis was performed using DESeq2.
Figure 3 with 2 supplements
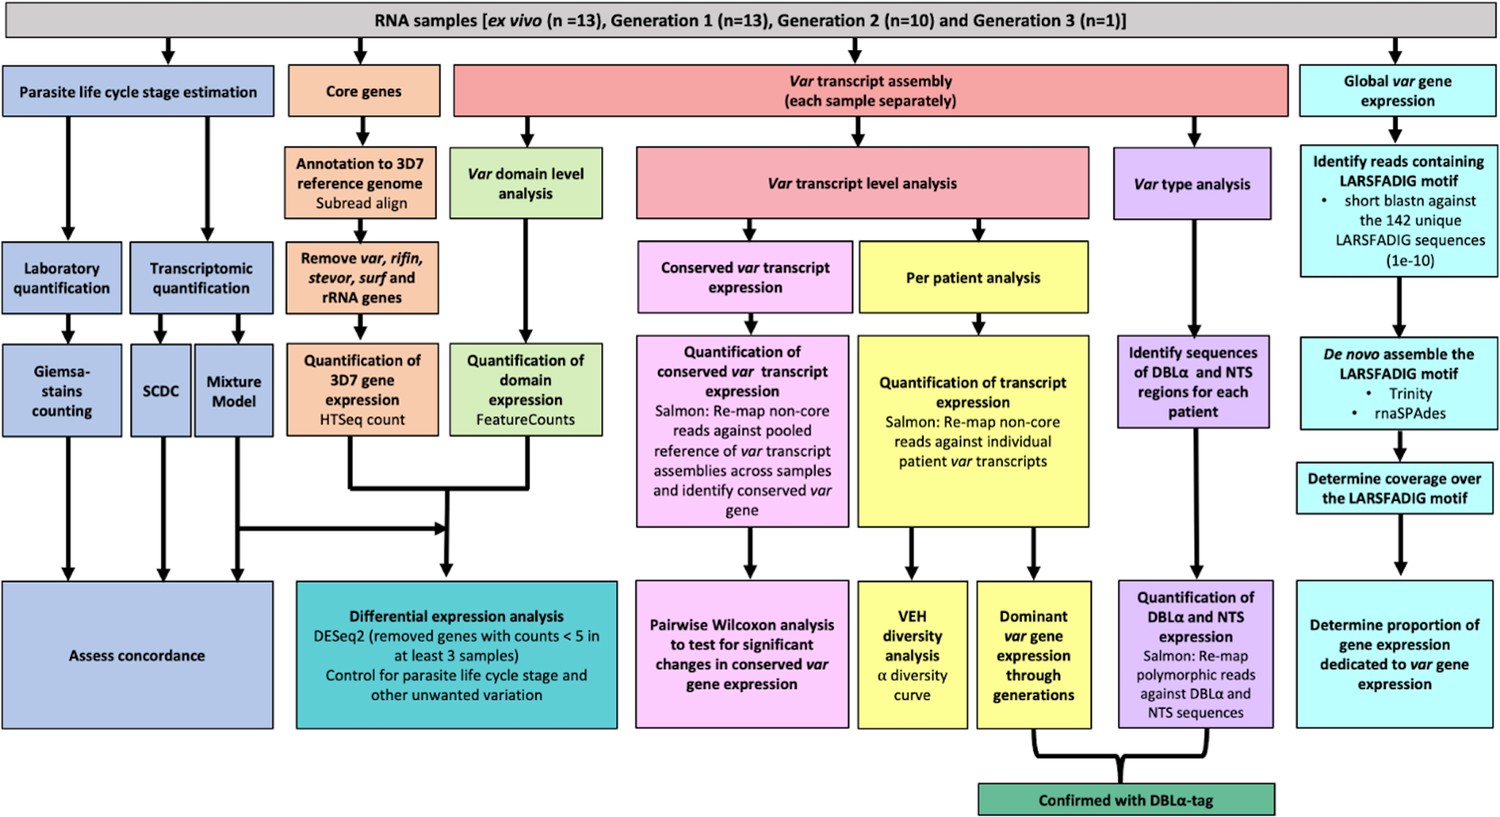
Summary of analyses of var and core gene transcriptome changes in paired ex vivo and short-term in vitro cultured parasites.
From a total of 13 parasite isolates, the ex vivo samples (Wichers et al., 2021) and the corresponding in vitro cultured parasites of the first (n=13), second (n=10), and third (n=1) replication cycle were analysed by RNA-sequencing. The expression of non-polymorphic core genes and polymorphic var genes was determined in different analysis streams: (1) non-polymorphic core gene reads were mapped to the 3D7 reference genome, expression was quantified using HTSeq and differential expression analysis performed (orange); (2) non-core reads were identified, whole transcripts were assembled with rnaSPAdes, expression of both var transcripts (red) and domains (light green) was quantified, and var domain differential expression analysis was performed. ‘Per patient analysis’ (yellow) represents combining all assembled var transcripts for samples originating from the same ex vivo sample only. For each conserved var gene (var1-3D7, var1-IT, var2csa, and var3), all significantly assembled conserved var transcripts were identified and put into a combined reference (pink). The normalised counts for each conserved gene were summed. Non-core reads were mapped to this and DESeq2 normalisation performed. Var type (group A vs groups B and C) expression (purple) was quantified using the Duffy binding-like domain of class α (DBLα) and N-terminal segment (NTS) assembled sequences and differences across generations were assessed. Total var gene expression (turquoise) was quantified by assembling and quantifying the coverage over the highly conserved LARSFADIG motif, with the performance of assembly using Trinity and rnaSPAdes assessed. DBLα-tag data was used to confirm the results of the dominant var gene expression analysis and the var type analysis (dark green). Var expression homogeneity (VEH) was analysed at the patient level (α diversity curves). All differential expression analyses were performed using DESeq2.To ensure a fair comparison of samples, which may contain different proportions of life cycle stages, the performance of two different in silico approaches was evaluated by counting Giemsa-stained thin blood smears (blue).
Figure 3—figure supplement 1
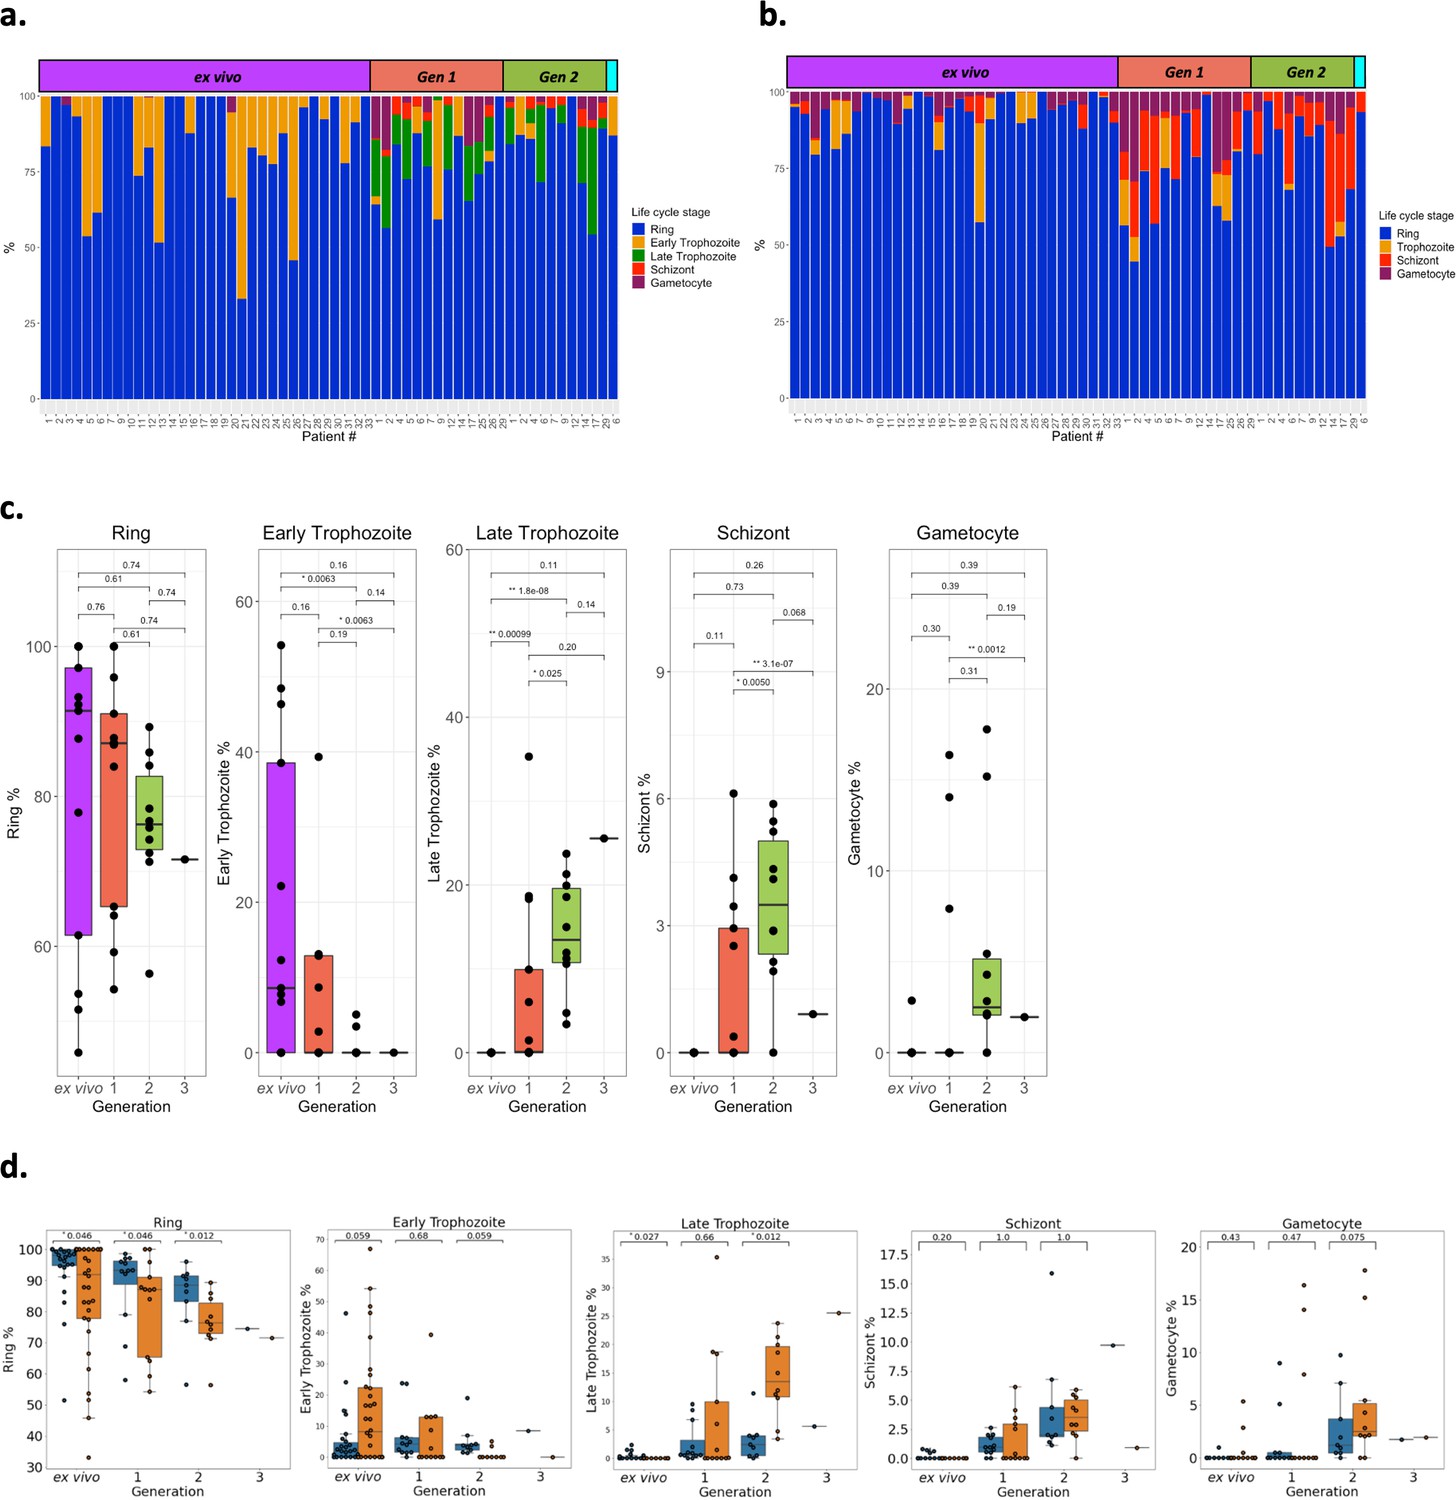
Parasite life cycle stage estimates across the generations.
Life cycle stage percentages were estimated using two approaches. (a) The first, termed the mixture model approach, was the same as used in the original analysis with 8, 19, 30, and 42 hr post infection corresponding to ring (blue), early trophozoite (orange), late trophozoite (green), schizont (red), and gametocyte (purple) stages, respectively. (b) The second approach, termed single-cell differential composition analysis (SCDC), used SCDC, a deconvolution tool, that uses single cell reference transcriptomes of known life cycle stages, ring (blue), trophozoite (orange), schizont (red), and gametocyte (purple). The Malaria Cell Atlas for Plasmodium berghei was used as the reference transcriptome due to it containing gametocyte single cells. Only P. berghei genes that had 1:1 orthologs with P. falciparum 3D7 were used. Samples are ordered by generation: ex vivo; yellow, generation 1; pink, generation 2; blue, generation 3; green. In panels a and b life cycle stage proportions are shown for all ex vivo samples (n=32), paired generation 1 samples (n=13), paired generation 2 samples (n=10), and a paired generation 3 figure shows life cycle stage proportions for all ex vivo samples (n=32), paired generation 1 samples (n=13), paired generation 2 samples (n=10), and a paired generation 3 sample (n=1). (c) Significant differences in the parasite life cycle stage estimates (derived from the mixture model approach) for the paired ex vivo (n=13), generation 1 (n=13), generation 2 (n=10), and generation 3 (n=1) samples were tested using paired Wilcoxon tests (for the ring-stage comparison) and a modified Wilcoxon on rank test for zero-inflated data on the other life cycle stages. The numbers above the boxplots represent significant adjusted p-values observed (Benjamini-Hochberg adjusted). (d) Concordance of life cycle stage estimations using the mixture model approach and counting Giemsa-stained thin blood smears. Giemsa-stained thin blood smears counting was performed by two independent researchers. Orange boxplots represent percentages determined using the mixture model approach and blue boxplots represent percentages determined using Giemsa-stained thin blood smears. Data shown represents the ex vivo (n=11) samples and the paired in vitro generations (generation 1; n=12, generation 2; n=9, and generation 3; n=1). Numbers above the boxplots represent adjusted p-values (Benjamini-Hochberg adjusted) from a pairwise Wilcoxon test. The same classification as the mixture model approach was used for the Giemsa-stained thin blood smears counting (8, 19, 30, and 42 hr post infection corresponding to ring, early trophozoite, late trophozoite, and schizont stages, respectively).
Figure 3—figure supplement 2
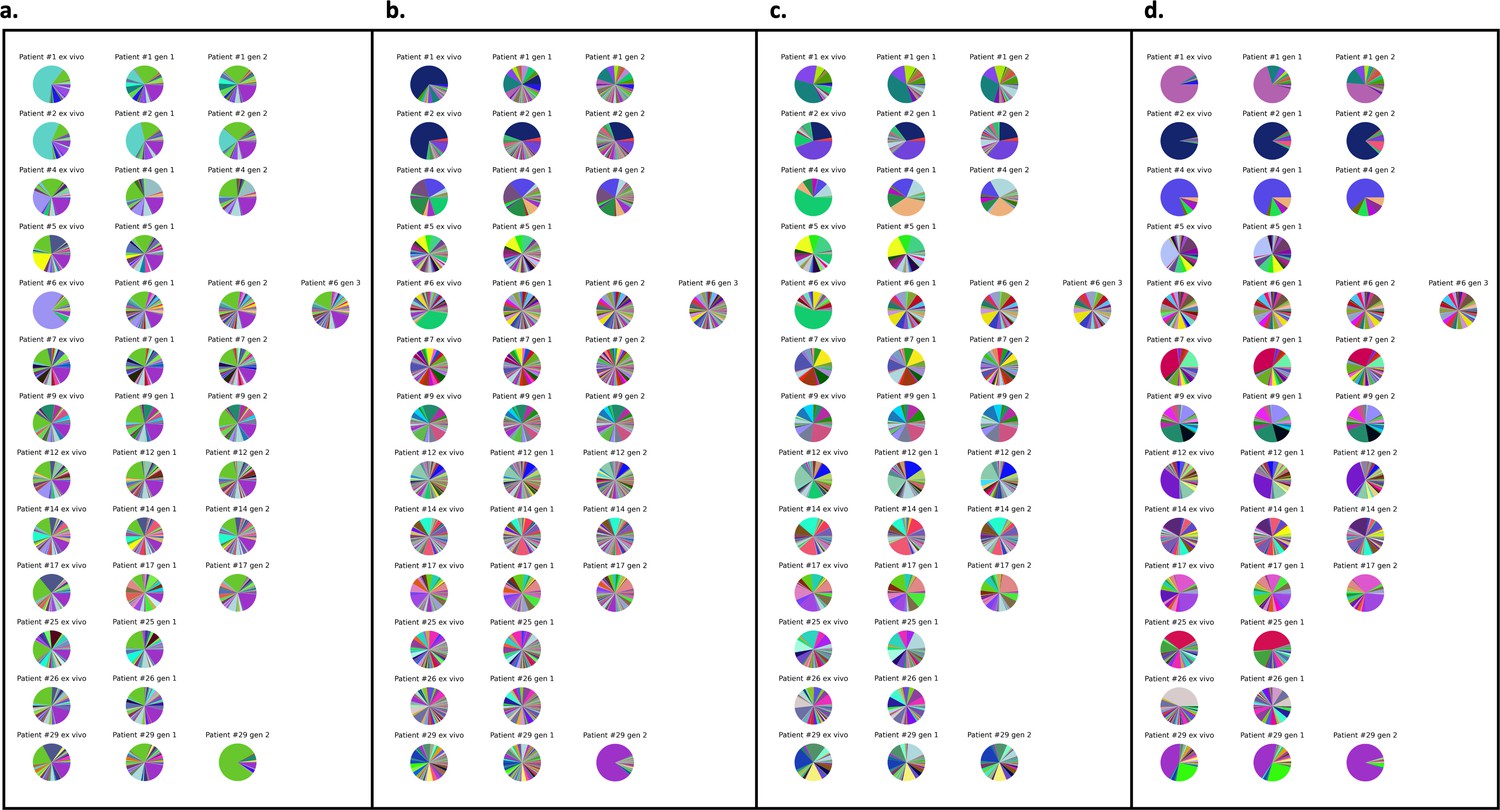
Var expression profiles across different mapping approaches.
Different mapping approaches were used to quantify the var expression profiles of each sample (ex vivo) (n=13), generation 1 (n=13), generation 2 (n=10), and generation 3 (n=1). The pooled sample approach in which all significantly assembled var transcripts (1500 nt and containing three significantly annotated var domains) across samples were combined into a reference and redundancy was removed using cd-hit (at sequence identity = 99%) (a–c). The non-core reads of each sample were mapped to this pooled reference using (a) Salmon, (b) bowtie2 filtering for uniquely mapping paired reads with MAPQ > 0, and (c) bowtie2 filtering for uniquely mapping paired reads with an MAPQ > 20. (d) The per patient approach was applied. For each patient, the paired ex vivo and in vitro samples were analysed. The assembled var transcripts (at least 1500 nt and containing three significantly annotated var domains) across all the generations for a patient were combined into a reference, redundancy was removed using cd-hit (at sequence identity = 99%), and expression was quantified using Salmon. Pie charts show the var expression profile with the relative size of each slice representing the relative percentage of total var gene expression of each var transcript. Different colours represent different assembled var transcripts with the same colour code used across (a–d).
Figure 4 with 3 supplements
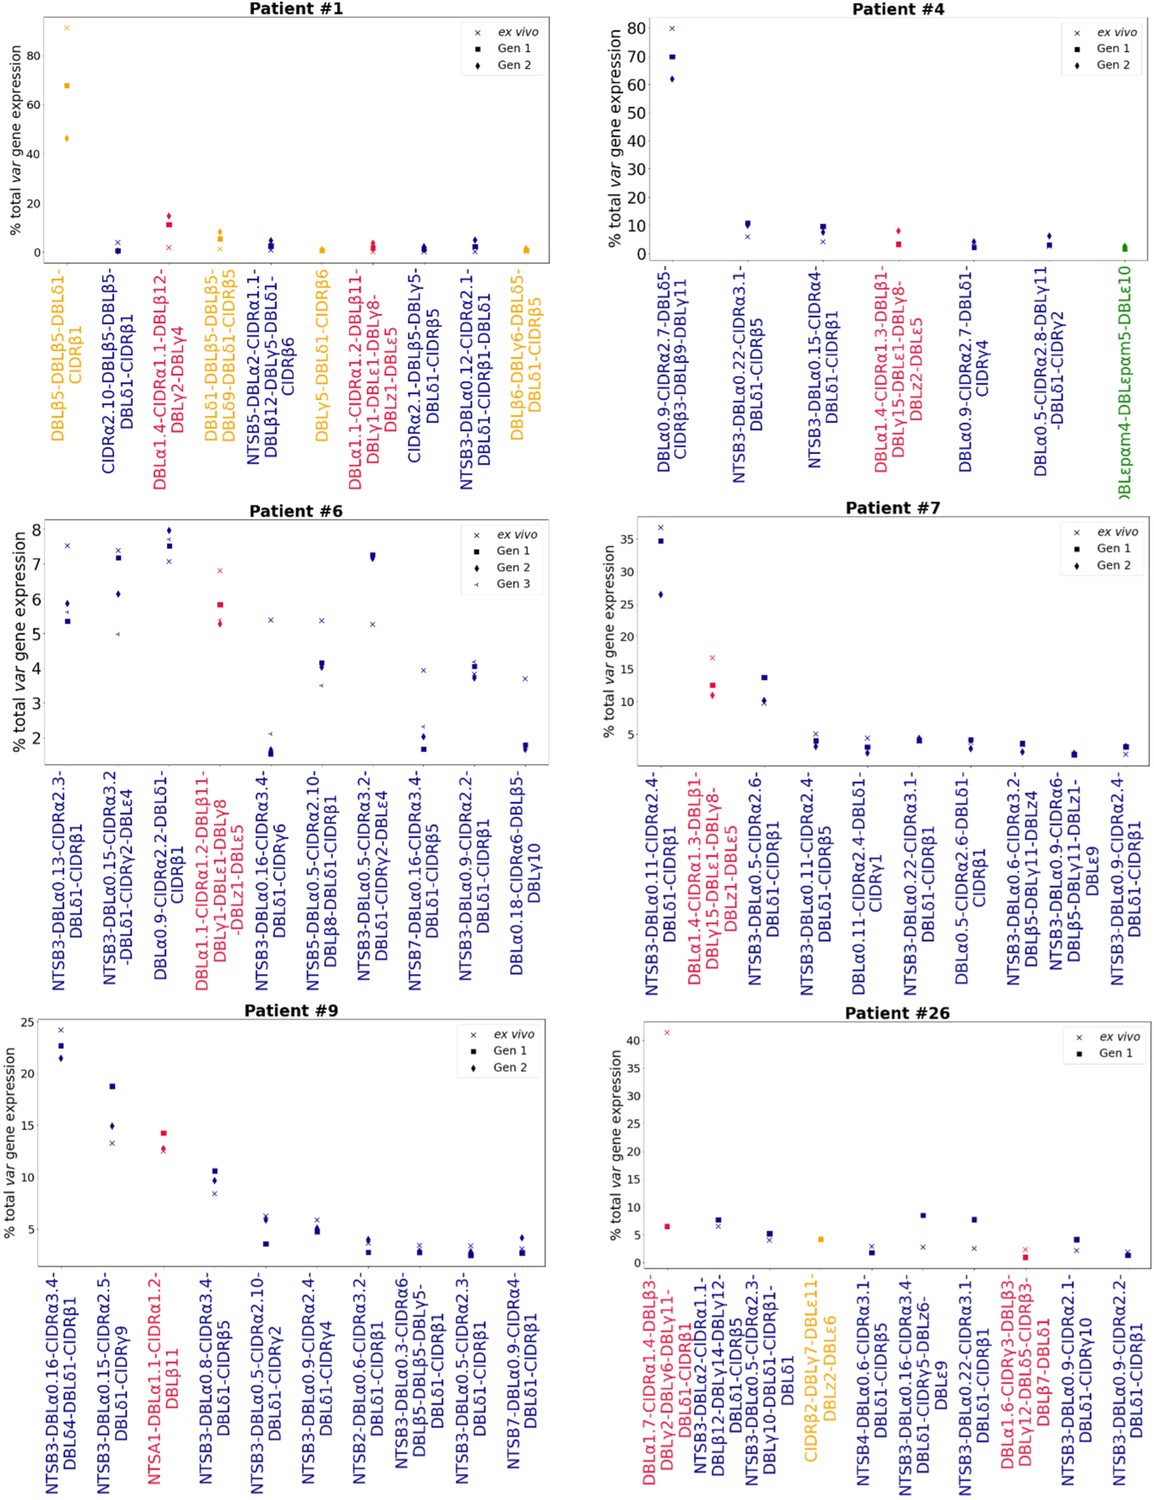
Rank var gene expression analysis.
For each patient, the paired ex vivo (n=13) and in vitro samples (generation 1: n=13, generation 2: n=10, generation 3: n=1) were analysed. The assembled var transcripts with at least 1500 nt and containing three significantly annotated var domains across all the generations for a patient were combined into a reference, redundancy was removed using cd-hit (at sequence identity = 99%), and expression was quantified using Salmon. Var transcript expression was ranked. Plots show the top 10 var gene expression rankings for each patient and their ex vivo and short-term in vitro cultured parasite samples. Group A var transcripts (red), group B or C var transcripts (blue), group E var transcripts (green), and transcripts of unknown var group (orange).
Figure 4—figure supplement 1
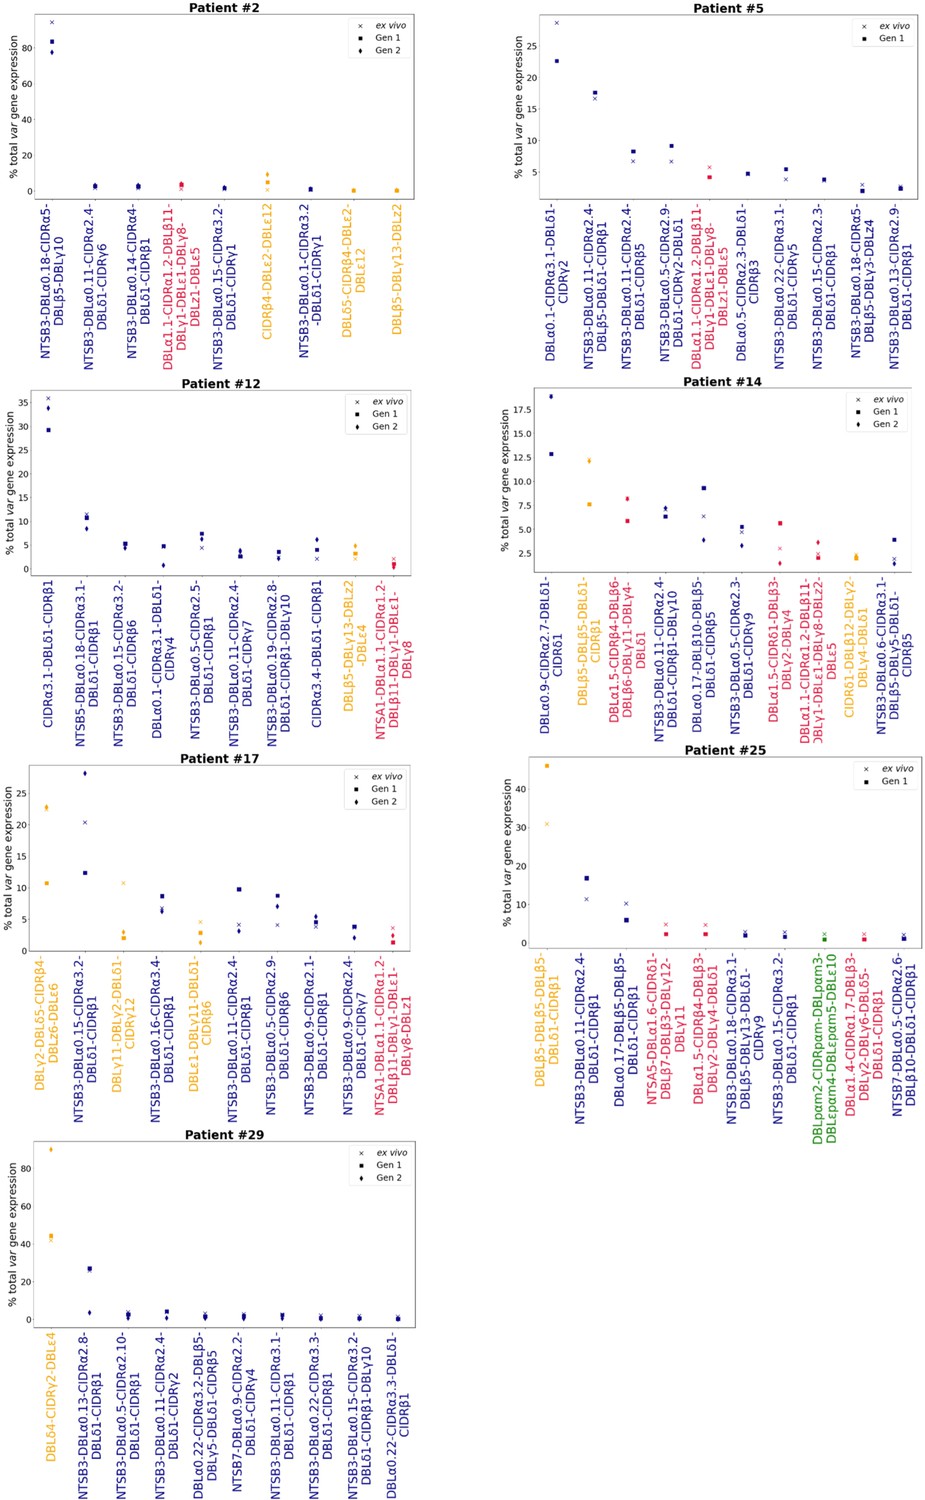
Rank var gene expression analysis.
For each patient, the paired ex vivo (n=13) and in vitro samples (generation 1: n=13, generation 2: n=10, generation 3: n=1) were analysed. The assembled var transcripts with at least 1500 nt and containing three significantly annotated var domains across all the generations for a patient were combined into a reference, redundancy was removed using cd-hit (at sequence identity = 99%), and expression was quantified using Salmon. Var transcript expression was ranked. Plots show the top 10 var gene expression rankings for each patient and their ex vivo and short-term in vitro cultured parasite samples. Group B/C var transcript (blue), group A var transcript (red), group E var transcript (green), and unknown (orange).
Figure 4—figure supplement 2
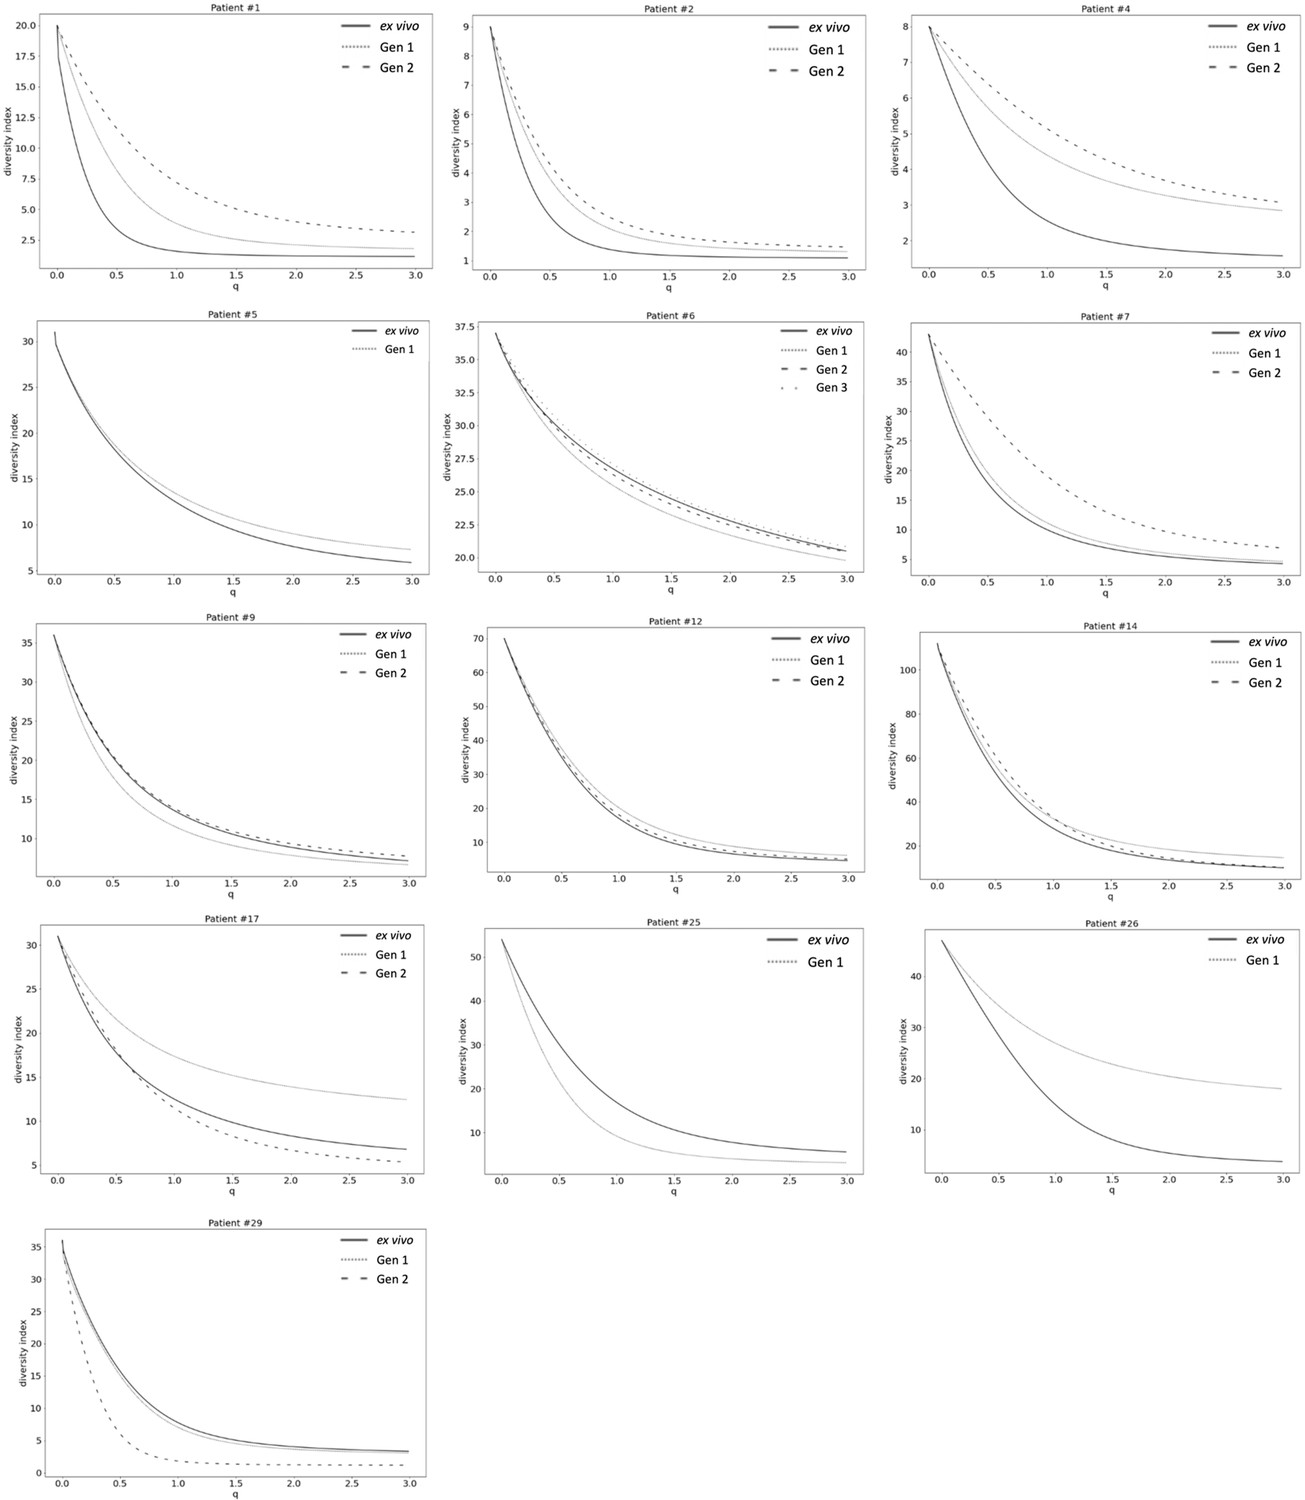
Var expression homogeneity (VEH).
α diversity curves were determined on a per patient basis using Equation 1. D is calculated for q in the range 0–3 with a step increase of 0.1 and p in this analysis represented the proportion of var gene expression dedicated to var transcript k. q determined how much weight is given to rare vs abundant var transcripts. The smaller the q value, the less weight was given to the more abundant var transcript.
Figure 4—figure supplement 3
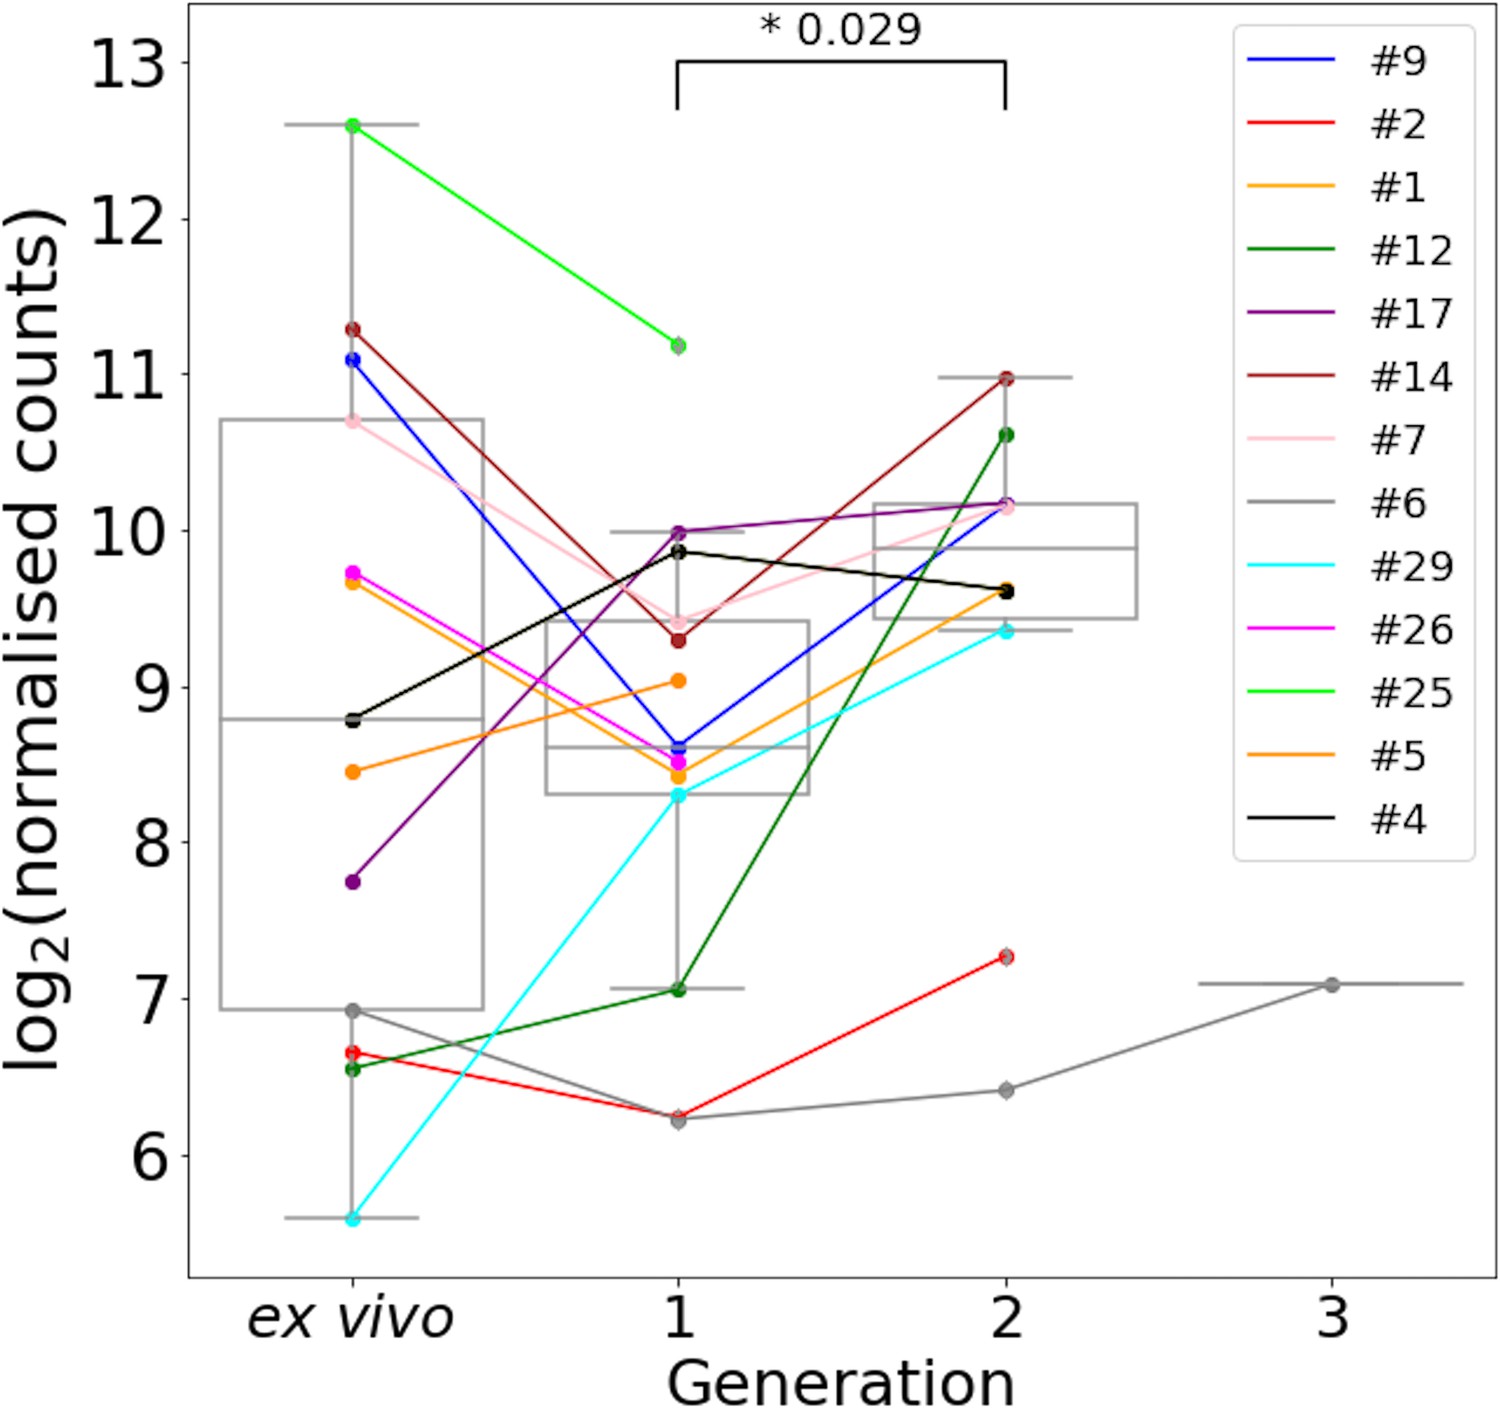
Var2csa expression through short-term in vitro cultivation.
All significantly annotated var2csa transcripts had their log2 Salmon normalised count summed. Significant differences in expression levels between generations were assessed using a paired Wilcoxon test and adjusted using the Benjamini-Hochberg method. Numbers above the boxplots represent significant differences observed (FDR ≤ 0.05). Coloured lines connect paired patient samples through the generations [ex vivo (n=13) and in vitro samples (generation 1: n=13, generation 2: n=10, generation 3: n=1)].
Figure 5
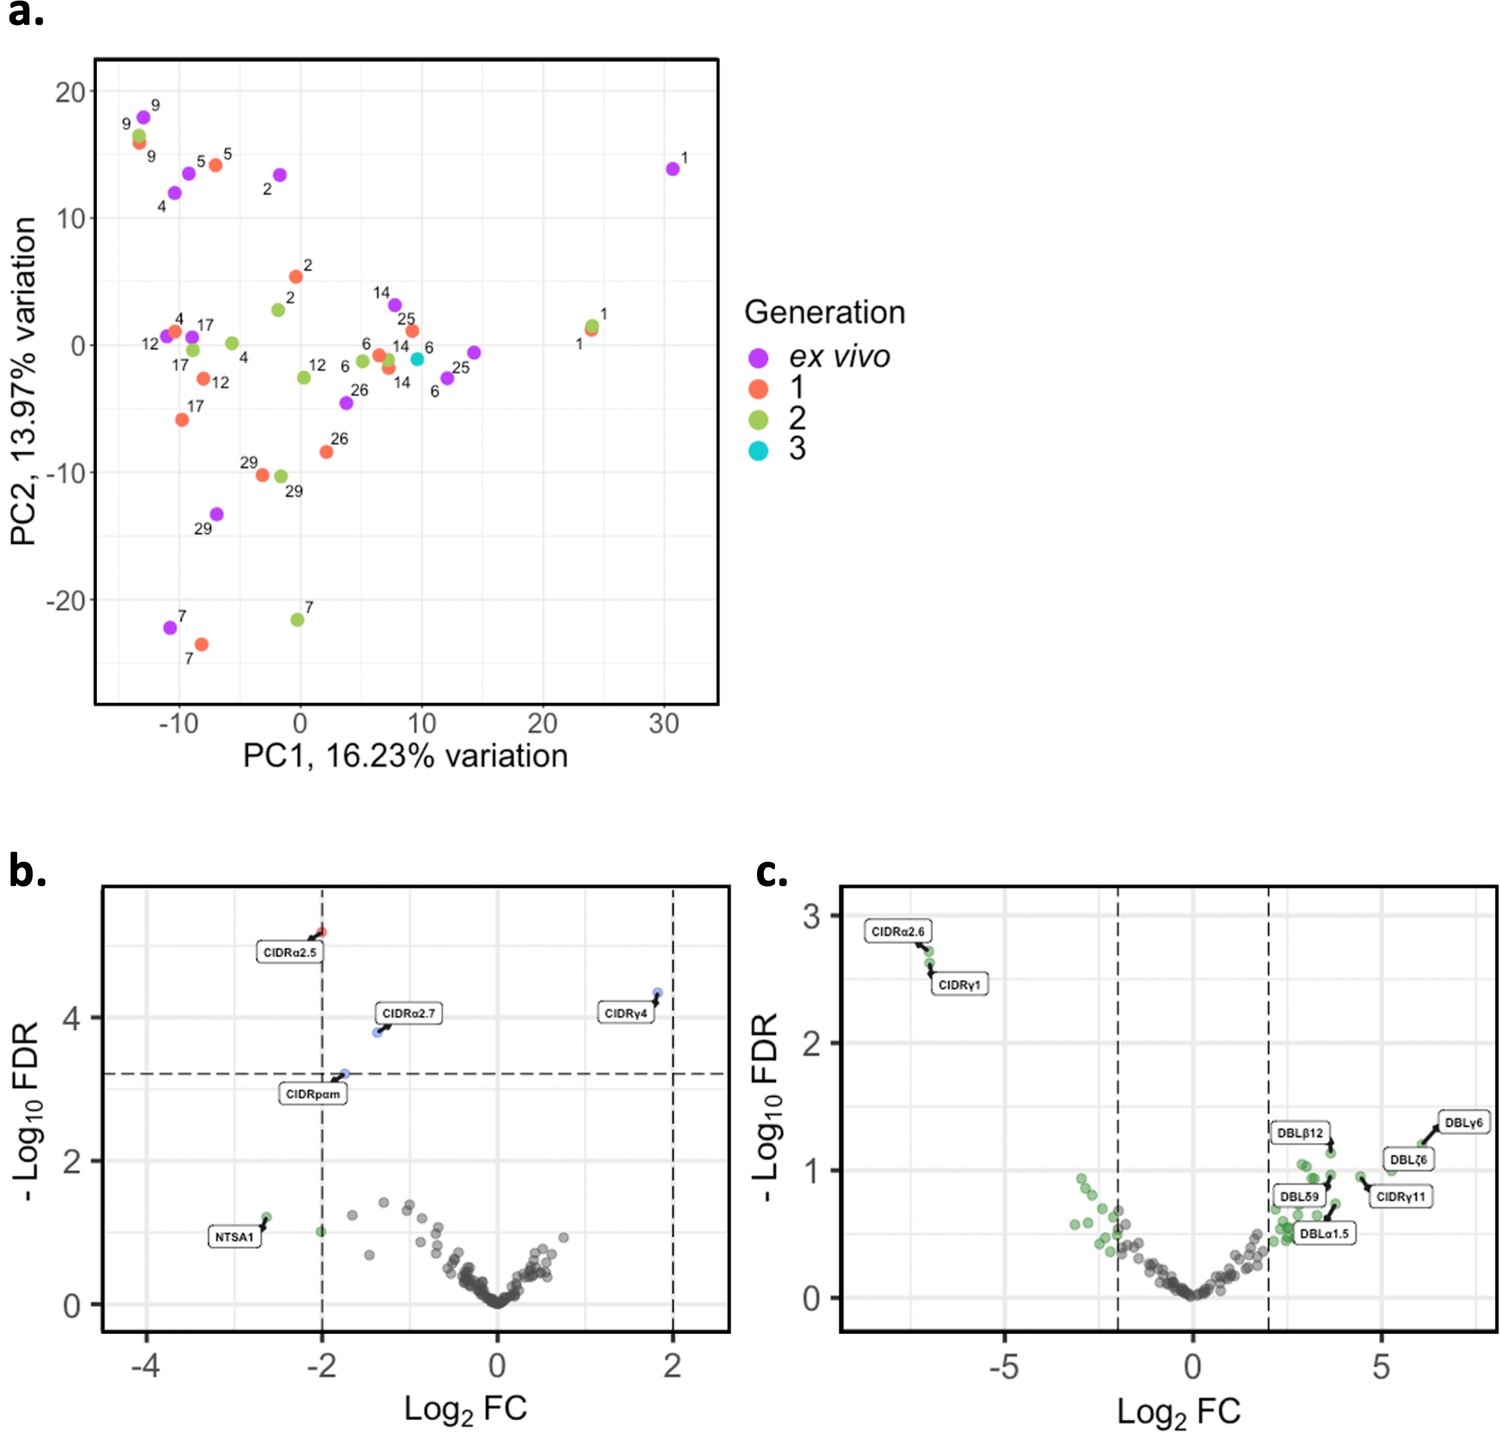
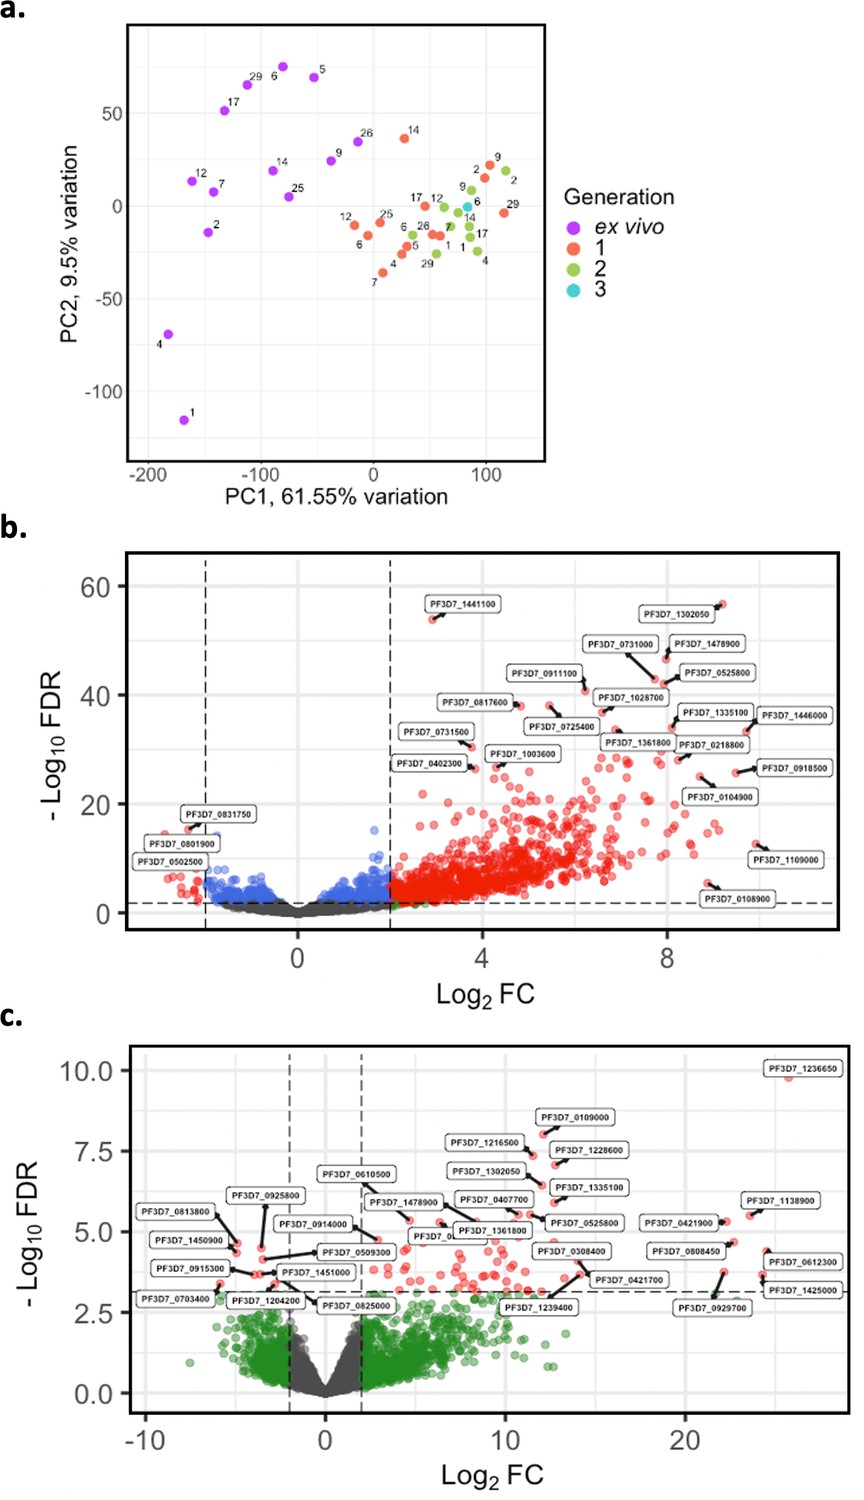
Var domain transcriptome analysis through short-term in vitro culture.
Var transcripts for paired ex vivo (n=13), generation 1 (n=13), generation 2 (n=10), and generation 3 (n=1) were de novo assembled using the whole transcript approach. Var transcripts were filtered for those ≥ 1500 nt in length and containing at least three significantly annotated var domains. Transcripts were annotated using hidden Markov models (HMM) built on the Rask et al., 2010, dataset (Rask et al., 2010). When annotating the whole transcript, the most significant alignment was taken as the best annotation for each region of the assembled transcript (e-value cut-off 1e-5). Multiple annotations were allowed on the transcript if they were not overlapping, determined using cath-resolve-hits. Var domain expression was quantified using FeatureCounts and the domain counts aggregated. (a) PCA plot of log2 normalised read counts (adjusted for life cycle stage, derived from the mixture model approach). Points are coloured by their generation (ex vivo, purple; generation 1, red; generation 2, green; and generation 3, blue) and labelled by their patient identity. (b) Volcano plot showing extent and significance of up- or downregulation of var domain expression in ex vivo (n=13) compared with paired generation 1 cultured parasites (n=13) (red and blue, p<0.05 after Benjamini-Hochberg adjustment for FDR; red and green, absolute log2 fold change [log2FC] in expression ≥ 2). Domains with a log2FC ≥ 2 represent those upregulated in generation 1 parasites. Domains with a log2FC ≤ –2 represent those downregulated in generation 1 parasites. (c) Volcano plot showing extent and significance of up- or downregulation of var domain expression in ex vivo (n=10) compared with paired generation 2 cultured parasites (n=10) (green, absolute log2 fold change [log2FC] in expression ≥ 2). Domains with a log2FC ≥ 2 represent those upregulated in generation 2 parasites. Domains with a log2FC ≤ –2 represent those downregulated in generation 2 parasites. Differential expression analysis was performed using DESeq2 (adjusted for life cycle stage, derived from the mixture model approach).
Figure 6 with 2 supplements
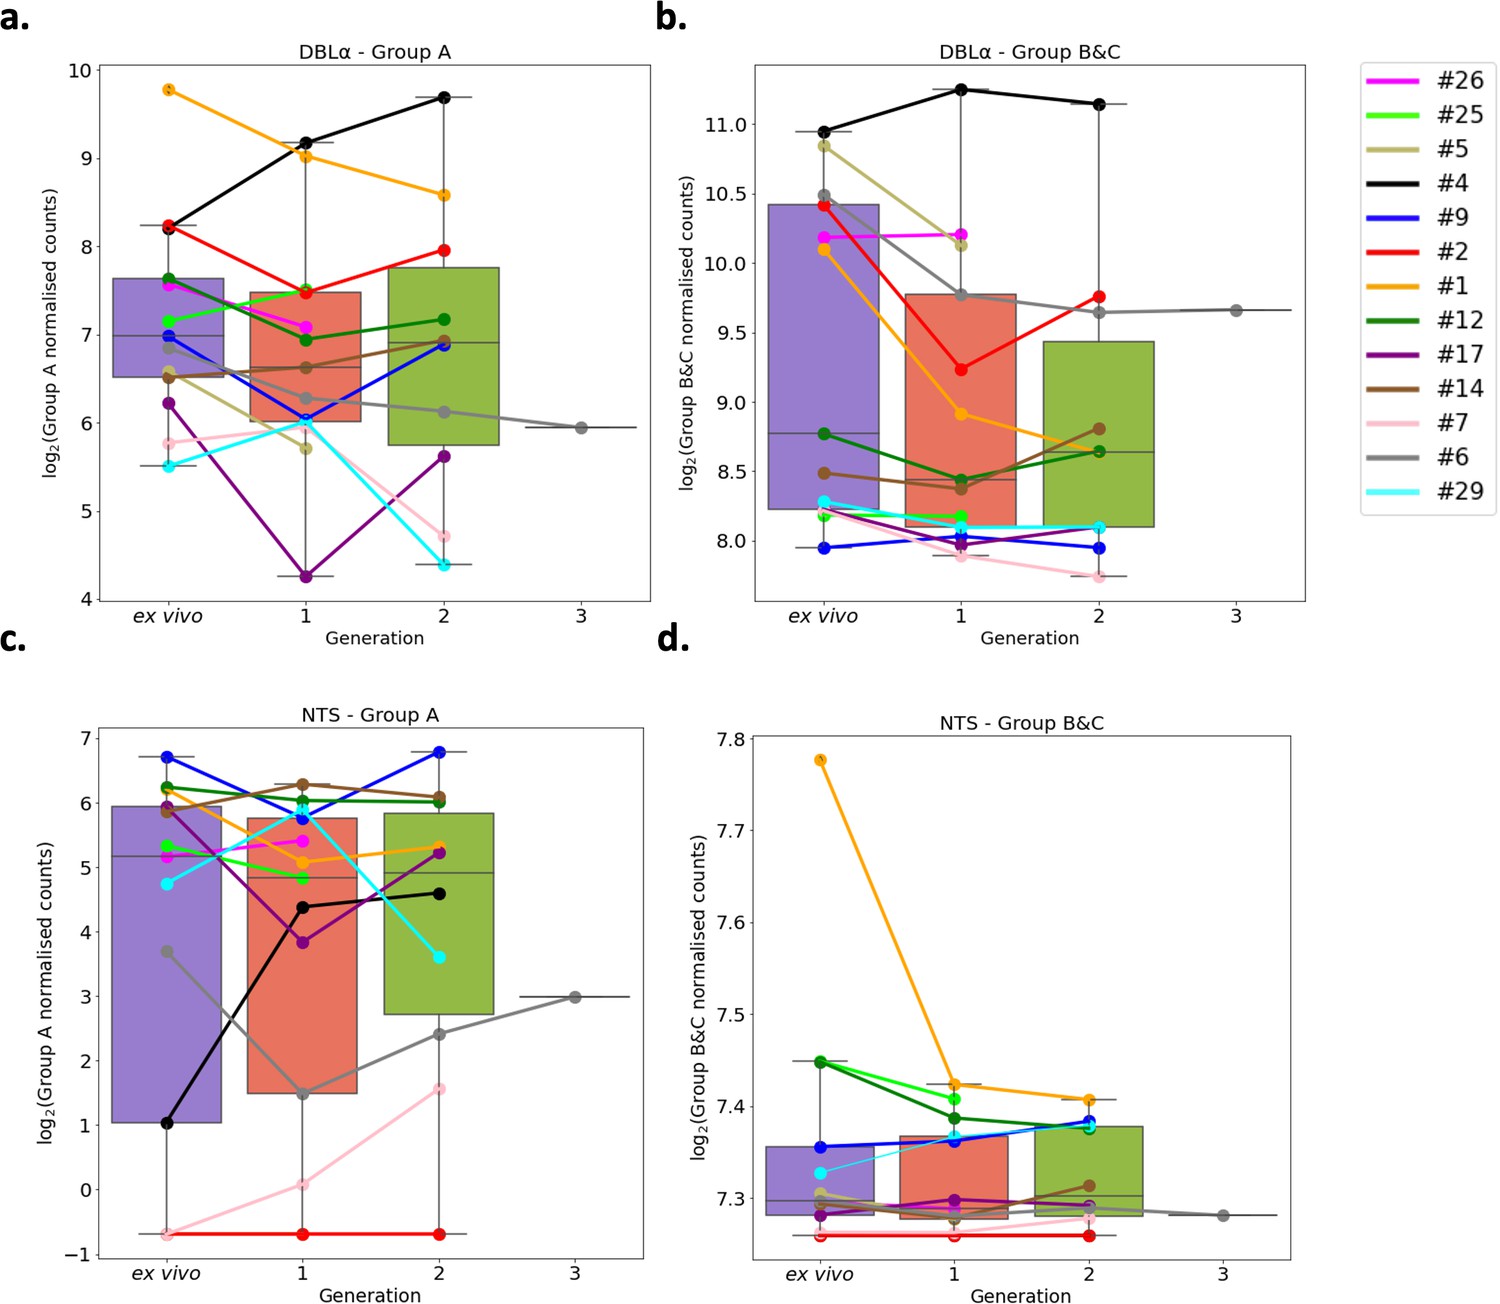
Var group expression analysis through short-term in vitro culture.
The Duffy binding-like domain of class α (DBLα) domain sequence for each transcript was determined and for each patient a reference of all assembled DBLα domains combined. Group A var genes possess DBLα1 domains, some group B encode DBLα2 domains, and groups B and C encode DBLα0 domains. Domains were grouped by type and their expression summed. The relevant sample’s non-core reads were mapped to this using Salmon and DBLα expression quantified. DESeq2 normalisation was performed, with patient identity and life cycle stage proportions included as covariates. A similar approach was repeated for N-terminal segment (NTS) domains. Group A var genes encode NTSA compared to group B and C var genes which encode NTSB. Boxplots show log2 normalised Salmon read counts for (a) group A var gene expression through cultured generations assessed using the DBLα domain sequences, (b) group B and C var gene expression through cultured generations assessed using the DBLα domain sequences, (c) group A var gene expression through cultured generations assessed using the NTS domain sequences, and (d) group B and C var gene expression through cultured generations assessed using the NTS domain sequences. Different coloured lines connect paired patient samples through the generations: ex vivo (n=13), generation 1 (n=13), generation 2 (n=10), and generation 3 (n=1). Axis shows different scaling.
Figure 6—figure supplement 1
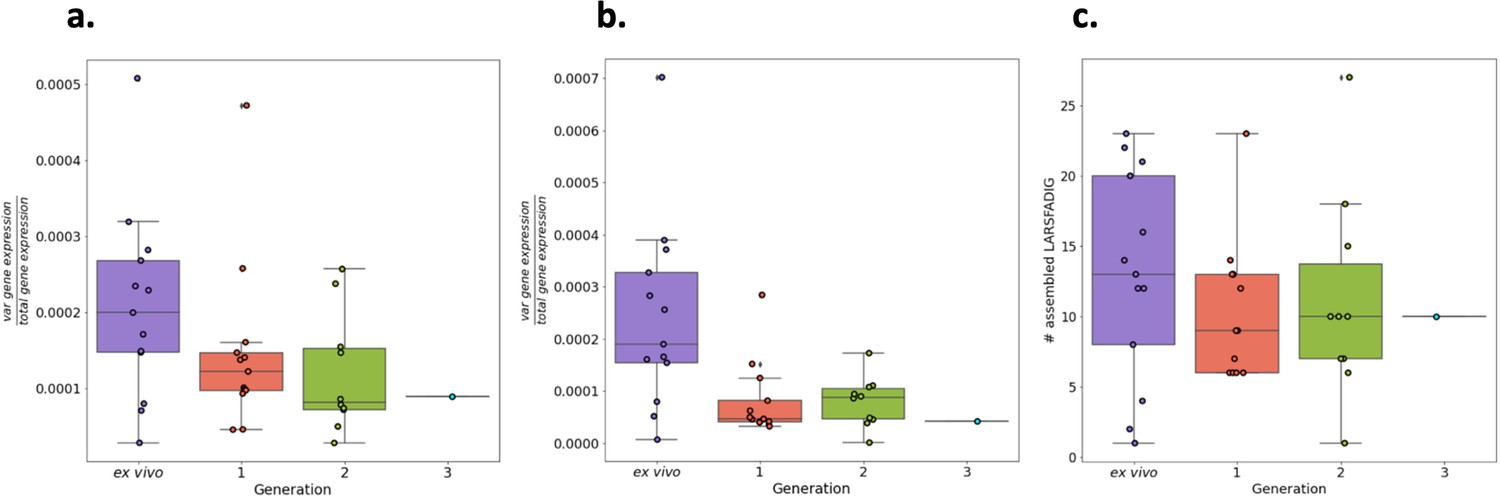
Total var gene expression through short-term in vitro culture.
Boxplots show data from paired ex vivo (n=13), generation 1 (n=13), generation 2 (n=10), and generation 3 (n=1) parasite samples. The RNA-sequencing reads were blastn (with the short-blastn option on and significance = 1e-10) against the LARSFADIG nucleotide sequences (142 unique LARSFADIG sequences) to identify reads containing the LARSFADIG motifs. Once the reads containing the LARSFADIG motifs had been identified, they were used to assemble the LARSFADIG motif. rnaSPAdes and Trinity were used to assemble the LARSFADIG motif. The sequencing reads were mapped back against the assemblies using bwa mem, and coverage over the middle of the motif (S) determined. These values were divided by the number of reads mapped to the var exon 1 database and the 3D7 genome (which had var genes removed) to represent the proportion of total gene expression dedicated to var gene expression (similar to an RPKM). % total gene expression dedicated to var gene expression quantified using LARSFADIG motifs assembled (a) by Trinity, (b) by rnaSPAdes, or (c) by # assembled LARSFADIG motifs, using rnaSPAdes.
Figure 6—figure supplement 2
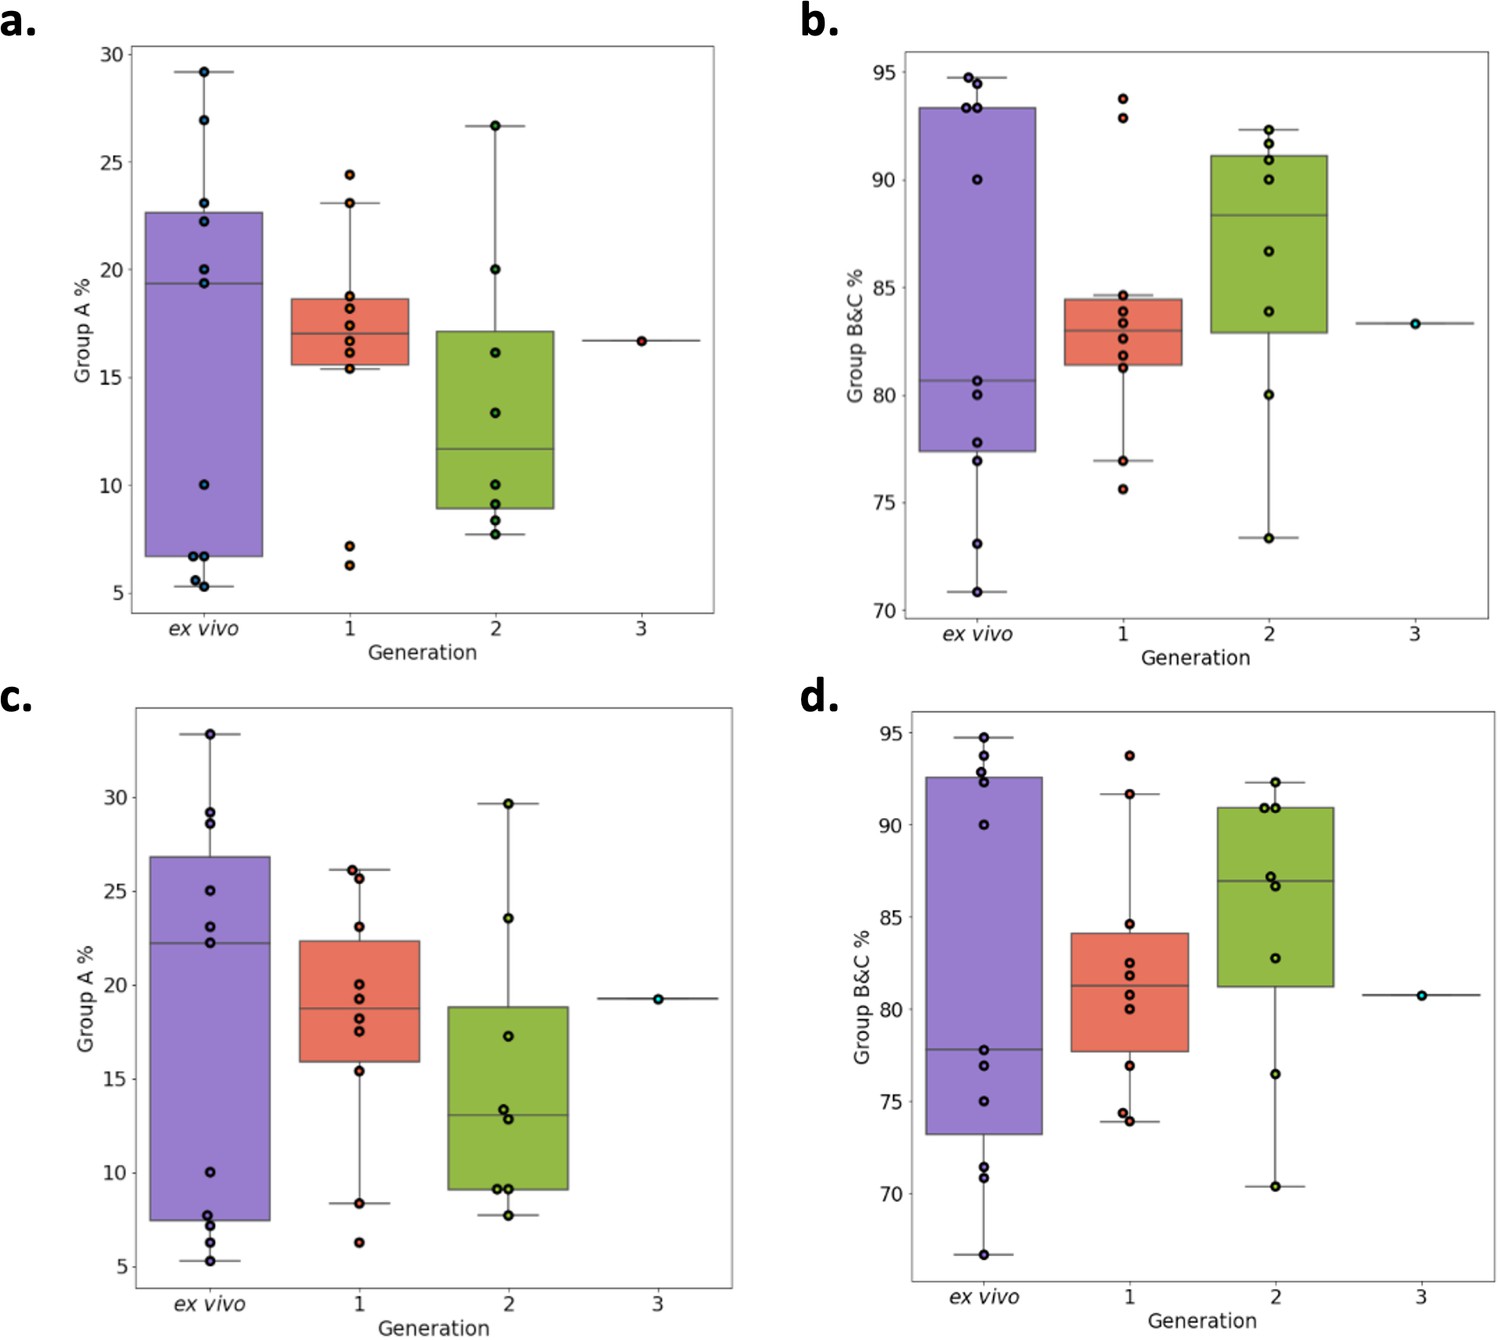
Verification of RNA-sequencing results using Duffy binding-like domain of class α (DBLα)-tag sequencing.
Amplified DBLα-tag sequences [ex vivo (n=11), generation 1 (n=10), generation 2 (n=8) and generation 3 (n=1) ] were blasted against the ~2400 genomes on varDB to obtain subclassification into DBLα0/1/2 and prediction of adjacent head structure N-terminal segment and cysteine-rich interdomain region domains and their related binding phenotype. Proportion of each N-terminal segment (NTS) and DBLα subclass were calculated, and group A and group B and C expression proportions determined. Group A var genes encode NTSA and DBLα1 and groups B and C encode NTSB and DBLα0. Group B var genes encode DBLα2. (a) Group A transcript proportions determined by the DBLα1 domain. (b) Group B and C transcript proportions determined by DBLα0 and DBLα2 domains. (c) Group A transcript proportions determined by the NTSA domain. (d) Group B and C transcript proportions determined by the NTSB domain.
Figure 7 with 3 supplements
Core gene transcriptome analysis of ex vivo and short-term in vitro cultured samples.
Core gene expression was assessed for paired ex vivo (n=13), generation 1 (n=13), generation 2 (n=10), and generation 3 (n=1) parasite samples. Subread align was used, as in the original analysis, to align the reads to the human genome and P. falciparum 3D7 genome, with var, rif, stevor, surf, and rRNA genes removed. HTSeq count was used to quantify gene counts. (a) PCA plot of log2 normalised read counts. Points are coloured by their generation (ex vivo: purple, generation 1: red, generation 2: green, and generation 3: blue) and labelled by their patient identity. (b) Volcano plot showing extent and significance of up- or downregulation of core gene expression in ex vivo (n=13) compared with paired generation 1 cultured parasites (n=13) and (c) in ex vivo (n=10) compared with paired generation 2 cultured parasites (n=10). Dots in red and blue represent those genes with p<0.05 after Benjamini-Hochberg adjustment for FDR, red and green dots label genes with absolute log2 fold change (log2FC) in expression ≥ 2. Accordingly, genes with a log2FC ≥ 2 represent those upregulated in generation 1 parasites and genes with a log2FC ≤ –2 represent those downregulated in generation 1 parasites. Normalised read counts of the core gene analysis were adjusted for life cycle stage, derived from the mixture model approach.
Figure 7—figure supplement 1
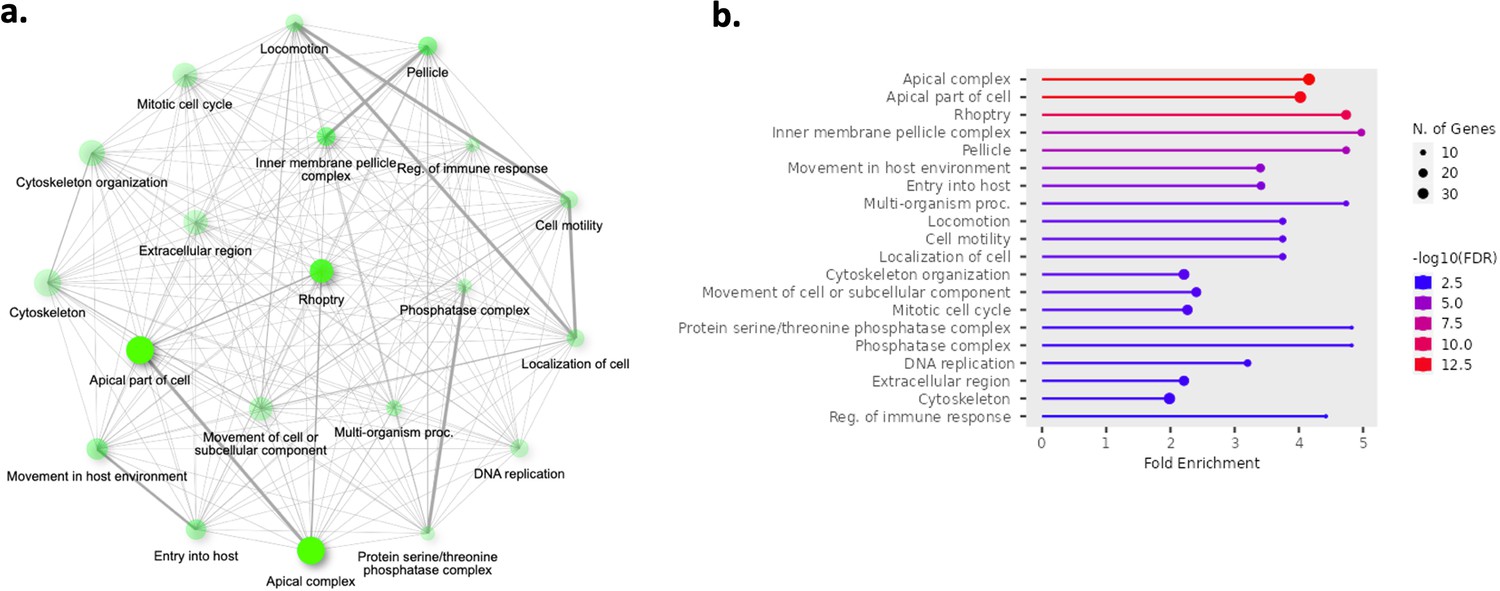
Top 20 enriched pathways in the core genes found to be significantly upregulated in generation 1 parasite samples (n=13) compared to ex vivo parasite samples (n=13).
The 902 genes found significantly upregulated in generation 1 parasite samples underwent pathway analysis. Gene ontology and Kyoto encyclopedia of genes and genomes (KEGG) analysis was performed using ShinyGo and significant terms were defined by having a Bonferroni-corrected p-value <0.05. (a) Network of enriched pathways. Two pathways (nodes) are connected if they share 20% or more genes. Darker nodes are more significantly enriched gene sets. Bigger nodes represent larger gene sets. Thicker edges represent more overlapped genes. (b) Fold enrichment, significance level, and the number of genes found in the pathways.
Figure 7—figure supplement 2
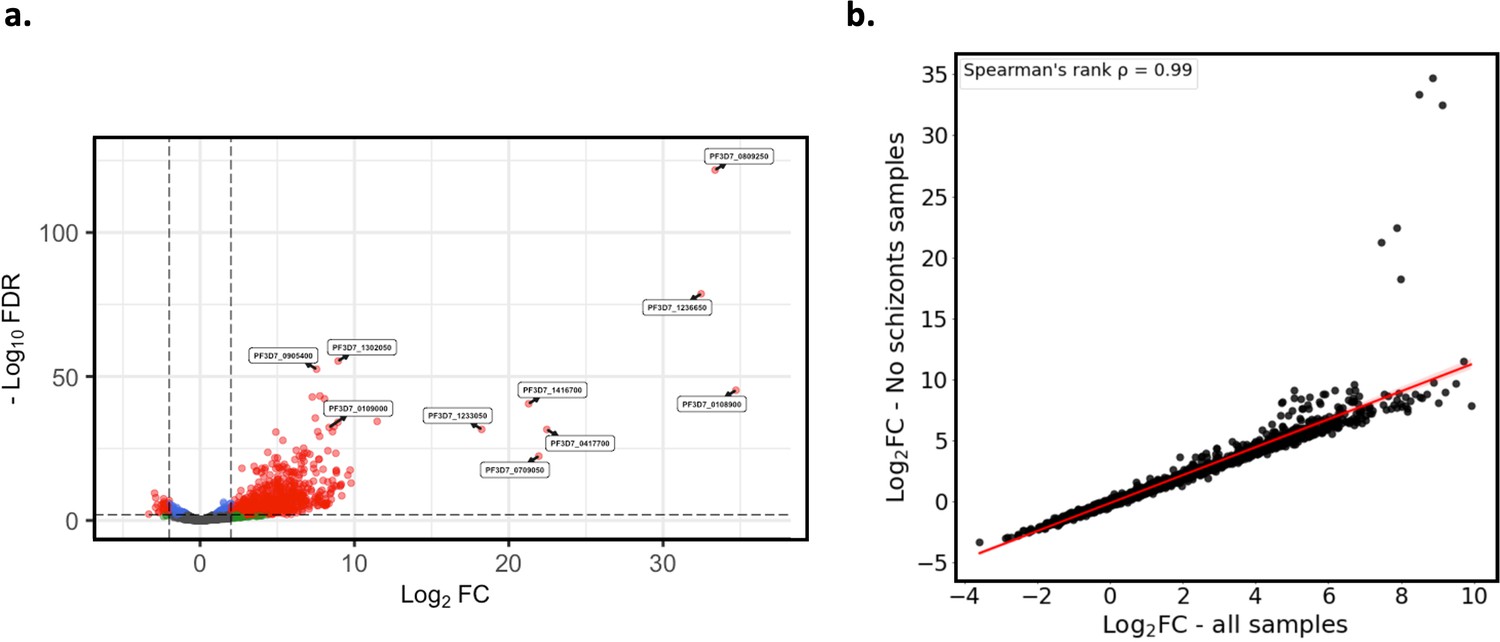
Verification of core gene expression analysis excluding schizont and gametocyte stage parasite samples.
Core gene expression was assessed for paired ex vivo (n=6) and generation 1 (n=6) parasite samples where there were no schizont or gametocyte stage parasites, as determined using the mixture model approach. Subread align was used, as in the original analysis, to align the reads to the human genome and P. falciparum 3D7 genome, with var, rif, stevor, surf, and rRNA genes removed. HTSeq count was used to quantify gene counts. (a) Volcano plot showing extent and significance of up- or downregulation of core gene expression in ex vivo compared with paired generation 1 cultured parasites (red and blue: p<0.05 after Benjamini-Hochberg adjustment for FDR, red and green: absolute log2 fold change [log2FC] in expression ≥ 2). Genes with a log2FC ≥ 2 represent those upregulated in generation 1 parasites. Genes with a log2FC ≤ –2 represent those downregulated in generation 1 parasites. (b) Spearman’s rank correlation analysis of the log2FC values for the ex vivo vs generation 1 core gene differential expression analysis using all paired ex vivo (n=13) and generation 1 (n=13) samples vs ex vivo (n=9) and generation 1 (n=9) samples containing no schizont or gametocyte stage parasites.
Figure 7—figure supplement 3
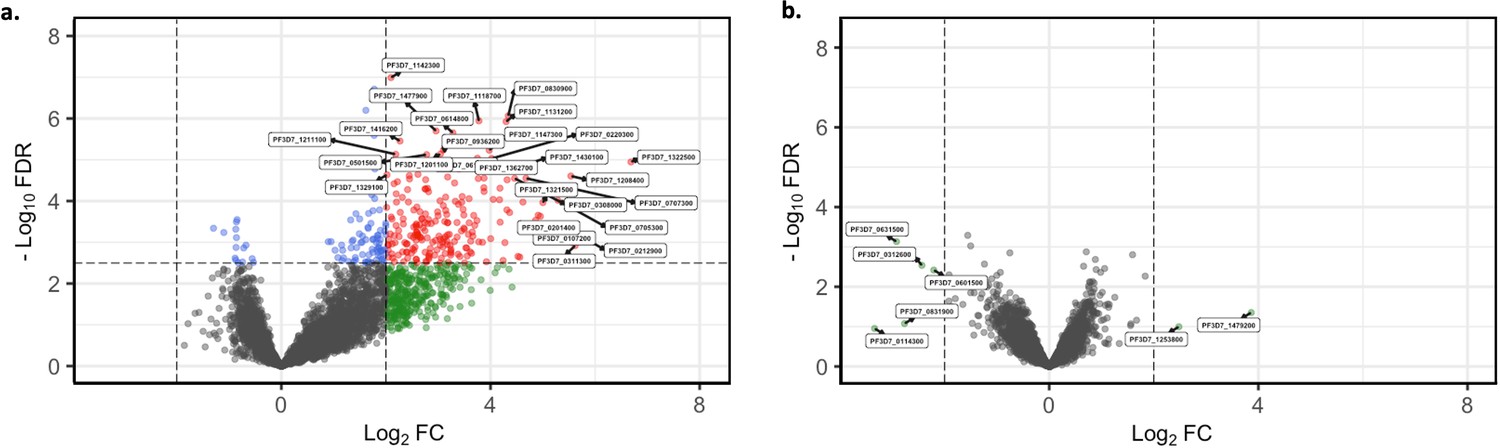
Short-term in vitro cultured parasites as surrogates for assessing the in vivo core gene transcriptome.
Core gene expression was assessed for paired ex vivo (n=13) and generation 1 (n=13) parasite samples. Subread align was used, as in the original analysis, to align the reads to the human genome and P. falciparum 3D7 genome, with var, rif, stevor, surf, and rRNA genes removed. HTSeq count was used to quantify gene counts (Anders et al., 2015). (a) Volcano plot showing extent and significance of up- or downregulation of core gene expression in malaria-naïve patient ex vivo samples (n=6) compared with previously exposed malaria patient ex vivo samples (n=7) (red and blue: p<0.05 after Benjamini-Hochberg adjustment for FDR; red and green: absolute log2 fold change [log2FC] in expression ≥ 2). Genes with a log2FC ≥ 2 represent those upregulated in malaria-naïve patients. Genes with a log2FC ≤ –2 represent those downregulated in malaria-naïve patients. (b) Volcano plot showing extent and significance of up- or downregulation of core gene expression in malaria-naïve patient samples that underwent one cycle of in vitro cultivation (n=6) compared with previously exposed malaria patient samples that underwent one cycle of in vitro cultivation (n=7) (red and blue, p<0.05 after Benjamini-Hochberg adjustment for FDR; red and green, absolute log2 fold change [log2FC] in expression ≥ 2). Genes with a log2FC ≥ 2 represent those upregulated in malaria-naïve patients. Genes with a log2FC ≤ –2 represent those downregulated in malaria-naïve patients. Differential expression analysis was performed using DESeq2 (adjusted for life cycle stage, derived from the mixture model approach).
Author response image 1
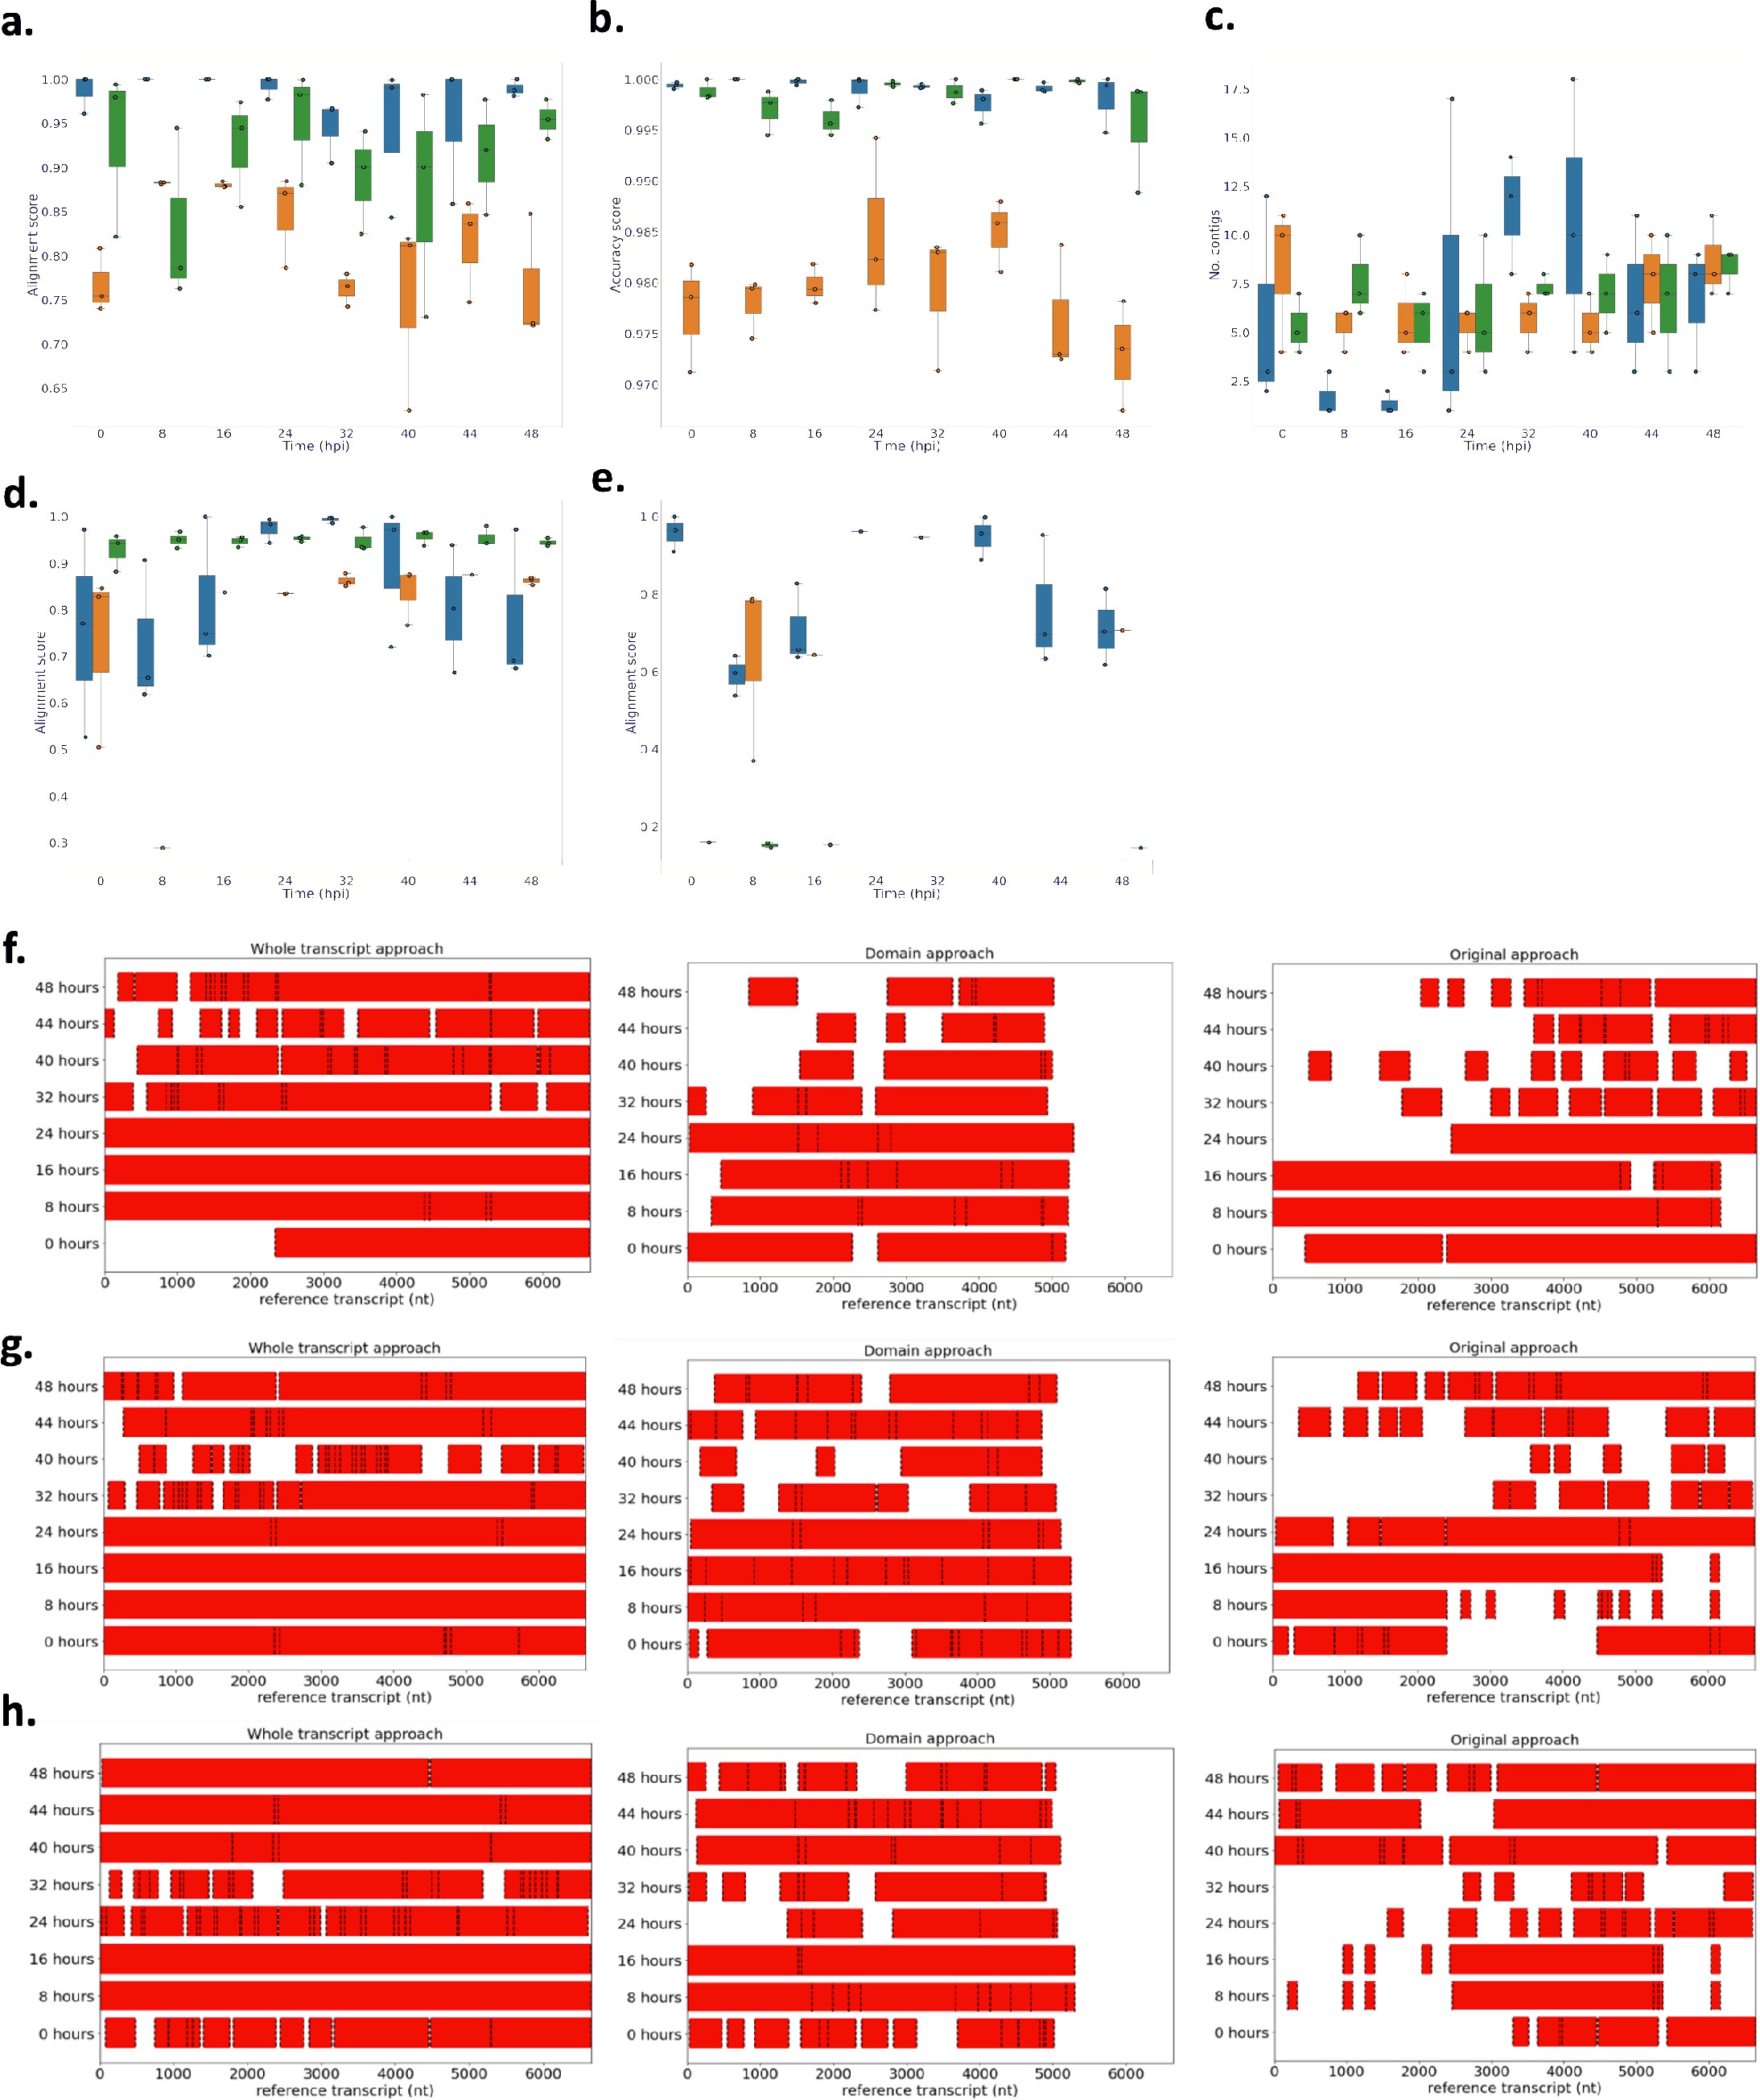
Performance of novel computational pipelines for var assembly on Plasmodium falciparum 3D7: The three approaches (whole transcript: blue, domain approach: orange, original approach: green) were applied to a public RNA-seq dataset (ENA: PRJEB31535) of the intra-erythrocytic life cycle stages of 3 biological replicates of cultured P. falciparum 3D7, sampled at 8-hour intervals up until 40hrs post infection (bpi) and then at 4-hour intervals up until 48 (Wichers al., 2019).
Boxplots show the data from the 3 biological replicates for each time point in the intra-erythrocytic life cycle: (a) alignment scores for the dominantly expressed var gene (PF3D7_07126m), (b) accuracy scores for the dominantly var gene (PF3D7_0712600), (c) number of contigs to assemble the dominant var gene (PF3D7_0712600), (d) alignment scores for a middle ranking expressed vargene (PF3D7_0937800), (e) alignment scores for the lowest expressed var gene (PF3D7_0200100). The first best blast hit (significance threshold = le-10) was chosen for each contig. The alignment score was used to evaluate the each method. The alignment score represents √accuracy* recovery. The accuracy is the proportion of bases that are correct in the assembled transcript and the recovery reflects what proportion of the true transcript was assembled. Assembly completeness of the dominant vargene (PF3D7 071200, length = 6648nt) for the three approaches was assessed for each biological (f) biological replicate 1, (g) biological replicate 2, (h) biological replicate 3. Dotted lines represent the start and end of the contigs required to assemble the vargene. Red bars represent assembled sequences relative to the dominantly whole vargene sequence, where we know the true sequence (termed “reference transcript”).
Author response image 2
Author response image 3
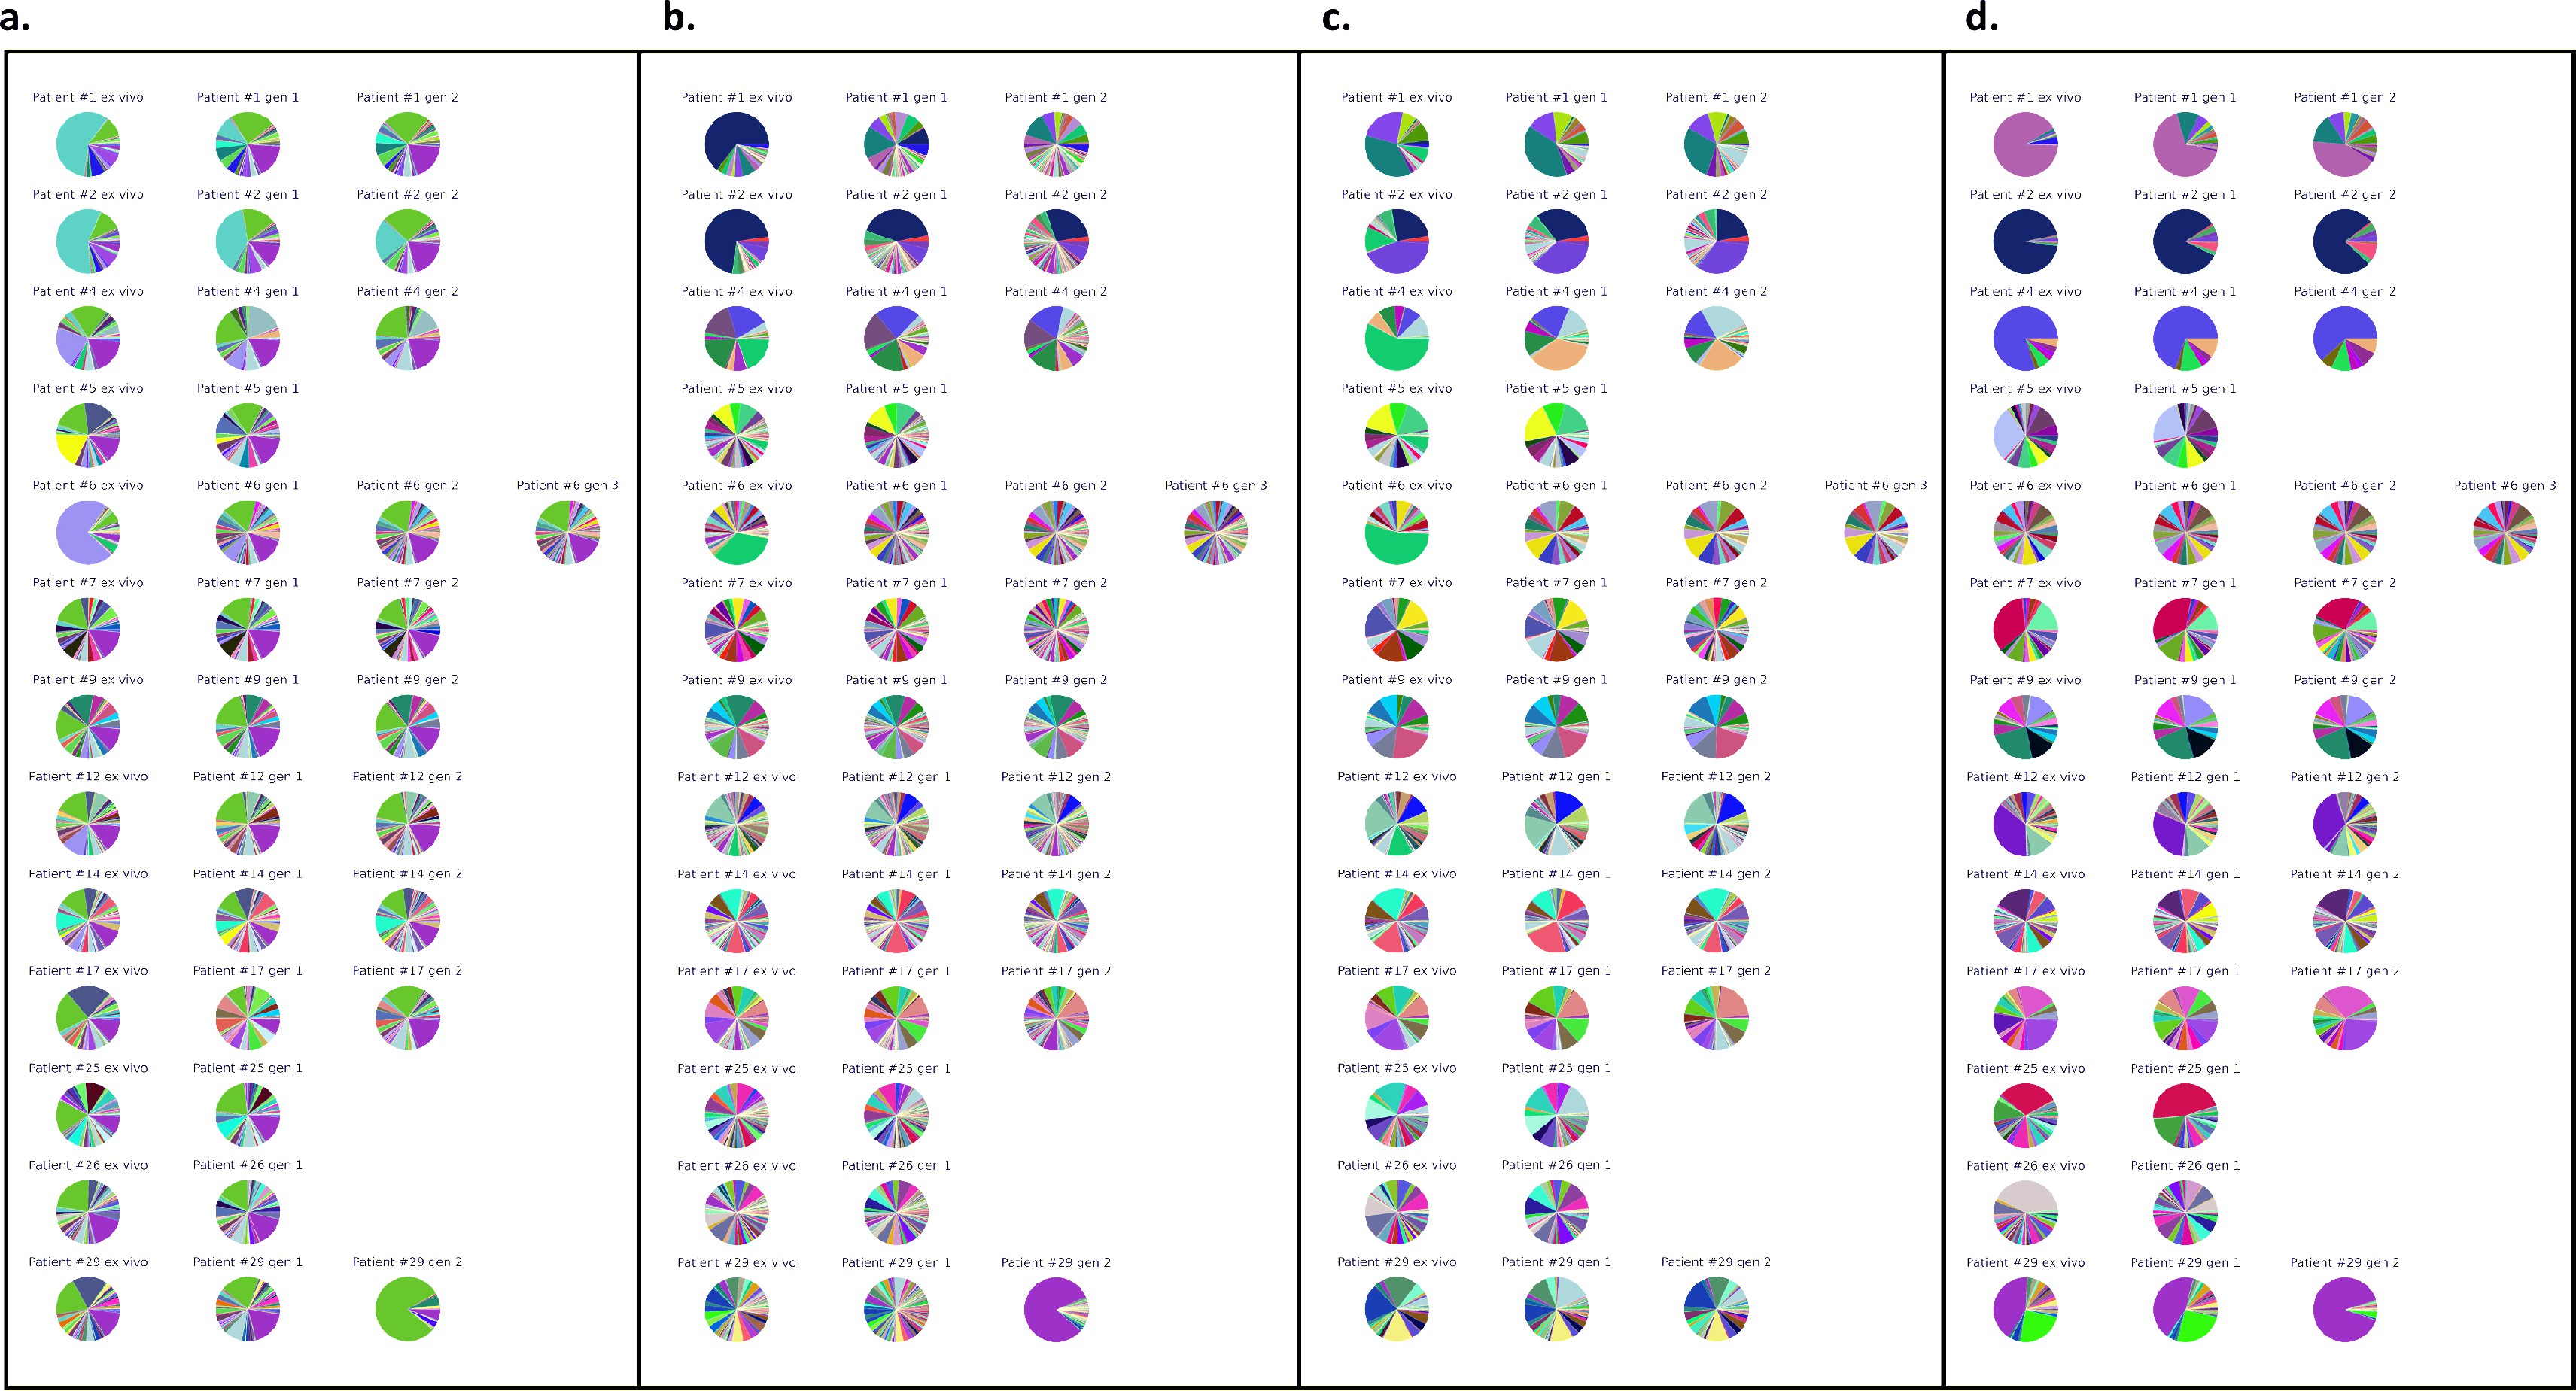
Var expression profiles across different mapping.
Different mapping approaches Were used to quantify the Var expression profiles of each sample (ex Vivo (n=13), generation I (n=13), generation 2 (n=10) and generation 3 (n=l)). The pooled sample approach in Which all significantly assembled van transcripts (1500nt and containing3 significantly annotated var domains) across samples were combined into a reference and redundancy was removed using cd-hit (at sequence identity = 99%) (a—c). The non-core reads of each sample were mapped to this pooled reference using (a) Salmon, (b) bowtie2 filtering for uniquely mapping paired reads with MAPQ and (c) bowtie2 filtering for uniquely mapping paired reads with a MAPQ > 20. (d) The per patient approach was applied. For each patient, the paired ex vivo and in vitro samples were analysed. The assembled var transcripts (at least 1500nt and containing3 significantly annotated var domains) across all the generations for a patient were combined into a reference, redundancy was removed using cd-hit (at sequence identity: 99%), and expression was quantified using Salmon. Pie charts show the var expression profile With the relative size of each slice representing the relative percentage of total var gene expression of each var transcript. Different colours represent different assembled var transcripts with the same colour code used across (a-d).
Tables
Table 1
Comparison of previous var assembly approaches based on DNA- and RNA-sequencing.
| Study | Assembler | k-mer | Transcript or gene assembly | Validation on reference strain(s)(Yes/No) | Validation on field strain(s)(Yes/No) | Validation across different expression levels (Yes/No) | Read length (Short/Long) | Read correction (Yes/No) | Scaffolding(Yes/No) | Var transcript filter approach | Assumption | Other limitations |
|---|---|---|---|---|---|---|---|---|---|---|---|---|
| Duffy et al., 2016 | Oases | Transcript | No | No | No | Short | Yes | Yes | Aligned to 399 var genes with BLAST (e-value <10–5) | – No quantification of misassemblies – Unable to recover full-length transcript assemblies | ||
| Dara et al., 2017 | Sprai and Celera (no longer maintained) | 71 | Gene | Yes (strain NF54) | Yes (12 UM patient samples) | NA – only genome assemblies | Long and short | Method assumes combination of long- and short-read sequencing will identify errors | No | >500 bp and aligned to VarDom database | Assumes a whole genome assembly is available | – Require prior filtering of human DNA – Need a combination of short-read and long-read sequencing |
| Tonkin-Hill et al., 2018* | SoapDeNovo-Trans | 21, 31, 41, 52, and 61 | Transcript | Yes (strain ITG) | No | No | Short | No | No | >500 bp and containing a sig. annotated var domain | – Unable to fully resolve N-terminus – No quantification of misassemblies | |
| Otto et al., 2019 | Masurca +post-assembly improvements | Default | Gene | Yes (clone 3D7) | Yes (15 Pf3k reference genomes) | No | Short | Yes | Yes | Whole genome dataset | ||
| Andrade et al., 2020 | Velvet | 41 | Transcript | No | No | No | Short | No | No | Aligned to VarDom database | – No quantification of misassemblies | |
| Stucke et al., 2021 | rnaSPAdes | Default | Transcript | No | Yes (6 UM patient samples) | No – only the most expressed var gene | Short | Yes | Unclear | >500 bp and containing a sig. annotated var domain | Information about the true var annotation is available | – Performs de novo assembly on all non-human and P. falciparum mapping reads – Inconsistent results in three samples when comparing genomic and RNA-sequencing results for dominant var gene |
-
*
Also used in Wichers et al., 2021; Guillochon et al., 2022.
-
UM: uncomplicated malaria.
Table 2
Statistics for the different approaches used to assemble the var transcripts.
Var assembly approaches were applied to malaria patient ex vivo samples (n=32) from Wichers et al., 2021, and statistics determined. Given are the total number of assembled var transcripts longer than 500 nt containing at least one significantly annotated var domain, the maximum length of the longest assembled var transcript in nucleotides and the N50 value, respectively. The N50 is defined as the sequence length of the shortest var contig, with all var contigs greater than or equal to this length together accounting for 50% of the total length of concatenated var transcript assemblies. Misassemblies represent the number of misassemblies for each approach.
| Number of contigs ≥500 nt | Maximum length (nt) | Average contig length (nt) | N50 | Number of misassemblies | |
|---|---|---|---|---|---|
| Original approach | 6441 | 10,412 | 1621 | 2302 | 336 |
| Domain approach | 4691 | 5003 | 954 | 1088 | NA* |
| Whole transcript approach | 3011 | 12,586 | 2771 | 5381 | 2 |
-
*
Number of misassemblies were not determined for the domain approach due to its poor performance in other metrics.
Table 3
Summary of the clinical dataset used to analyse the impact of parasite culturing on gene expression.
RNA-sequencing was performed on 32 malaria-infected German traveller samples (Wichers et al., 2021). The 32 ex vivo samples were used to compare the performance of the var assembly approaches. Parasites from 13 of these ex vivo samples underwent one cycle of in vitro replication, 10 parasite samples were also subjected to a second cycle of replication in vitro, and a single parasite isolate was also analysed after a third cycle of replication. For the ex vivo vs short-term in vitro cultivation analysis only paired samples were used. The number of assembled var contigs represents results per sample using the whole transcript approach, and shows either the number of assembled var contigs significantly annotated as var gene and ≥500 nt in length, or the number of assembled var transcripts identified with a length ≥ 1500 nt and containing at least three significantly annotated var domains*.
| Generation | ||||||
|---|---|---|---|---|---|---|
| Ex vivo (n=32) | 1 (n=13) | 2 (n=10) | 3 (n=1) | |||
| Malaria exposure (n) | Naïve | 15 | 6 | 4 | 1 | |
| Previously exposed | 17 | 7 | 6 | 0 | ||
| Malaria severity (n) | Severe | 8 | 3 | 1 | 0 | |
| Non-severe | 24 | 10 | 9 | 1 | ||
| Number of MSP1 genotypes (number of samples) | 1 | 22 | 9 | 7 | 1 | |
| 2 | 4 | 0 | 0 | 0 | ||
| 3 | 5 | 3 | 0 | 0 | ||
| 4 | 1 | 1 | 0 | 0 | ||
| Number of P. falciparum PE* reads (non-var) (median, IQR) (million of reads) | 34.6 (27.0–36.5) | 17.1 (12.9–18.0) | 17.2 (12.9–19.1) | 15.1 | ||
| Number of non-core P. falciparum PE* reads (median, IQR) (million of reads) | 5.05 (3.62–6.60) | 1.16 (1.07–1.40) | 1.29 (1.04–1.58) | 0.91 | ||
| Number of assembled var contigs in a sample (≥500 nt) (whole transcript approach) (median, IQR) | 53 (44–84) | 61 (38–76) | 71.5 (48.25–79.5) | 75 | ||
| Number of assembled var contigs in a sample (≥1500 nt and 3 sig. domain annotations) (whole transcript approach) (median, IQR) | 20 (7–31) | 15.5 (10–26) | 15 (10.25–23.75) | 18 | ||
-
*
PE, paired-end reads.
Table 4
Summary of the different levels of analysis performed to assess the effect of short-term parasite culturing on var and core gene expression, their rational, method, results, and interpretation.
| Analysis level | Analysis | Rationale | Method | Results | Interpretation |
|---|---|---|---|---|---|
| var transcript | Per patient expression ranking | Relative quantification of var transcripts over consecutive generations of parasites originating from the same patient to reveal var gene switching events | Combine assembled var transcripts for each patient into a reference and quantify expression, validated with DBLα-tag analysis | 46% of the patient samples had a change in the dominant or top 3 highest expressed var gene | Modest changes in most samples, but unpredictable var gene switching during culture in some samples |
| Per patient var expression homogeneity (VEH) | Determine the overall diversity of var gene expression (number of different variants expressed and their abundance) to assess impact of culturing on the overall var gene expression pattern | Comparison of diversity curves based on per patient quantification of the var transcriptome | 39% of ex vivo samples diversity curves distinct from in vitro samples | Some patient samples underwent a much greater var transcriptional change compared to others | |
| Conserved var variants | Assessing and comparing the expression levels of strain-transcendent var gene variants (var1, var2csa, var3) between samples | Reference of all assembled transcripts for each conserved var gene and quantify expression | var2csa expression increases in second in vitro generation | Parasites converge to var2csa during short-term in vitro culture | |
| var-encoded PfEMP1 domains | Differential expression of PfEMP1 domains | Identification, quantification, and comparison of expression levels of different var gene-encoded PfEMP1 domains associated with different disease manifestations | Pool all assembled var transcripts into a reference and quantify expression of each domain | 46% of the ex vivo samples cluster away from their in vitro samples in PCA plots, distinct clustering by in vitro generation was not observed; CIDRα2.5 significantly differentially expressed between ex vivo and generation 1 | Transition to culture results in modest modulation of particular var domains |
| var group | Expression of NTS (NTSA vs NTSB) and DBLα (DBLα1 vs DBLα0+DBLα2) | Quantification and comparison of expression levels of different var gene groups (group A vs. groups B and C) | Create a reference of all assembled DBLα and NTS domains for each patient and quantify expression. Validated with DBLα-tag analysis | No significant changes | No preferential up- or downregulation of certain var groups during transition to culture |
| Global var expression | LARSFADIG coverage | Assessing the overall var gene expression level (excluding var2csa) | Assemble the LARSFADIG motif and map non-core reads to quantify coverage | Trend for decrease in global var expression during culture, but no significant changes | Subtle reduction in global var gene expression may reflect increase in parasite age during culture |
| Core genes | Differential gene expression (DGE) | Assessing the impact of cultivation on the parasite core gene transcriptome | Differential expression analysis of core genes (P. falciparum 3D7 used as reference) | 19% of the core transcriptome significantly differentially expressed between paired ex vivo and generation 1 in vitro samples; distinct clustering by parasite generation observed; upregulation of invasion and replication-related genes in vitro | Parasites core gene expression changes substantially upon entering culture |
Key resources table
| Reagent type (species) or resource | Designation | Source or reference | Identifiers | Additional information |
|---|---|---|---|---|
| Biological sample (Plasmodium falciparum) | Isolate #1 | Patient isolate Wichers et al., 2021 | Freshly isolated from a naïve, severely ill malaria patient | |
| Biological sample (Plasmodium falciparum) | Isolate #2 | Patient isolate Wichers et al., 2021 | Freshly isolated from a pre-exposed, non-severely ill malaria patient | |
| Biological sample (Plasmodium falciparum) | Isolate #3 | Patient isolate Wichers et al., 2021 | Freshly isolated from a naïve, non-severely ill malaria patient | |
| Biological sample (Plasmodium falciparum) | Isolate #4 | Patient isolate Wichers et al., 2021 | Freshly isolated from a pre-exposed, non-severely ill malaria patient | |
| Biological sample (Plasmodium falciparum) | Isolate #5 | Patient isolate Wichers et al., 2021 | Freshly isolated from a pre-exposed, non-severely ill malaria patient | |
| Biological sample (Plasmodium falciparum) | Isolate #6 | Patient isolate Wichers et al., 2021 | Freshly isolated from a naïve, non-severely ill malaria patient | |
| Biological sample (Plasmodium falciparum) | Isolate #7 | Patient isolate Wichers et al., 2021 | Freshly isolated from a pre-exposed, non-severely ill malaria patient | |
| Biological sample (Plasmodium falciparum) | Isolate #9 | Patient isolate Wichers et al., 2021 | Freshly isolated from a naïve, non-severely ill malaria patient | |
| Biological sample (Plasmodium falciparum) | Isolate #10 | Patient isolate Wichers et al., 2021 | Freshly isolated from a pre-exposed, non-severely ill malaria patient | |
| Biological sample (Plasmodium falciparum) | Isolate #11 | Patient isolate Wichers et al., 2021 | Freshly isolated from a pre-exposed, non-severely ill malaria patient | |
| Biological sample (Plasmodium falciparum) | Isolate #12 | Patient isolate Wichers et al., 2021 | Freshly isolated from a pre-exposed, non-severely ill malaria patient | |
| Biological sample (Plasmodium falciparum) | Isolate #13 | Patient isolate Wichers et al., 2021 | Freshly isolated from a naïve, severely ill malaria patient | |
| Biological sample (Plasmodium falciparum) | Isolate #14 | Patient isolate Wichers et al., 2021 | Freshly isolated from a naïve, non-severely ill malaria patient | |
| Biological sample (Plasmodium falciparum) | Isolate #15 | Patient isolate Wichers et al., 2021 | Freshly isolated from a naïve, severely ill malaria patient | |
| Biological sample (Plasmodium falciparum) | Isolate #16 | Patient isolate Wichers et al., 2021 | Freshly isolated from a naïve, non-severely ill malaria patient | |
| Biological sample (Plasmodium falciparum) | Isolate #17 | Patient isolate Wichers et al., 2021 | Freshly isolated from a pre-exposed, non-severely ill malaria patient | |
| Biological sample (Plasmodium falciparum) | Isolate #18 | Patient isolate Wichers et al., 2021 | Freshly isolated from a pre-exposed, non-severely ill malaria patient | |
| Biological sample (Plasmodium falciparum) | Isolate #19 | Patient isolate Wichers et al., 2021 | Freshly isolated from a pre-exposed, non-severely ill malaria patient | |
| Biological sample (Plasmodium falciparum) | Isolate #20 | Patient isolate Wichers et al., 2021 | Freshly isolated from a naïve, severely ill malaria patient | |
| Biological sample (Plasmodium falciparum) | Isolate #21 | Patient isolate Wichers et al., 2021 | Freshly isolated from a naïve, non-severely ill malaria patient | |
| Biological sample (Plasmodium falciparum) | Isolate #22 | Patient isolate Wichers et al., 2021 | Freshly isolated from a naïve, non-severely ill malaria patient | |
| Biological sample (Plasmodium falciparum) | Isolate #23 | Patient isolate Wichers et al., 2021 | Freshly isolated from a naïve, severely ill malaria patient | |
| Biological sample (Plasmodium falciparum) | Isolate #24 | Patient isolate Wichers et al., 2021 | Freshly isolated from a pre-exposed, non-severely ill malaria patient | |
| Biological sample (Plasmodium falciparum) | Isolate #25 | Patient isolate Wichers et al., 2021 | Freshly isolated from a naïve, severely ill malaria patient | |
| Biological sample (Plasmodium falciparum) | Isolate #26 | Patient isolate Wichers et al., 2021 | Freshly isolated from a naïve, severely ill malaria patient | |
| Biological sample (Plasmodium falciparum) | Isolate #27 | Patient isolate Wichers et al., 2021 | Freshly isolated from a pre-exposed, non-severely ill malaria patient | |
| Biological sample (Plasmodium falciparum) | Isolate #28 | Patient isolate Wichers et al., 2021 | Freshly isolated from a pre-exposed, non-severely ill malaria patient | |
| Biological sample (Plasmodium falciparum) | Isolate #29 | Patient isolate Wichers et al., 2021 | Freshly isolated from a pre-exposed, non-severely ill malaria patient | |
| Biological sample (Plasmodium falciparum) | Isolate #30 | Patient isolate Wichers et al., 2021 | Freshly isolated from a naïve, severely ill malaria patient | |
| Biological sample (Plasmodium falciparum) | Isolate #31 | Patient isolate Wichers et al., 2021 | Freshly isolated from a pre-exposed, non-severely ill malaria patient | |
| Biological sample (Plasmodium falciparum) | Isolate #32 | Patient isolate Wichers et al., 2021 | Freshly isolated from a pre-exposed, non-severely ill malaria patient | |
| Biological sample (Plasmodium falciparum) | Isolate #33 | Patient isolate Wichers et al., 2021 | Freshly isolated from a pre-exposed, non-severely ill malaria patient | |
| Others | Plasmodipur filter | EuroProxima | Transia Cat. #: 8011Filter25u | Filter to remove residual granulocytes from erythrocyte pellet after Ficoll gradient centrifugation (see Materials and methods section ‘Blood sampling, processing, and in vitro cultivation of P. falciparum’) |
| Others | TRIzol | ThermoFisher | Cat. #: 15596026 | Commercial reagent |
| Commercial assay or kit | RNeasy MinElute Cleanup Kit | QIAGEN | Cat. #: 74204 | |
| Commercial assay or kit | GLOBINclear kit | ThermoFisher | Cat. #: AM1980 | |
| Commercial assay or kit | NEBNextPoly(A) mRNA Magnetic Isolation Module | NEB | Cat. #: E7490L | |
| Commercial assay or kit | NEBNext Ultra RNA Library Prep Kit for Illumina | NEB | Cat. #: E7530L | |
| Commercial assay or kit | NEBNext Multiplex Oligos for Illumina (Index Primers Set 1) | NEB | Cat. #: E7335L | |
| Commercial assay or kit | KAPA HiFi plus dNTPs | Roche | Cat. #: 7958846001 | |
| Software, algorithm | SoapDeNovo-Trans | SoapDeNovo-Trans | RRID:SCR_013268 | |
| Software, algorithm | rnaSPAdes | rnaSPAdes | RRID:SCR_016992 | |
| Software, algorithm | Oases | Oases | RRID:SCR_011896 | |
| Software, algorithm | DESeq2 | DESeq2 | RRID:SCR_015687 | |
| Software, algorithm | Salmon | Salmon | RRID:SCR_017036 | |
| Software, algorithm | CAP3 | CAP3 | RRID:SCR_007250 | |
| Software, algorithm | SSPACE | SSPACE | RRID:SCR_005056 | |
| Software, algorithm | featureCounts | featureCounts | RRID:SCR_012919 |
Author response table 1
Comparison of previous var assembly approaches based on DNA- and RNA-sequencing.
| Study | Assembler | k-mer | Transcript or gene assembly | Validation on reference strain(s) (Yes/No) | Validation on field strain(s) (Yes/No) | Validation across different expression levels (Yes/No) | Read length (Short/Long) | Read correction (Yes/No) | Scaffolding (Yes/No) | Var transcript filter approach | Assumption | Other limitations |
|---|---|---|---|---|---|---|---|---|---|---|---|---|
| Duffy et al., 2016 | Oases | Transcript | No | No | No | Short | Yes | Yes | Aligned to 399 var genes with BLAST (e-value< 10–5) | - No quantification of misassemblies - Unable to recover full length transcript assemblies | ||
| Dara et al., 2017 | Sprai and Celera (no longer maintained) | 71 | Gene | Yes (strain NF54) | Yes (12 UM patient samples) | NA – only genome assemblies | Long and short | Method assumes combination of long and short-read sequencing will identify errors | No | >500 bp and aligned to VarDom database | Assumes a whole genome assembly is available | - Require prior filtering of human DNA - Need a combination of short-read and long-read sequencing |
| Tonkin-Hill et al., 2018* | SoapDeNovo-Trans | 21, 31, 41, 52 & 61 | Transcript | Yes (strain ITG) | No | No | Short | No | No | >500 bp and containing a sig. annotated var domain | - Unable to fully resolve N-terminus - No quantification of misassemblies | |
| Otto et al., 2019 | Masurca +post-assembly improvements | Default | Gene | Yes (clone 3D7) | Yes (15 Pf3k reference genomes) | No | Short | Yes | Yes | Whole genome dataset | ||
| Andrade et al., 2020 | Velvet | 41 | Transcript | No | No | No | Short | No | No | Aligned to VarDom database | - No quantification of misassemblies | |
| Stucke et al., 2021 | rnaSPAdes | Default | Transcript | No | Yes (6 UM patient samples) | No – only the most expressed var gene | Short | Yes | Unclear | >500 bp and containing a sig. annotated var domain | Information about the true var annotation is available | - Performs de novo assembly on all non-human and P. falciparum mapping reads - Inconsistent results in 3 samples when comparing genomic and RNA-seq results for dominant var gene |
Author response table 2
Summary of the different levels of analysis performed to assess the effect of short-term parasite culturing on var and core gene expression, their rational, method, results, and interpretation.
| Analysis level | Analysis | Rationale | Method | Results | Interpretation |
|---|---|---|---|---|---|
| var transcript | Per patient expression ranking | Relative quantification of var transcripts over consecutive generations of parasites originating from the same patient to reveal var gene switching events | Combine assembled var transcripts for each patient into a reference and quantify expression, validated with DBLα-tag analysis | 46% of the patient samples had a change in the dominant or top 3 highest expressed var gene | Modest changes in most samples, but unpredictable var gene switching during culture in some samples |
| Per patient var expression homogeneity (VEH) | Determine the overall diversity of var gene expression (number of different variants expressed and their abundance) to assess impact of culturing on the overall var gene expression pattern | Comparison of diversity curves based on per patient quantification of the var transcriptome | 39% of ex vivo samples diversity curves distinct from in vitro samples | Some patient samples underwent a much greater var transcriptional change compared to others | |
| Conserved var variants | Assessing and comparing the expression levels of strain-transcendent var gene variants (var1, var2csa, var3) between samples | Reference of all assembled transcripts for each conserved var gene and quantify expression | var2csa expression increases in 2nd in vitro generation | Parasites converge to var2csa during short-term in vitro culture | |
| var-encoded PfEMP1 domains | Differential expression of PfEMP1 domains | Identification, quantification and comparison of expression levels of different var gene-encoded PfEMP1 domains associated with different disease manifestations | Pool all assembled var transcripts into a reference and quantify expression of each domain | 46% of the ex vivo samples cluster away from their in vitro samples in PCA plots, distinct clustering by in vitro generation was not observed; CIDRα2.5 significantly differentially expressed between ex vivo and generation 1 | Transition to culture results in modest modulation of particular var domains |
| var group | Expression of NTS (NTSA vs NTSB) and DBLα (DBLα1 vs DBLα0+DBLα2) | Quantification and comparison of expression levels of different var gene groups (group A vs. group B and C) | Create a reference of all assembled DBLα and NTS domains for each patient and quantify expression. Validated with DBLα-tag analysis | No significant changes | No preferential up or down regulation of certain var groups during transition to culture |
| Global var expression | LARSFADIG coverage | Assessing the overall var gene expression level (excluding var2csa) | Assemble the LARSFADIG motif and map non-core reads to quantify coverage | Trend for decrease in global var expression during culture, but no significant changes | Subtle reduction in global var gene expression may reflect increase in parasite age during culture |
| Core genes | Differential gene expression (DGE) | Assessing the impact of cultivation on the parasite core gene transcriptome | Differential expression analysis of core genes (P. falciparum 3D7 used as reference) | 19% of the core transcriptome significantly differentially expressed between paired ex vivo and generation 1 in vitro samples; distinct clustering by parasite generation observed; upregulation of invasion and replication related genes in vitro | Parasites core gene expression changes substantially upon entering culture |
Author response table 3
Statistics for the different approaches used to assemble the var transcripts.
Var assembly approaches were applied to malaria patient ex vivo samples (n=32) from (Wichers et al., 2021) and statistics determined. Given are the total number of assembled var transcripts longer than 500 nt containing at least one significantly annotated var domain, the maximum length of the longest assembled var transcript in nucleotides and the N50 value, respectively. The N50 is defined as the sequence length of the shortest var contig, with all var contigs greater than or equal to this length together accounting for 50% of the total length of concatenated var transcript assemblies. Misassemblies represents the number of misassemblies for each approach. *Number of misassemblies were not determined for the domain approach due to its poor performance in other metrics.
| Number of contigs≥ 500nts | Maximum length (nt) | Average contig length (nt) | N50 | Number of misassemblies | |
|---|---|---|---|---|---|
| Original approach | 6,441 | 10,412 | 1,621 | 2,302 | 336 |
| Domain approach | 4,691 | 5,003 | 954 | 1,088 | NA* |
| Whole transcript approach | 3,011 | 12,586 | 2,771 | 5,381 | 2 |
Additional files
-
Supplementary file 1
Comparison of misassemblies produced by each var assembly approach.
Table shows the number (absolute) and proportion (relative to all assembled contigs) of misassemblies produced for the dominant var gene (PF3D7_0712600) assembly in the P. falciparum 3D7 dataset (European nucleotide archive [ENA]: PRJEB31535: A public RNA-seq dataset of the intra-erythrocytic life cycle stages of cultured P. falciparum 3D7 strain, sampled at 8 hr intervals up until 40 hr post infection and then at 4 hr intervals up until 48 hr post infection). A misassembly was defined as a contig whose best hit was to PF3D7_0712600 and had a sequence identity <99% (i.e. was not 100% contained within the reference var transcript).
- https://cdn.elifesciences.org/articles/87726/elife-87726-supp1-v1.docx
-
Supplementary file 2
Per sample var assembly results using the whole transcript approach.
Patient exposure and severity refer to the original patient exposure and severity that the sample originated from. # var transcripts before SSPACE represents the # var transcripts assembled before SSPACE was applied. # var transcripts after SSPACE represents the # var transcripts assembled after SSPACE was used to join contigs. # var significant annotated transcripts ≥ 500 nt represent the # var transcripts ≥ 500 nt that contained at least one significantly annotated var domain. # var significant annotated transcripts ≥ 1500 nt and three domains represent the # var transcripts ≥ 1500 nt that contained at least three significantly annotated var domains. Var largest transcript (nt) represents the length of the longest assembled var transcript in that sample in nucleotides. Var N50 represents the length of the shortest var transcript where all transcripts greater than or equal to this length when summed together represent 50% of the total var transcript assembly length. # var transcripts ≥ 5% represents the number of var transcripts whose expression contributed to >5% overall var gene expression. # assembled LARSFADIG represents the number of assembled LARSFADIG motifs (assembled using rnaSPAdes).
- https://cdn.elifesciences.org/articles/87726/elife-87726-supp2-v1.docx
-
Supplementary file 3
Summary statistics of the var transcripts after three different filtering approaches were applied to the paired ex vivo (n=13), generation 1 (n=13), generation 2 (n=10), and generation 3 (n=1) samples.
The var transcripts were assembled using the whole transcript approach and all samples’ assemblies combined into a reference. The first approach filtered for var transcripts that contained at least three significantly annotated domains, one of which had to be DBLα and required the transcript to be ≥ 1500 nt in length (3 domains, ≥ 1500 nt and DBLα). The second approach filtered for var transcripts at least 1500 nt long and that contained a DBLα domain (≥1500 nt and DBLα). The third approach filtered for transcripts that contained at least three significantly annotated var domains and were at least 1500 nt in length (3 domains & ≥ 1500 nt). # Significantly annotated var transcripts represent the number of significantly annotated var transcripts in all samples combined. # Uniquely annotated var transcripts represent the number of unique var transcript annotations found in all samples combined. # Var transcripts (≥5 in at least 3 samples) represent the number of var transcripts after filtering for a Salmon estimated count of 5 in at least 3 samples (filtering threshold used prior to differential expression analysis). Max length of var transcript (nt) represents the longest transcript assembled in all samples combined. N50 represents the length of the shortest var transcript where all transcripts greater than or equal to this length when summed together represent 50% of the total var transcript assembly length. Transcripts were annotated using hidden Markov models (HMM) built on the Rask et al., 2010, dataset. When annotating the whole transcript, the most significant alignment was taken as the best annotation for each region of the assembled transcript (e-value cut-off 1e-5). Multiple annotations were allowed on the transcript if they were not overlapping, determined using cath-resolve-hits.
- https://cdn.elifesciences.org/articles/87726/elife-87726-supp3-v1.docx
-
Supplementary file 4
Output of the linear model to quantify total var gene expression during the transition of parasites into in vitro culture.
Var gene expression as a proportion of total gene expression was used as a response variable, generation and life cycle stage as independent variables, and patient information as a random effect. Only paired samples of ex vivo parasites and generation 1 parasites were used.
- https://cdn.elifesciences.org/articles/87726/elife-87726-supp4-v1.xlsx
-
Supplementary file 5
Varia results output.
For each patient sample, the corresponding paired cluster is labelled (e.g., #6_1st_invitro_cluster_154=cluster 90ev shows cluster 154 of patient #6, generation 1 sample corresponds to cluster 90 of patient #6 ex vivo sample). Identical cluster sequences across paired samples were defined as having % sequence ID = >99%.
- https://cdn.elifesciences.org/articles/87726/elife-87726-supp5-v1.xlsx
-
Supplementary file 6
Differentially expressed core genes in the ex vivo vs generation 1 paired analysis.
Log2FoldChange represents the log2 fold change for the ex vivo and generation 1 analysis. Values > 0 represent genes upregulated in generation 1 samples and values < 0 represent genes downregulated in generation 1 samples. pvalue and padj represent the p-value and adjusted p-value (Benjamini-Hochberg) respectively.
- https://cdn.elifesciences.org/articles/87726/elife-87726-supp6-v1.xlsx
-
Supplementary file 7
In vitro culture conditions.
In vitro culture either had the addition of O+ human red cells (necessary due to high parasitaemia or low sample volume obtained from patient) or were without allogenic red cells. Patient # represents the original ex vivo patient number that the sample derived from.
- https://cdn.elifesciences.org/articles/87726/elife-87726-supp7-v1.docx
-
Supplementary file 8
MSP1 genotyping results from ex vivo and in vitro adapted P. falciparum isolates.
- https://cdn.elifesciences.org/articles/87726/elife-87726-supp8-v1.xlsx
-
Supplementary file 9
Quality of the RNA samples analysed in this study.
To characterise the overall RNA quality prior to library synthesis, the Bioanalyzer automated RNA electrophoresis system was used to visualise the samples and calculate the RIN values. The measurement of the RIN value for samples from mixed species (Homo sapiens, P. falciparum) is not very meaningful, as the RIN increases the higher the proportion of a single species. This can be observed by the increase in the RIN value during in vitro cultivation of the parasites, as the parasite RNA content increases over time. Of the four rRNA peaks visible in particular in the ex vivo samples, the inner peaks represent the 18S and 28S rRNA of P. falciparum, the outer peaks are of human origin.
- https://cdn.elifesciences.org/articles/87726/elife-87726-supp9-v1.pdf
-
MDAR checklist
- https://cdn.elifesciences.org/articles/87726/elife-87726-mdarchecklist1-v1.pdf
Download links
A two-part list of links to download the article, or parts of the article, in various formats.
Downloads (link to download the article as PDF)
Open citations (links to open the citations from this article in various online reference manager services)
Cite this article (links to download the citations from this article in formats compatible with various reference manager tools)
A novel computational pipeline for var gene expression augments the discovery of changes in the Plasmodium falciparum transcriptome during transition from in vivo to short-term in vitro culture
eLife 12:RP87726.
https://doi.org/10.7554/eLife.87726.3


