Comprehensive mutagenesis maps the effect of all single-codon mutations in the AAV2 rep gene on AAV production
- Wyss Institute for Biologically Inspired Engineering, United States
- Department of Genetics, Harvard Medical School, United States
Figures
Figure 1 with 1 supplement
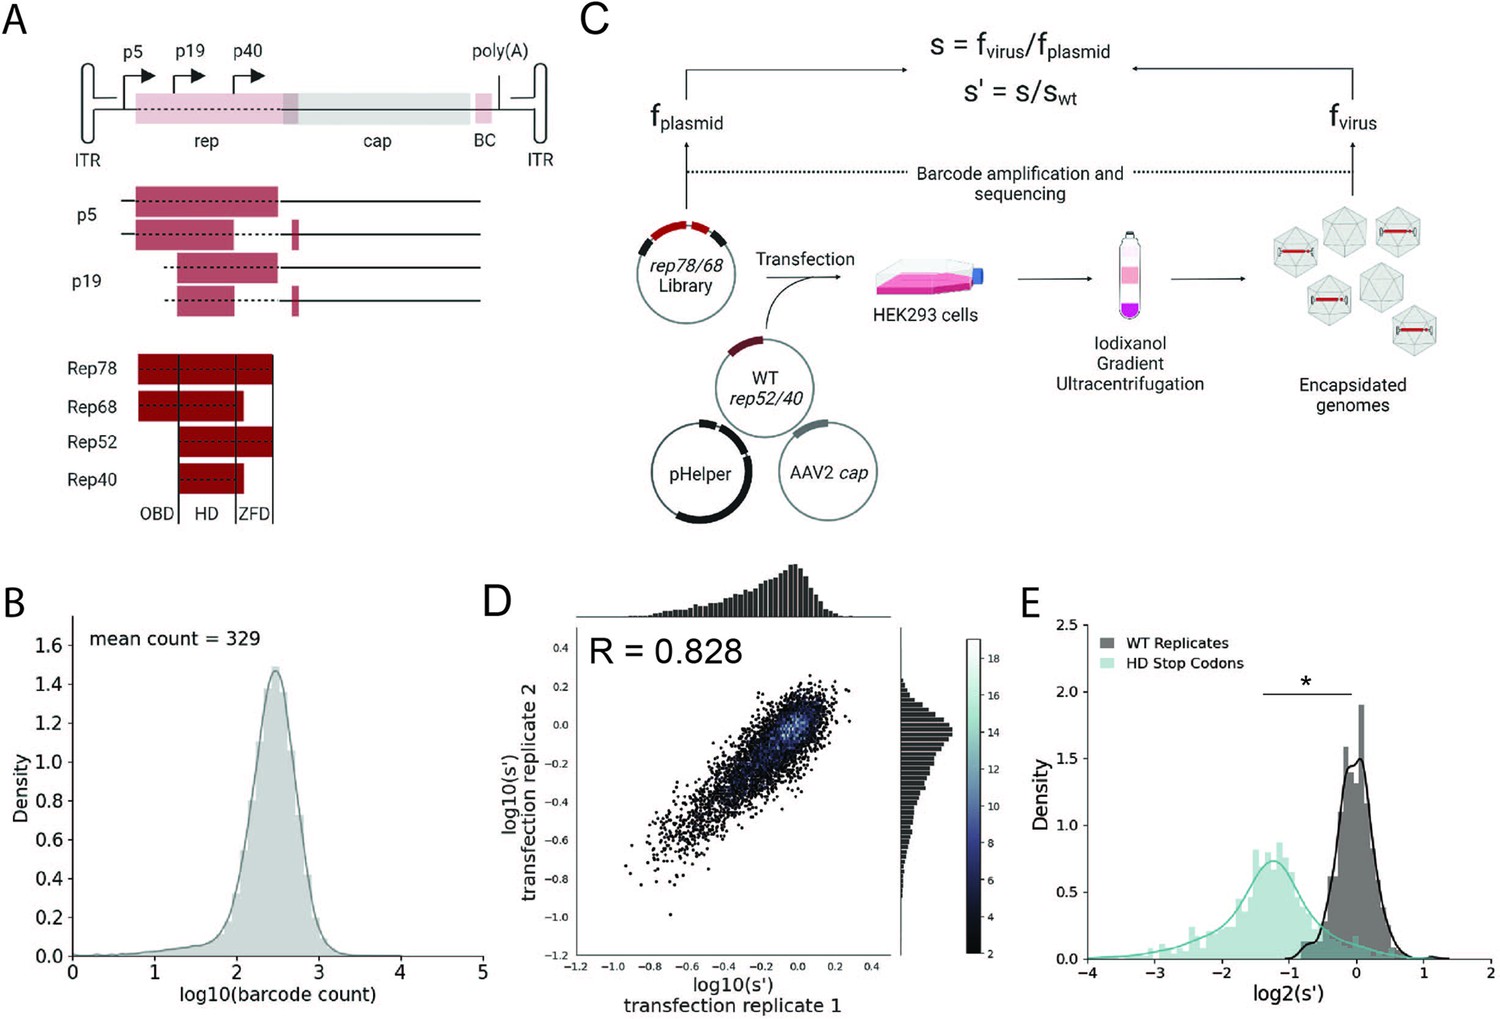
Comprehensive mutagenesis library design and production assay.
(A) Organization of the AAV2 genome and Rep protein domains. Top: single-stranded DNA genome, middle: RNA transcripts, bottom: Rep proteins. Dotted lines indicate mutated regions. (B) Density plot of barcode counts in the pCMV-Rep78/68 plasmid library. (C) Overview of production assay for the pCMV-Rep78/68 library and calculation of wild-type normalized production fitness values (s′). (D) Amino acid level production fitness values from replicate transfections of the pCMV-Rep78/68 library. Pearson R correlation coefficient calculated after log transformation. (E) Density plot of production fitness values for wild-type (black) and premature stop codon (blue) controls for the pCMV-Rep78/68 library. *p<10–20 (Mann–Whitney U-test). Panels (A) and (C) created with BioRender.com and published using a CC-BY-NC-ND license with permission.
© 2024, BioRender Inc. Figure 1 was createdusing BioRender, and is published under a CC BY-NC-ND 4.0. Further reproductions must adhere to the terms of this license
Figure 1—figure supplement 1
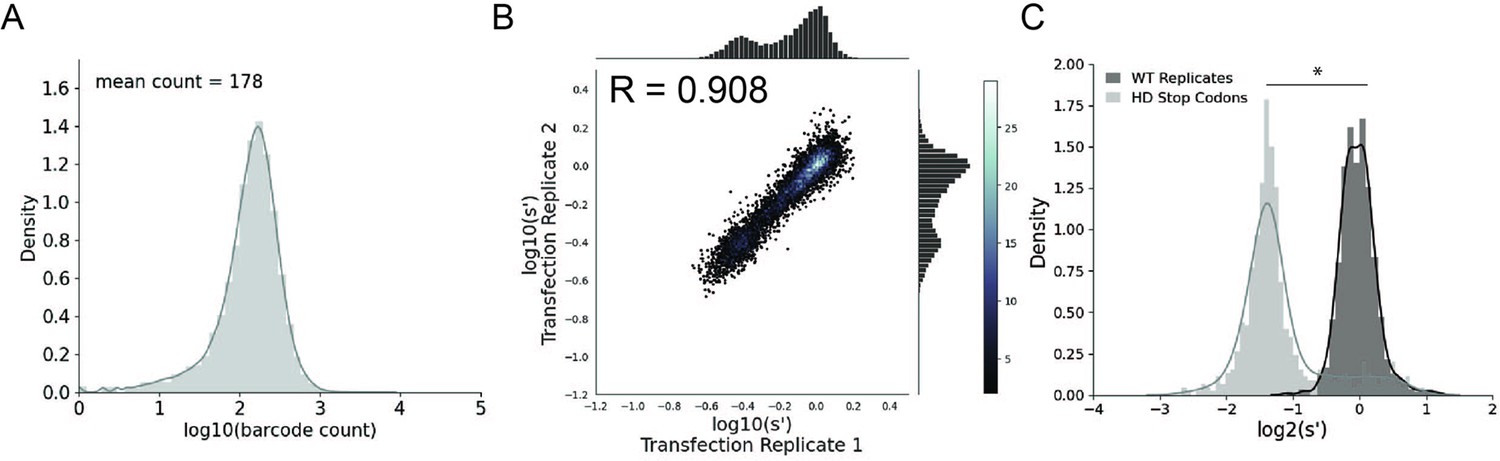
Comprehensive mutagenesis library design and production assay results for WT AAV2 format library.
(A) Density plot of barcode counts in the WT AAV2 plasmid library. (B) Amino acid level production fitness values from replicate transfections for the WT AAV2 library. Pearson R correlation coefficient calculated after log transformation. (C) Density plot of wild-type (black) and premature stop codon (gray) controls for the WT AAV2 library. *p<10–20 (Mann–Whitney U-test).
Figure 2 with 7 supplements
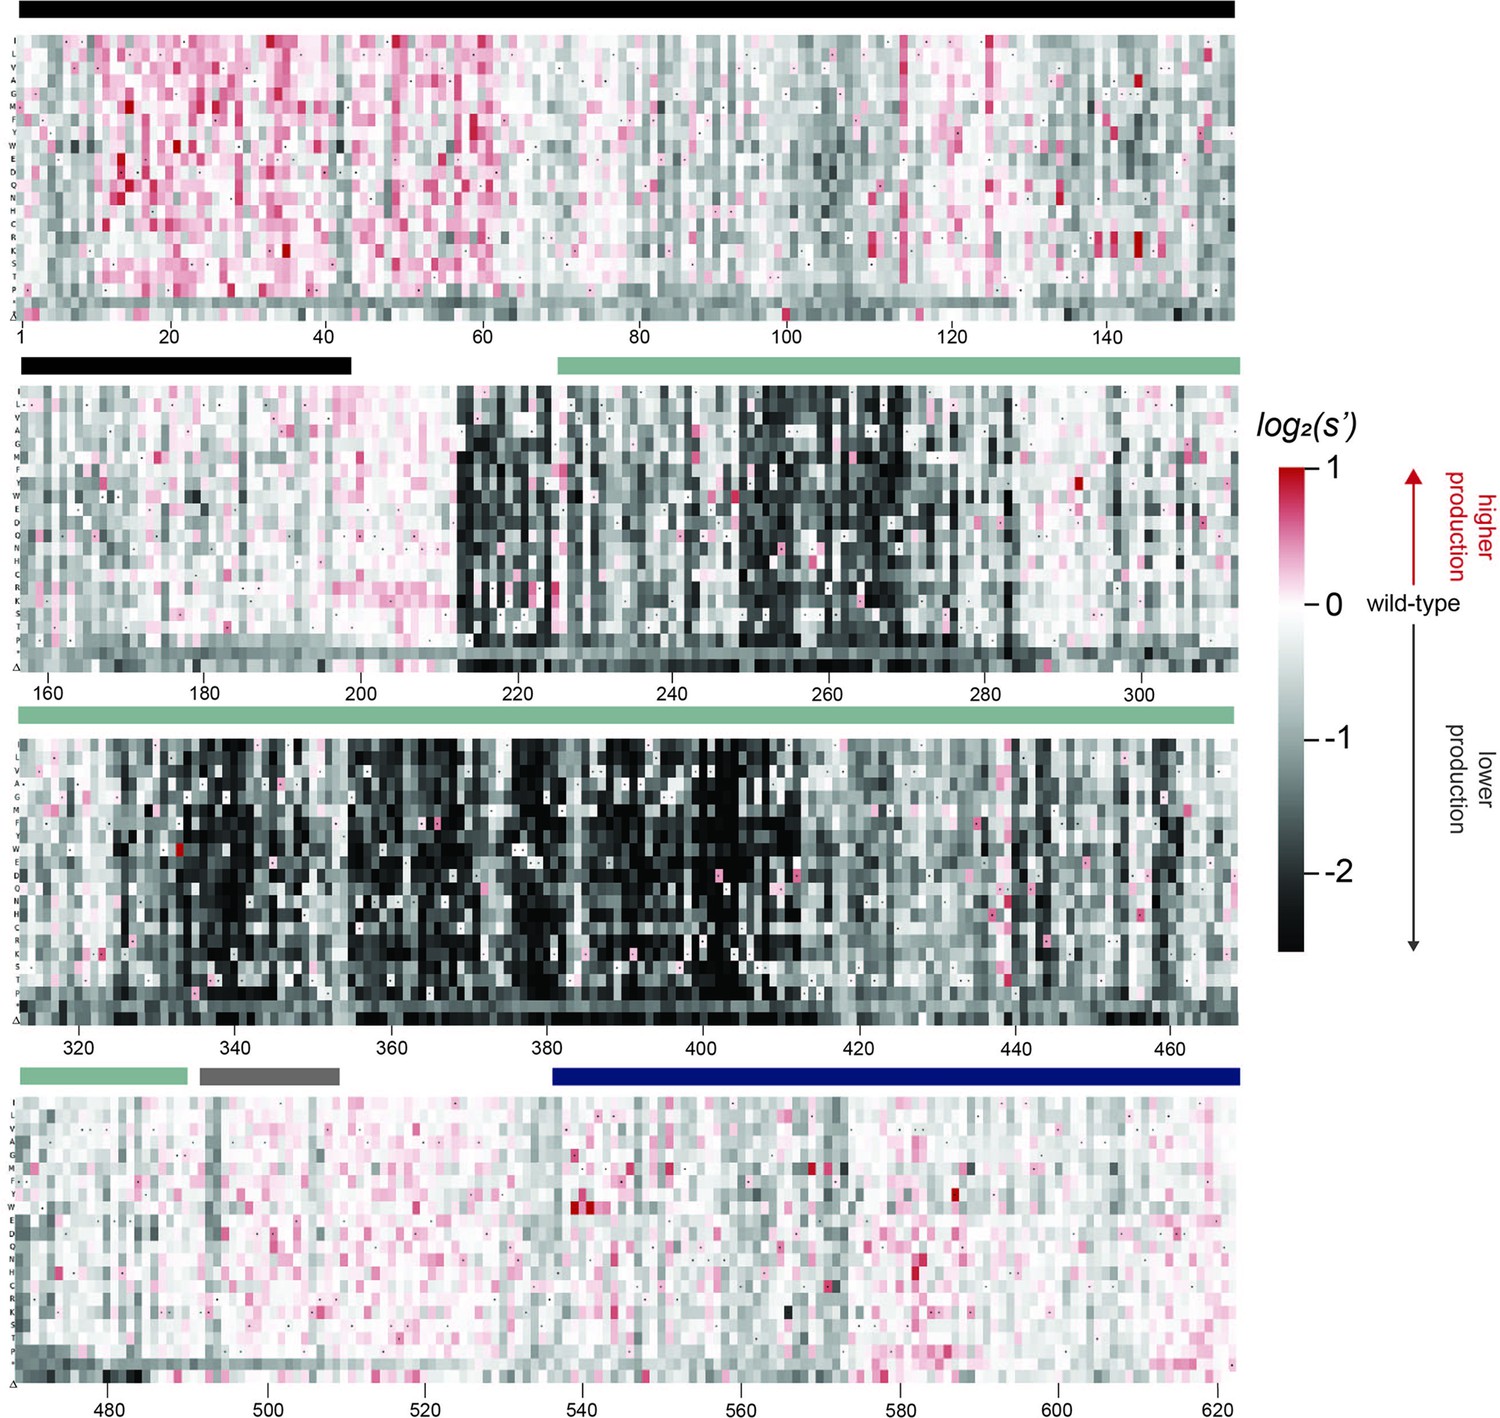
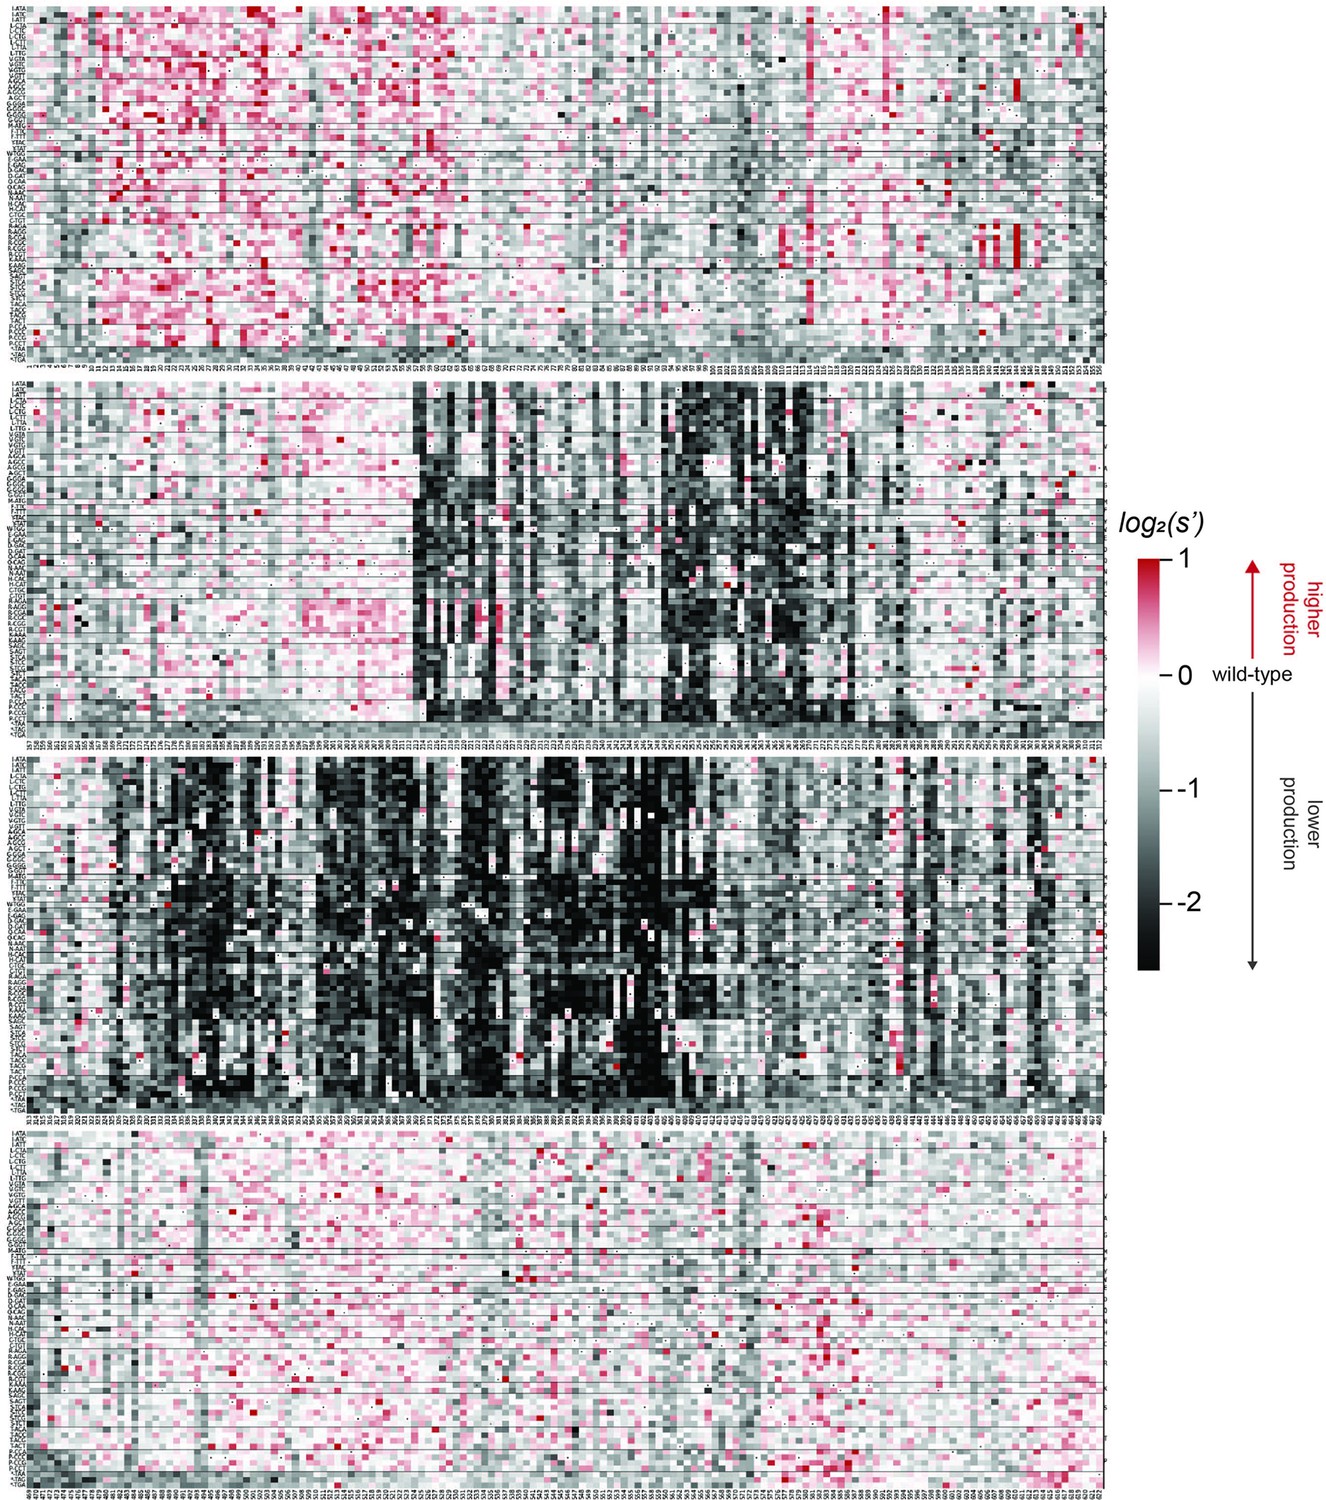
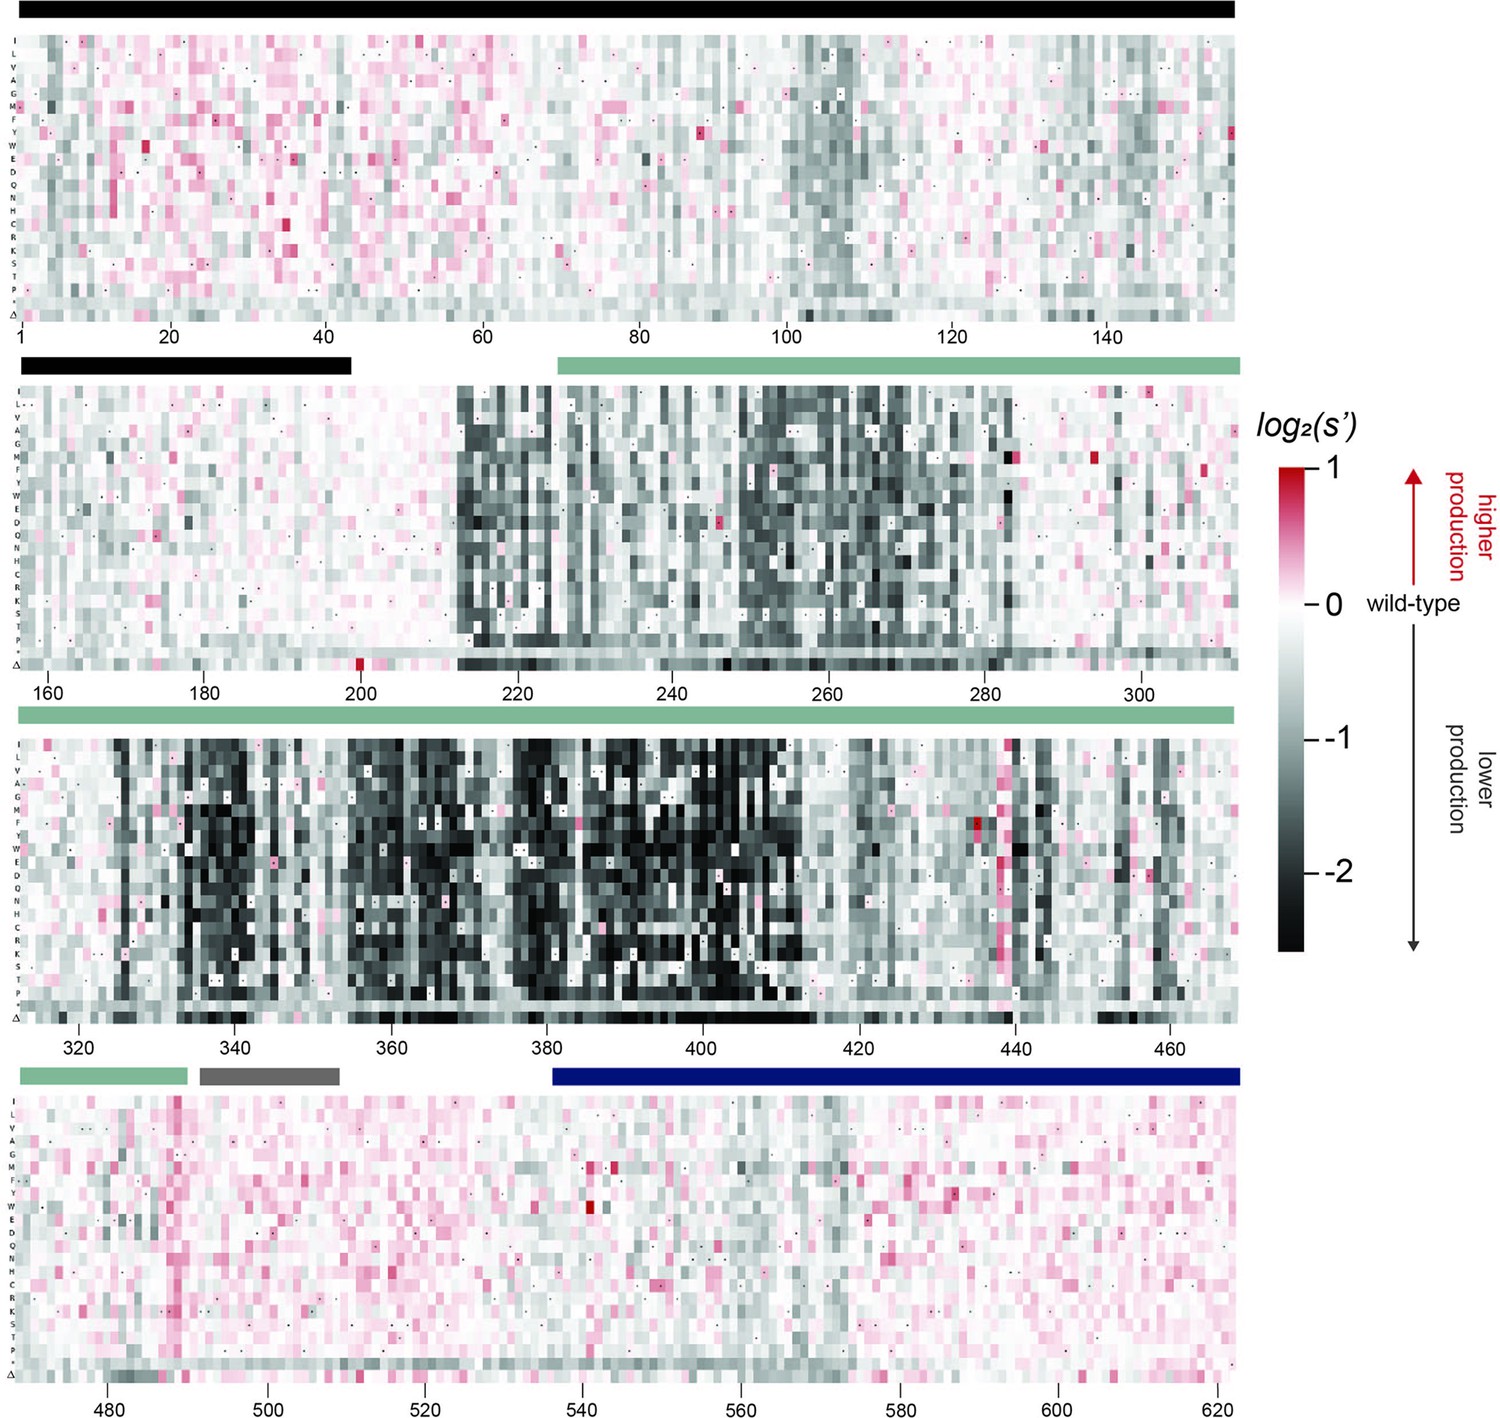
Effects of all single amino acid substitutions and deletions in the Rep78/68 proteins on AAV2 production.
Amino acid level production fitness values from the pCMV-Rep78/68 production assay were calculated as in Figure 1C by summing barcode counts for synonymous mutations. Rectangles are colored by mutational effect on the production of genome-containing particles, with black indicating deleterious mutations and red indicating beneficial mutations. Colored bars above the heatmaps indicate protein domains. Black: origin-binding domain; light blue: helicase domain; gray: nuclear localization signal; and navy blue: zinc-finger domain. Black dots indicate wild-type amino acid identity.
Figure 2—figure supplement 1
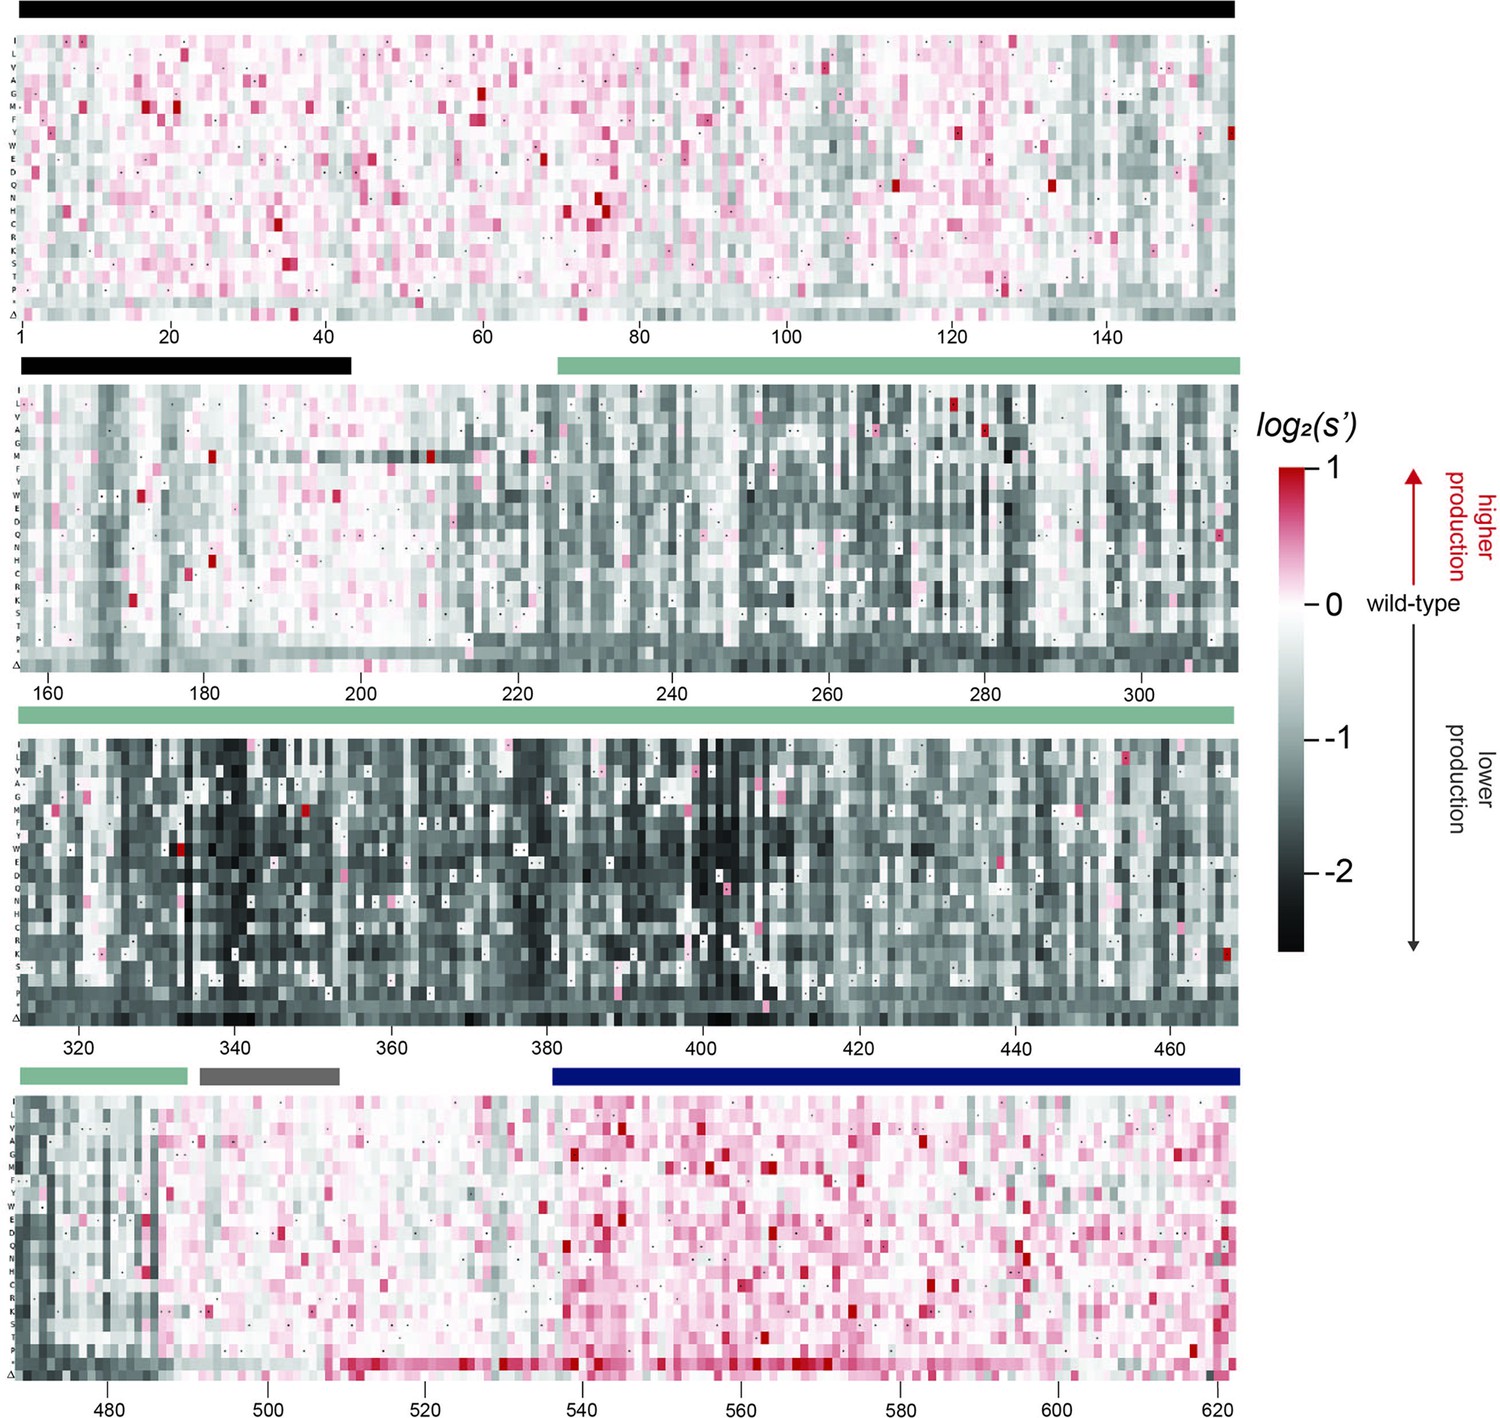
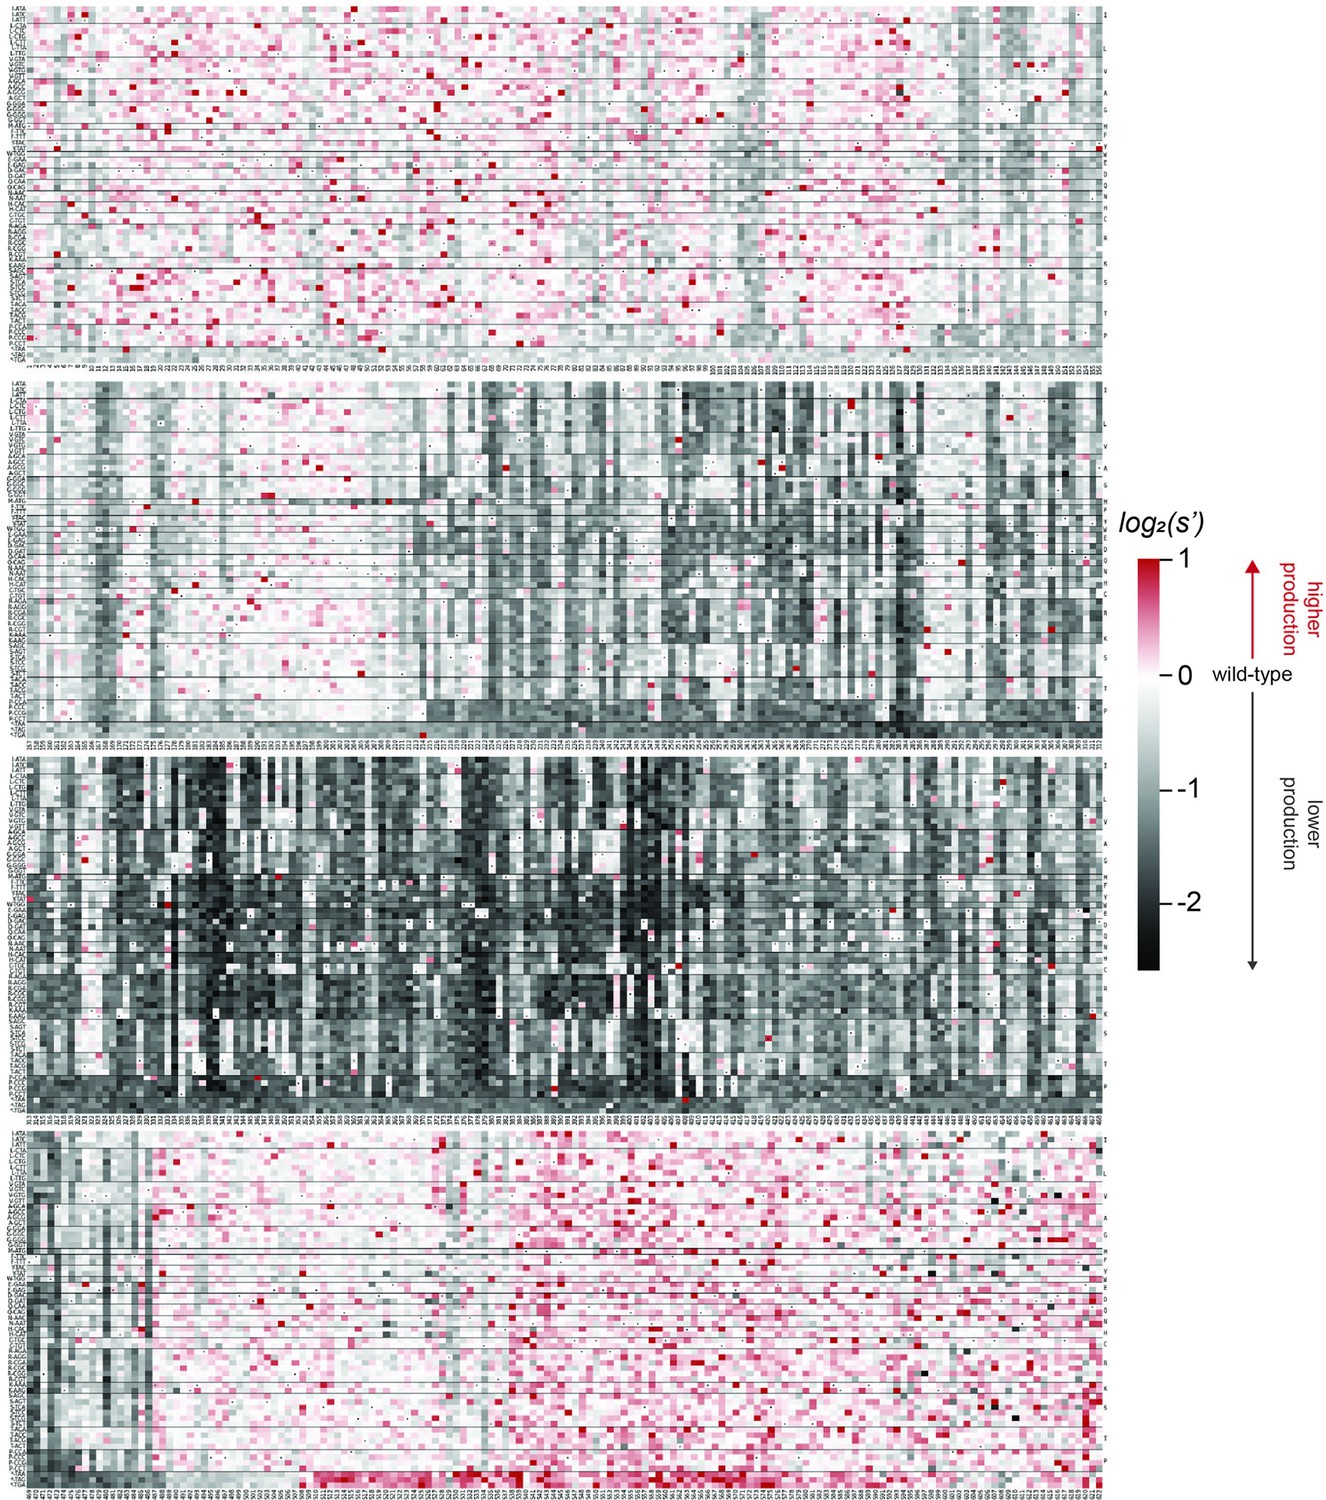
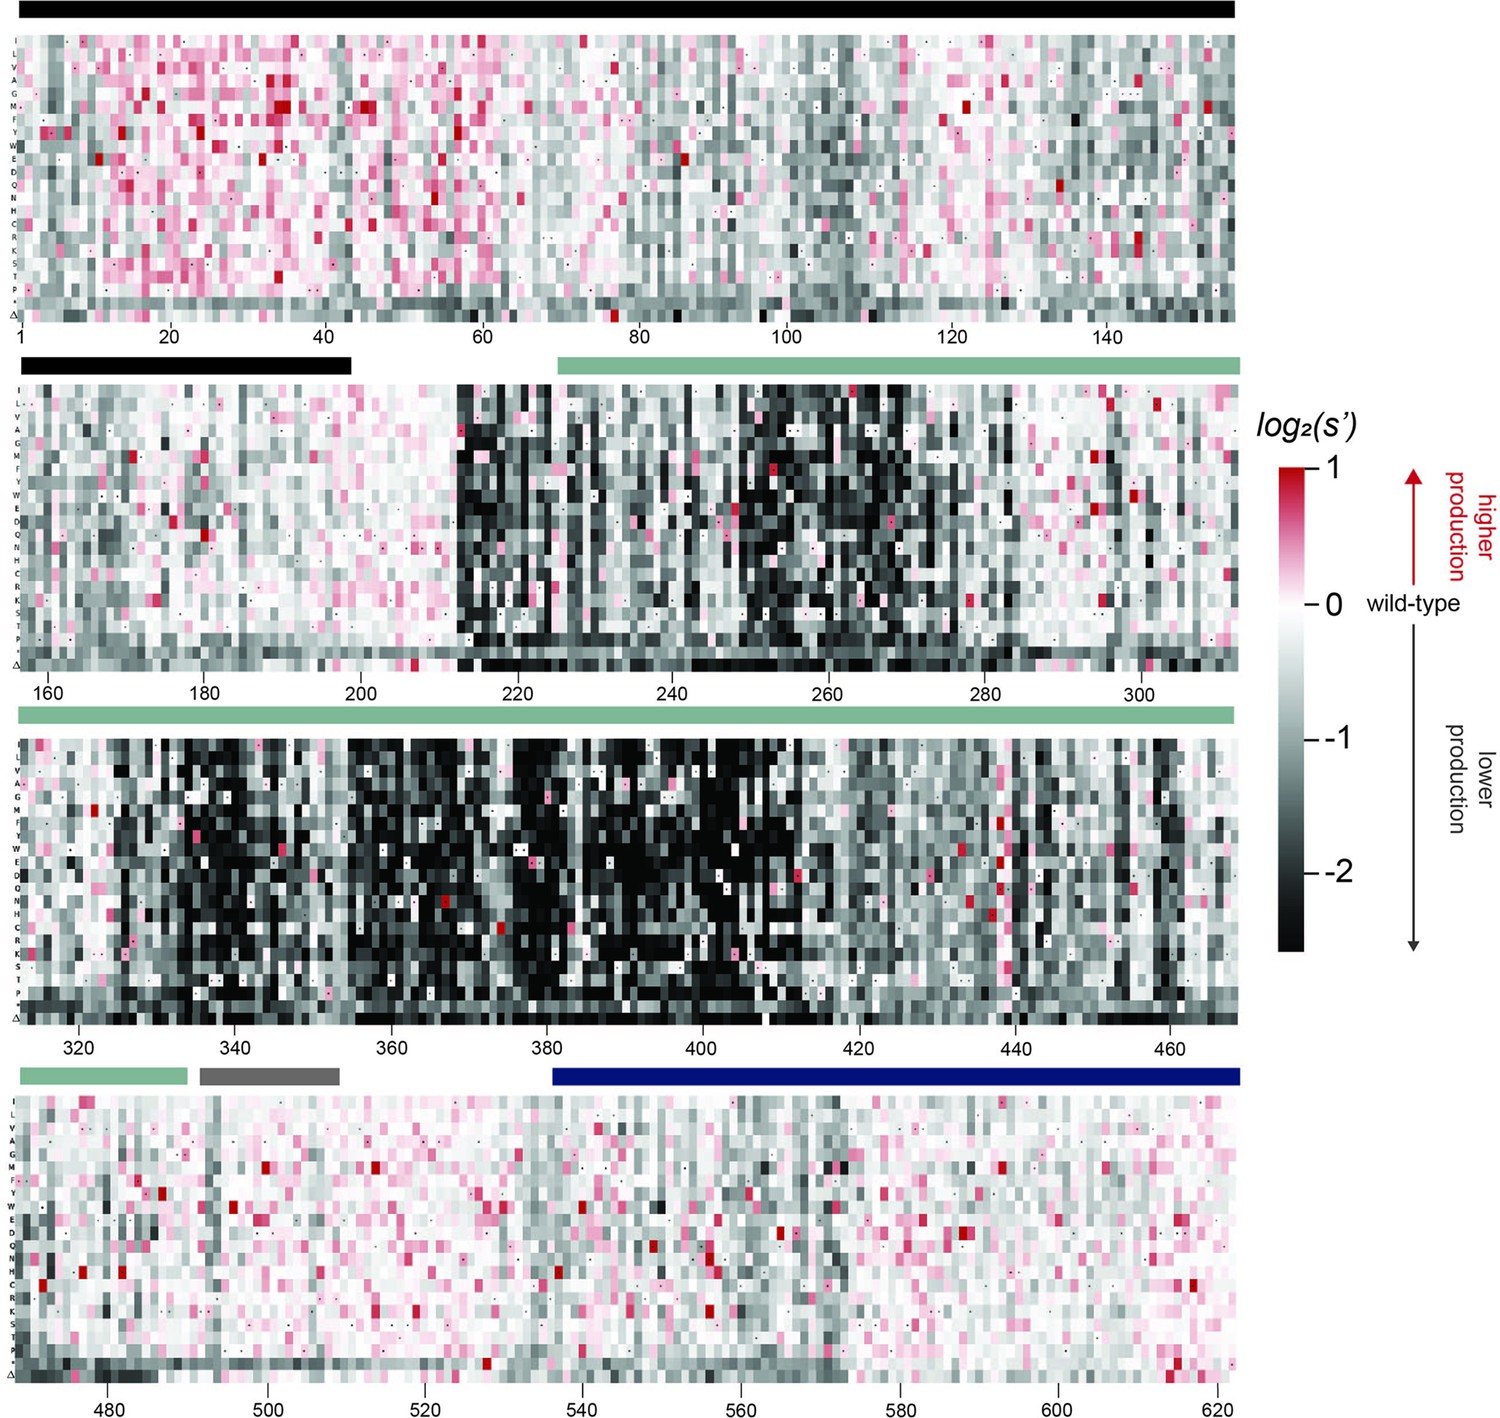
Effects of all single amino acid substitutions and deletions in Rep78, Rep68, Rep52, and Rep40 on AAV2 production.
Amino acid level production fitness values from the WT AAV2 library production assay were calculated as in Figure 1C by summing barcode counts for synonymous variants. Rectangles are colored by mutational effect on the production of genome-containing particles, with black indicating deleterious mutations and red indicating beneficial mutations. Colored bars above the heatmaps indicate protein domains. Black: origin-binding domain; light blue: helicase domain; gray: nuclear localization signal; and navy blue: zinc-finger domain. Black dots indicate wild-type amino acid identity.
Figure 2—figure supplement 2
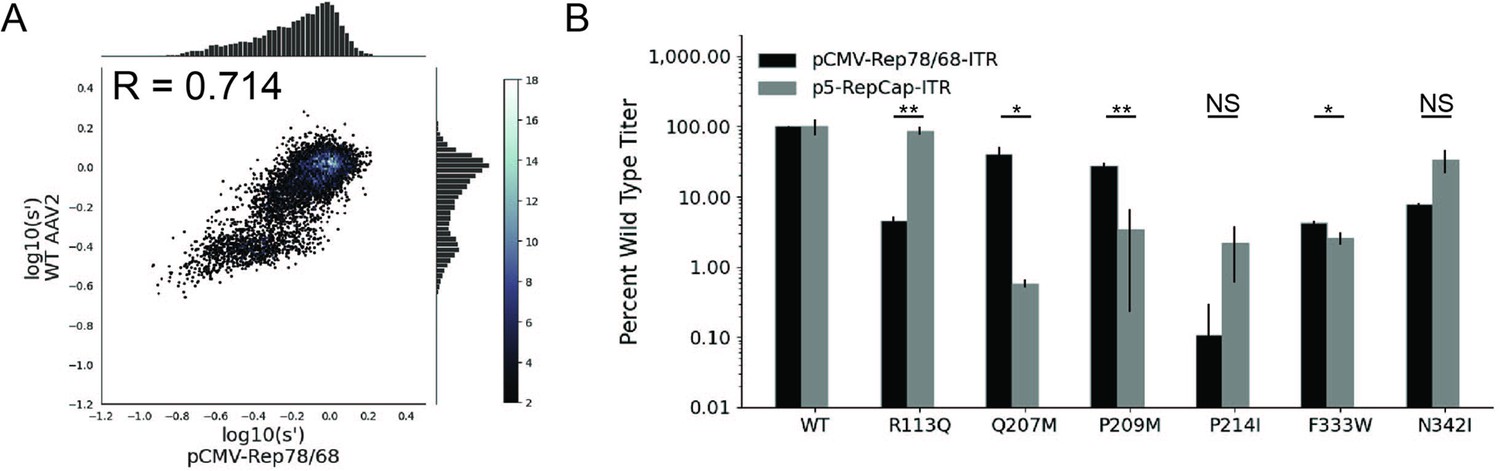
Mutations to AAV2 rep have similar effects on AAV2 production in pCMV-Rep78/68 and WT AAV2 format libraries.
(A) Production fitness values for library production assay with pCMV-Rep78/68 and WT AAV2 format libraries, Pearson R correlation coefficient calculated after log transformation, (B) DNase-resistant particle titers for AAV2 capsids produced with pCMV-Rep78/68-inverted terminal repeat or p5-RepCap-inverted terminal repeat plasmids containing the indicated Rep substitutions. *p<0.05, **p<0.01 (Welch’s t-test).
Figure 2—figure supplement 3
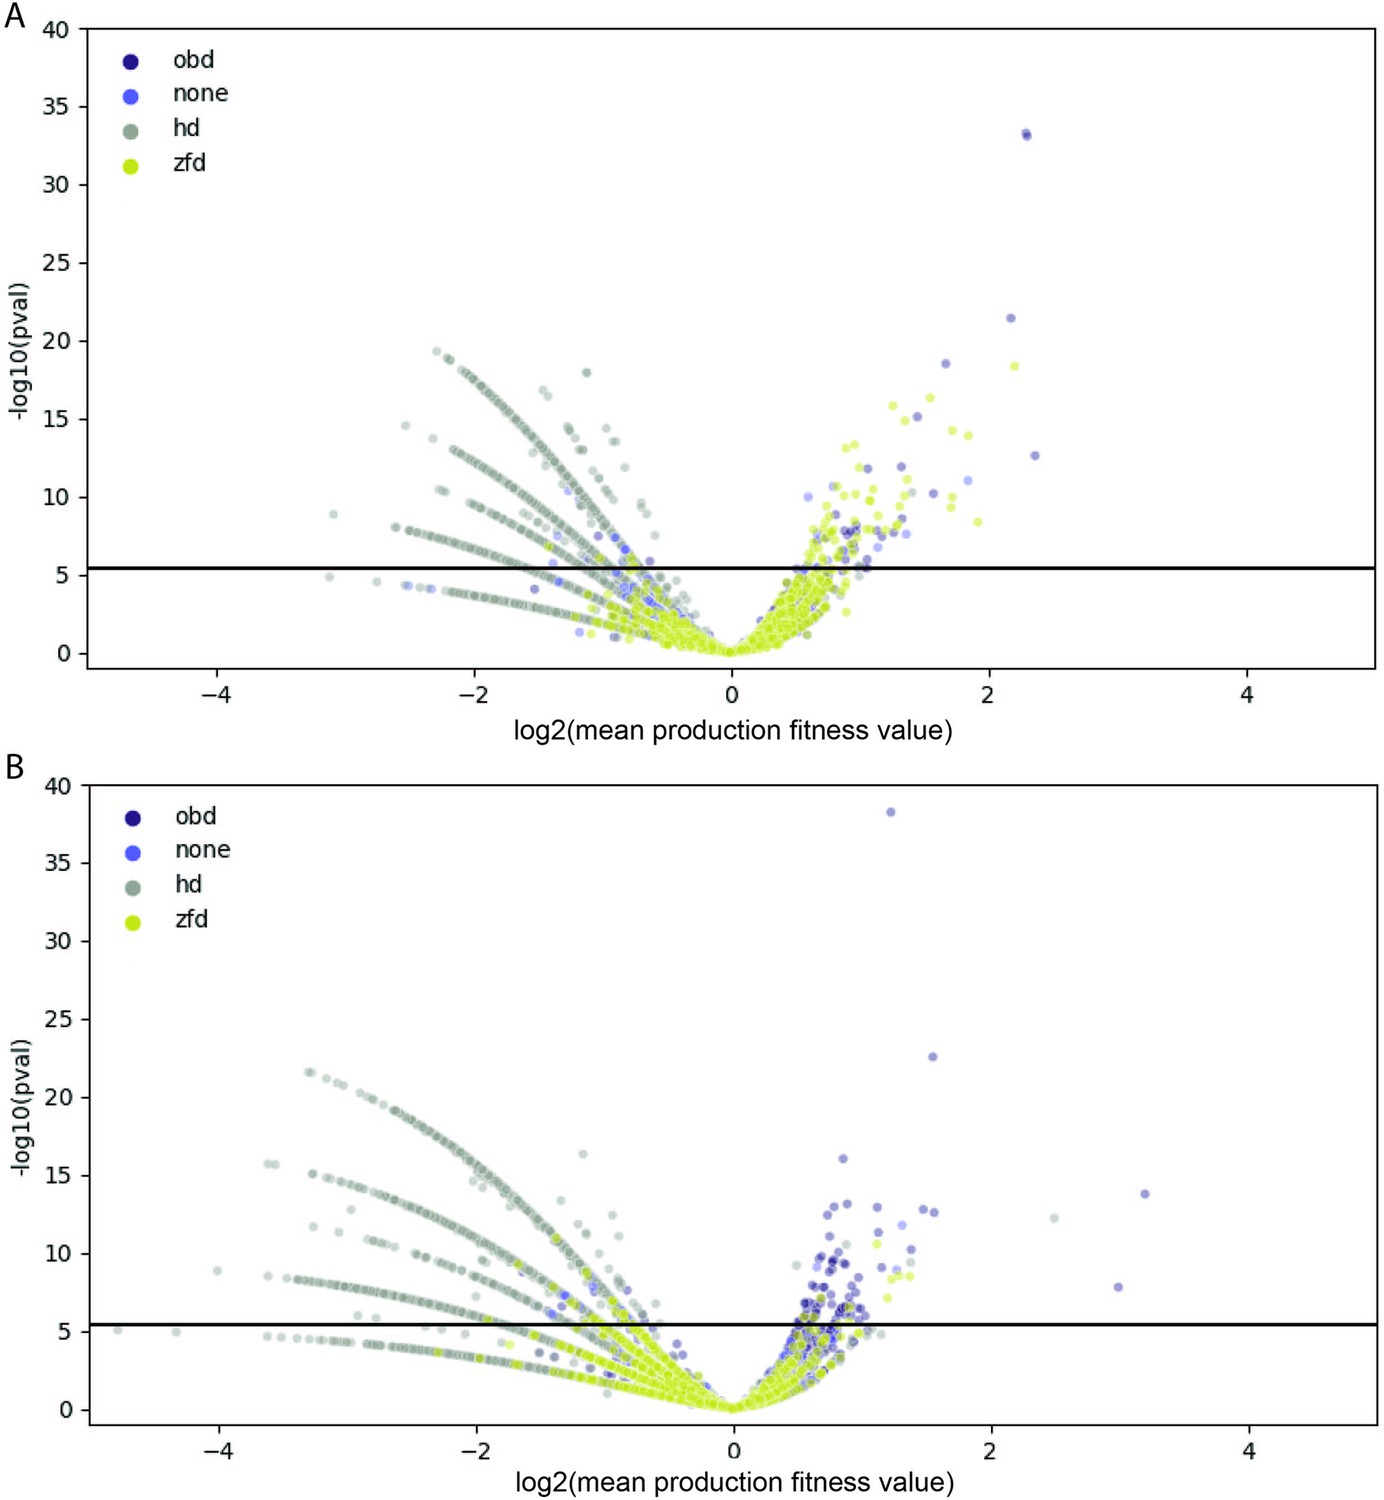
Comparison of Rep variant and wild-type production fitness values.
For each amino acid variant, mean production fitness values were calculated by averaging the production fitness values for all uniquely barcoded variants coding for the relevant amino acid change. The mean production fitness value for each amino acid variant was compared to the mean production fitness value for the wild-type controls using a t-test. (A) Data for the WT AAV2 library. (B) Data for the pCMV-Rep78/68 library. The solid black line indicates the significance threshold after Bonferroni correction. Data points are colored according to their position in Rep, where ‘none’ refers to variants that fall outside of an annotated protein domain.
Figure 2—figure supplement 4
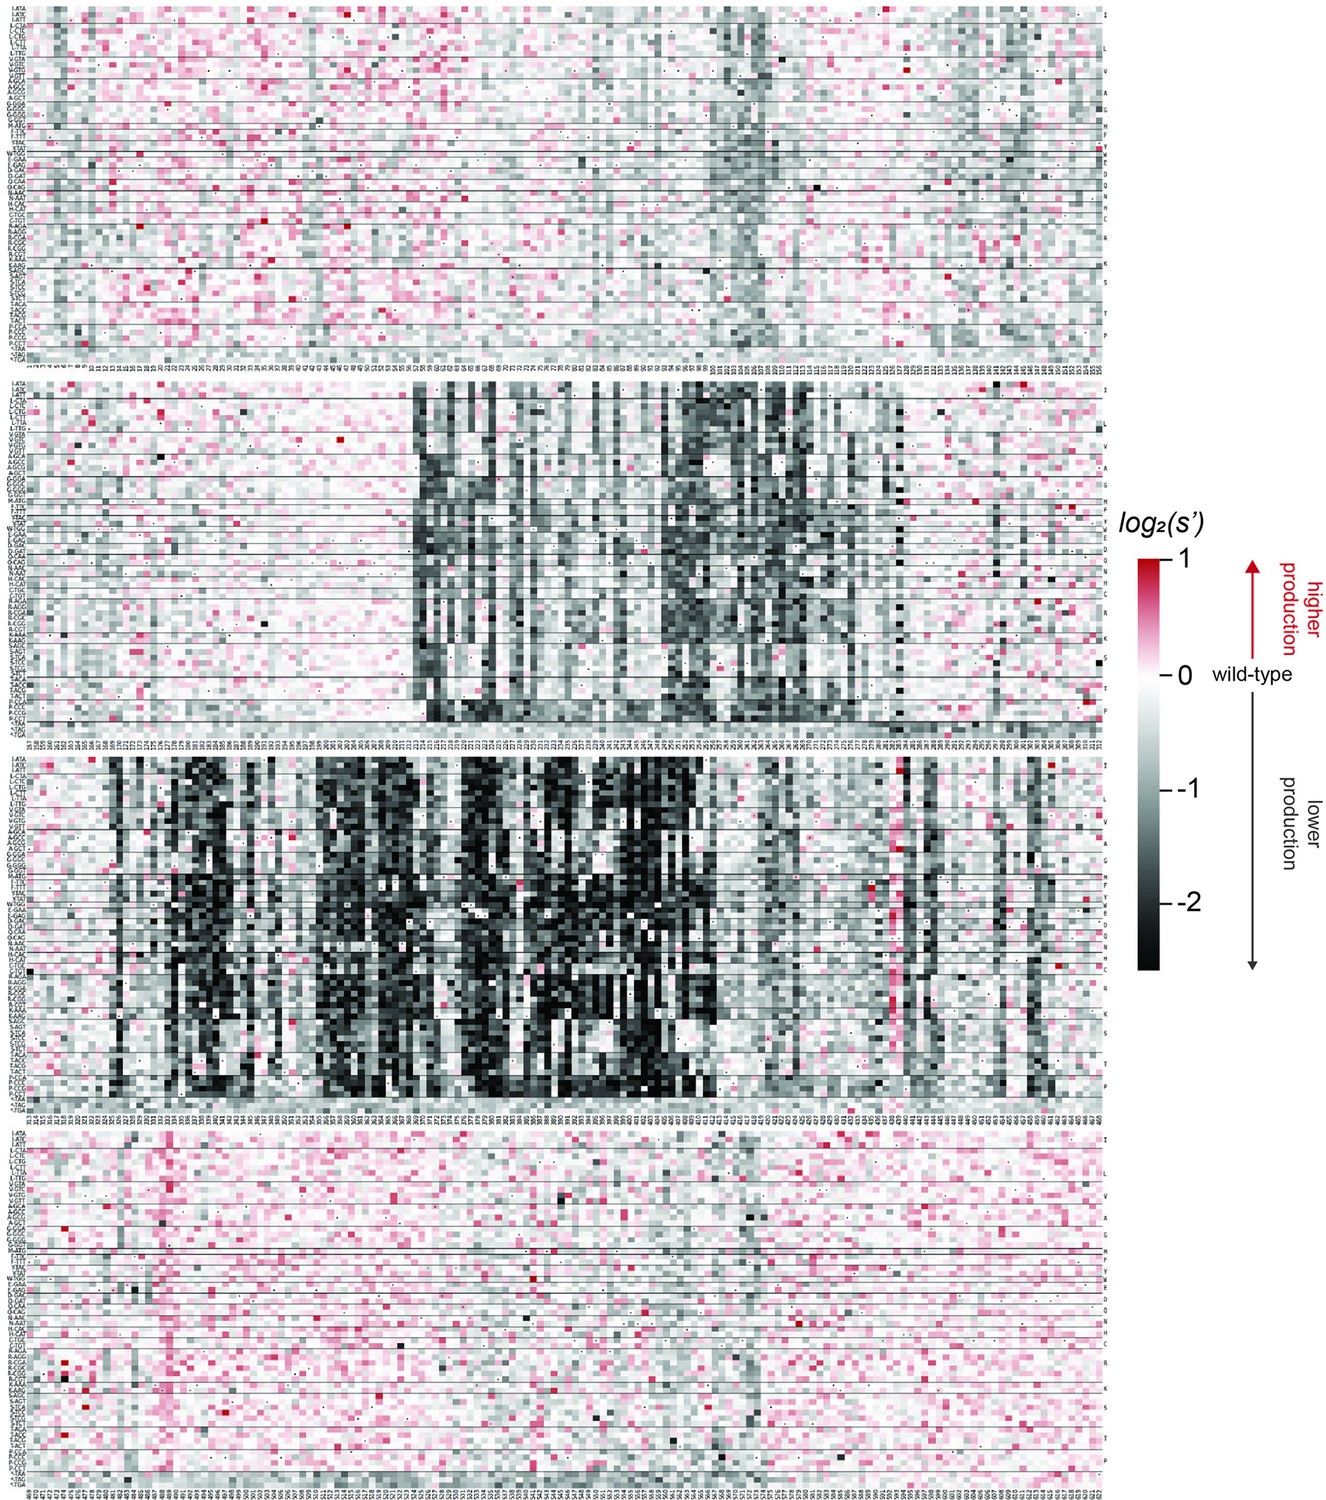
Codon level production fitness values for the pCMV-Rep78/68 format library.
Codon level production fitness values were calculated as in Figure 1C by summing counts for all barcodes corresponding to a given codon variant. Rectangles are colored by mutational effect on the production of genome-containing particles, with black indicating deleterious mutations and red indicating beneficial mutations. Black dots indicate wild-type codon identity.
Figure 2—figure supplement 5
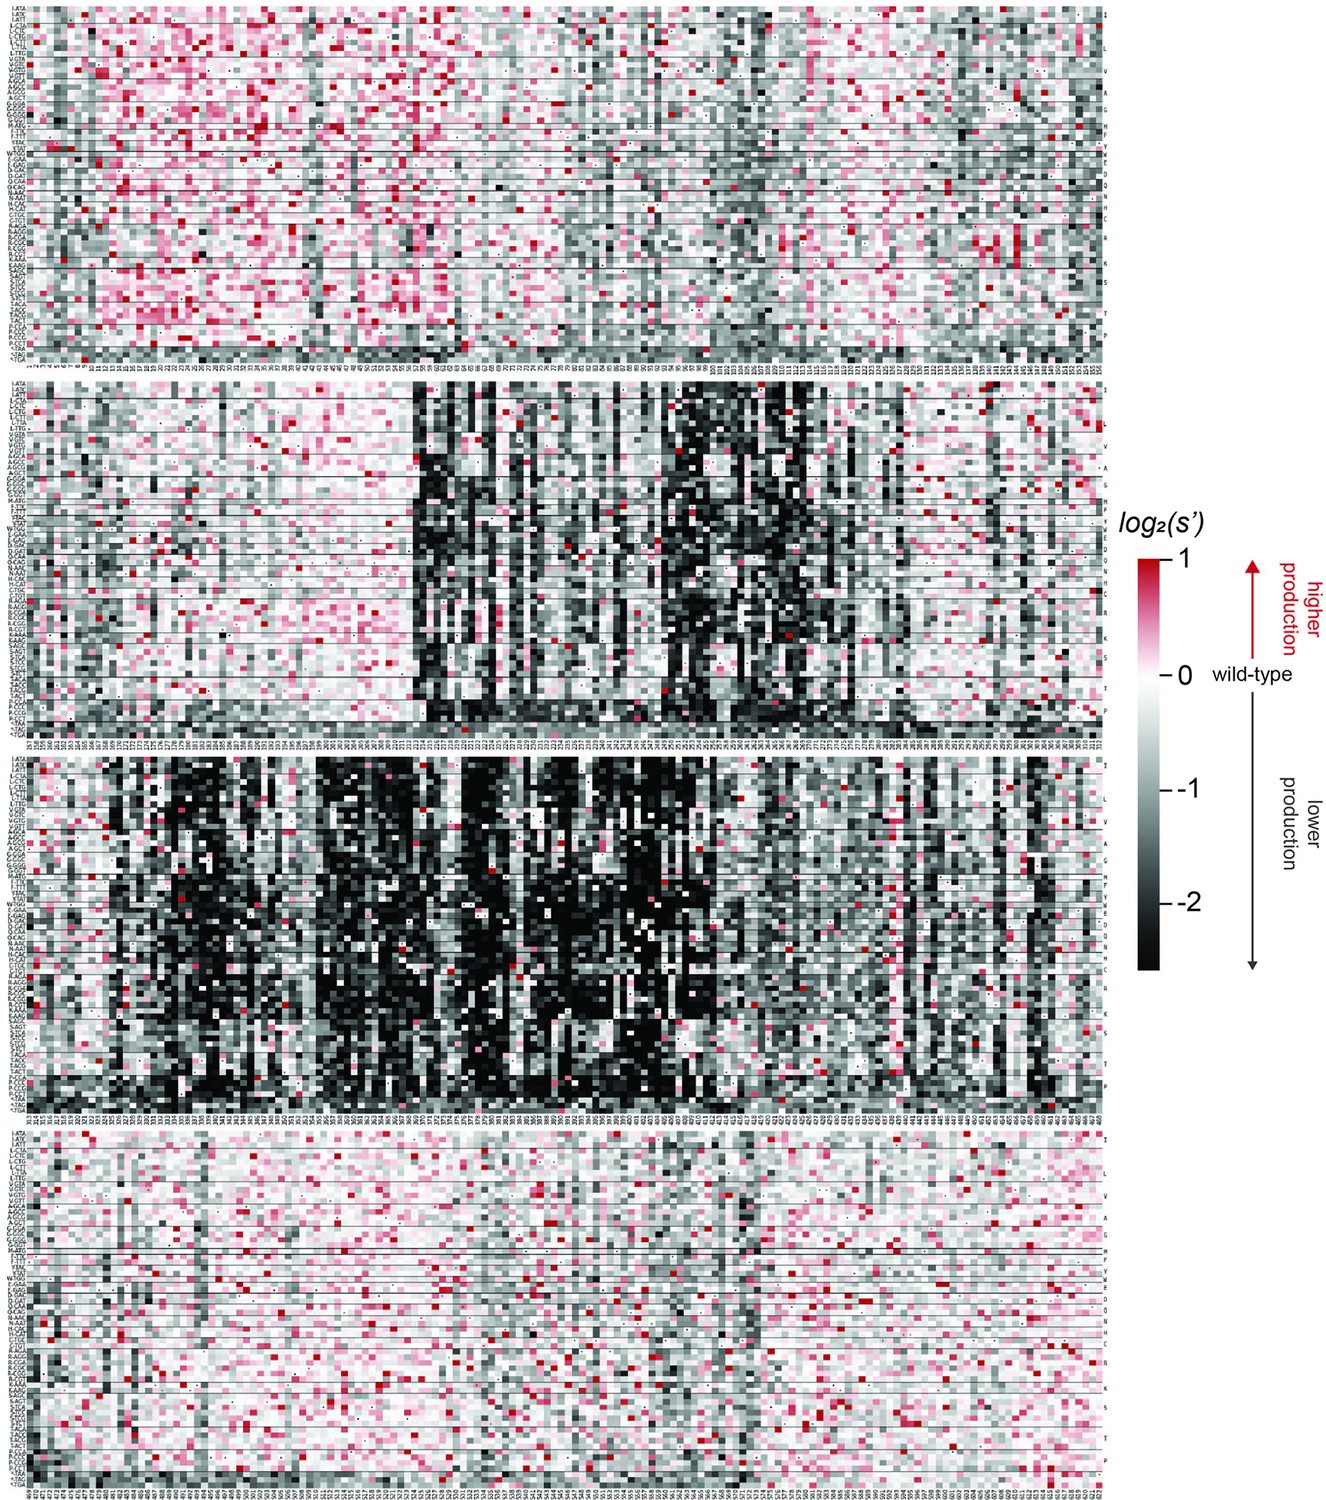
Codon level production fitness values for the WT AAV2 format library.
Codon level production fitness values were calculated as in Figure 1C by summing counts for all barcodes corresponding to a given codon variant. Rectangles are colored by mutational effect on the production of genome-containing particles, with black indicating deleterious mutations and red indicating beneficial mutations. Black dots indicate wild-type codon identity.
Figure 2—figure supplement 6
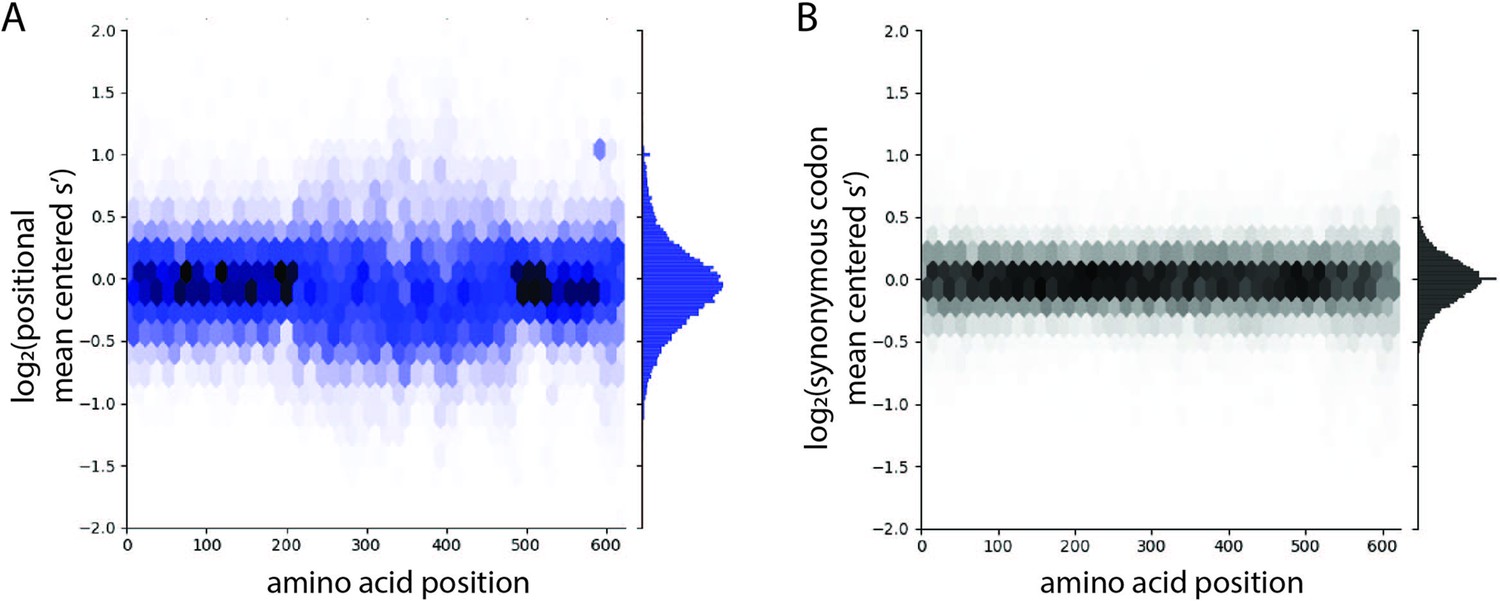
The distribution of production fitness values is narrower for synonymous variants than for nonsynonymous variants.
(A) Positional mean-centered fitness values for all codon variants in the WT AAV2 library and (B) synonymous codon mean-centered fitness values for all codon variants in the WT AAV2 library. For each codon variant, positional mean-centered fitness values were calculated by normalizing to the average selection value of all codon variants at that position. Synonymous mean-centered fitness values were calculated by normalizing the fitness values of each codon variant to the average fitness value of all its synonymous codons.
Figure 2—figure supplement 7
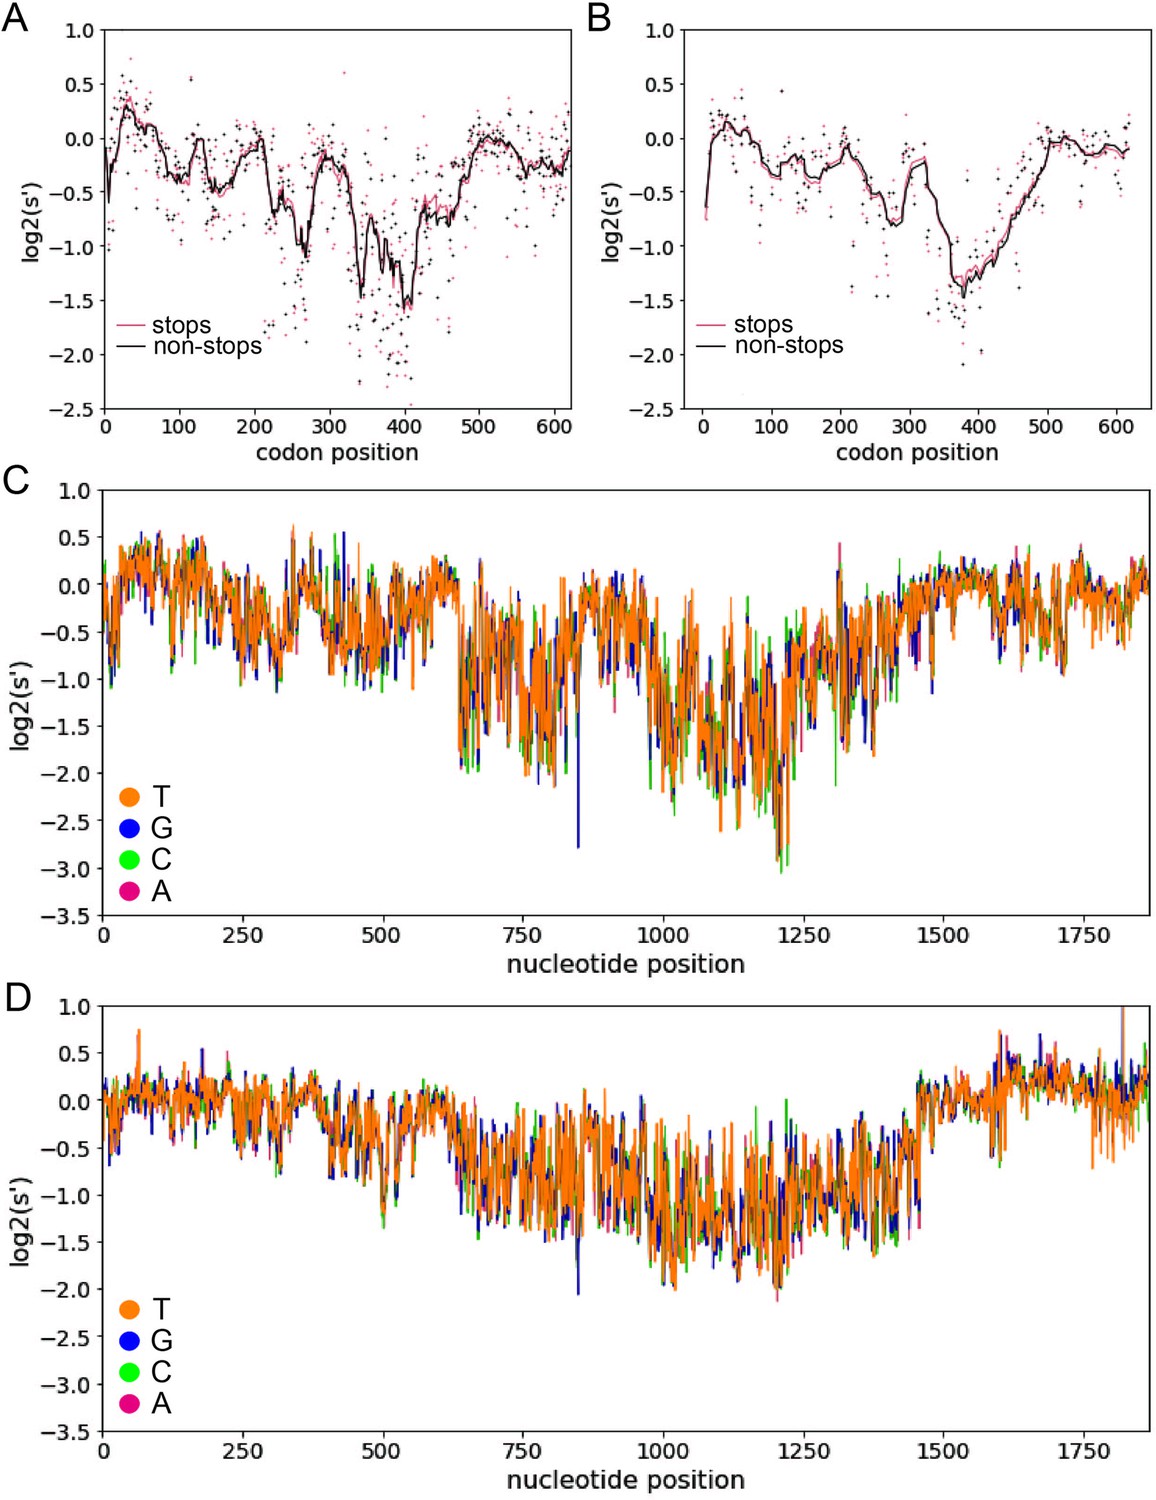
Inclusion of synonymous codon variants enables interrogation of nucleotide-level effects.
Analysis of pCMV-Rep78/68 variants with premature stop codons in +1 (A) and +2 (B) reading frames does not identify any frameshifted open-reading frames. Pink dots: average production fitness for mutations that introduce stop codons into +1 or +2 frame; black dots: average production fitness for mutations synonymous to +1 or +2 stop codon mutations in Rep open-reading frame, lines indicate 10 bp rolling averages. (C) Average production fitness at each nucleotide position for variants that introduce the indicated nucleotide change in the pCMV-Rep78/68 library. Orange: T; blue, G; green: C; red: A. (D) Average production fitness for variants that introduce the indicated nucleotide change in the WT AAV2 library.
Figure 3 with 1 supplement
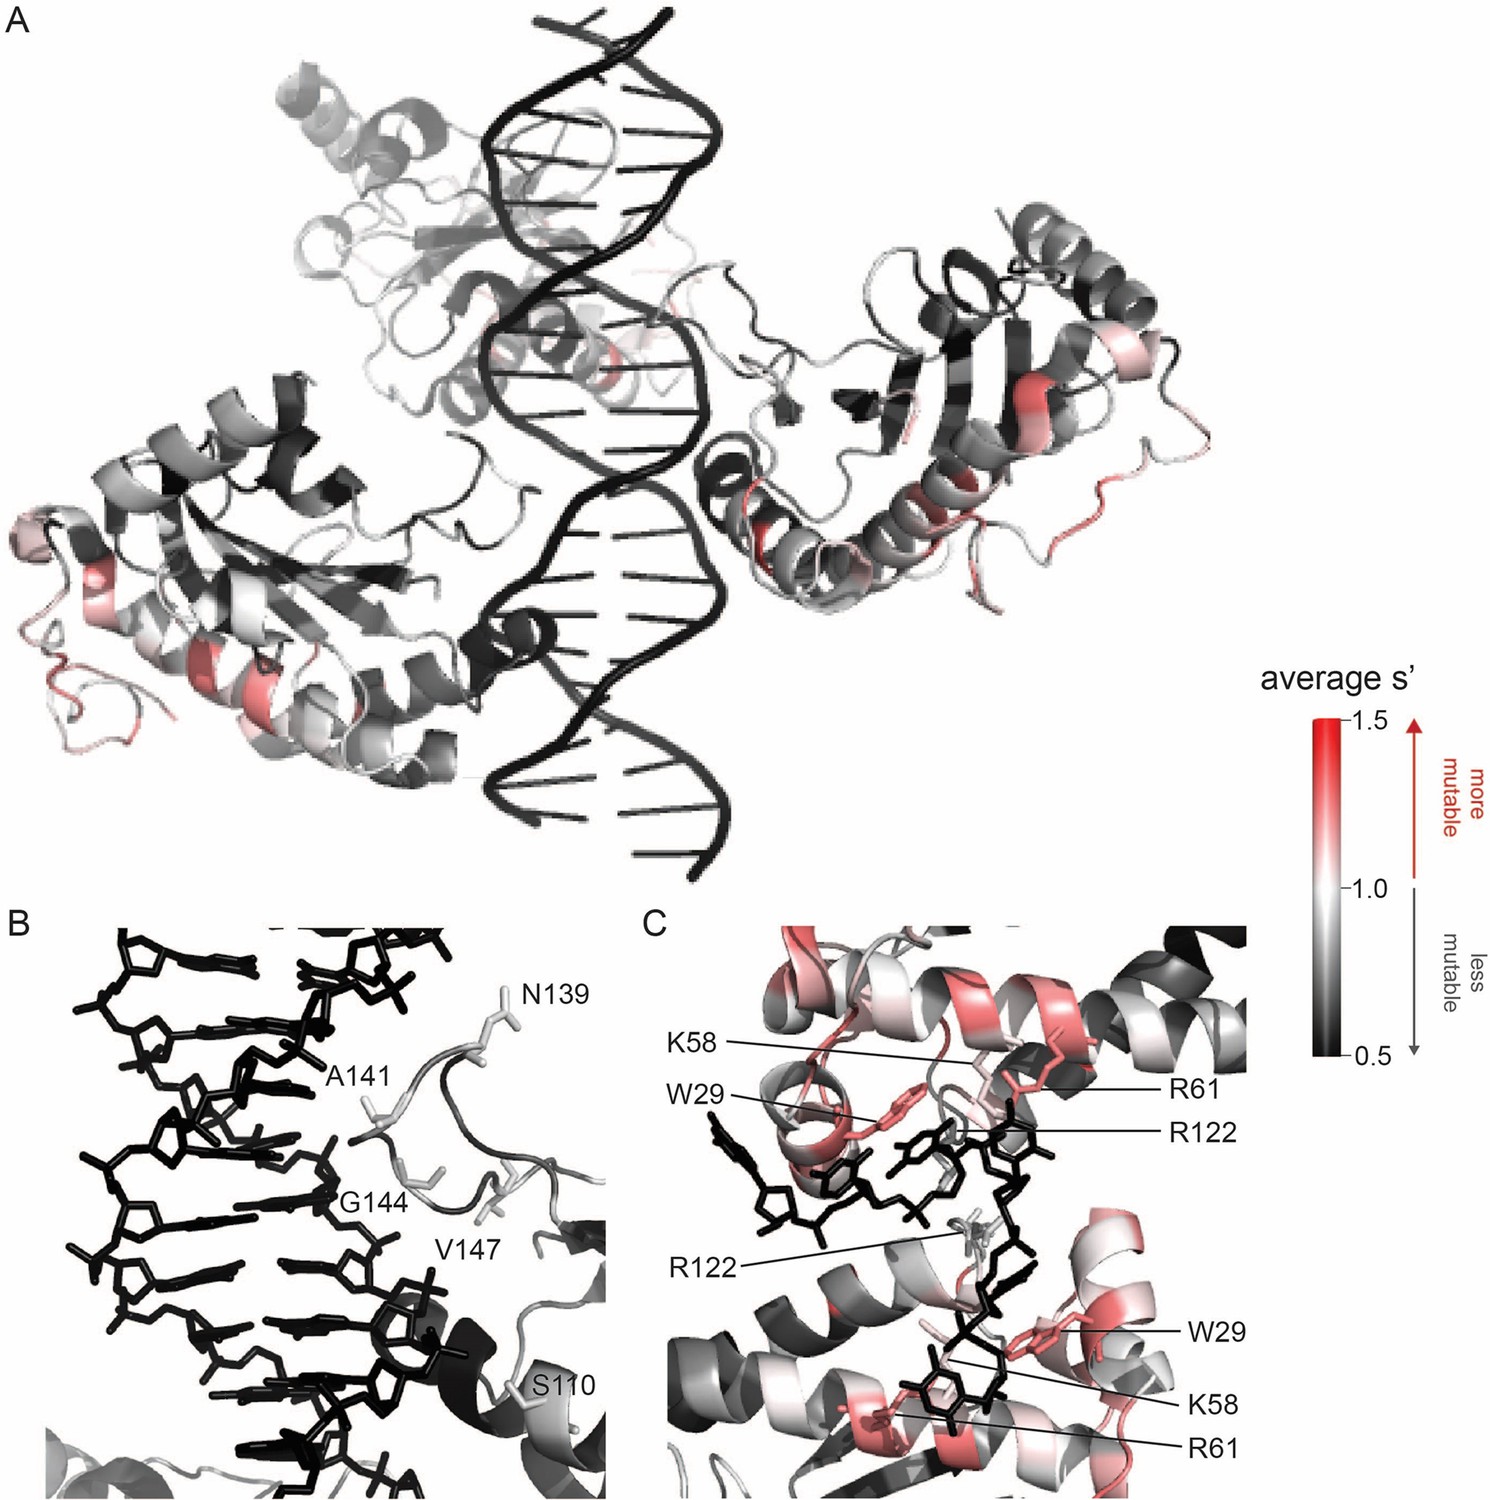
Beneficial substitutions cluster in DNA-interacting residues.
(A) Average production fitness values for all substitutions at each position mapped onto the structure of the origin-binding domain in complex with the AAVS1 Rep-binding site (PDB 4ZQ9). (B) Closeup view of origin-binding domain–Rep-binding site interactions. Residues where substitutions to positively charged residues are beneficial are shown as sticks. (C) Average production fitness values mapped onto the structure of the origin-binding domain in complex with the single-stranded inverted terminal repeat hairpin (PDB 6XB8). DNA-interacting residues are shown as sticks. Residues are colored by mutability, with red indicating higher mutability and black indicating lower mutability.
Figure 3—figure supplement 1
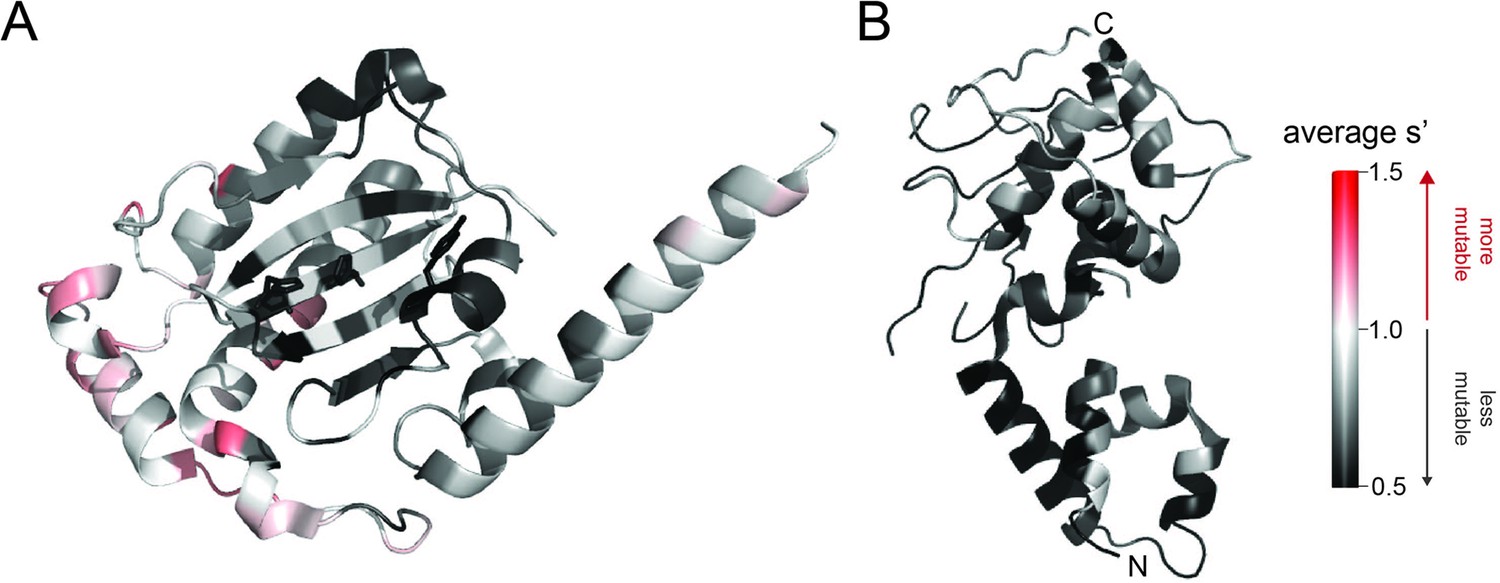
Average production fitness values from the pCMV-Rep78/68 library production assay mapped onto (A) the structure of the origin-binding domain active site (PDB 5DCX) and (B) the structure of the helicase domain (PDB 1S9H).
H90, H92, and the active site nucleophile, Y156, are shown as sticks in (A). Residues are colored by mutability, with red indicating higher mutability and black indicating lower mutability.
Figure 4
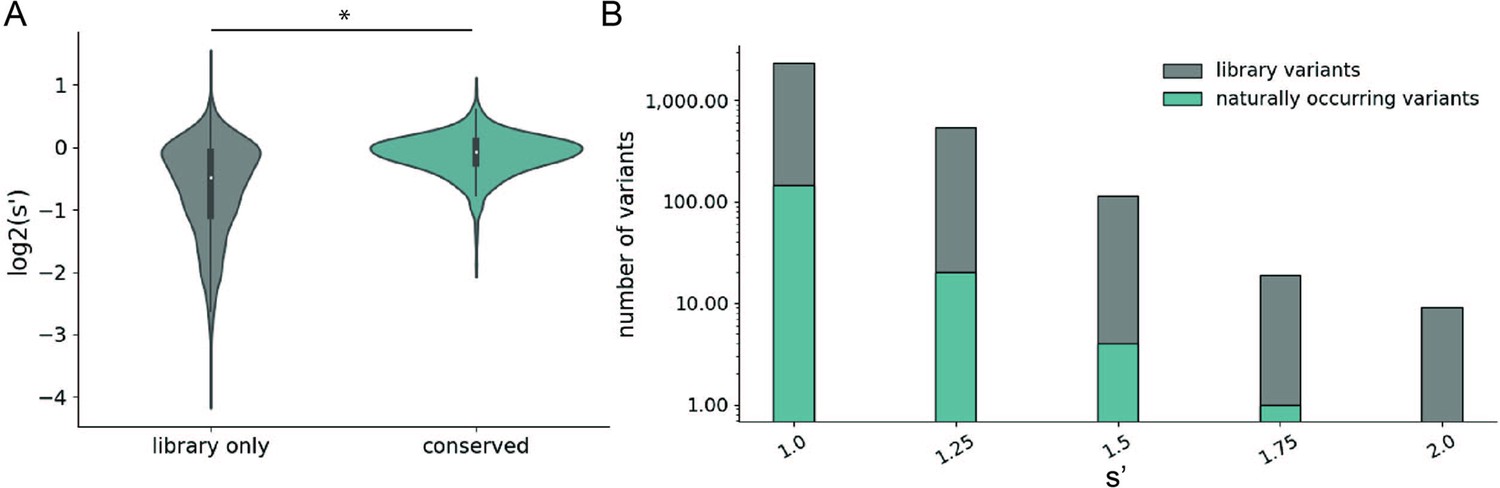
Comparison of comprehensive mutagenesis measurements to variation in nature.
(A) Distribution of wild-type normalized production fitness values for conserved variants (blue) and variants found only in the library (gray). (B) Total number of variants and number of conserved variants with s′ greater than wild-type (s′ > 1). *p<10–20 (Mann–Whitney U-test).
Figure 5 with 1 supplement
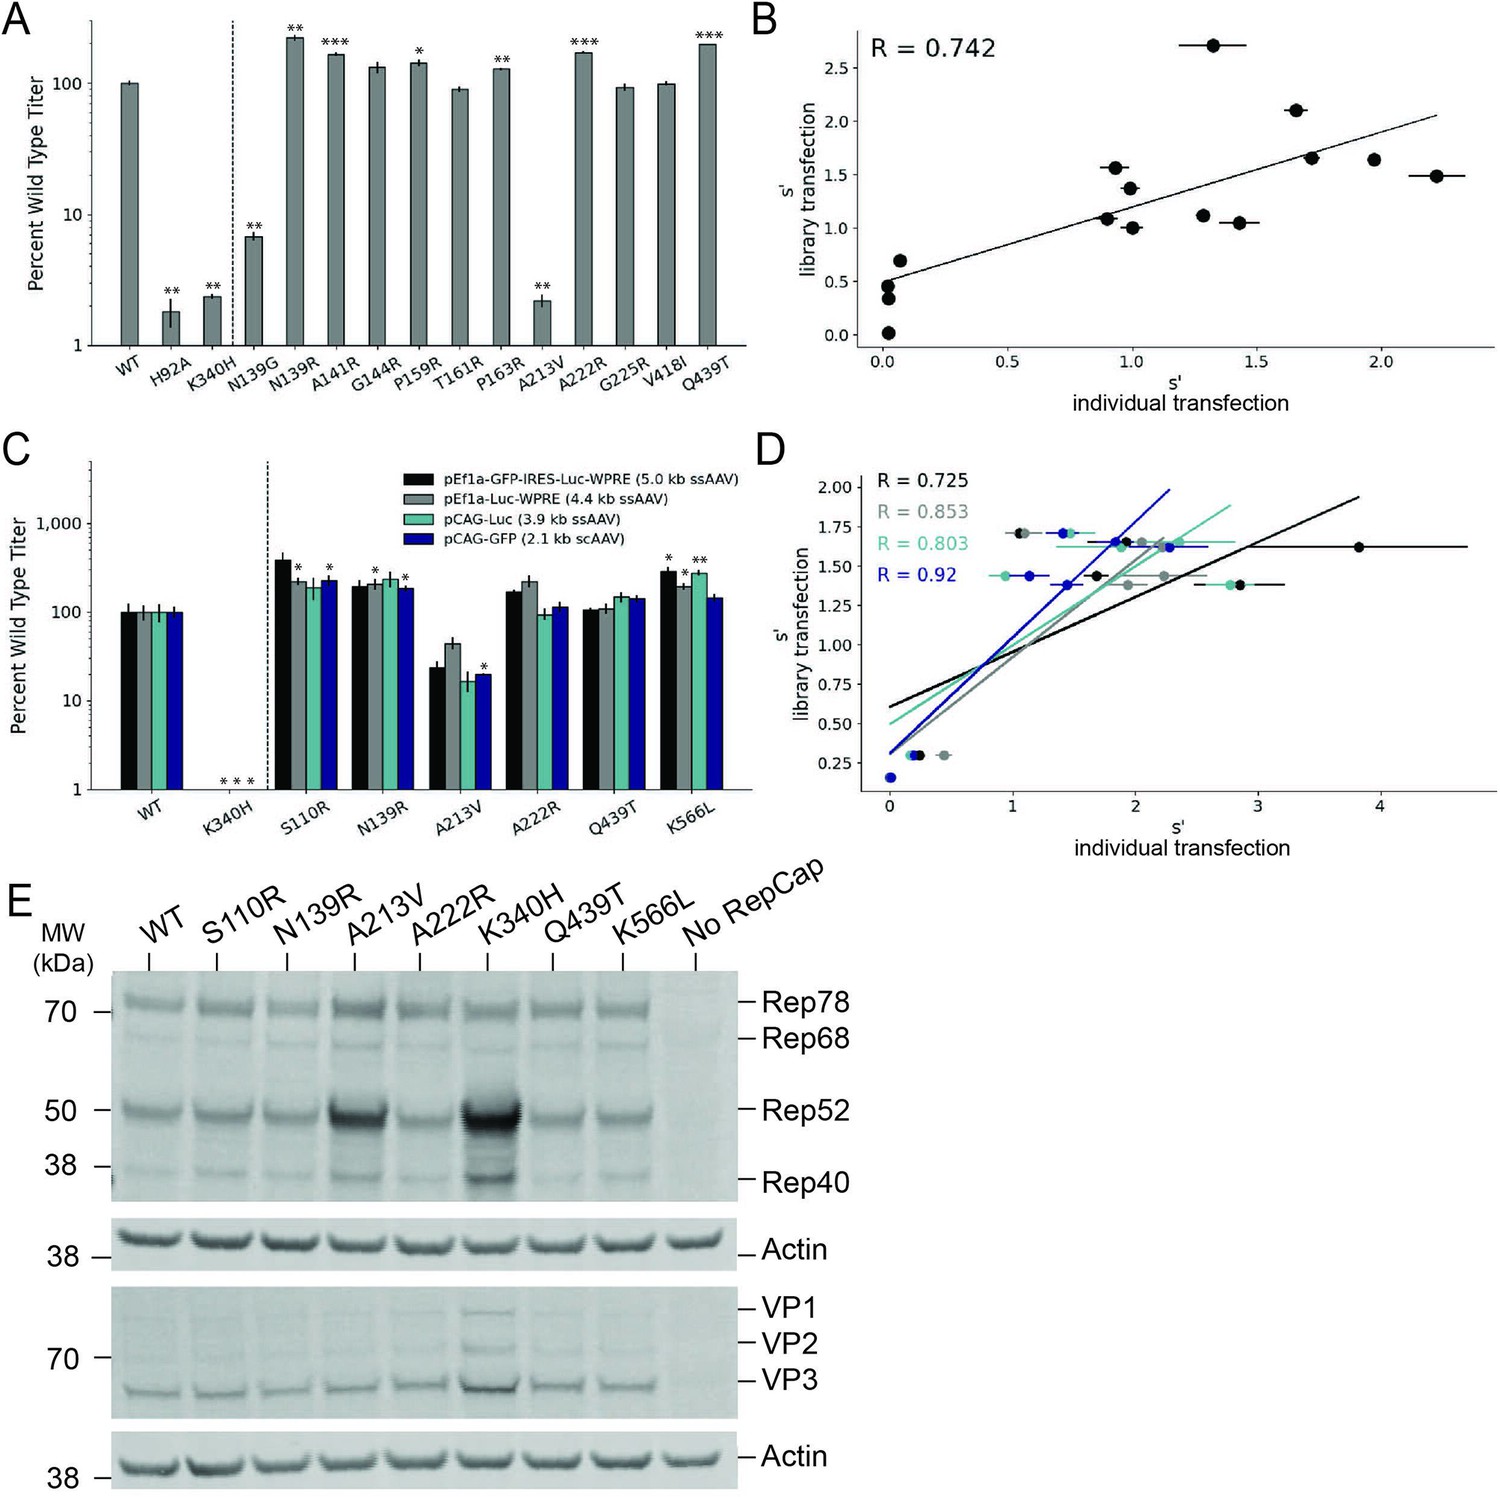
Validation of AAV2 library production assay results.
(A) DNase-resistant particle titers for 14 single amino acid pCMV-Rep78/68-inverted terminal repeat variants produced individually. Titers for previously characterized variants are plotted to the left of the dotted line. (B) Relationship between normalized production fitness values from library experiments and DNase-resistant particle titers from individual transfections. (C) DNase-resistant particle titers for four recombinant adeno-associated virus (rAAV) genomes produced with the indicated Rep variants. Titers for previously characterized variants are plotted to the left of the dotted line. (D) Relationship between rAAV DNase-resistant particle titers and normalized production fitness values from library experiments. (E) Expression of Rep and VP proteins from variant pRepCap plasmids by western blot. For panels (A) and (C), asterisks indicate significance of titer differences between the Rep variant and the relevant wild-type control. *p<0.05, **p<0.01, ***p<0.001 (Welch’s t-test).
Figure 5—figure supplement 1
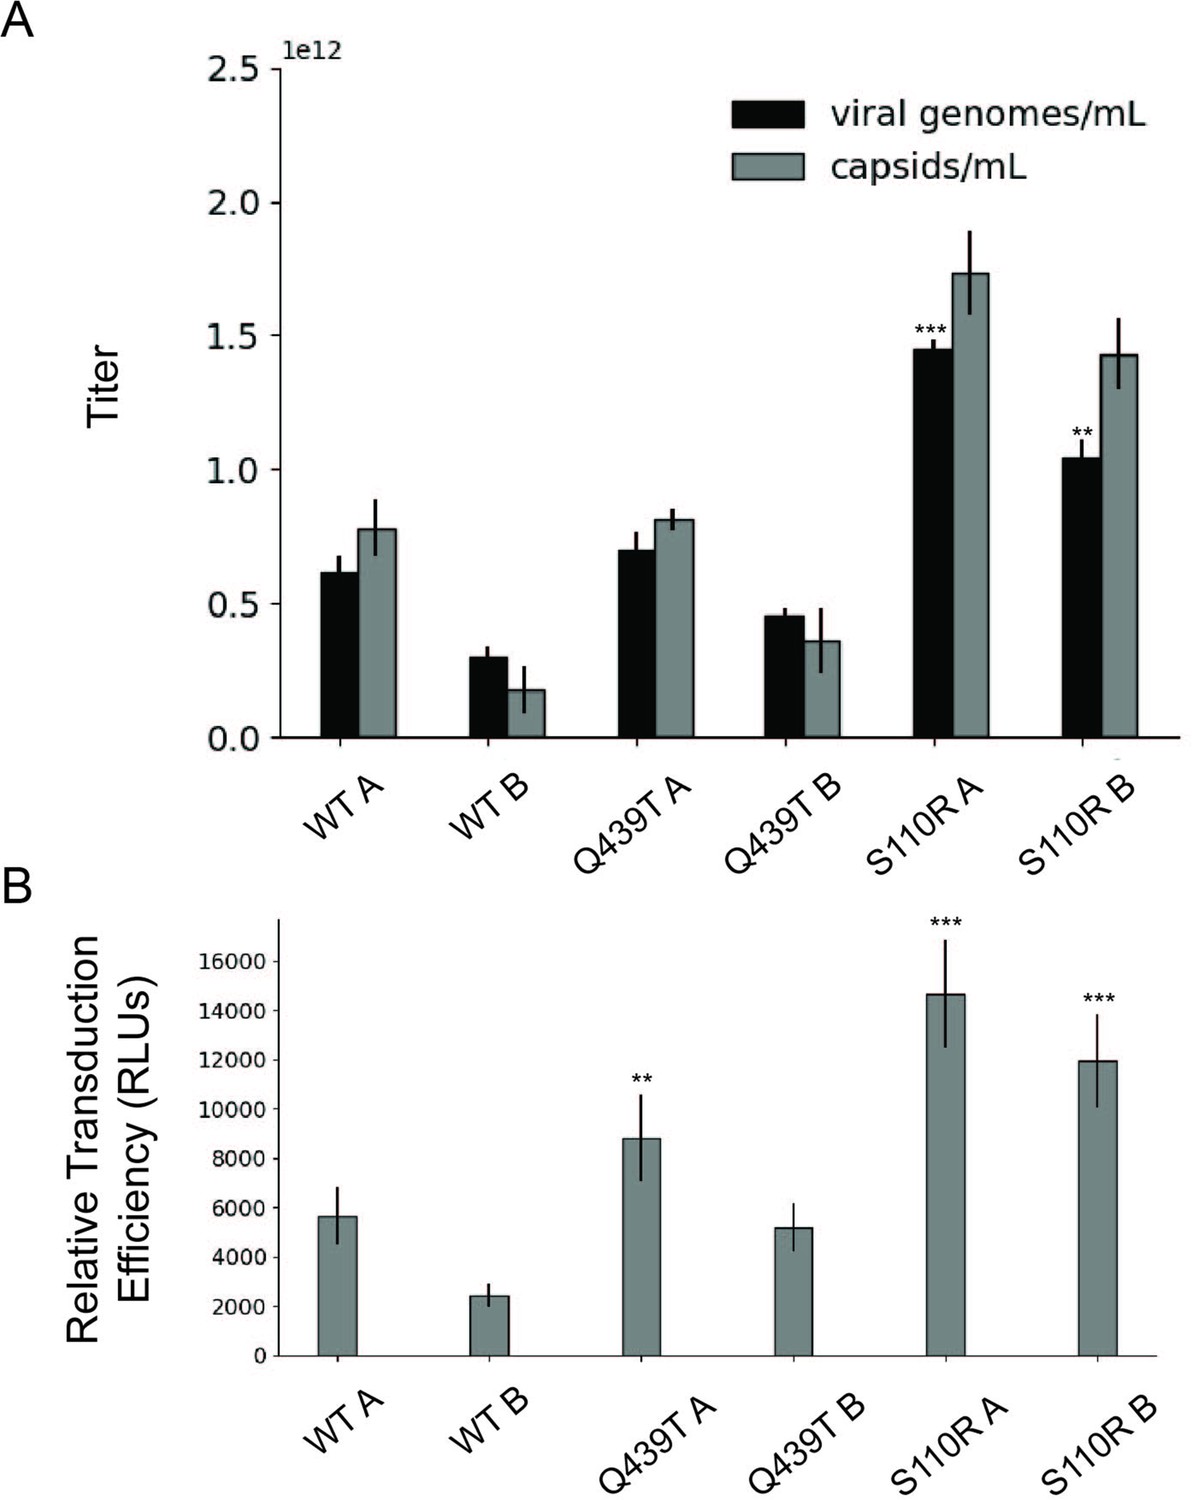
Effect of single amino acid Rep substitutions on the viral genome titer, physical particle titer, and relative transduction efficiency of affinity purified rAAV2.
(A) Capsid (gray) and viral genome (black) titers for pAAV-EF1a-FLuc-WPRE-HGHpA rAAV2 produced with the indicated Rep variant and affinity purified with AVB Sepharose. For each variant, samples A and B represent replicate transfections and affinity purifications. (B) Relative transduction efficiency of purified recombinant adeno-associated virus (rAAV) preps as measured by luciferase signal. Asterisks indicate significance of difference between relevant prep and WT A prep. *p<0.05, **p<0.01, ***p<0.001 (Welch’s t-test).
Figure 6 with 5 supplements
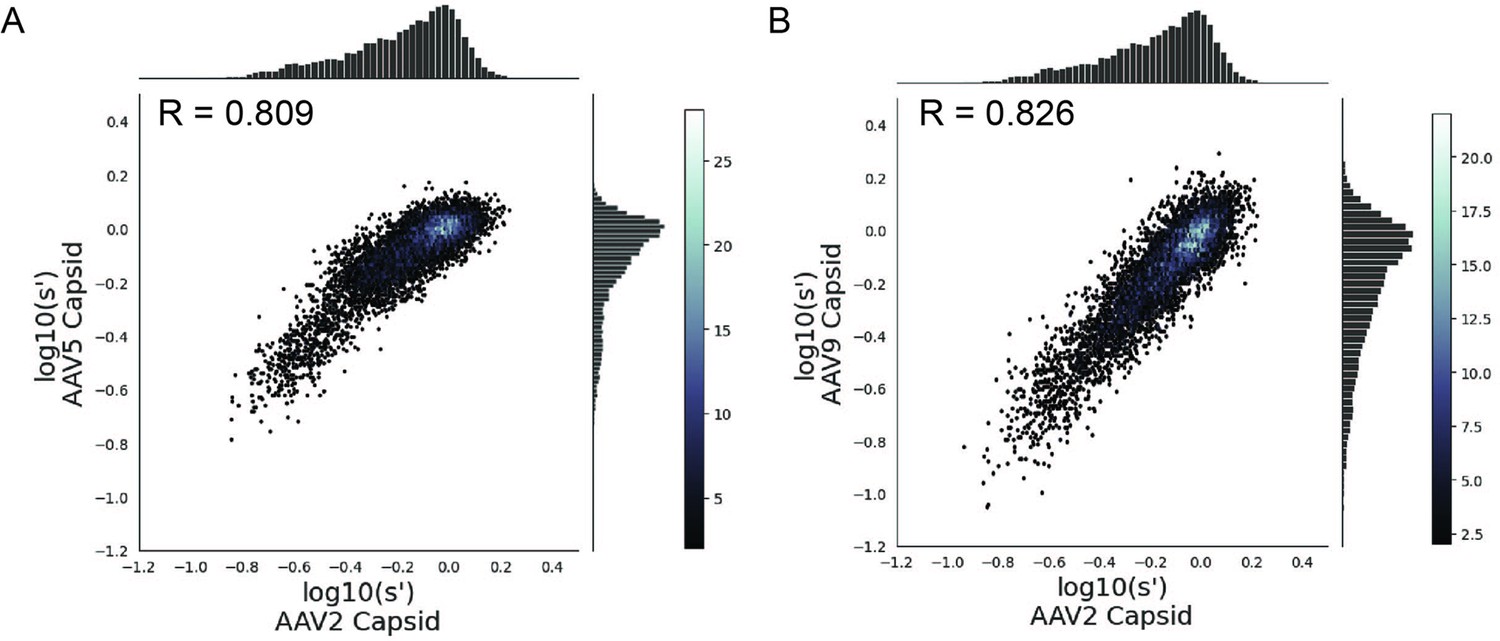
Mutations to AAV2 rep have similar effects on AAV2, AAV5, and AAV9 capsid production.
Wild-type normalized production fitness values from the library production assay with (A) AAV5 and AAV2 capsids and (B) AAV9 and AAV2 capsids. Pearson R correlation coefficient calculated after log transformation.
Figure 6—figure supplement 1
Effects of all single amino acid substitutions and deletions in the Rep78/68 proteins on AAV5 capsid production.
Amino acid level production fitness values from the pCMV-Rep78/68 production assay were calculated as in Figure 1C by summing barcode counts for synonymous mutations. Rectangles are colored by mutational effect on the production of genome-containing particles, with black indicating deleterious mutations and red indicating beneficial mutations. Colored bars above the heatmaps indicate protein domains. Black: origin-binding domain; light blue: helicase domain; gray: nuclear localization signal; and navy blue: zinc-finger domain. Black dots indicate wild-type amino acid identity.
Figure 6—figure supplement 2
Effects of all single amino acid substitutions and deletions in the Rep78/68 proteins on AAV9 capsid production.
Amino acid level production fitness values from the pCMV-Rep78/68 production assay were calculated as in Figure 1C by summing barcode counts for synonymous mutations. Rectangles are colored by mutational effect on the production of genome-containing particles, with black indicating deleterious mutations and red indicating beneficial mutations. Colored bars above the heatmaps indicate protein domains. Black: origin-binding domain; light blue: helicase domain; gray: nuclear localization signal; and navy blue: zinc-finger domain. Black dots indicate wild-type amino acid identity.
Figure 6—figure supplement 3
Codon level production fitness values for the AAV5 capsid production assay.
Codon level production fitness values were calculated as in Figure 1C by summing counts for all barcodes corresponding to a given codon variant. Rectangles are colored by mutational effect on the production of genome-containing particles, with black indicating deleterious mutations and red indicating beneficial mutations. Black dots indicate wild-type codon identity.
Figure 6—figure supplement 4
Codon level production fitness values for the AAV9 capsid production assay.
Codon level production fitness values were calculated as in Figure 1C by summing counts for all barcodes corresponding to a given codon variant. Rectangles are colored by mutational effect on the production of genome-containing particles, with black indicating deleterious mutations and red indicating beneficial mutations. Black dots indicate wild-type codon identity.
Figure 6—figure supplement 5
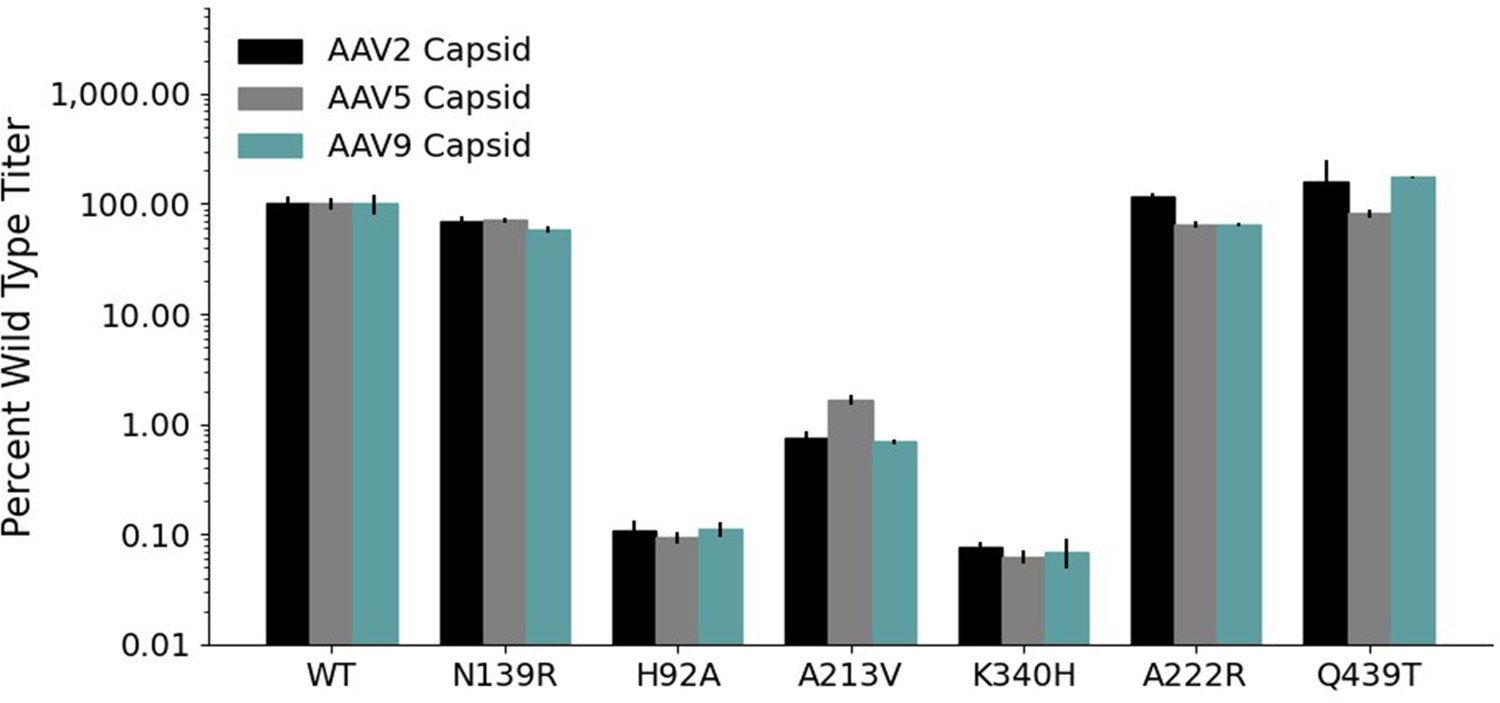
DNase-resistant particle titers for AAV2, AAV5, and AAV9 capsids produced individually with the indicated Rep variants.
Tables
Table 1
Percent of expected variants sequenced in plasmid and viral libraries.
| pCMV-Rep78/68 | WT AAV2 | |||
|---|---|---|---|---|
| Plasmid (%) | Viral (%) | Plasmid (%) | Viral (%) | |
| Barcodes | 99.8 | 98.0 | 98.3 | 97.6 |
| Codon variants | 100 | 99.9 | 99.7 | 99.7 |
| Amino acid variants | 100 | 100 | 99.9 | 99.9 |
Table 2
Viral genome and physical particle titers for rAAV2 produced with Rep variants.
| Rep variant | Replicate | qPCR titer (vg/mL) | qPCR SD (vg/mL) | ELISA titer (capsids/mL) | ELISA titer SD (capsids/mL) | Viral genome:capsid titer ratio |
|---|---|---|---|---|---|---|
| WT | A | 6.18E+11 | 5.77E+10 | 7.82E+11 | 1.04E+11 | 0.79 |
| B | 3.00E+11 | 3.85E+10 | 1.77E+11 | 8.95E+10 | 1.70 | |
| Q439T | A | 7.01E+11 | 6.47E+10 | 8.14E+11 | 4.27E+10 | 0.86 |
| B | 4.55E+11 | 2.33E+10 | 3.61E+11 | 1.21E+11 | 1.26 | |
| S110R | A | 1.45E+12 | 3.24E+10 | 1.73E+12 | 1.56E+11 | 0.84 |
| B | 1.04E+12 | 6.81E+10 | 1.43E+12 | 1.31E+11 | 0.73 |
Key resources table
| Reagent type (species) or resource | Designation | Source or reference | Identifiers | Additional information |
|---|---|---|---|---|
| Cell line (Homo sapiens) | HEK293T | ATCC | ATCC:CRL-3216 | |
| Recombinant DNA reagent | pCMV-Rep78/68 plasmid library | This paper | RRID:Addgene_198050 | Complete list of plasmid sequences included in library can be found in the GitHub repo linked below |
| Recombinant DNA reagent | pEf1a-Luc-WPRE (ssAAV) plasmid | Addgene | RRID:Addgene_87951 | |
| Recombinant DNA reagent | pCAG-Luc (ssAAV) plasmid | Addgene | RRID:Addgene_83281 | |
| Recombinant DNA reagent | pCAG-GFP (scAAV) plasmid | Addgene | RRID:Addgene_83279 | |
| Sequence-based reagent | 5′-GAGCATCTGCCCGGCATTTC-3′ | This paper | Forward primer, binds to 5′ region of AAV2 rep gene | |
| Sequence-based reagent | 5′-ATCTGGCGGCAACTCCCATT-3′ | This paper | Reverse primer, binds to 5′ region of AAV2 rep gene | |
| Sequence-based reagent | 5′-HEX-ACAGCTTTG-ZEN- TGAACTGGGTGGCCGA-3IABkFQ-3′ | This paper | HEX-based probe, binds to 5′ region of AAV2 rep gene | |
| Sequence-based reagent | 5′-GAACCGCATCGAGCTGAA-3′ | This paper | Forward primer, binds to GFP sequence | |
| Sequence-based reagent | 5′-TGCTTGTCGGCCATGATATAG-3′ | This paper | Reverse primer, binds to GFP sequence | |
| Sequence-based reagent | 5′-FAM-ATCGACTTC-ZEN- AAGGAGGACGGCAAC-3IABKFQ-3′ | This paper | FAM-based probe, binds to GFP sequence | |
| Sequence-based reagent | 5′-CATGTACCGCTTCGAGGAG-3′ | This paper | Forward primer, binds to luciferase sequence | |
| Sequence-based reagent | 5′-GAAGCTAAATAGTGTGGGCACC3′ | This paper | Reverse primer, binds to luciferase sequence | |
| Sequence-based reagent | 5′-FAM-CTTGCGCAG-ZEN- CTTGCAAGACTATAAGATTC-3IABKFQ-3′ | This paper | FAM-based probe, binds to luciferase sequence | |
| Antibody | Anti-Rep 303.9 (mouse monoclonal) | American Research Products | American Research Products: 03-61069; RRID:AB_1540388 | 1:100 |
| Antibody | B1 anti-VP (mouse monoclonal) | American Research Products | American Research Products: 03-61058; RRID:AB_1540385 | 1:250 |
| Antibody | Anti-β-actin (rabbit polyclonal) | Abcam | Abcam: ab8227; RRID:AB_2305186 | 1:20,000 |
| Antibody | Anti-mouse IgG IRDye 800CW (goat monoclonal) | LI-COR | LI-COR: 925-32210; RRID:AB_2687825 | 1:10,000 |
| Antibody | Anti-rabbit IgG IRDye 680RD (donkey monoclonal) | LI-COR | LI-COR: 925-68073; RRID:AB_2716687 | 1:10,000 |
| Commercial assay or kit | Promega One-Glo EX Luciferase Assay System | Promega | Promega:E8110 | |
| Commercial assay or kit | Capsid ELISA | Progen | Progen:PRATV | |
| Software, algorithm | Python scripts for library design and data analysis | This paper | https://github.com/churchlab/aav_rep_scan; churchlab, 2023 |
Additional files
Download links
A two-part list of links to download the article, or parts of the article, in various formats.
Downloads (link to download the article as PDF)
Open citations (links to open the citations from this article in various online reference manager services)
Cite this article (links to download the citations from this article in formats compatible with various reference manager tools)
Comprehensive mutagenesis maps the effect of all single-codon mutations in the AAV2 rep gene on AAV production
eLife 12:RP87730.
https://doi.org/10.7554/eLife.87730.3


