Delayed postglacial colonization of Betula in Iceland and the circum North Atlantic
- Institute of Arctic and Alpine Research, University of Colorado Boulder, United States
- Department of Ecology and Evolutionary Biology, University of California Santa Cruz, United States
- Institute of Life and Environmental Sciences, University of Iceland, Iceland
- Faculty of Earth Sciences, University of Iceland, Iceland
- Department of Geological Sciences, University of Colorado Boulder, United States
Figures
Figure 1
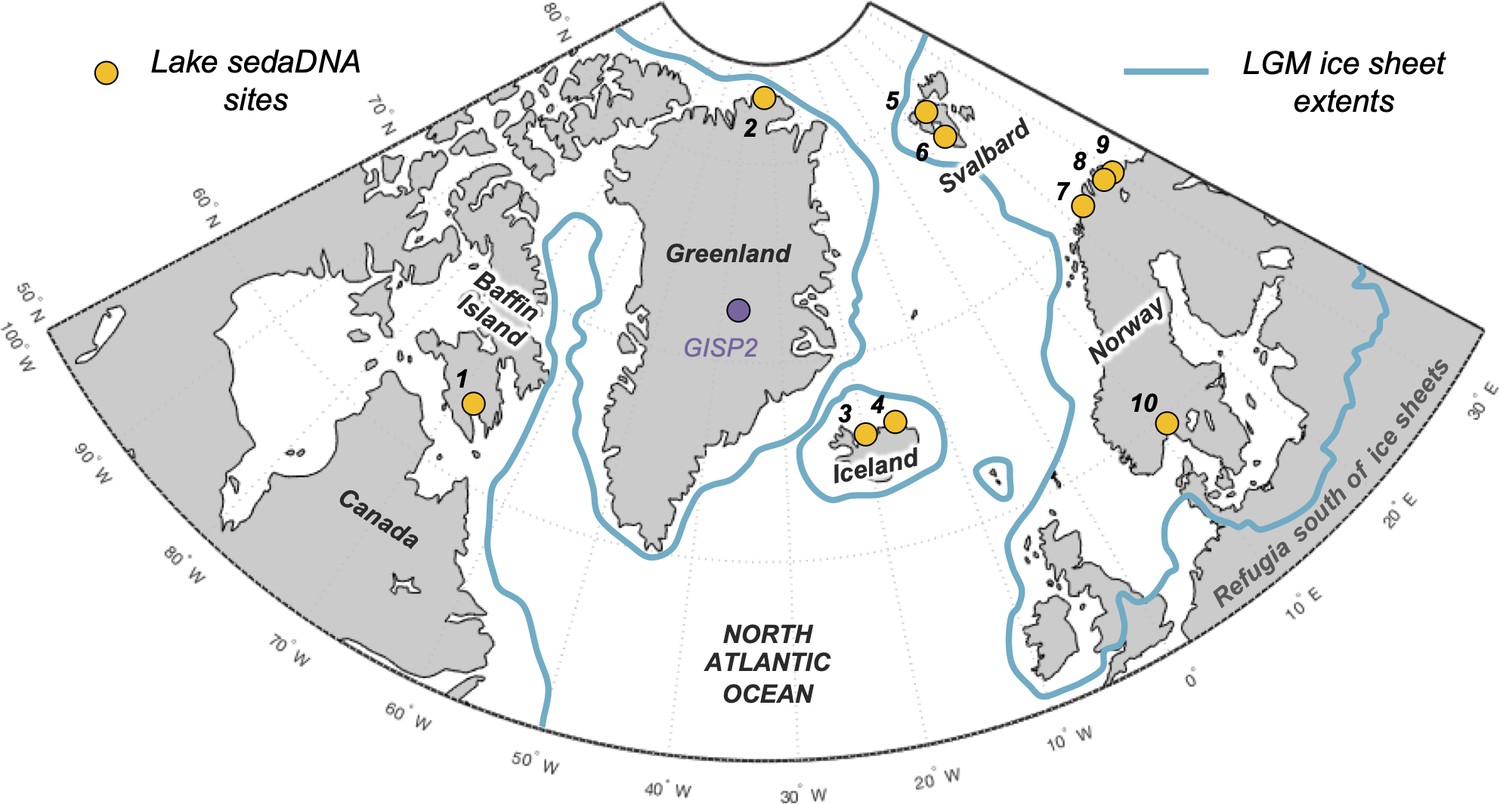
Overview map of the North Atlantic.
Lake sedimentary ancient DNA (sedaDNA) sites with vascular plant histories since local deglaciation shown in yellow (see Table 1 for site information). The extent of the Last Glacial Maximum (LGM) ice sheets is delineated in blue (Batchelor et al., 2019).
Figure 2
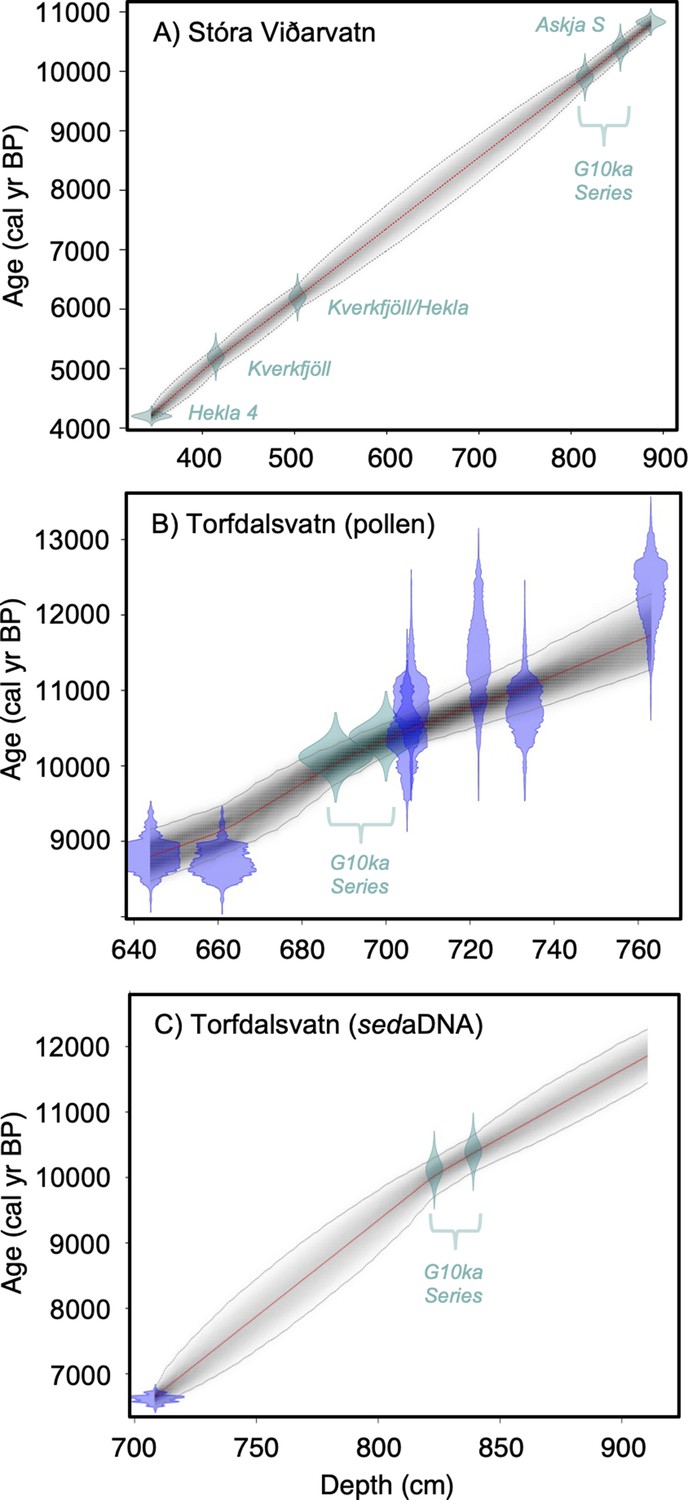
Lake sediment age models used in this study.
(A) Stóra Viðarvatn’s age model (this study), (B) Torfdalsvatn’s pollen and macrofossil age model modified from Rundgren, 1995; Rundgren, 1998 (see Geirsdóttir et al., 2020), and (C) Torfdalsvatn’s sedimentary ancient DNA (sedaDNA) age model modified from Alsos et al., 2021. Green points reflect tephra layers and blue points reflect calibrated 14C ages using IntCal20 (Reimer et al., 2020).
-
Figure 2—source data 1
Major oxide composition of tephra layers (mean and standard deviation) used for age control in the Stóra Viðarvatn lake sediment record.
- https://cdn.elifesciences.org/articles/87749/elife-87749-fig2-data1-v1.xlsx
Figure 3
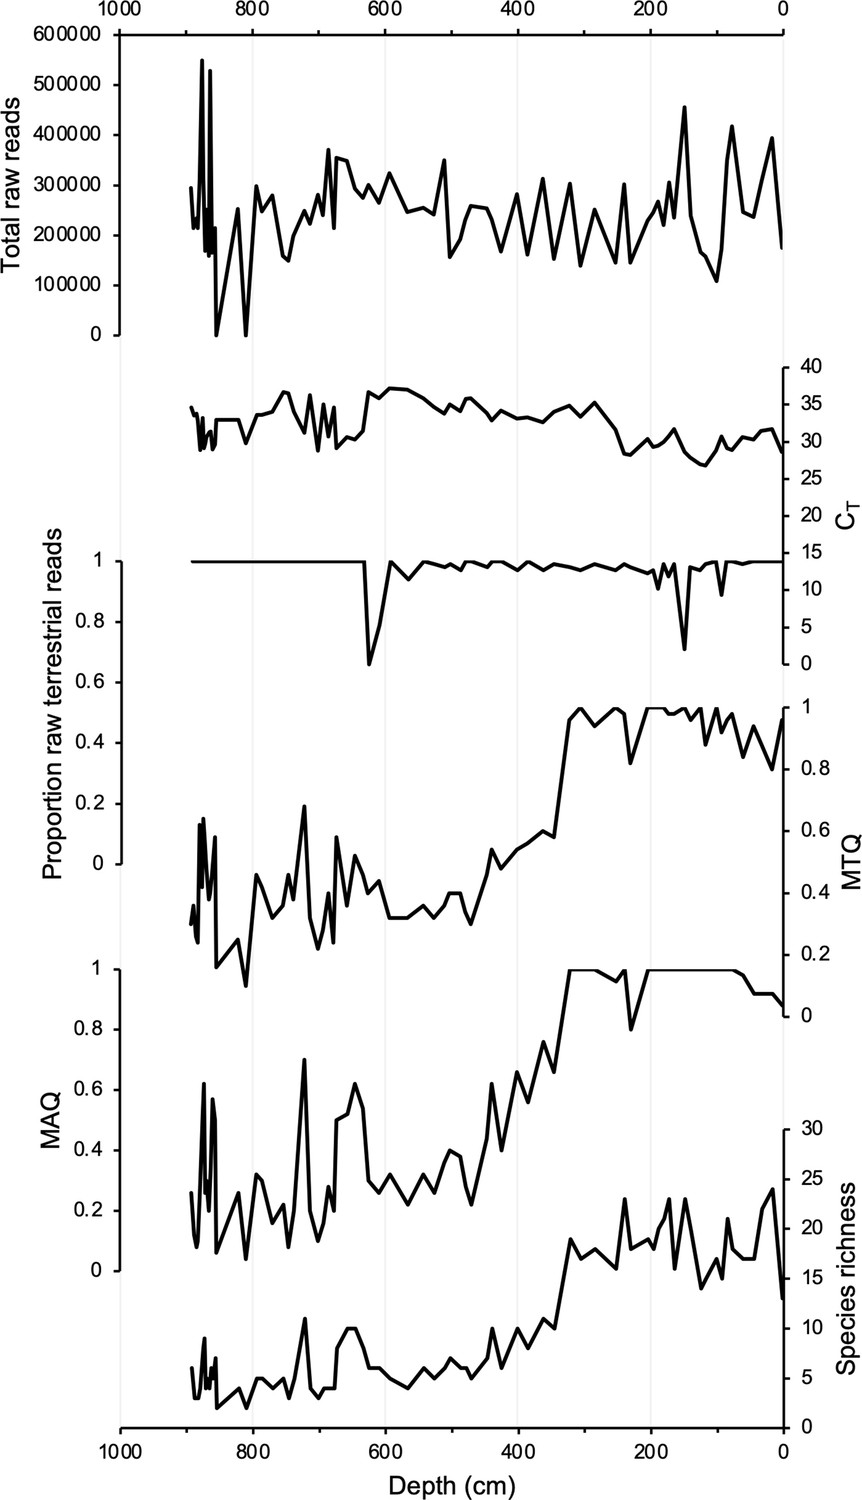
DNA quality assessment for Stóra Viðarvatn’s entire Holocene record plotted against depth (cm).
Total raw DNA reads, CT values, proportion raw terrestrial reads, metabarcoding technical quality (MTQ), metabarcoding analytical quality (MAQ), and species richness.
Figure 4
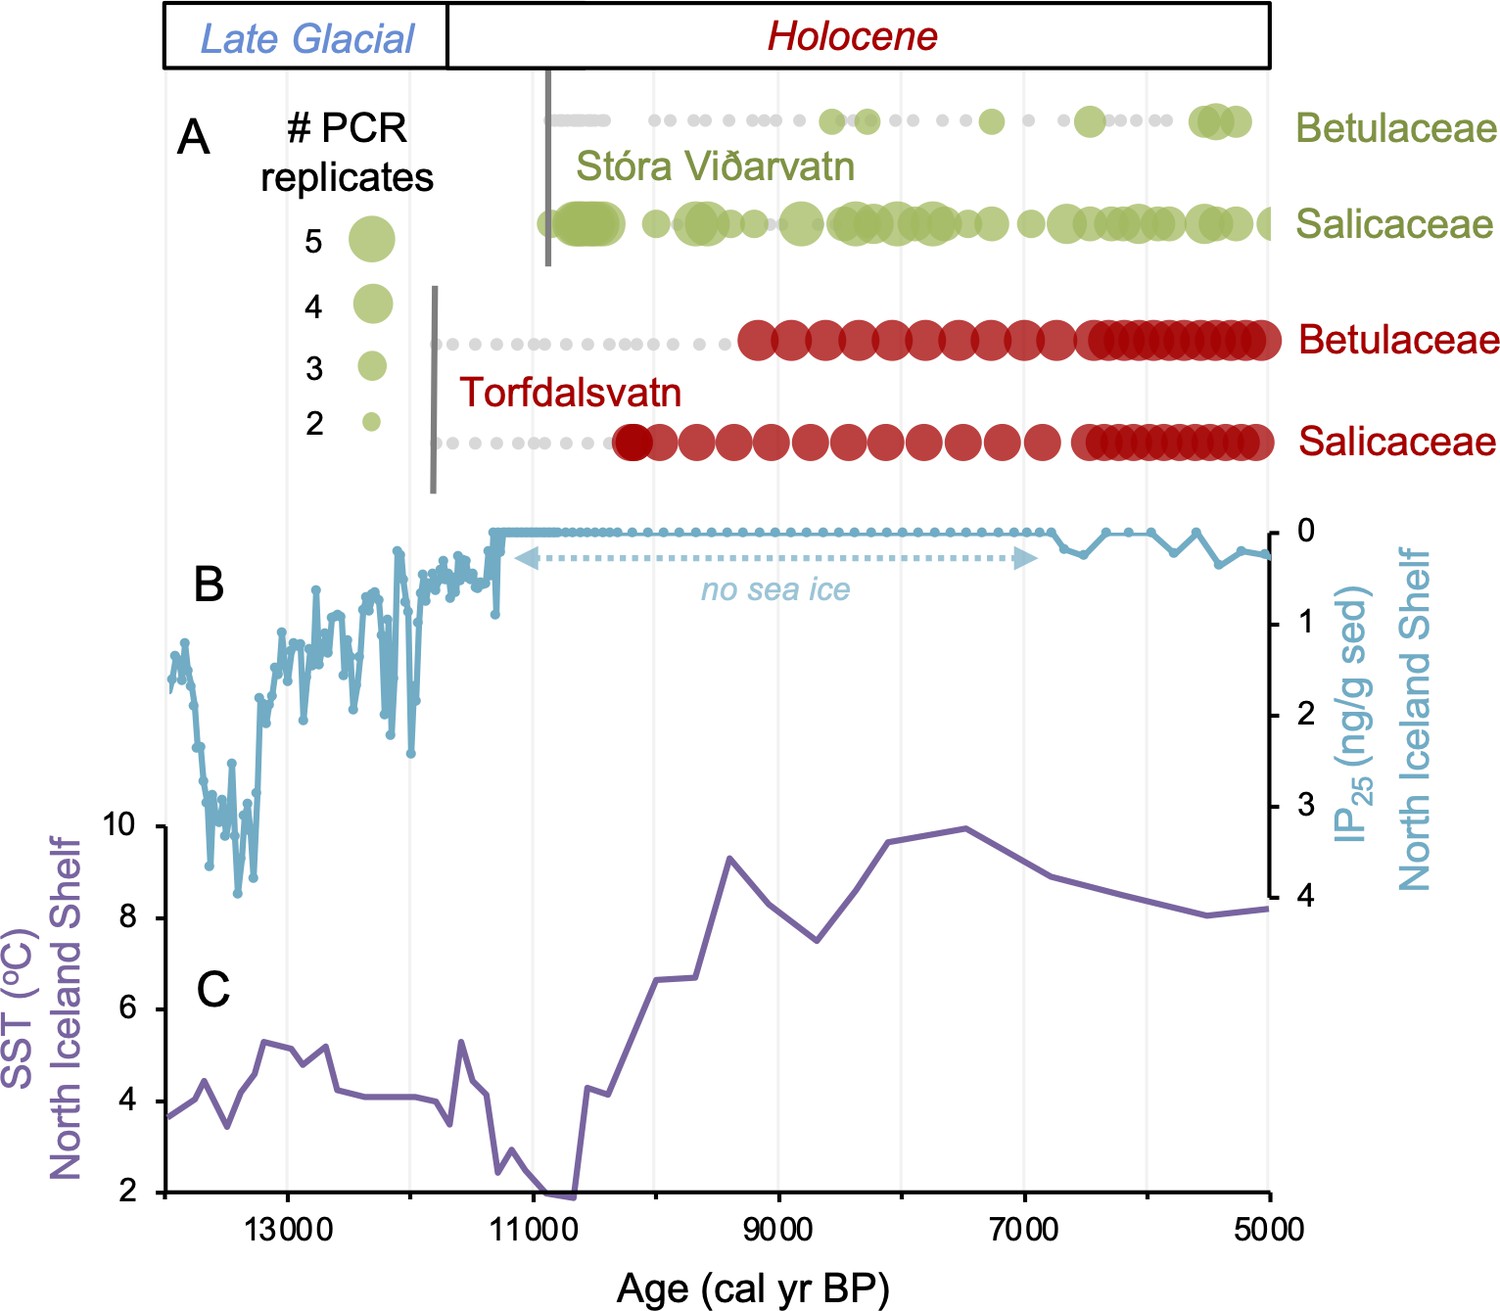
Comparison of paleoclimate and lake sedimentary ancient DNA (sedaDNA) records from Iceland.
(A) Presence/absence sedaDNA record from Stóra Viðarvatn (green) and Torfdalsvatn (red) for Betulaceae and Salicaceae, where light gray markers denote that no taxa was detected. For Stóra Viðarvatn sedaDNA, the bubble size is proportional to the number of PCR replicates, and vertical dark gray lines denote the timing of each lake’s deglaciation. (B) Biomarker-proxy record of sea ice from the North Iceland Shelf (inverted), where greater concentrations of IP25 correspond to more sea ice (Xiao et al., 2017). (C) Diatom-based SST record from the North Iceland Shelf (Sha et al., 2022).
-
Figure 4—source data 1
Processed sedimentary ancient DNA (sedaDNA) data (number of replicates and reads) for all taxa identified in the Stóra Viðarvatn lake sediment record.
- https://cdn.elifesciences.org/articles/87749/elife-87749-fig4-data1-v1.xlsx
Figure 5
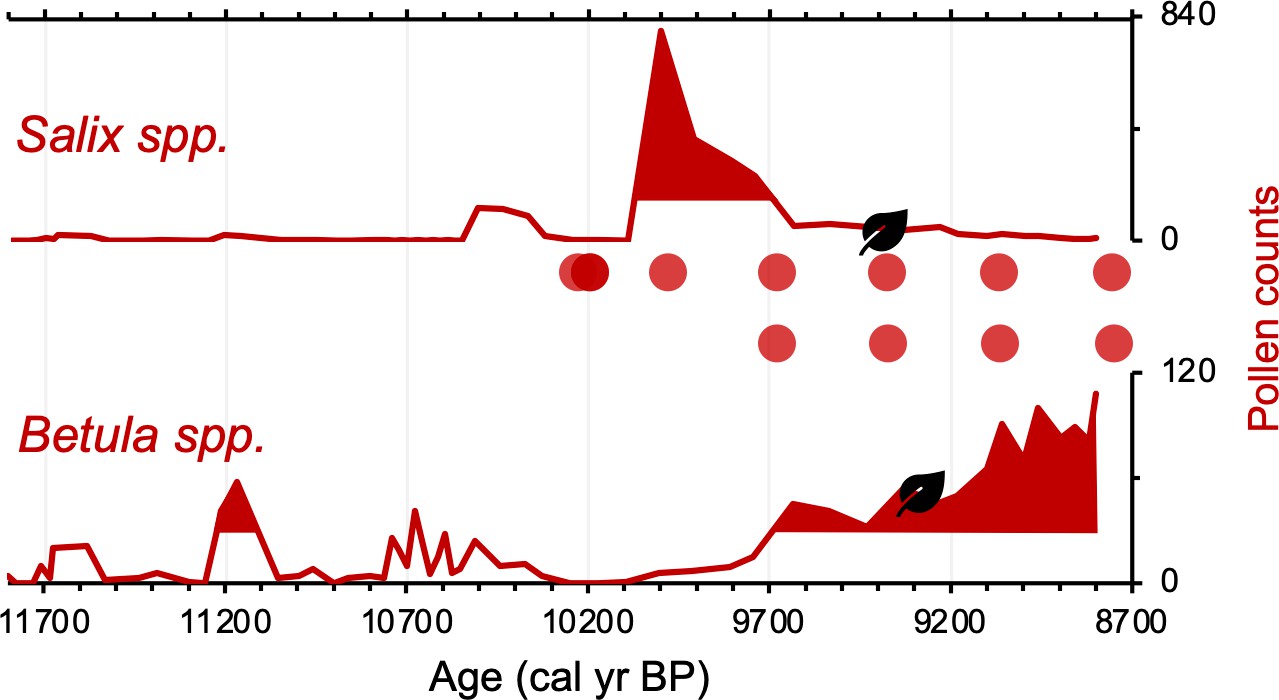
Simplified paleovegetation records from Torfdalsvatn for two taxa: Salix spp. and Betula spp.
Shown are pollen counts (bold red lines), where shaded regions indicate values above the mean (Rundgren, 1995), first occurrence of taxa macrofossils (black leaves, Rundgren, 1998), and DNA presence (red bubbles, Alsos et al., 2021).
Figure 6
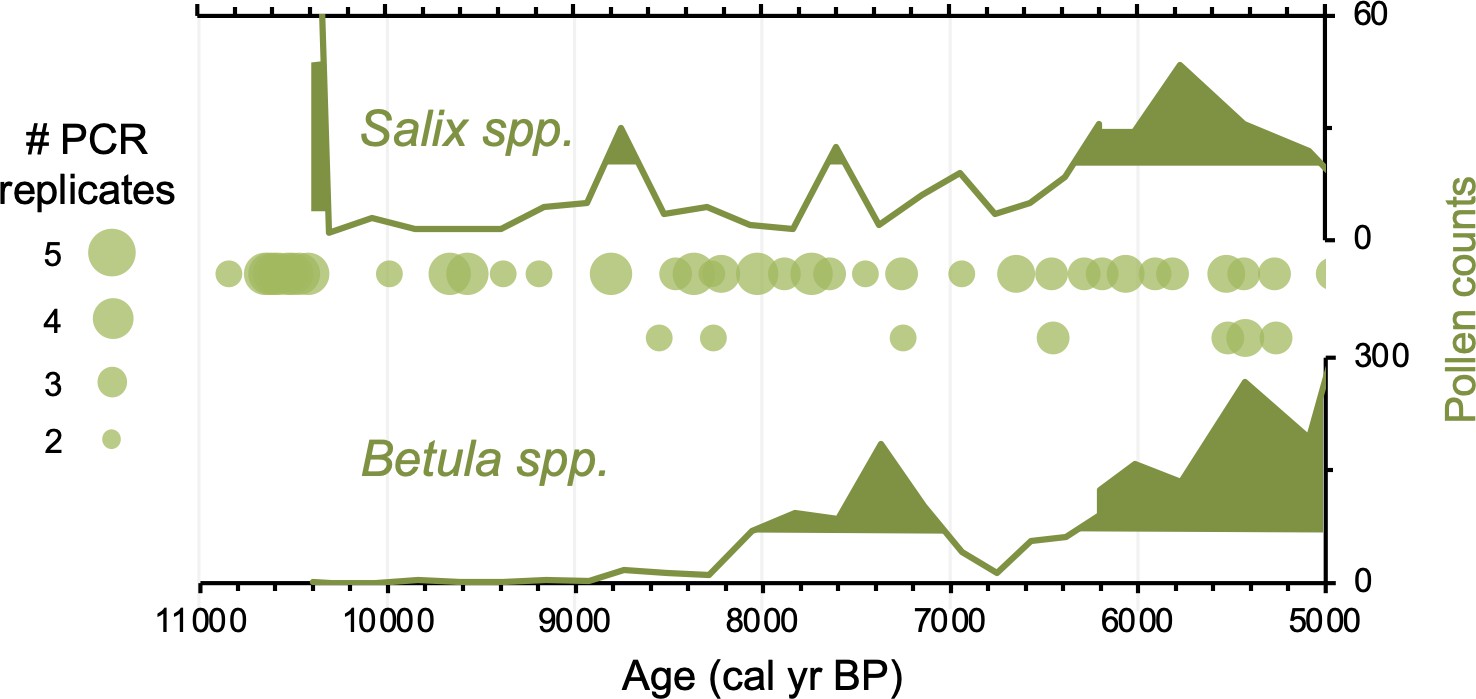
Simplified paleovegetation records from northeast Iceland for two taxa: Salix spp. and Betula spp.
Shown are Ytra-Áland pollen counts (bold green lines), where shaded regions indicate values above the mean (Karlsdóttir et al., 2014) and DNA presence from Stóra Viðarvatn (green bubbles, this study), where the bubble size is proportional to the number of PCR replicates.
Figure 7
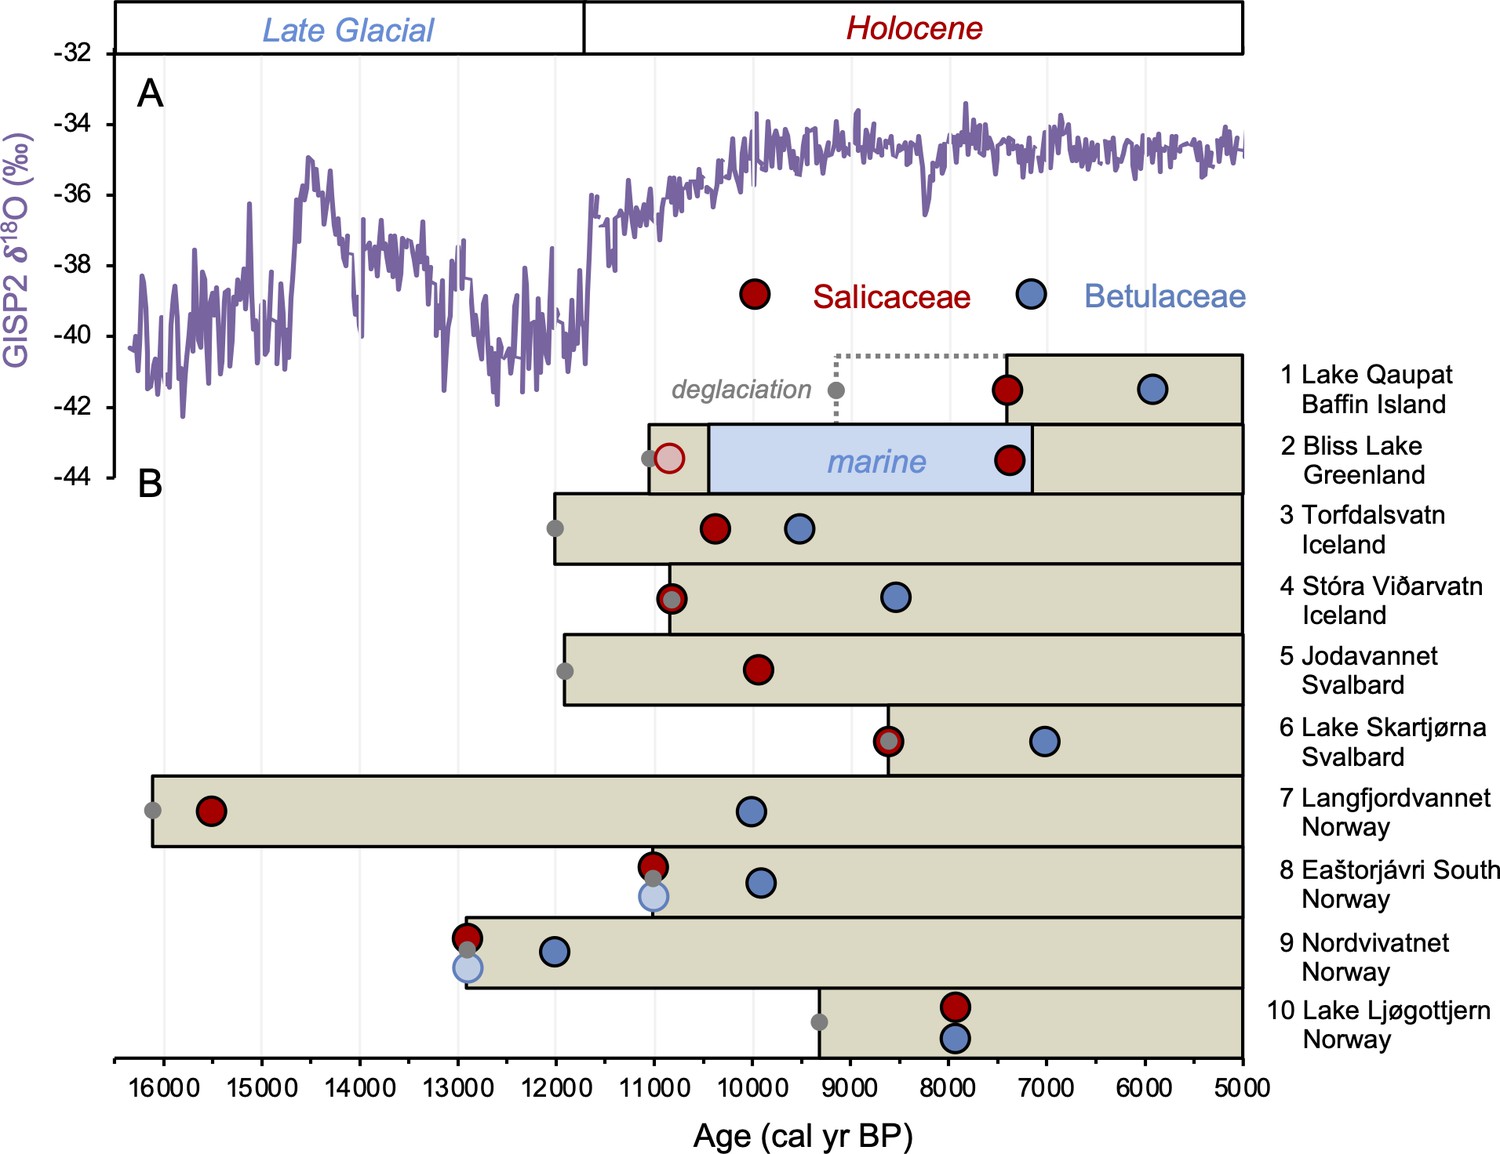
Timing of postglacial Salicaceae and Betulaceae colonization in the circum North Atlantic at 10 locations (see Figure 1 and Table 1).
(A) GISP2 δ18O values reflective of regional North Atlantic temperature variability (Seierstad et al., 2014) and (B) lake sedaDNA records of vascular plants, where the brown boxes reflect the extent of sedimentary record and the red/blue circles denote the first appearance of Salicaceae/Betulaceae (Epp et al., 2015; Crump et al., 2019; Alsos et al., 2016b, Alsos et al., 2021; Alsos et al., 2022; Voldstad et al., 2020; Rijal et al., 2021; ter Schure et al., 2021; this study). Light red and blue circles denote the presence of a low number of taxa reads, which we conservatively do not interpret to reflect genuine presence (e.g., Epp et al., 2015). Gray circles denote the minimum timing of local deglaciation inferred from basal sediment core ages, and in the case of Baffin Island, cosmogenic radionuclide dating of the lake’s impounding moraine (Crump et al., 2019).
Figure 8
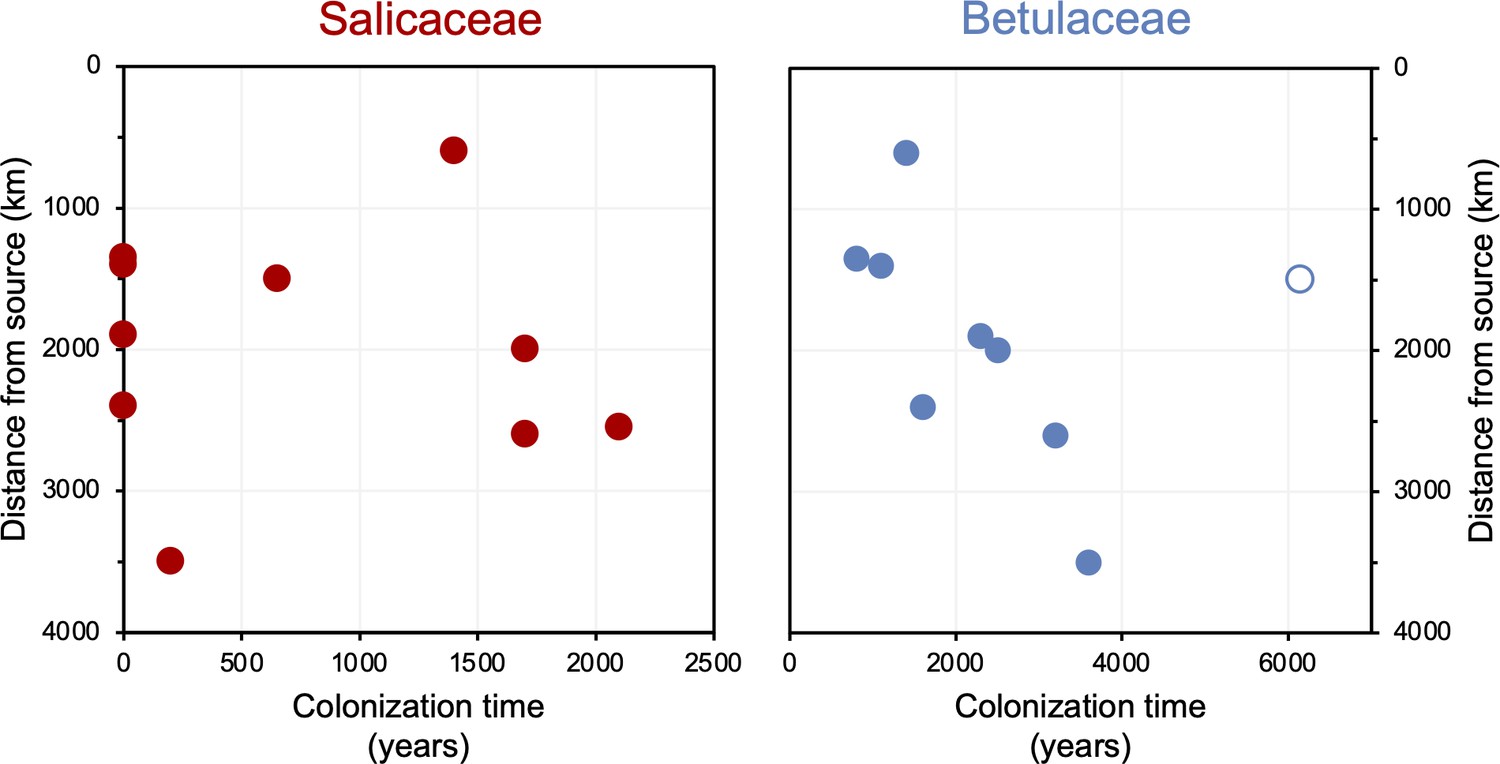
Colonization time after deglaciation (years) versus lake distance from the closest possible source south of the Last Glacial Maximum (LGM) ice sheet margin (km).
For all circum North Atlantic sites, Salicaceae is shown in red and Betulaceae in blue. Data point for Langfjordvannet is open for Betulaceae.
Tables
Table 1
Lake site information.
| Site # | Lake name | Region | Latitude (°) | Longitude (°) | Reference |
|---|---|---|---|---|---|
| 1 | Lake Qaupat | Baffin Island | 63.68 | –68.20 | Crump et al., 2019 |
| 2 | Bliss Lake | Greenland | 83.52 | –28.35 | Epp et al., 2015 |
| 3 | Torfdalsvatn | Iceland | 66.06 | –20.38 | Alsos et al., 2021 |
| 4 | Stóra Viðarvatn | Iceland | 66.24 | –15.84 | This study |
| 5 | Jodavannet | Svalbard | 77.34 | 16.02 | Voldstad et al., 2020 |
| 6 | Lake Skartjørna | Svalbard | 77.96 | 13.82 | Alsos et al., 2016b |
| 7 | Langfjordvannet | Norway | 70.15 | 20.54 | Alsos et al., 2022 |
| 8 | Eaštorjávri South | Norway | 70.43 | 27.33 | Alsos et al., 2022 |
| 9 | Nordvivatnet | Norway | 70.13 | 29.01 | Alsos et al., 2022 |
| 10 | Lake Ljøgottjern | Norway | 60.15 | 11.14 | ter Schure et al., 2021 |
Table 2
Primer sequences used in metabarcoding and qPCR experiments.
| Primer | Sequence 5′–3′ |
|---|---|
| truseq_trnL_g | ACACTCTTTCCCTACACGACGCTCTTCCGATCTGGGCAATCCTGAGCCAA |
| truseq_trnL_h | GTGACTGGAGTTCAGACGTGTGCTCTTCGATCT TTGAGTCTCTGCACCTATC |
Table 3
ASV (amplicon sequence variant) sequences identified in our samples for Salicaceae and Betulaceae.
| Taxon | ASV sequence |
|---|---|
| Salicaceae | ATCCTATTTTTCGAAAACAAACAAAGGTTCATAAAGACAGAATAAGAATACAAAAG |
| Betulaceae | ATCCTGTTTTCCGAAAACAAATAAAACAAATTTAAGGGTTCATAAAGTGAGAATAAAAAAG |
Table 4
Total read data remaining after each data filtering step.
| Step | Total read data remaining |
|---|---|
| Raw | 18,653,132 |
| Minimum 10 reads per PCR replicate, occurred in 2 out of 5 PCR replicates, and minimum 100 reads across PCR replicates | 17,303,887 |
| Non-native taxa and blank contaminants | 15,909,615 |
Additional files
Download links
A two-part list of links to download the article, or parts of the article, in various formats.
Downloads (link to download the article as PDF)
Open citations (links to open the citations from this article in various online reference manager services)
Cite this article (links to download the citations from this article in formats compatible with various reference manager tools)
Delayed postglacial colonization of Betula in Iceland and the circum North Atlantic
eLife 12:RP87749.
https://doi.org/10.7554/eLife.87749.3


