N-WASP-dependent branched actin polymerization attenuates B-cell receptor signaling by increasing the molecular density of receptor clusters
- Department of Cell Biology and Molecular Genetics, University of Maryland, United States
- Biophysics Program, University of Maryland, United States
- Department of Physics, University of Maryland, United States
- Institute for Physical Science and Technology, University of Maryland, United States
Figures
Figure 1 with 5 supplements
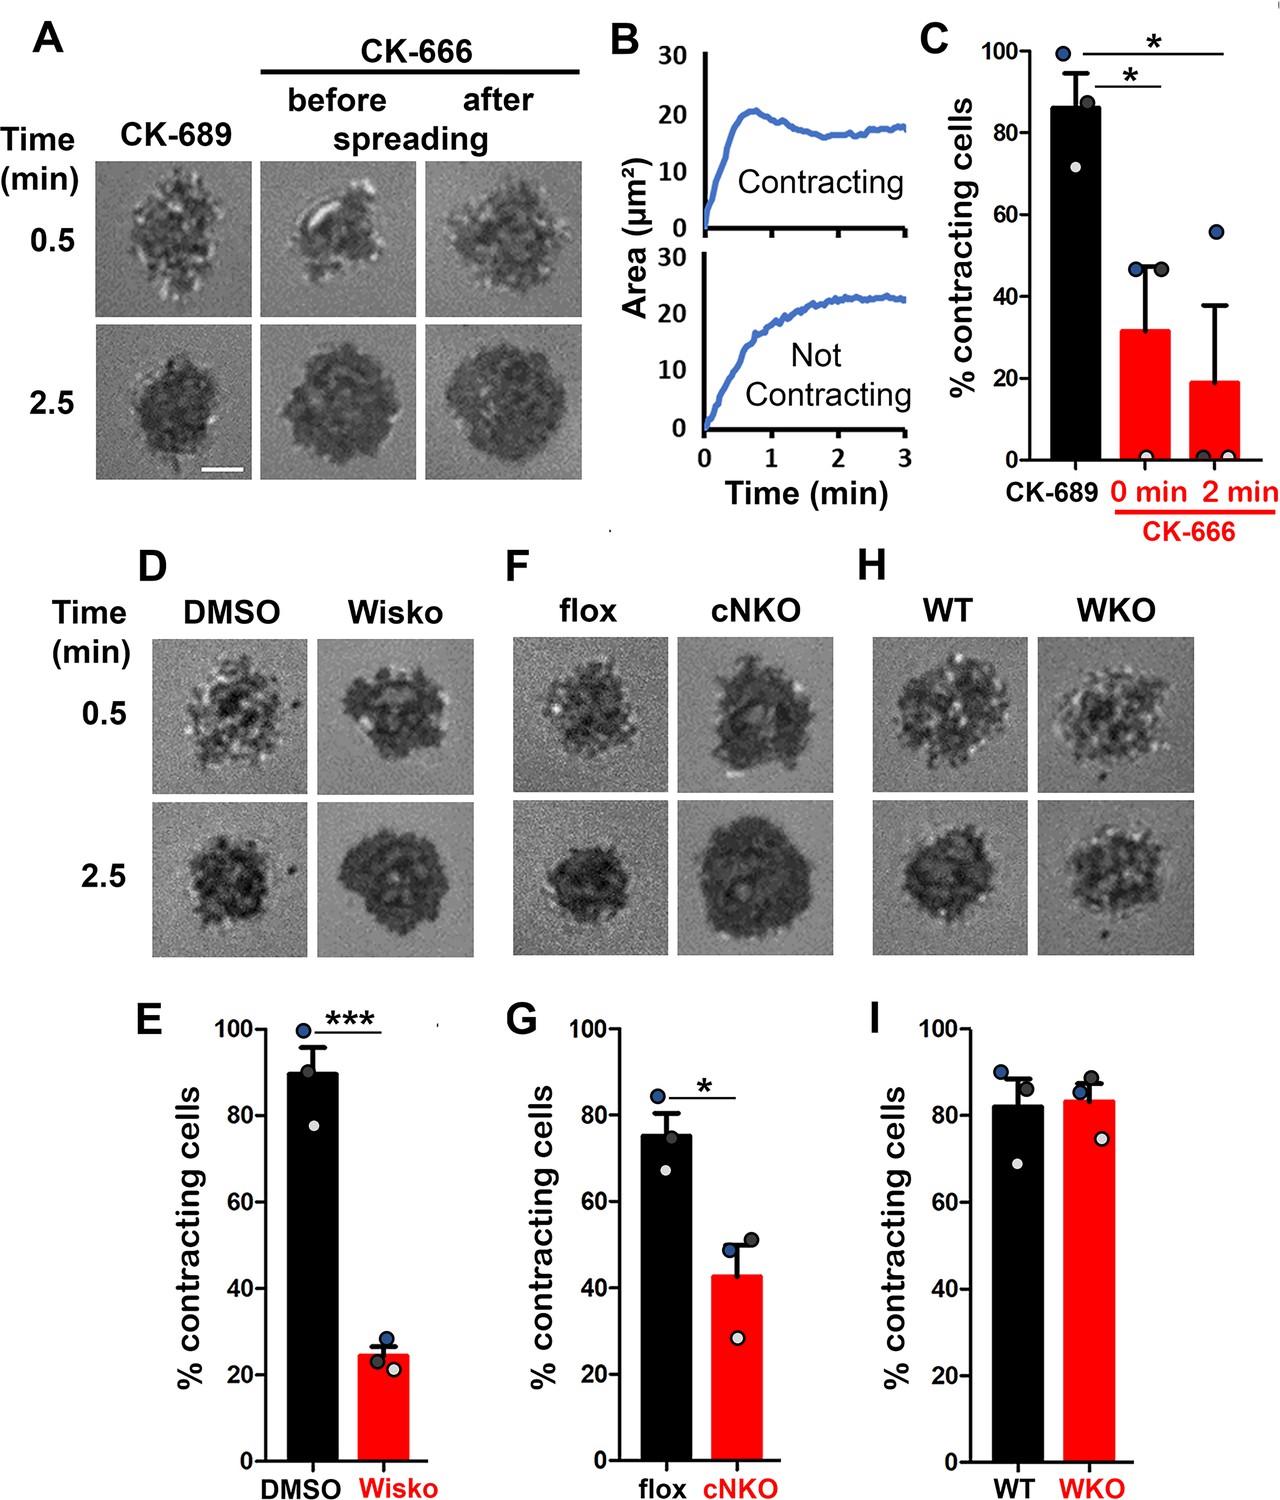
Arp2/3, activated by neuronal-Wiskott-Aldrich Syndrome Protein (N-WASP) but not WASP, is required for B-cell contraction.
Splenic B-cells were incubated with planar lipid bilayers coated with monobiotinylated Fab’ fragment of goat anti-mouse IgG + M (Fab’-PLB) in the absence and presence of various inhibitors and imaged live at 37 °C by interference reflection microscopy (IRM). The B-cell plasma membrane area contacting Fab’-PLB (B-cell contact zone) was measured using IRM images and custom MATLAB scripts [Source code 1 and Source code 2]. (A) Representative IRM images of splenic B-cells from C57BL/6 mice treated with CK-689 or CK-666 (50 µM) before (0 min) and after maximal spreading (2 min). (B) Representative plots of the B-cell contact area versus time from one contracting cell and one non-contracting cell. (C) Percentages (± SEM) of B-cells that underwent contraction after treatment with CK-666 or CK-689. A B-cell was classified as contracting if its contact zone area was reduced by ≥5% for at least 10 s after reaching a maximum value. (D) Representative IRM images of splenic B-cells from C57BL/6 mice treated with DMSO or Wiskostatin (Wisko, 10 µM) 10 min before and during incubation with Fab’-PLB. (E) Percentages (± SEM) of B-cells that underwent contraction after treatment with Wisko or DMSO. (F) Representative IRM images of splenic B-cells from flox control and B-cell-specific N-wasp knockout (cNKO) mice. (G) Percentages (± SEM) of cNKO or flox control B-cells that underwent contraction. (H) Representative IRM images of splenic B-cells from wild-type (WT) or Wasp knockout mice (WKO). (I) Percentages (± SEM) of WKO or WT B-cells that underwent contraction. Data points in (C, E, G and I) represent three independent experiments,~25 cells per condition per experiment, with each color representing one experiment. Scale bar, 2 µm. *p<0.05, ***p<0.001, by paired student’s t-test. MATLAB codes were used for detecting the B-cell contact zone in time-lapse data and tracking the area occupied by it [Source code 2, Source code 3, Source code 4, Source code 5, Source code 6].
Figure 1—figure supplement 1

B-cells spread and contract on Fab’-coated-planar lipid bilayers.
Splenic B-cells were pre-warmed to 37 °C and incubated with planar lipid bilayers coated with monobiotinylated Fab’ fragment of goat anti-mouse IgG + M (Fab’-PLB) and imaged live at 37 °C by interference reflection microscopy (IRM). Shown are individual frames from a time-lapse IRM image of one B-cell. The plasma membrane area contacting with Fab’-PLB (B-cell contact zone) visualized by IRM increased between 0–1 min after landing, indicating spreading, and decreased after 1 min 30 s, indicating contraction. Scale bar, 2 µm.
Figure 1—figure supplement 2
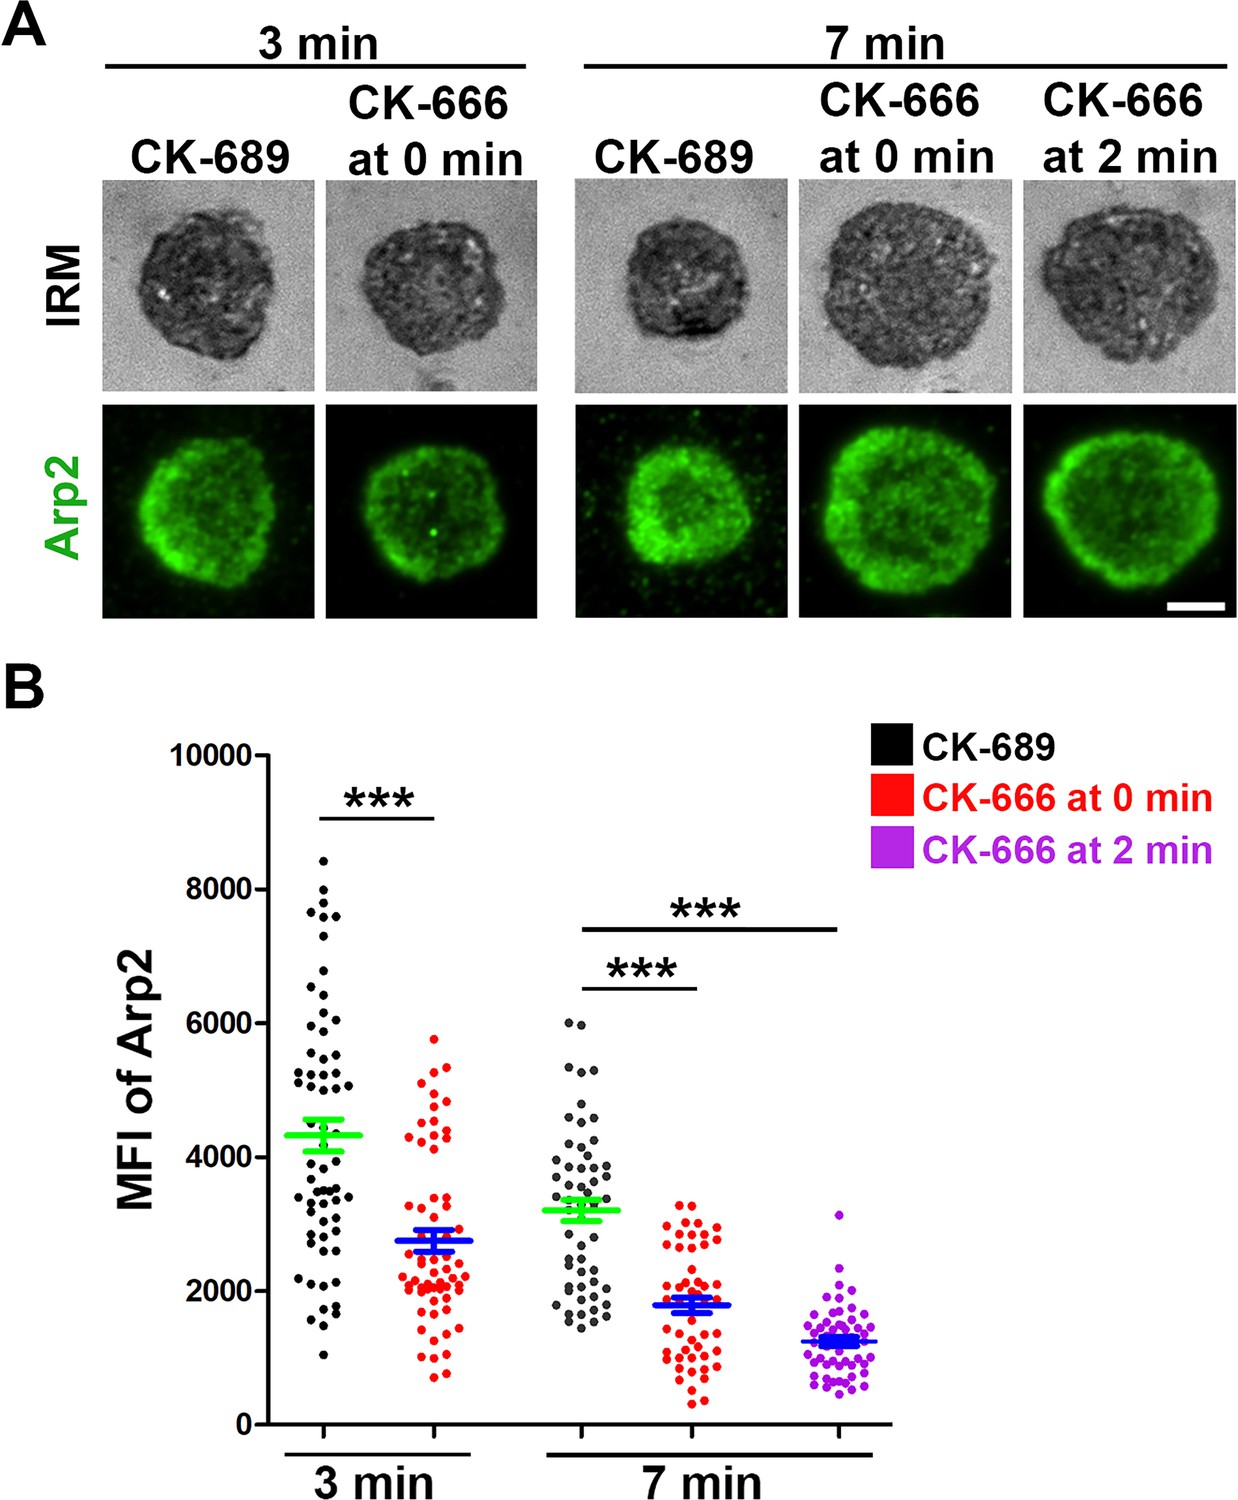
CK-666 significantly decreases Arp2/3 recruitment to the B-cell contact zone.
Wild-type (WT) splenic B-cells were treated with CK-689 or CK-666 (50 µM) before (0 min) and after maximal spreading (2 min) during incubation with Fab’-PLB at 37 °C. Cells were fixed at 3 and 7 min, permeabilized, stained for Arp2, and imaged using interference reflection microscopy (IRM) and total internal reflection fluorescence microscopy (TIRF). Shown are representative images (A) and the MFI of Arp2 in the contact zone at 3 min and 7 min compared between B-cell treated with CK-689 (black dots), CK-666 from 0 min (red dots), and CK-666 from 2 min (purple dots) (B). Data points represent individual cells from three independent experiments with ~20 cells per condition per experiment. Scale bar, 2 µm. ***p<0.001, by non-parametric student’s t-test.
Figure 1—figure supplement 3

CK-666 treatment before but not after maximal B-cell spreading decreased the spreading kinetics.
Wild-type (WT) splenic B-cells were treated with CK-689 or CK-666 (50 µM) before (0 min) and after maximal spreading (2 min) during incubation with Fab’-PLB and imaged live at 37 °C by interference reflection microcopy (IRM). The area occupied by the B-cell contact zone was measured using IRM images and custom codes made in MATLAB [Source code 2 and Source code 3]. The mean spreading rate of each cell during its early spreading phase was quantified using the contact area versus the time curve of that cell by linear regression. The averaged spreading rates (± SEM) were generated from three independent experiments with ~15 cells per condition per experiment. *p>0.05, **p<0.01, by non-parametric student’s t-test.
Figure 1—figure supplement 4
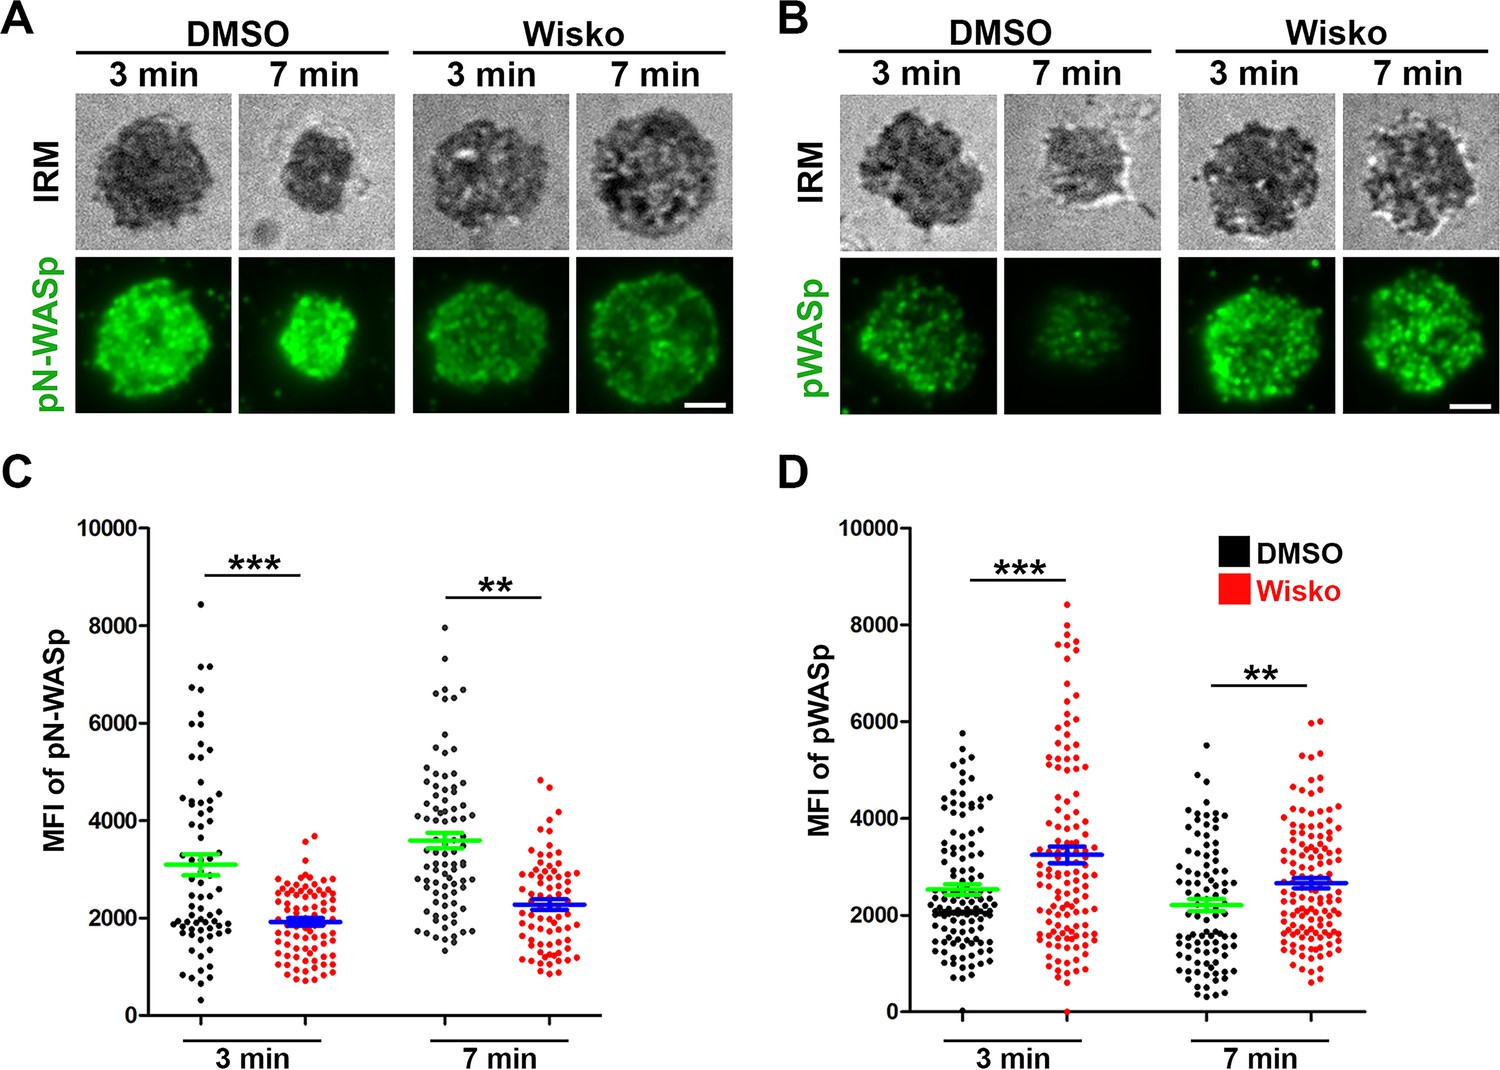
Wiskostatin treatment inhibits neuronal-WASP (N-WASP) activation while enhancing WASP activation in B-cells.
Wild-type (WT) splenic B-cells were pre-treated with Wiskostatin (Wisko, 10 µM) or DMSO (control) for 10 min at 37 °C before and during incubation with Fab’-PLB. Cells were fixed at 3 and 7 min, permeabilized, stained for phosphorylated N-WASP (pN-WASP) or WASP (pWASP), and imaged using interference reflection microscopy (IRM) and total internal reflection fluorescence microscopy (TIRF). Shown are IRM and TIRF images of phosphorylated N-WASP (pN-WASP) (A) and phosphorylated WASP (pWASP) (B) at the B-cell contact zone and the mean fluorescence intensity (MFI) (± SEM) of pN-WASP (C) and pWASP (D) in the B-cell contact zone, comparing between DMSO and Wisko-treated B-cells. Data points represent individual cells from three independent experiments with ~25 cells per condition per experiment. Scale bar, 2 µm. **p<0.01, ***p<0.001, by non-parametric student’s t-test.
Figure 1—video 1
Effects of CK-666, Wiskostatin, conditional neuronal-Wiskott-Aldrich Syndrom Protein (N-WASP) knockout, and WASP knockout on B-cell contraction.
Splenic B-cells were incubated with planar lipid bilayers coated with monobiotinylated Fab’ fragment of goat anti-mouse IgG + M (Fab’-PLB) in the absence and presence of various inhibitors and imaged live at 37 °C at one frame per 2 s by interference reflection microscopy (IRM). Shown are representative IRM time-lapse images of wild-type (WT) B-cells treated with CK-689 or CK-666 (50 µM) before (0 min) and after maximal spreading (2 min) (A), WT B-cells treated with DMSO or Wiskostatin (Wisko, 10 µM) 10 min before and during incubation with Fab’-PLB (B), B-cells from flox control and B-cell-specific N-wasp knockout (cNKO) mice (C), and B-cells from WT or Wasp knockout mice (WKO) (D). The frame in which the contact zone first appears was considered time 0. The videos are sped up by 20 x compared to real time. Scale bar, 2 µm.
Figure 2 with 1 supplement
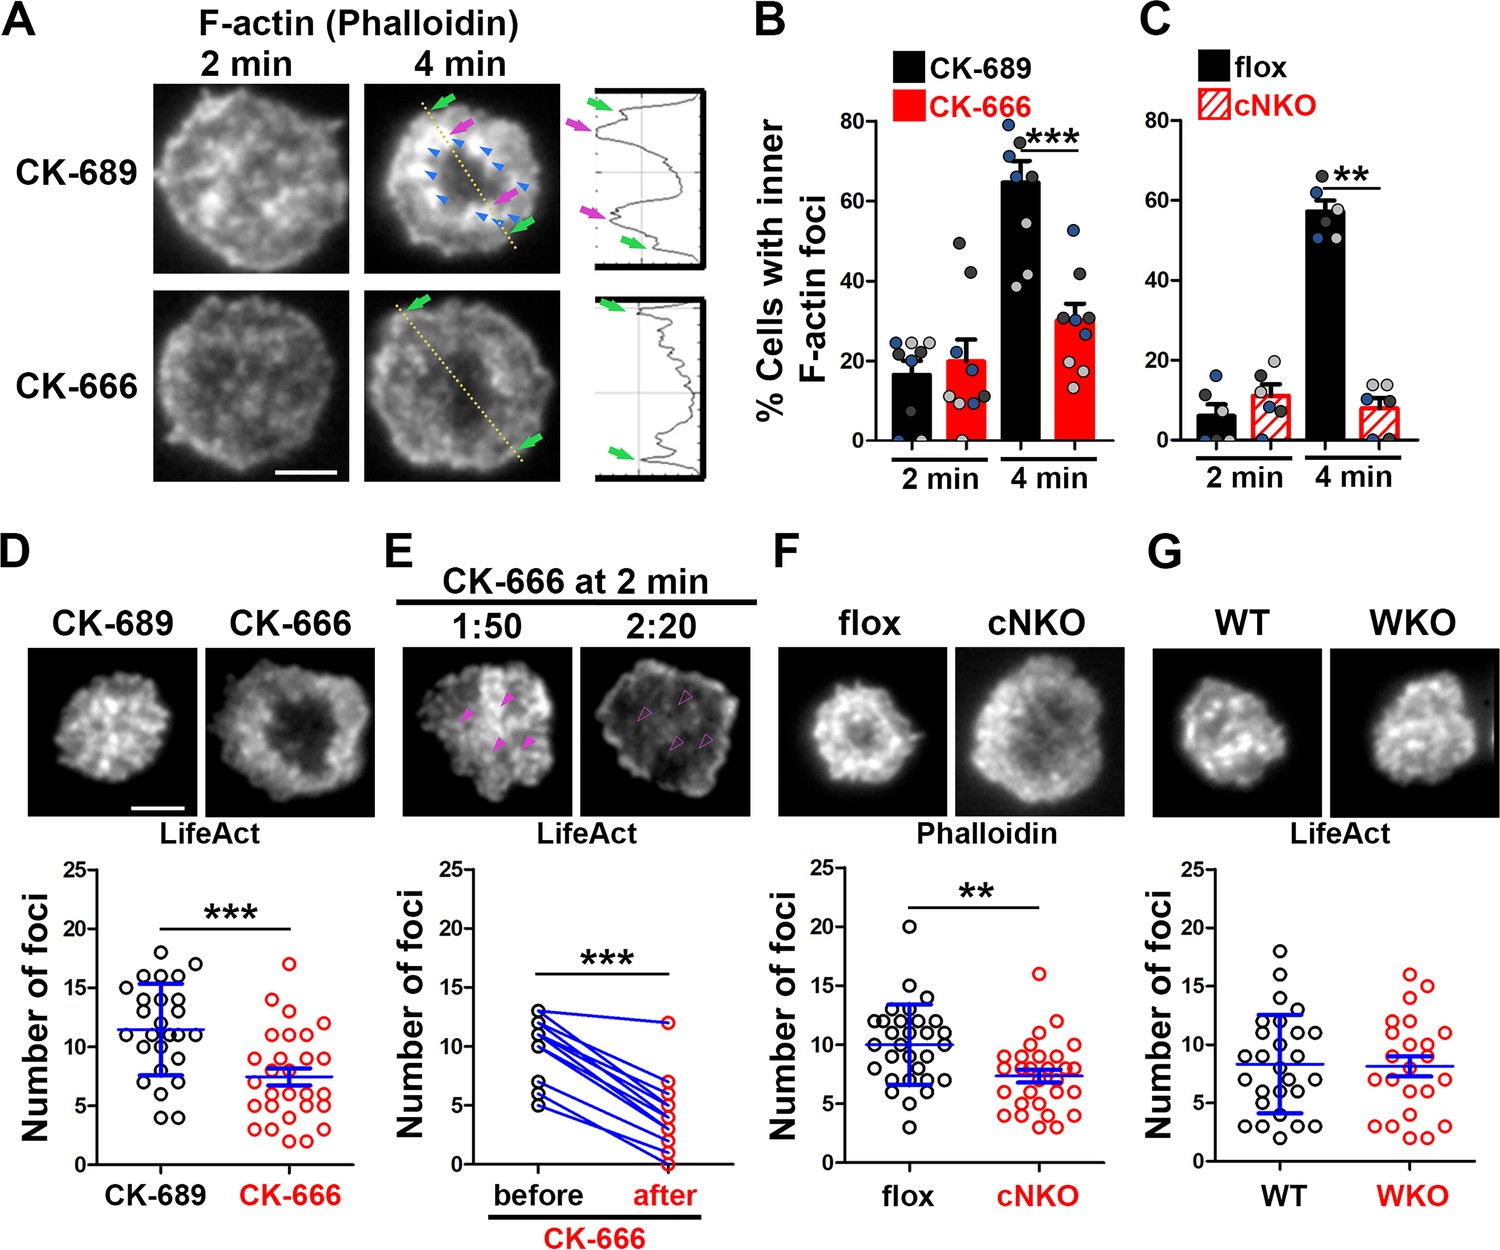
Arp2/3, downstream of N-WASP, generates inner F-actin foci, driving B-cell contraction.
(A–C) Wild-type (WT) splenic B-cells were treated with CK-689 or CK-666 (50 µM) during incubation with Fab’-PLB (A and B), and flox control and B-cell-specific N-wasp knockout mice (cNKO) B-cells were incubated with Fab’-PLB at 37 °C (C). Cells were fixed at 2 and 4 min, permeabilized, stained for F-actin with phalloidin, and analyzed using total internal reflection fluorescence microscopy (TIRF). Shown are representative TIRF images of phalloidin staining in the contact zone of CK-689 and CK-666-treated B-cells (A left panels) and fluorescence intensity (FI) profiles of phalloidin staining along a line crossing cells (A right panels). Green arrows indicate lamellipodial F-actin, purple arrows indicate inner F-actin foci on the line, and blue arrows indicate all inner actin foci forming a ring-like structure. Percentages of cells (per image) (± SEM) with inner F-actin foci forming ring-like distribution among CK-689- versus CK-666-treated cells (B) and flox control versus B-cell-specific N-wasp knockout mice (cNKO) B-cells (C) before (2 min) and after (4 min) contraction were determined by visual inspection of phalloidin FI line-profiles across the B-cell contact zones. Data points in (B) and (C) represent three independent experiments, with each color representing one experiment, five images per condition per experiment, and ~15 cells per image. (D–G) Inner F-actin foci were identified by their diameter (≥250 nm), peak FI (≥twofold of no foci area, and location 1 µm away from the outer edge) and quantified as the number per cell using TIRF images. (D) Shown are representative images of splenic B-cells from LifeAct-GFP-expressing mice treated with CK-689 or CK-666 from 0 min during incubation with Fab’-PLB at 37 °C (top) and the average number (± SEM) of inner LifeAct-GFP foci per cell (bottom) at 2 min. (E) LifeAct-GFP B-cells were treated with CK-666 at 2 min. Shown are representative TIRF images of LifeAct-GFP in the contact zone of B-cells (top) and the average number (± SEM) of inner LifeAct-GFP foci (bottom) in the same cell 10 s before and 20 s after CK-666 treatment. Arrows indicate disappeared actin foci after CK666 treatment. (F) Shown are representative TIRF images of phalloidin-staining in the contact zone of flox control and cNKO B-cells after incubating with Fab’-PLB for 2 min (top) and the average number (± SEM) of inner F-actin foci per cell (bottom). (G) Shown are representative TIRF images of wild-type (WT) and Wasp germline knockout (WKO) B-cells expressing LifeAct-GFP incubated with Fab’-PLB for 2 min and the average number (± SEM) of inner F-actin foci per cell (bottom). Data points represent individual cells from three independent experiments with 10 (D, F, and G) or 6 (E) cells per condition per experiment. Scale bar, 2 µm. **p<0.01, ***p<0.001, by non-parametric student’s t-test.
Figure 2—video 1
Effects of CK-666 and Wasp germline knockout (WKO) on F-actin foci formation.
Splenic B-cells from LifeAct-GFP transgenic mice were incubated with Fab’-PLB in the absence and presence of CK-689 or CK-666 and imaged live at 37 °C at one frame per 2 s by interference reflection microscopy (IRM) and total internal reflection fluorescence microscopy (TIRF). Shown are representative IRM (A and C) and TIRF (B and D) time-lapse images of wild-type (WT) B-cells treated with CK-689 or CK-666 (50 µM) before and after maximal spreading (A and B) and WT and WKO B-cells expressing LifeAct-GFP (C and D). The video is sped up by 20 x compared to real time. Scale bar, 2 µm.
Figure 3 with 1 supplement
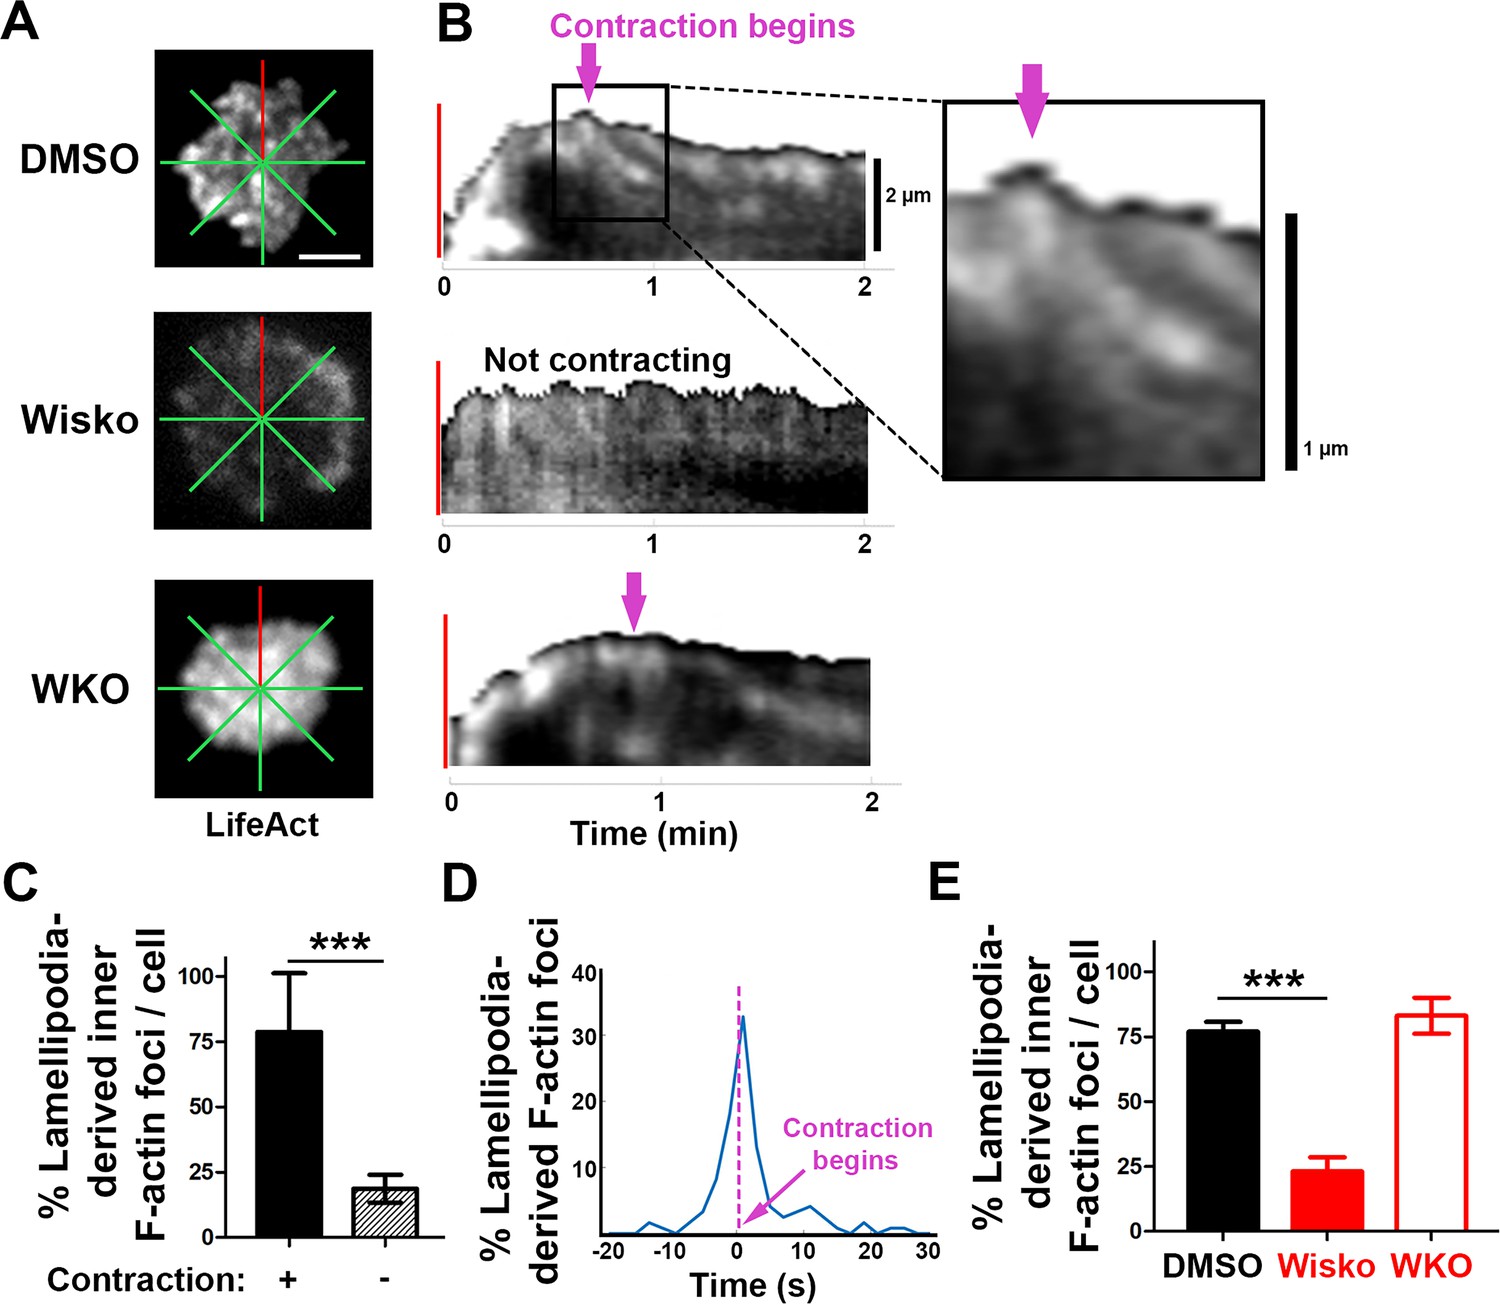
Inner F-actin foci are originated from lamellipodia behind the spreading membrane.
Mouse splenic B-cells from LifeAct-GFP transgenic mice were treated with DMSO or Wisko (10 µM), imaged live using total internal reflection fluorescence microscopy (TIRF) during incubation with Fab’-PLB at 37 °C, and analyzed using kymographs generated by Fiji ImageJ. (A) One frame of TIRF time-lapse images of LifeAct-GFP in the contact zone of B-cells treated with DMSO or Wisko and a Wasp germline knockout (WKO) B-cell. Lines indicate eight kymographs that were randomly generated from each cell. (B) Representative kymographs were generated from TIRF time-lapse images of LifeAct-GFP at the red line in (A). Top panel, a contracting cell. Arrows indicate the start of contraction with inner F-actin foci originating from lamellipodia. Middle panel, a non-contracting cell. Bottom panel, a WKO cell. Lamellipodia-derived inner F-actin foci were identified by their LifeAct-GFP FI ≥twofold of their nearby region, migrating out of the lamellipodial F-actin toward the center of the contact zone, and trackable for >8 s. (C) Percentages (± SEM) of kymographs showing inner F-actin foci originating from lamellipodia per cell that did and did not undergo contraction. Data were generated from three independent experiments with ~10 cells per condition per experiment. (D) A histogram of inner F-actin foci emerging (expressed as percentages of the total events, blue line) over time relative to the time of B-cell contraction (defined as 0 s, indicated by a purple dash line and arrow). Data were generated from five independent experiments with ~9 cells per condition per experiment. (E) Percentage (± SEM) of inner F-actin foci originated from lamellipodia observed in eight randomly positioned kymographs of each DMSO- or Wisko-treated wild-type (WT) or untreated WKO B-cell. Data were generated from three independent experiments with ~10 cells per condition per experiment. Scale bars, 2 µm. ***p<0.001, by non-parametric student’s t-test. MATLAB codes were used for generating kymographs from time-lapse data [Source code 7].
Figure 3—figure supplement 1
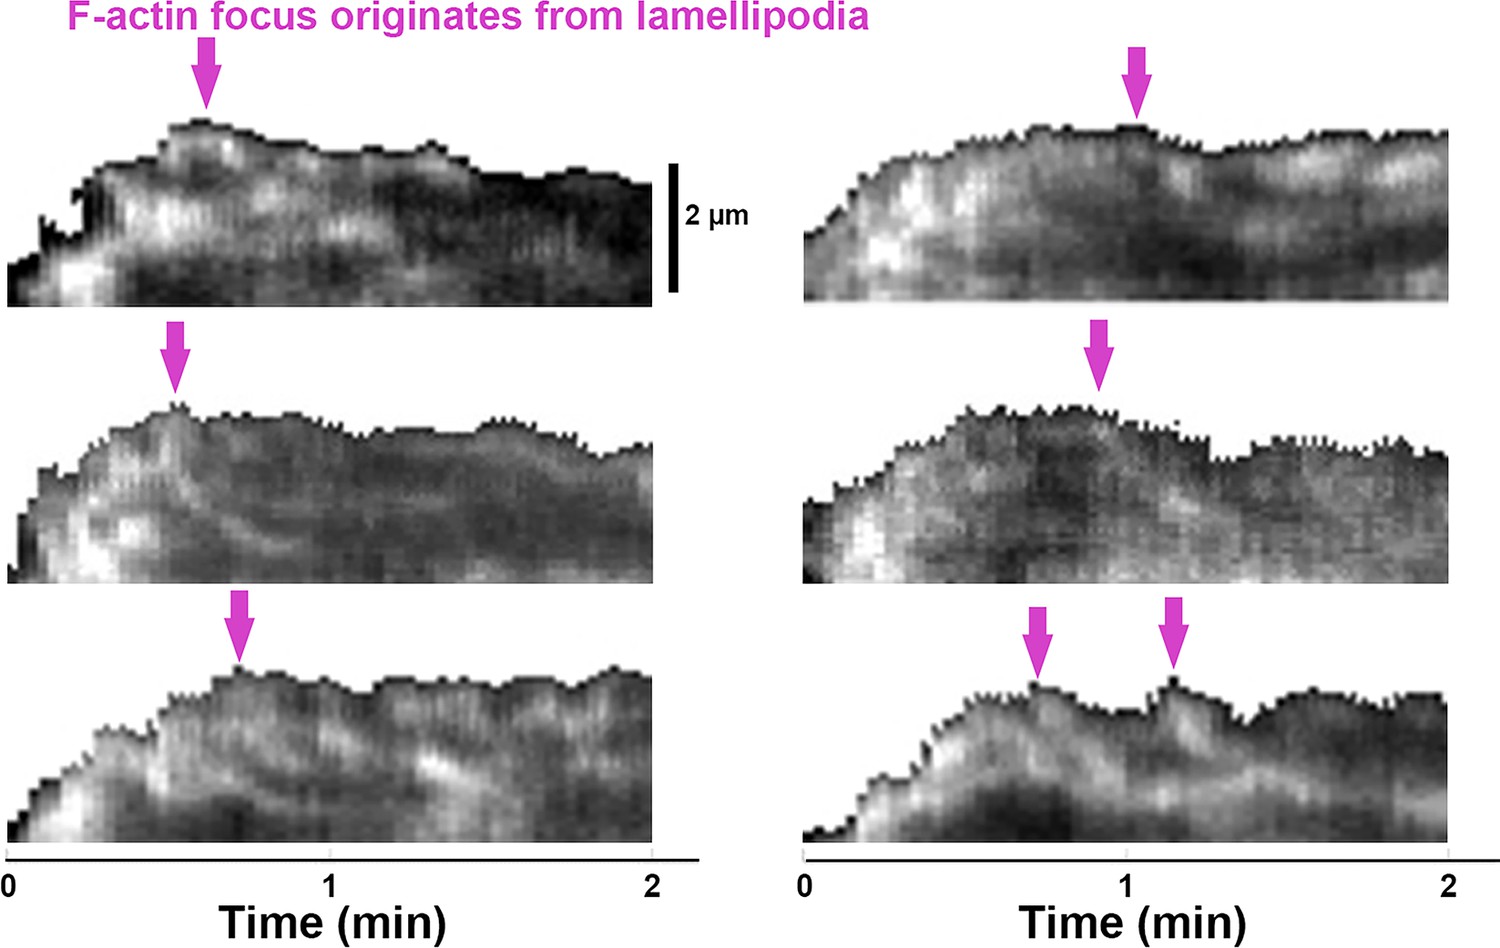
Emerging of Inner F-actin foci from lamellipodia.
Splenic B-cells from LifeAct-GFP transgenic mice were treated with DMSO, imaged live using total internal reflection fluorescence microscopy (TIRF) and interference reflection microscopy (IRM) during incubation with Fab’-PLB at 37 °C, and analyzed using kymographs that were randomly generated from each cell [Source code 7]. Shown are six examples of the kymographs used for analysis. Arrows indicate the emergence of inner F-actin foci near the lamellipodia. Lamellipodia-derived inner F-actin foci were identified by their LifeAct-GFP FI ≥twofold of their nearby region, inside location in the contact zone, migrating away the lamellipodial F-actin, and trackable for ≥8 s.
Figure 4
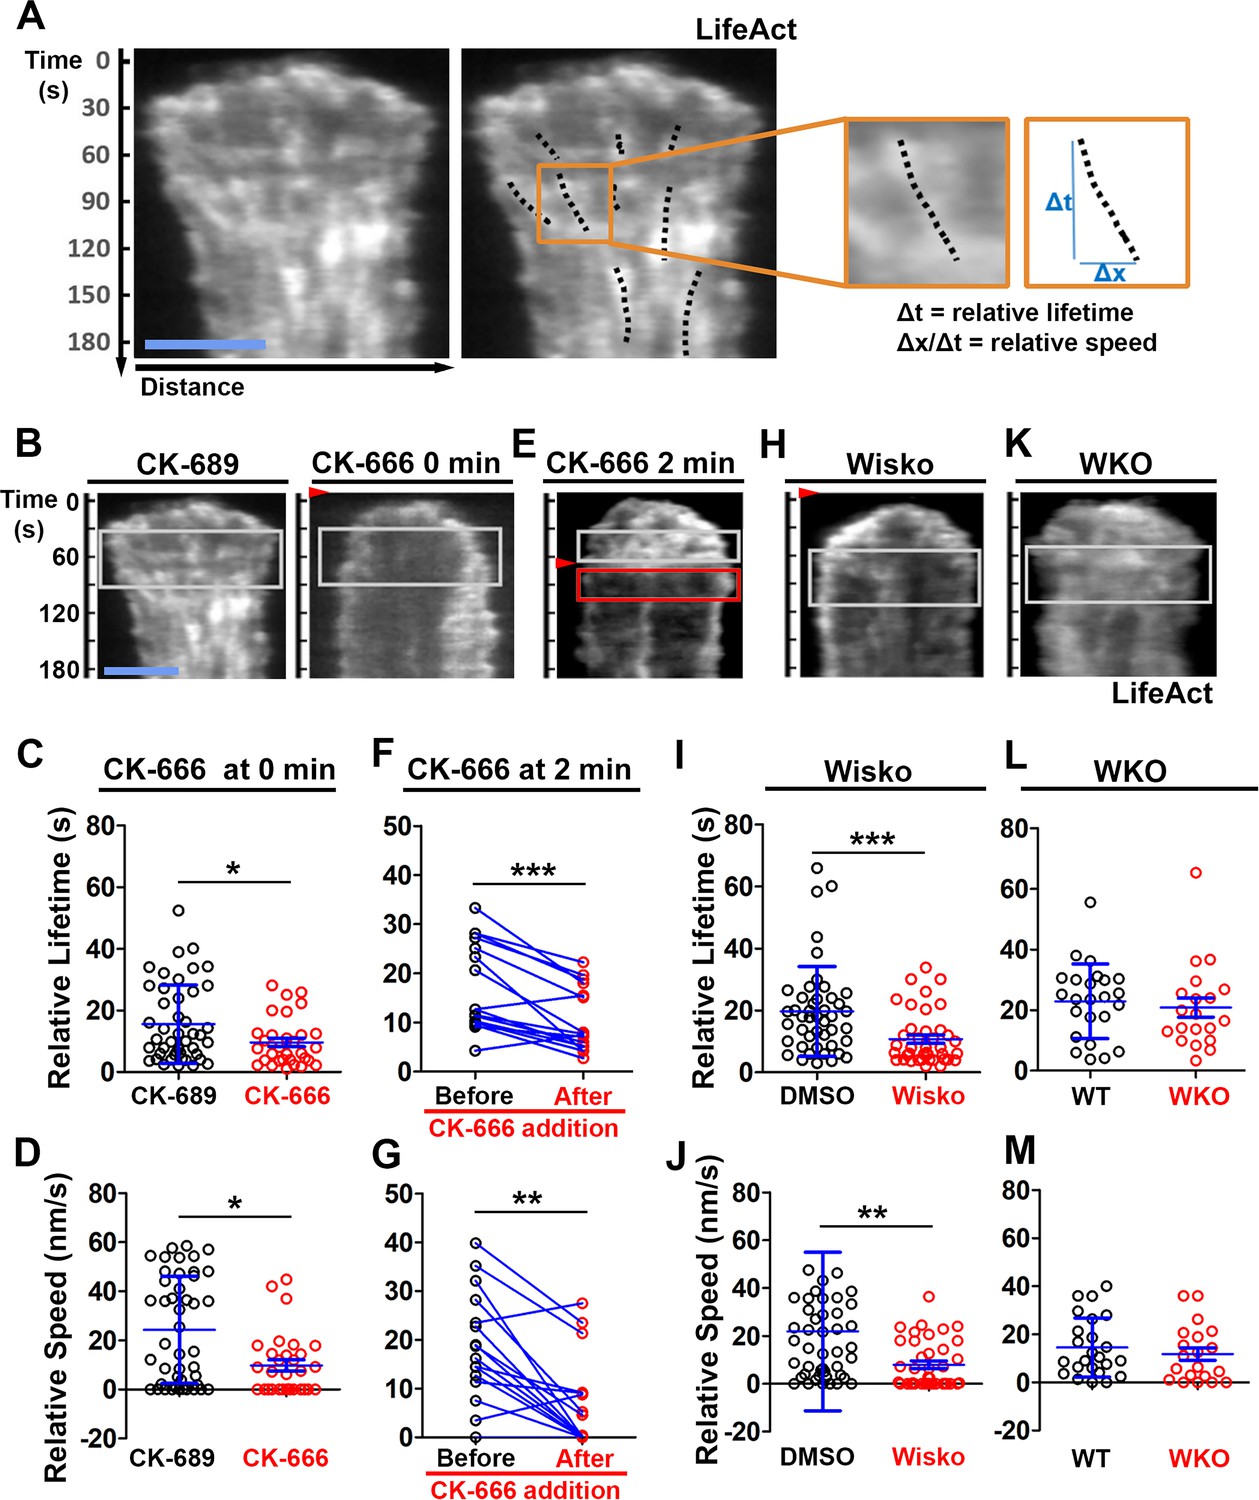
N-WASP-activated Arp2/3 sustains the lifetime and the centripetal movement of inner F-actin foci.
LifeAct-GFP-expressing B-cells were incubated with or without various inhibitors and imaged live by total internal reflection fluorescence microscopy (TIRF) during interaction with Fab’-PLB at 37 °C. Three kymographs were generated for each cell using time-lapse images and positioned to track as many inner actin foci as possible. (A) A representative kymograph from TIRF time-lapse images of a DMSO-treated B-cell (Left panels). Inner F-actin foci were identified as described in Figure 3, and those that emerged during the 60 s window after maximal spreading (white rectangles in B) and can be tracked for ≥4 s (dashed lines) in individual kymographs were analyzed. Relative lifetimes of inner F-actin foci were measured using the duration each focus could be detected in a kymograph. The relative distances traveled by the foci were measured using the displacement of each focus in a kymograph. Relative speed was calculated for each inner F-actin focus by dividing its relative distance by its relative lifetime (right panels). (B–D) B-cells were treated with CK-689 or CK-666 (50 µM) from the beginning of the incubation with Fab’-PLB (0 min). Shown are representative kymographs (B), relative lifetimes (C), and relative speed (D) of inner F-actin foci in CK-689- versus CK-666-treated B-cells. (E–G) B-cells were treated with CK-666 at maximal spreading (2 min). Shown are a representative kymograph of a CK-666-treated cell (E), relative lifetimes (F), and relative speeds (G) of inner F-actin foci in 30 s windows before the inhibition and 10 s after the inhibition in the same cells (linked by blue lines). (H–J) B-cells were treated with DMSO or Wisko (10 µM) 10 min before and during interaction with Fab’-PLB. Shown is a representative kymograph of a Wisko-treated B-cell (H), relative lifetime (I), and relative speed (J) of inner F-actin foci in DMSO versus Wisko-treated B-cells. (K–M) LifeAct-GFP-expressing wild-type (WT) and Wasp germline knockout (WKO) B-cells were incubated with Fab’-PLB. Shown are a representative kymograph of a WKO B-cell (K), relative lifetime (L), and relative speed (M) of WT versus WKO B-cells. Data points represent the averaged values from inner F-actin foci in individual cells, with three kymographs per cell and ~12 cells per condition per experiment from three independent experiments. Scale bar, 2 µm. *p<0.05, **p<0.01, ***p<0.001, by non-parametric and paired student’s t-test.
Figure 5 with 1 supplement
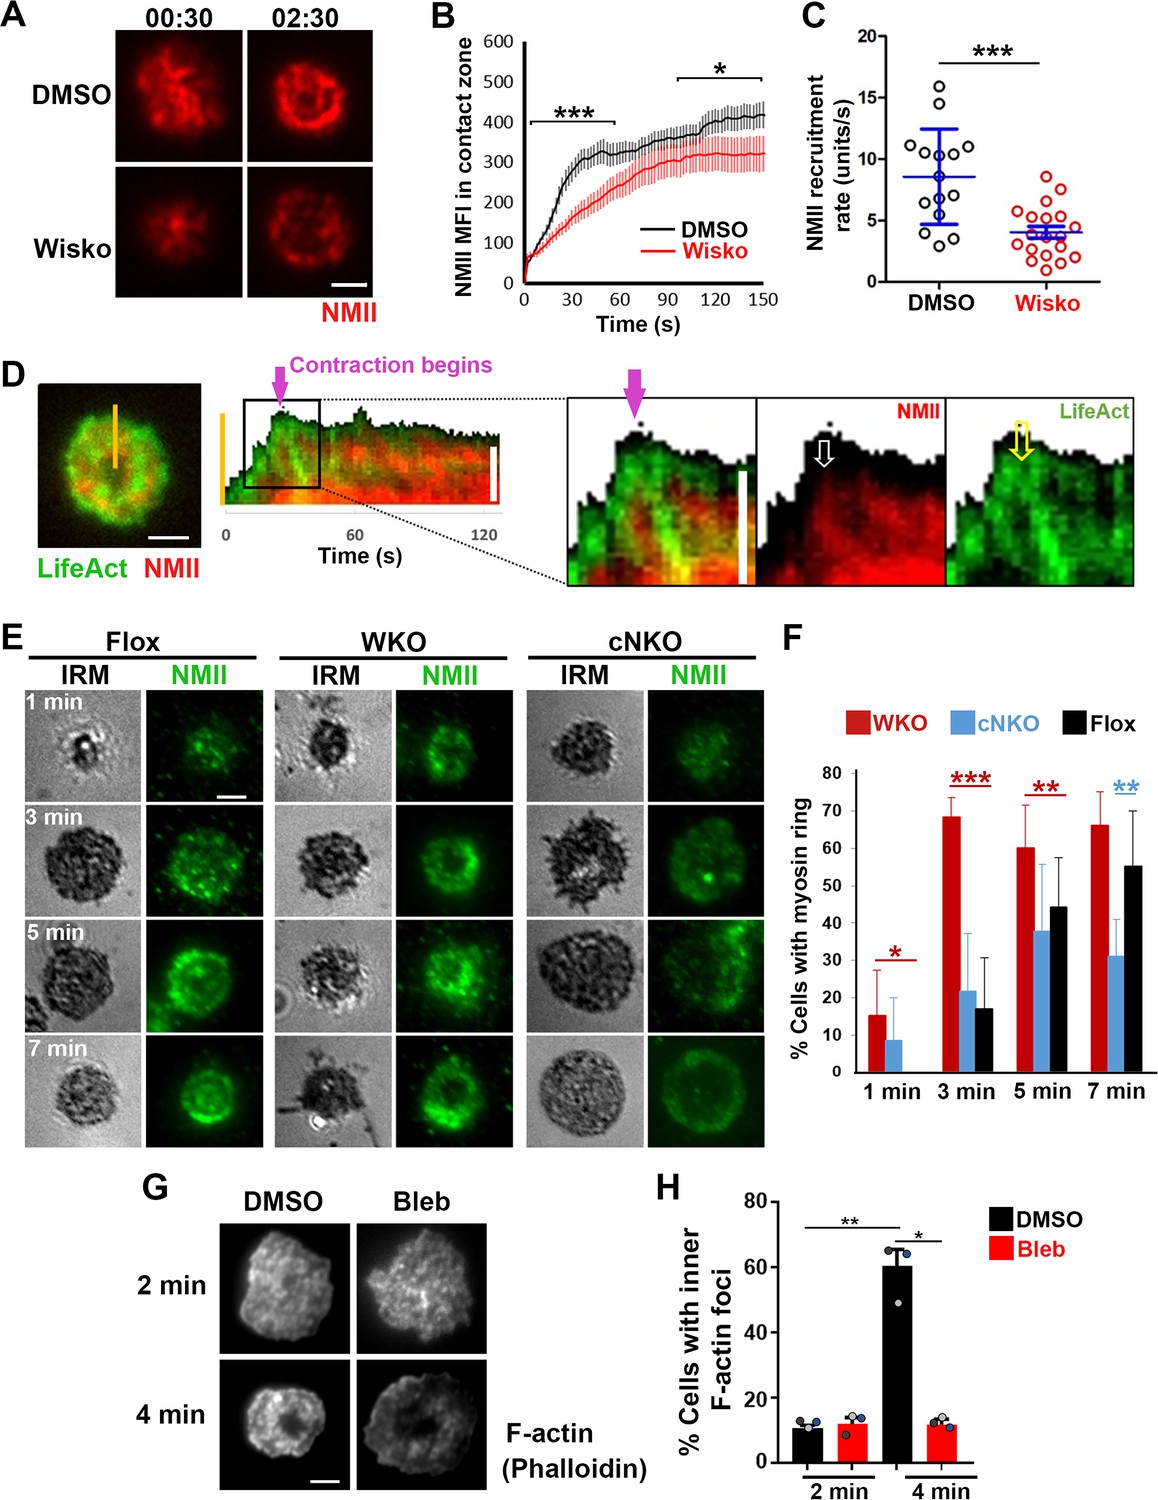
Neuronal-WASP (N-WASP) facilitates non-muscle myosin II (NMII) recruitment and ring-like structure formation, and NMII promotes inner F-actin foci ring maturation.
(A–C) B-cells from mice expressing the GFP fusion of non-muscle myosin IIA (GFP-NMIIA) transgene were treated with DMSO or Wisko (10 µM) 10 min before and during incubation with Fab’-PLB. The B-cell contact zones were imaged live using total internal reflection fluorescence microscopy (TIRF). Shown are representative TIRF images of DMSO- and Wisko-treated B-cells at 30 s (during spreading) and 2 min 30 s (after maximal spreading) post landing (A Scale bars, 2 µm), the averaged GFP-NMIIA MFI (± SEM) (B), and the initial rates of increasing (± SEM) of GFP-NMIIA in the contact zone (the slope of the initial GFP-NMIIA MFI versus time curves of individual cells) (C). Data points represent individual cells from three independent experiments with ~6 cells per condition per experiment. *p<0.05, ***p<0.001, by Kolmogorov-Smirnov test (B) or non-parametric student’s t-test (C). (D) Primary B-cells from mice expressing both GFP-NMIIA and LifeAct-RFP transgenes were incubated with Fab’-PLB at 37 °C and imaged live by TIRF. Shown are a representative TIRF image of a cell and a kymograph generated from time-lapse TIRF images at the yellow line. The purple arrow indicates the starting point of contraction, the white arrow GFP-NMIIA recruitment proximal to the spreading membrane, and the yellow arrow an F-actin (LifeAct-RFP) focus originating at the lamellipodia and moving away from the spreading membrane. (E, F) Primary B-cells from flox control, Wasp germline knockout (WKO), and B-cell-specific N-wasp knockout mice (cNKO) mice were incubated with Fab’-PLB for indicated times. Cells were fixed, permeabilized, stained for non-muscle myosin II (NMII) light chain, and imaged by interference reflection microscopy (IRM) and TIRF. Shown are representative IRM and TIRF images (E) and percentages (± SD) of B-cells with the NMII ring-like structure in individual images (F), identified by visual inspection. The data were generated from three independent experiments with five images per condition per experiment. Scale bars, 2 µm. *p<0.05, **p<0.01, ***p<0.001, by non-parametric student’s t-test. (G, H) Wild-type (WT) splenic B-cells were treated with DMSO or Blebbistatin (Bleb, 50 µM) 20 min before and during incubation with Fab’-PLB at 37 °C. Cells were fixed at 2 and 4 min, permeabilized, stained with phalloidin, and imaged by TIRF. Shown are representative TIRF images of the B-cell contact zone (G) and percentages of cells (± SEM) with inner F-actin foci forming ring-like distribution (H), determined as described in Figure 2. Data were generated from three independent experiments with ~50 cells per condition per experiment with different color dots representing individual experiments. Scale bar, 2 µm. *p<0.05, **p<0.01 by paired student’s t-test. MATLAB codes were used for detecting the B-cell contact zone and quantifying NMII FI [Source code 1, Source code 8 and Source code 9].
Figure 5—video 1
Wiskostatin treatment inhibits non-muscle myosin II (NMII) ring-like structure formation.
B-cells from mice expressing GFP fusion of non-muscle myosin IIA (GFP-NMIIA) and LifeAct-RFP transgenes were treated with DMSO or Wisko (10 µM) 10 min before and during incubation with Fab’-PLB. The B-cell contact zones were imaged live at one frame per 2 s using interference reflection microscopy (IRM) and total internal reflection fluorescence microscopy (TIRF). Shown are representative IRM and TIRF time-lapse images. The video is sped up by 20 x compared to real time. Scale bar, 2 µm.
Figure 6 with 3 supplements
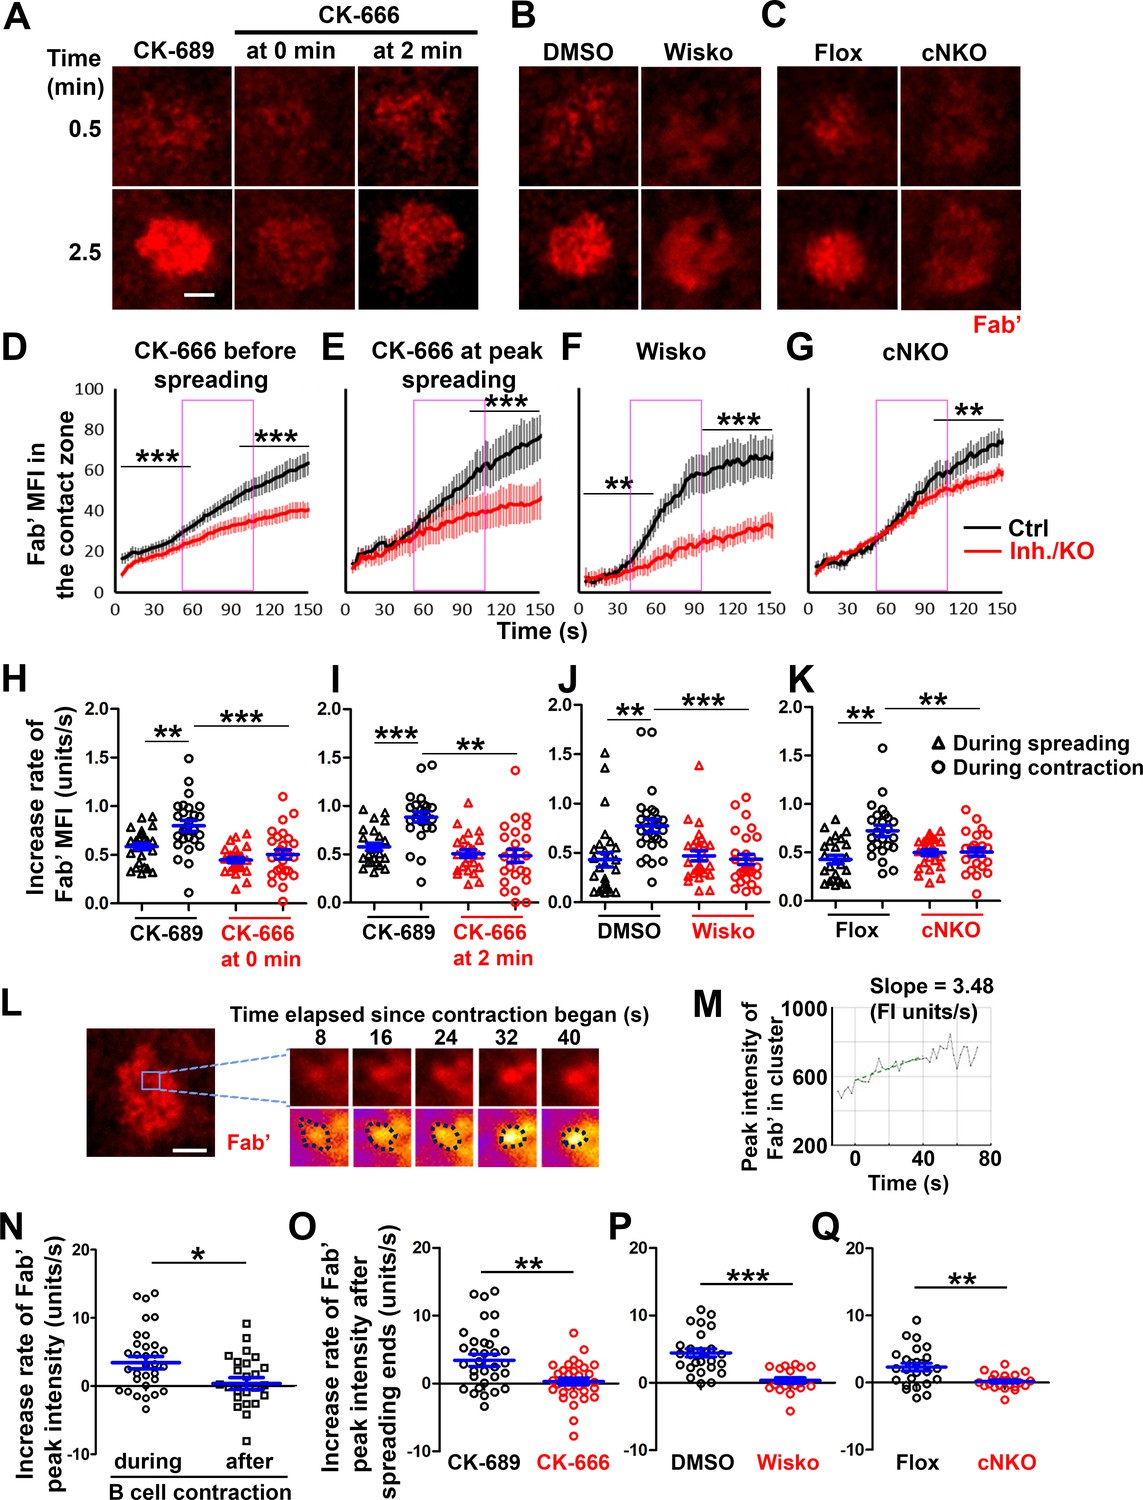
B-cell contraction increases the molecular density within B-cell receptor (BCR) clusters.
Primary B-cells from wild-type (WT) mice were treated with CK-689 or CK-666 from the beginning of the incubation with AF546-Fab’-PLB (0 min) or at the maximal B-cell spreading (2 min) (A, D, E, H, I, N, O). WT B-cells were treated with DMSO or Wisko (10 µM) 10 min before and during the incubation with AF546-Fab’-PLB (B, F, J, P). B-cells from flox control and B-cell-specific N-wasp knockout mice (cNKO) mice were incubated with AF546-Fab’-PLB (C, G, K, Q). The B-cell contact zones were imaged live by total internal reflection fluorescence microscopy (TIRF). (A–C) Representative time-lapse images at 30 s (during B-cell spreading) and 2 min 30 s (after maximal spreading) after cell landed. Scale bars, 2 µm. (D–G) The mean fluorescence intensity (MFI) of AF546-Fab’ in the contact zone was plotted over time. Purple rectangles indicate the contraction phase based on the changes in the average B-cell contact area over time. (H–K) Rates of AF546-Fab’ MFI increases in the B-cell contact zone before and during contraction were determined by the slope of AF546-Fab’ MFI versus time plots. Data points represent individual cells and were generated from three independent experiments with 6–12 cells per experiment. *p<0.05, **p<0.01, ***p<0.001, by Kolmogorov-Smirnov test (D–G) or paired student’s t-test (H–K). (L) A representative frame from a time-lapse of a CK-689-treated B-cell (left) shows AF546-Fab’ clusters 30 s after contraction began, and enlarged time-lapse images (right) show a single AF546-Fab’ cluster over a 40 s time window after contraction began. AF546 clusters were identified using the criteria: ≥250 nm in diameter, ≥1.1 fold of fluorescence intensity (FI) outside the B-cell contact zone, and trackable for ≥20 s. Scale bars, 2 µm. (M) The peak FI of an AF546-Fab’ cluster was measured over time, and the increasing rate of AF546-Fab’ peak FI of this cluster was determined by the slope of the plot. (N–Q) The rates (± SEM) of increase in AF546-Fab’ peak FI in individual clusters were compared between during and after contraction (N), between B-cells treated with CK-689 and CK-666 from 0 min (O), between DMSO- and Wisko-treated B-cells (P), and between flox control and cNKO B-cells (Q) after B-cells reached maximal spreading. Data points represent individual cells, the averaged slopes of clusters detected in one B-cell, from three independent experiments with 6~12 cells per condition per experiment. *p<0.05, **p<0.01, ***p<0.001, by non-parametric student’s t-test. MATLAB codes were used for detecting, tracking, and quantifying AF546-Fab’ clusters [Source code 1; 3; 8–14].
Figure 6—figure supplement 1
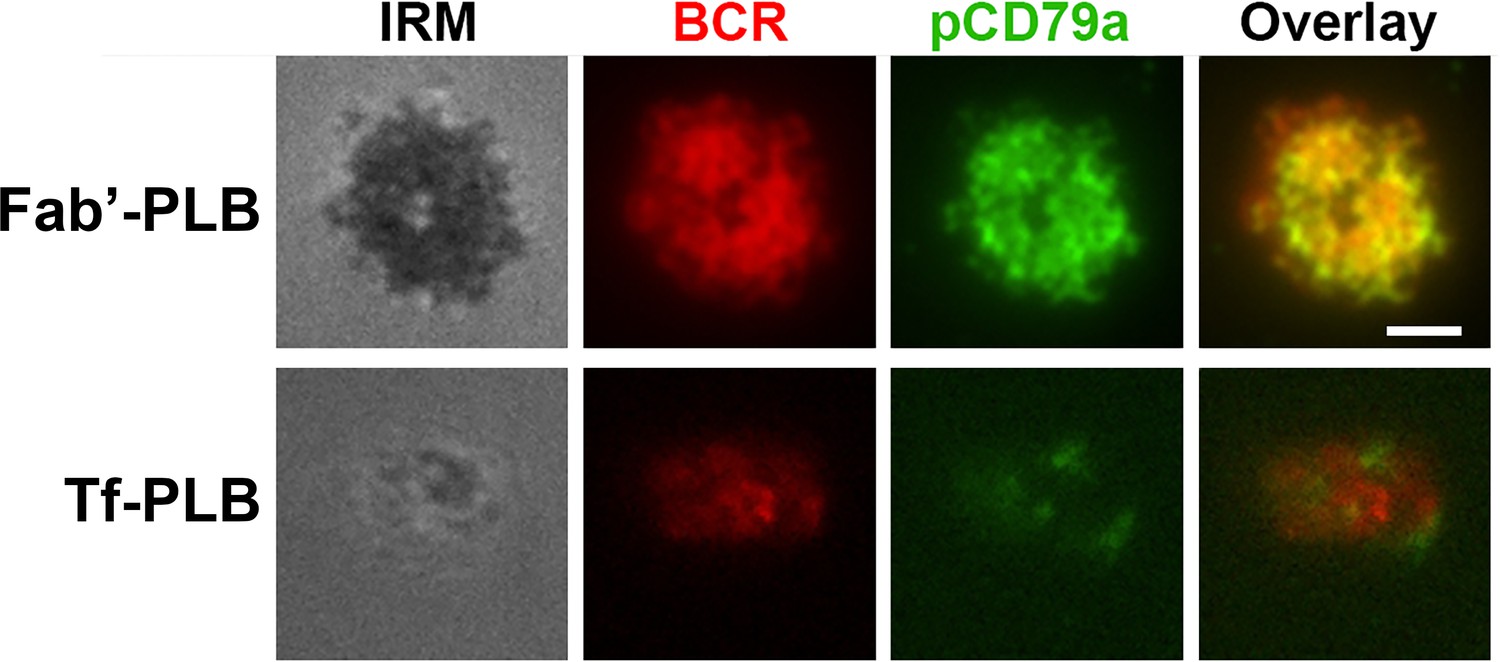
Fab’-PLB, but not transferrin-coated PLB (Tf-PLB), induces B-cell receptor (BCR) clustering and phosphorylation.
Wild-type (WT) splenic B-cells were pre-labeled with Cy3-Fab fragment of goat anti-mouse IgM + G at a concentration of 2.5 µg per 106 cells at 4 °C for 30 min, followed by incubation with Fab’-PLBs or Tf-PLBs for 5 min at 37 °C. Cells were fixed, permeabilized, stained for pCD79a, and imaged using interference reflection microscopy (IRM) and total internal reflection fluorescence microscopy (TIRF). Shown are representative IRM and TIRF images from three independent experiments. Scale bar, 2 µm.
Figure 6—figure supplement 2
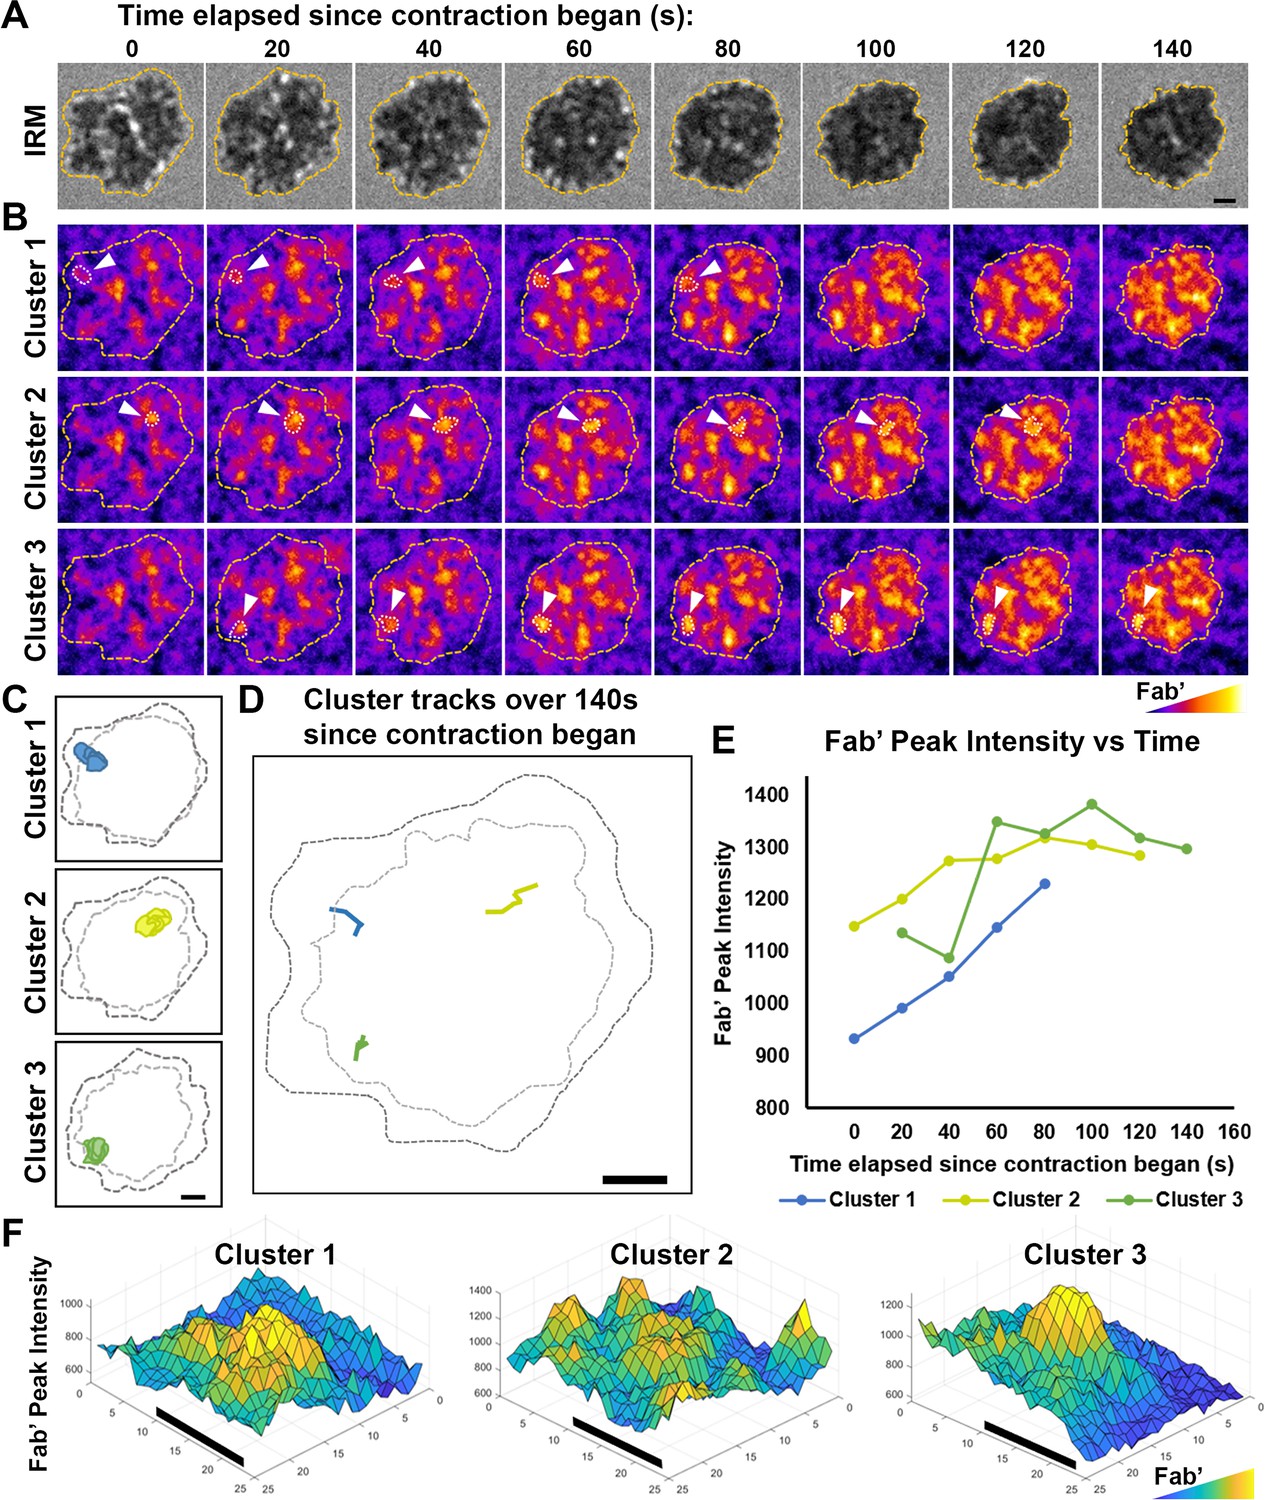
Tracking and analyzing AF546-Fab’ clusters in the B-cell contact zone.
Wild-type (WT) splenic B-cells were incubated with AF546-Fab’-PLB at 37 °C and imaged live using interference reflection microscopy (IRM) and total internal reflection fluorescence microscopy (TIRF). Shown are individual frames from time-lapse images of IRM (A) and TIRF (B), showing AF546-Fab’ clusters within the contact zone of one DMSO-treated (vehicle control for Wisko) B-cell for 140 sec since the beginning of contraction. Fab’ FI is shown as heat maps using Fiji ImageJ. The boundary of the contact zone, detected using IRM images by a custom MATLAB script [Source code 2], is shown in yellow dashed lines. Arrows point to three representative clusters among the other clusters detected in the contact zone using custom MATLAB codes [Source code 2; 3; 10–14]. Cluster detection masks for the three representative clusters are shown (C). Moving tracks for the three AF546-Fab’ clusters are shown alongside the initial (black dashed lines) and final state (gray dashed lines) of the contact zone (D). Tracks were generated by following the peak of AF546 FI in each cluster as it moved. AF546-Fab’ peak FI versus time curves for the three representative clusters are plotted over the duration that each cluster could be detected (E). Surface plots (2.5-D plots) of AF546-Fab’ FI show a zoomed-in region consisting of each of the three AF546-Fab’ clusters (F). Colors in (B) and (F) are scaled to AF546-Fab’ FI values. Scale bars, 1 µm.
Figure 6—video 1
Inhibition of B-cell contraction reduces the molecular density within B-cell receptor (BCR) clusters.
Splenic B-cells were incubated with AF546-Fab’-PLB in the absence and presence of various inhibitors and imaged live at 37 °C at one frame per 2 s by interference reflection microscopy (IRM) and total internal reflection fluorescence microscopy (TIRF). Shown are representative IRM (A, C, and E) and TIRF (B, D, and F) time-lapse images of wild-type (WT) B-cells treated with CK-689 or CK-666 (50 µM) before and after maximal spreading (A and B), WT B-cells treated with DMSO or Wisko (10 µM) 10 min before and during incubation with Fab’-PLB (C and D), and flox control or B-cell-specific N-wasp knockout mice (cNKO) B-cells (E and F). TIRF images (B, D, and F) are shown as AF546-Fab’ FI maps. The video is sped up by 20 x compared to real time. Scale bar, 2 µm.
Figure 7
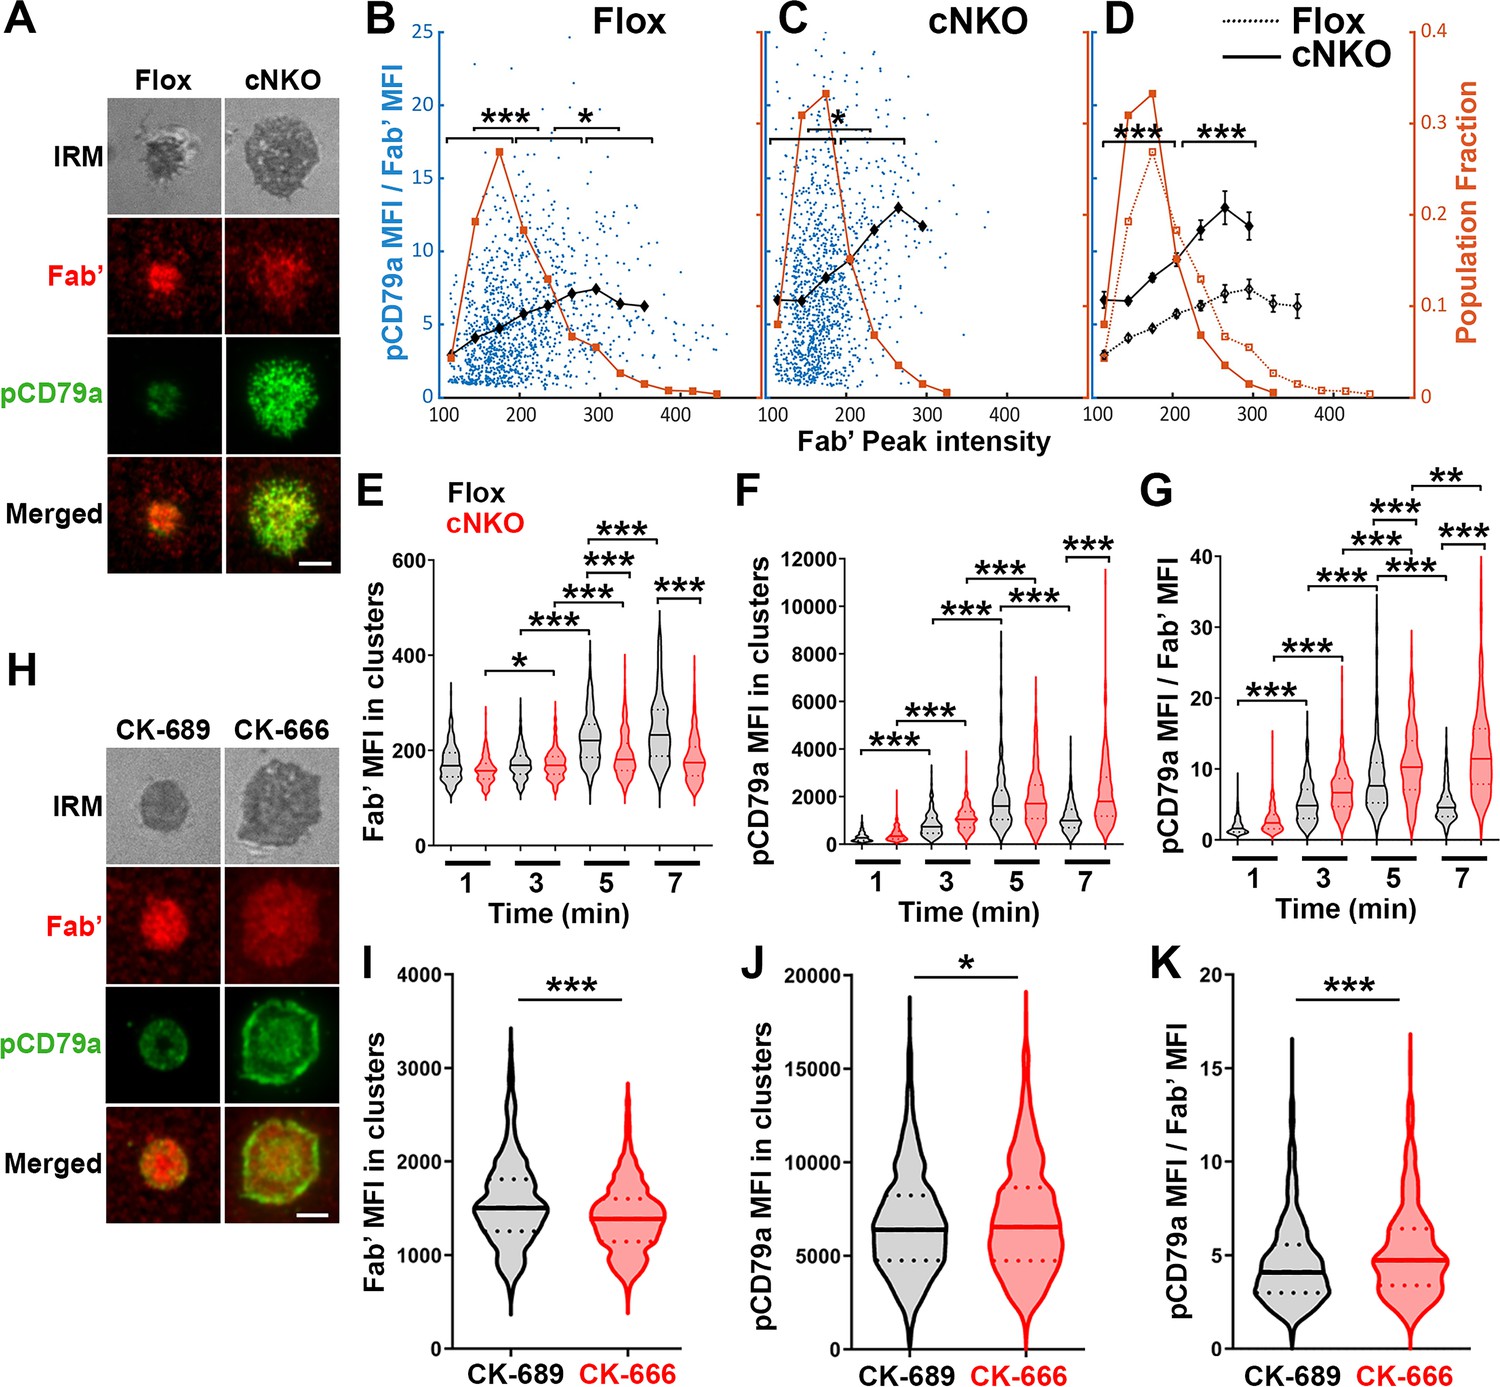
Increased molecular density in B-cell receptor (BCR) clusters leads to reductions in BCR phosphorylation.
(A–G) Flox control and B-cell-specific N-wasp knockout mouse (cNKO) B-cells incubated with AF546-Fab’-PLB were fixed at 1, 3, 5, and 7 min, permeabilized, stained for phosphorylated CD79a (pCD79a, Tyr182), and imaged using total internal reflection fluorescence microscopy (TIRF) and interference reflection microscopy (IRM). (A) Representative IRM and TIRF images of a flox control versus a cNKO B-cell at 7 min. Scale bars, 2 µm. (B–D) Ratios of pCD79a MFI relative to AF546-Fab’ MFI were plotted against AF546-Fab’ peak FI in individual AF546-Fab’ clusters in the contact zone of flox control (B), cNKO B-cells (C), or flox control and cNKO B-cells overlay (D). AF546-Fab’ clusters were identified as described in Figure 6 and Figure 6—figure supplement 2. Blue dots represent individual AF546-Fab’ clusters with an equal number of clusters from the 4 time points. The black line and diamond symbols represent the average ratios of pCD79a MFI to Fab’ MFI in individual BCR-Fab’ clusters within the indicated Fab’ peak FI range. The brown line and square symbols represent the fraction of the AF546-Fab’ clusters out of the total, within the indicated Fab’ peak FI range. Clusters were divided into three populations based on their peak AF546-Fab’ FI, relatively low (<190), medium (190-280), and high (>280, detected only in contracted cells), and the pCD79a to AF546-Fab’ MFI ratios of the three populations were compared (B and C). Data were generated from three independent experiments with ~20 cells and ≥125 clusters per condition per experiment. *p<0.05, ***p<0.001, by non-parametric student’s t-test. The p-values in (D) were corrected using the Benjamini-Hochberg/Yekutieli method for false discovery rate control. (E–G) The mean fluorescence intensity (MFI) (± SEM) of AF546-Fab’ (E) and pCD79a (F) and the MFI ratio (± SEM) of pCD79a relative to AF546-Fab’ (G) in individual AF546-Fab’ clusters at indicated times were compared between flox control and cNKO B-cells and between different times. (H–K) WT B-cells treated with CK-689 or CK-666 after 2 min-incubation with AF546-Fab’-PLB. (H) Representative IRM and TIRF images of a CK-689- versus a CK-666-treated B-cell at 7 min. Scale bars, 2 µm. (I–K) The MFI (± SEM) of AF546-Fab’ (I) and pCD79a (J) and the MFI ratio (± SEM) of pCD79a relative to AF546-Fab’ (K) in individual AF546-Fab’ clusters were compared between CK-689- and CK-666-treated B-cells after 7 min stimulation. Data points represent individual clusters. Horizontal solid lines in the violin plots represent the mean, while the dotted lines represent the quartiles of the distribution. Data were generated from three independent experiments with ~20 cells per condition per experiment. *p<0.05, ***p<0.001, by non-parametric student’s t-test. MATLAB codes were used for detecting and quantifying AF546-Fab’ clusters [Source code 1; 10 and 11].
Figure 8
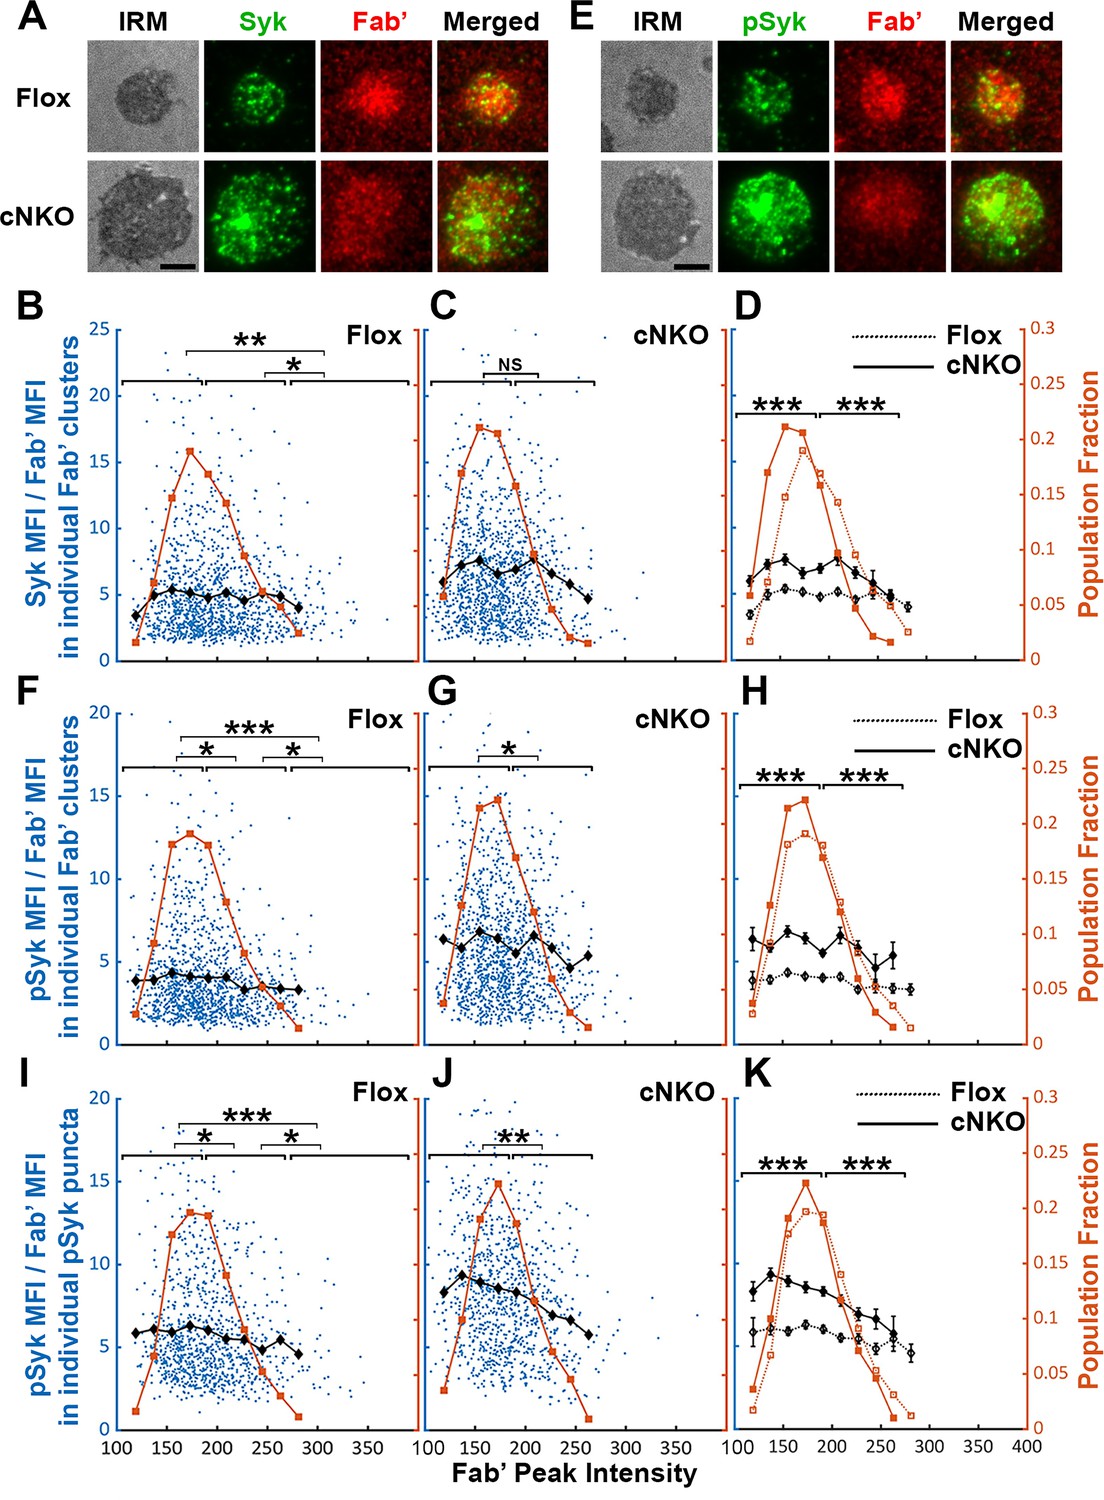
Effects of BCR-Fab’ density on the association of spleen tyrosine kinase (Syk) with BCR-Fab’ clusters and its phosphorylation.
Primary B-cells from flox control and B-cell-specific N-wasp knockout mice (cNKO) mice were incubated with AF546-Fab’-PLB at 37 °C, fixed at 3 or 7 min, stained for total Syk and phosphorylated Syk (pSyk Y519/520), and imaged by interference reflection microscopy (IRM) and total internal reflection fluorescence microscopy (TIRF). (A) Representative IRM and TIRF images of Syk staining in a flox control versus a cNKO B-cell at 7 min (Scale bars, 2 µm). (B–D) Ratios of Syk MFI relative to AF546-Fab’ MFI were plotted against AF546-Fab’ peak fluorescence intensity (FI) in individual AF546-Fab’ clusters in the contact zone of Flox control (B) and cNKO B-cells (C) and their overlay (D). AF546-Fab’ clusters were identified as described in Figure 6 and Figure 6—figure supplement 2 from an equal number of cells after 3- and 7 min stimulation. Blue dots represent individual AF546-Fab’ clusters with an equal number of clusters from each time point. The black line and diamond symbols represent the average ratios of Syk MFI to Fab’ MFI in individual AF546-Fab’ clusters at indicated Fab’ peak FI ranges. The brown line and square symbols represent the fraction of the AF546-Fab’ clusters out of the total at indicated Fab’ peak FI ranges. (E) Representative IRM and TIRF images of pSyk staining in a flox control versus a cNKO B-cell at 7 min (Scale bars, 2 µm). (F–H) Ratios of pSyk MFI relative to AF546-Fab’ MFI were plotted against AF546-Fab’ peak FI in individual AF546-Fab’ clusters in the contact zone of flox control (F) and cNKO B-cells (G) and their overlay (H). Blue dots represent individual AF546-Fab’ clusters with an equal number of clusters from each time point. The black line and diamond symbols represent the average ratios of pSyk MFI to Fab’ MFI in individual AF546-Fab’ clusters at indicated Fab’ peak FI ranges. The brown line and square symbols represent the fraction of the AF546-Fab’ clusters out of the total at indicated Fab’ peak FI ranges. (I–K) MFI ratios of pSyk relative to AF546-Fab’ were plotted against AF546-Fab’ peak FI in individual pSyk puncta in the contact zone of Flox control (I) and cNKO B-cells (J) and their overlay (K). pSyk puncta were identified using the criteria: FI ≥1.3 fold of the background outside the B-cell contact zone and diameter ≥250 nm. Blue dots represent individual pSyk puncta with an equal number of clusters from each time point. The black line and diamond symbols represent the average ratios of pSyk MFI to Fab’ MFI in individual pSyk puncta at indicated Fab’ peak FI ranges. The brown line and square symbols represent the fraction of the pSyk puncta out of the total at indicated Fab’ peak FI ranges. Clusters were divided into three populations based on their peak AF546-Fab’ FI, relatively low (<190), medium (190-280), and high (>280, detected only in contracted cells), and the Syk (B and C) or pSyk (F, G, I, and J) to AF546-Fab’ MFI ratios of the three populations were compared. Data were generated from three independent experiments with ~23 cells and ≥125 clusters per condition per experiment. *p<0.05, **p<0.01, ***p<0.001, by non-parametric student’s t-test, between AF546-Fab’ cluster group with different Fab’ peak FI ranges. The p-values in (D, H, and K) were corrected using the Benjamini-Hochberg/Yekutieli method for false discovery rate control. MATLAB codes were used for detecting and quantifying AF546-Fab’ clusters [Source code 1; 10 and 11].
Figure 9
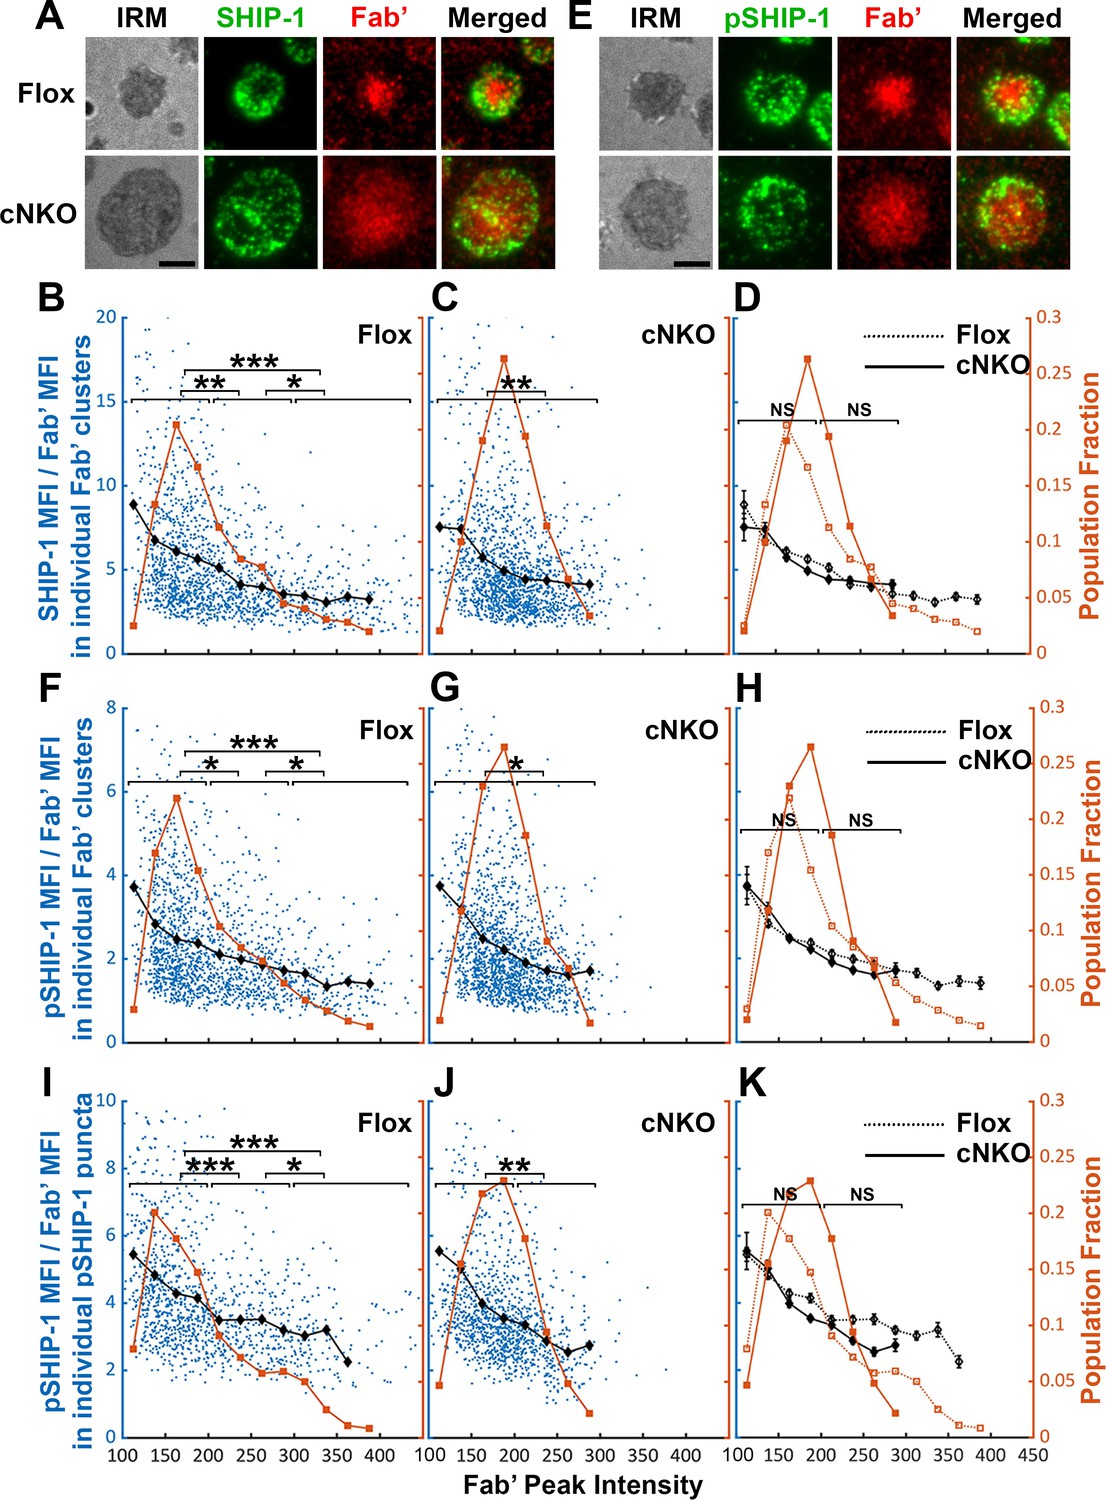
The effects of BCR-Fab’ density on the association of phosphatidylinositol-5 phosphatase-1 (SHIP-1) with BCR-Fab’ clusters and its phosphorylation.
Primary B-cells from flox control and B-cell-specific N-wasp knockout mice (cNKO) mice were incubated with AF546-Fab’-PLB at 37 °C, fixed at 3 or 7 min, stained for total SHIP-1 and phosphorylated SHIP-1 (pSHIP-1 Tyr1020), and imaged by interference reflection microscopy (IRM) and total internal reflection fluorescence microscopy (TIRF). (A) Representative IRM and TIRF images of SHIP-1 staining in a flox control versus a cNKO B-cell at 7 min (Scale bars, 2 µm). (B–D) Ratios of SHIP-1 MFI relative to AF546-Fab’ MFI were plotted against AF546-Fab’ peak fluorescence intensity (FI) in individual AF546-Fab’ clusters in the contact zone of Flox control (B) and cNKO B-cells (C). An overlay of flox control and cNKO plots is also shown (D). AF546-Fab’ clusters were identified as described in Figure 6 and Figure 6—figure supplement 2 from an equal number of cells after 3 and 7 min stimulation. Blue dots represent individual AF546-Fab’ clusters with an equal number of clusters from each time point. The black line and diamond symbols represent the average ratios of SHIP-1 MFI to Fab’ MFI in individual AF546-Fab’ clusters at indicated Fab’ peak FI ranges. The brown line and square symbols represent the fraction of the AF546-Fab’ clusters out of the total at indicated Fab’ peak FI ranges. (E) Representative IRM and TIRF images of pSHIP-1 staining in a flox control versus a cNKO B-cell at 7 min (Scale bars, 2 µm). (F–H) Ratios of pSHIP-1 MFI relative to AF546-Fab’ MFI were plotted against AF546-Fab’ peak FI in individual AF546-Fab’ clusters in the contact zone of flox control (F) and cNKO B-cells (G) and their overlay (H). Blue dots represent individual AF546-Fab’ clusters with an equal number of clusters from each time point. The black line and diamond symbols represent the average ratios of pSHIP-1 MFI to Fab’ MFI in individual AF546-Fab’ clusters at indicated Fab’ peak FI ranges. The brown line and square symbols represent the fraction of the AF546-Fab’ clusters out of the total at indicated Fab’ peak FI ranges. (I–K) Mean fluorescence intensity (MFI) ratios of pSHIP-1 relative to AF546-Fab’ were plotted against AF546-Fab’ peak FI in individual pSHIP-1 puncta in the contact zone of Flox control (I) and cNKO B-cells (J) and their overlay (K). pSHIP-1 puncta were identified using the criteria: FI ≥1.5 fold of the background outside the B-cell contact zone and diameter ≥250 nm. Blue dots represent individual pSHIP-1 puncta with an equal number of clusters from each time point. The black line and diamond symbols represent the average ratios of pSHIP-1 MFI to Fab’ MFI in individual pSHIP-1 puncta at indicated Fab’ peak FI ranges. The brown line and square symbols represent the fraction of the total pSHIP-1 puncta at indicated Fab’ peak FI ranges. Clusters were divided into three populations based on their peak AF546-Fab’ FI, relatively low (<200), medium (200-300), and high (>300, detected only in contracted cells), and the SHIP-1 (B and C) or pSHIP-1 (F, G, I, and J) to AF546-Fab’ MFI ratios of the three populations were compared. Data were generated from three independent experiments with ~23 cells and ≥125 clusters per condition per experiment. *p<0.05, **p<0.01, ***p<0.001, by non-parametric student’s t-test, between AF546-Fab’ cluster group with different Fab’ peak FI ranges. The p-values in (D, H, and K) were corrected using the Benjamini-Hochberg/Yekutieli method for false discovery rate control. MATLAB codes were used for detecting and quantifying AF546-Fab’ clusters Source code 1; 10 and 11.
Figure 10
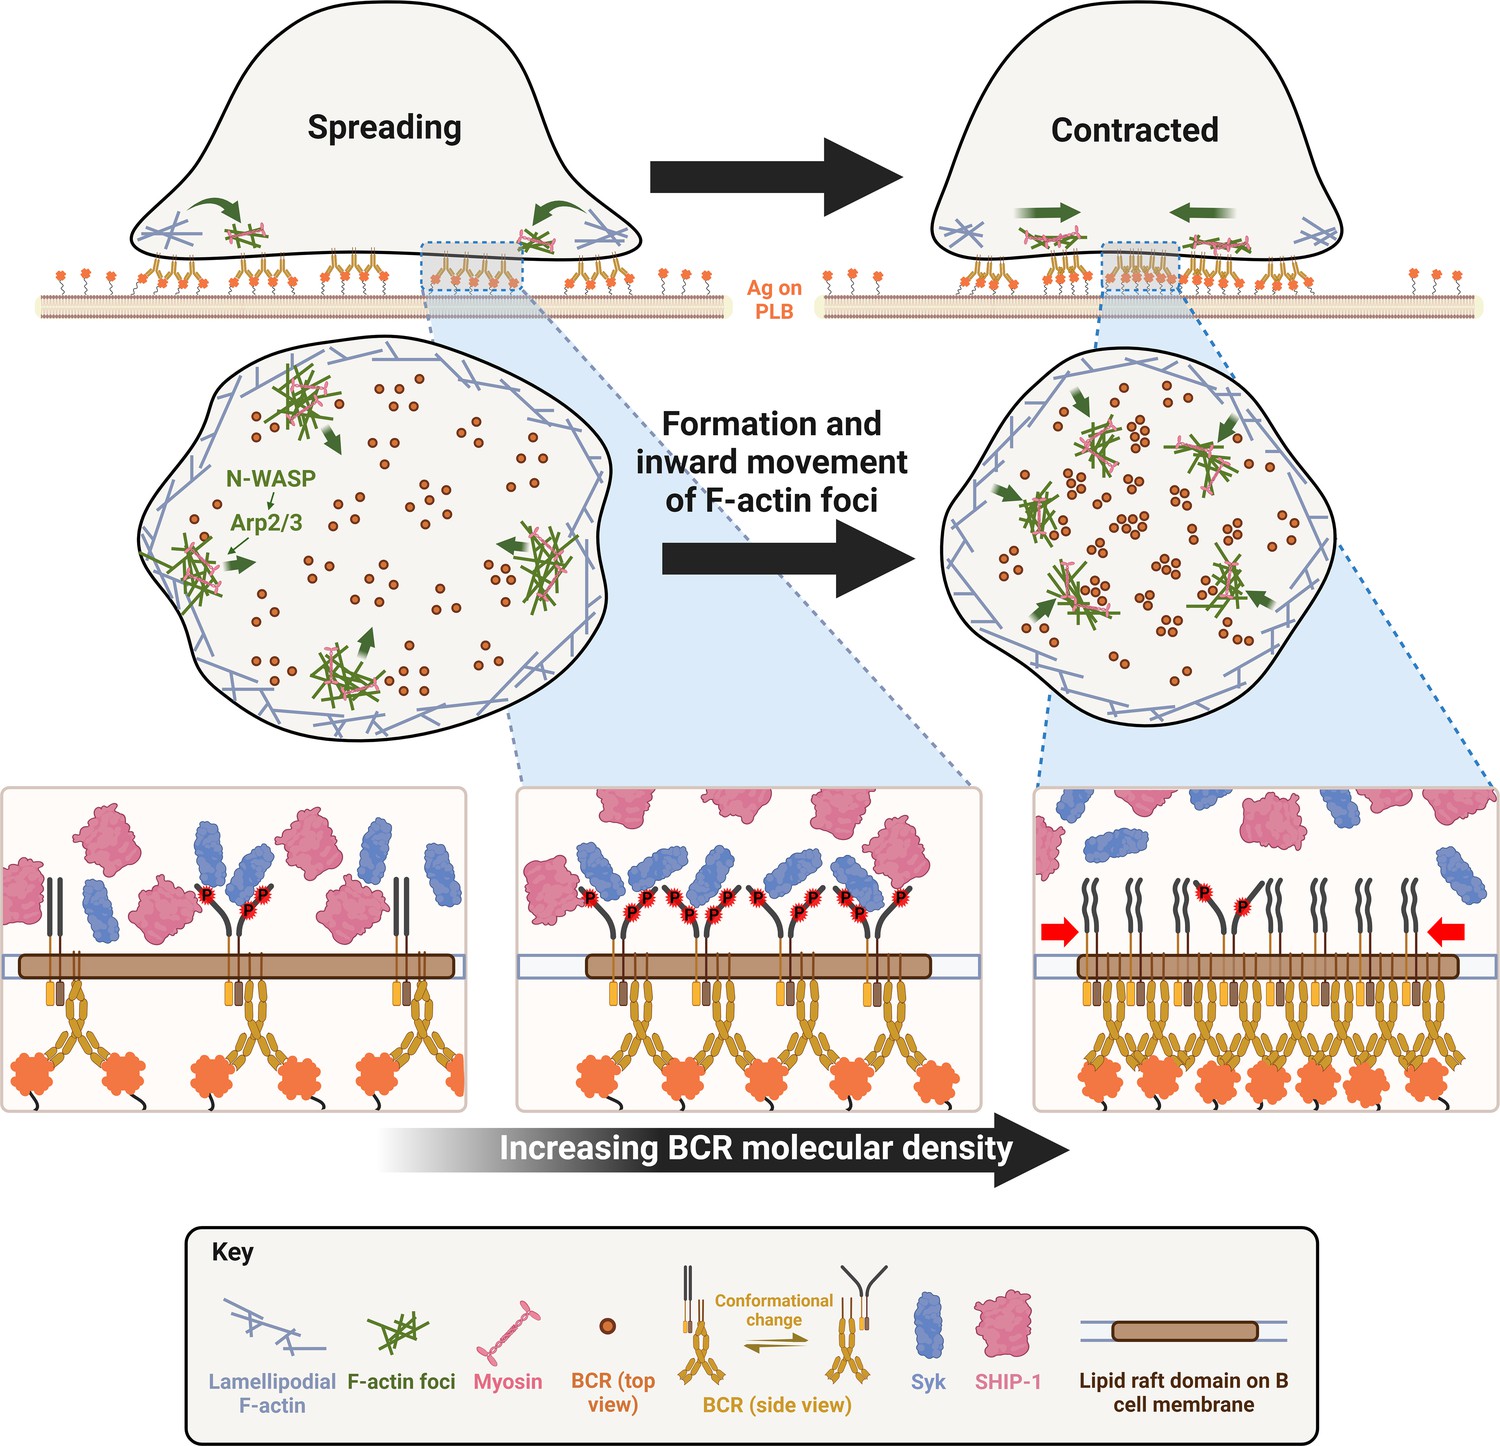
A working model for cell contraction-mediated B-cell receptor (BCR) signaling attenuation.
When encountering membrane-associated antigen, mature follicular B-cells undergo rapid spreading, primarily driven by WASP-mediated branched actin polymerization, which maximizes B-cell contact with antigen-presenting surface and BCR-antigen engagement, amplifying signaling. Upon reaching maximal spreading, neuronal-WASP (N-WASP) distal to lamellipodial networks activates Arp2/3-mediated branched actin polymerization, which initiates the generation of inner F-actin foci from lamellipodia towards the center of the B-cell contact zone. Non-muscle myosin II (NMII) is then preferentially recruited to these relatively stable inner foci, which in turn promotes the centripetal movement of inner F-actin foci and the maturation of ring-like actomyosin structures, enabling B-cell contraction. B-cell contraction pushes the BCR microclusters formed during B-cell spreading to the center of the contact zone, increasing their molecular density. Increased molecular density promotes the disassociation of signaling molecules from BCR clusters, probably due to crowding and conformational changes, leading to signaling attenuation.
Tables
Key resources table
| Reagent type (species) or resource | Designation | Source or reference | Identifiers | Additional information |
|---|---|---|---|---|
| Strain (Mus musculus) | C57BL/6 (WT) | Jackson Laboratories | JAX stock #000664 | Primary cells |
| Strain (Mus musculus) | Wasp-/- mice (WKO) | Jackson Laboratories | JAX stock #019458 | Primary cells |
| Strain (Mus musculus) | Cd19Cre/+N-waspflox/flox mice (cNKO) | Lisa Westerberg laboratory | Primary cells | |
| Strain (Mus musculus) | N-waspflox/flox (Flox control) | Lisa Westerberg laboratory | Primary cells | |
| Strain (Mus musculus) | LifeAct-GFP | Roberto Weigert laboratory | Primary cells | |
| Strain (Mus musculus) | LifeAct-RFP | Klaus Ley laboratory | Primary cells | |
| Strain (Mus musculus) | GFP-NMIIA | Robert Adelstein laboratory | Primary cells | |
| Chemical compound | 1,2-dioleoyl-sn-glycero-3-phosphocholine | Avanti Polar Lipids | 850375 P | Liposomes (5 mM) |
| Chemical compound | 1,2-dioleoyl-sn-glycero-3-phosphoethanolamine-cap-biotin | Avanti Polar Lipids | 870273 C | Liposomes (50 µM) |
| Other | Streptavidin | Jackson Immuno Research | 016-000-084 | (1 µg/ml) |
| Antibody | F(ab’)2 fragment of goat IgG anti-mouse Ig(G+M) (goat polyclonal) | Jackson Immuno Research | 115-006-068 | - |
| Antibody | Cy3-Fab fragment of goat anti-mouse IgG + M (goat polyclonal) | Jackson Immuno Research | 115-167-020 | (2.5 µg per 1x10⁶ cells) |
| Chemical compound | 2-Mercaptoethylamine HCL | Thermo Fisher Scientific | 20408 | (50 mM) |
| Other | EZ-Link Maleimide-PEG2-biotin | Thermo Fisher Scientific | A39261 | (20 mM per mM of protein) |
| Commercial kit | Alexa Fluor 546 antibody labeling kit | Thermo Fisher Scientific | A20183 | - |
| Other | Biotinylated holo-transferrin (Tf) | Jackson Immuno Research | 015-060-050 | - |
| Antibody | Rat IgG2b anti-mouse CD90.2 (Thy1.2) (rat monoclonal) | Biolegend | 105351 | (1 µl per 2x10⁶ cells) |
| Chemical compound | CK-689 | Millipore Sigma | 182517–25 MG | Inhibitor control (50 µM) |
| Chemical compound | CK-666 | Millipore Sigma | SML0006-5MG | Arp2/3 inhibitor (50 µM) |
| Chemical compound | Wiskostatin | Millipore Sigma | W2270-5MG | N-WASP inhibitor (10 µM) |
| Chemical compound | Blebbistatin | Cayman Chemicals | 13013 | NMII inhibitor (50 µM) |
| Antibody | Rabbit IgG anti-mouse Arp2 antibody (rabbit polyclonal) | Abcam | ab47654 | IF (1:100) |
| Antibody | Rabbit IgG anti-mouse pWASP antibody (rabbit polyclonal) | Thermo Fisher Scientific | PA5-105572 | IF (1:100) |
| Antibody | Rabbit IgG anti-mouse pN-WASP antibody (rabbit polyclonal) | Thermo Fisher Scientific | PA5-105307 | IF (1:100) |
| Antibody | AF488-goat IgG anti-rabbit IgG antibody (goat polyclonal) | Thermo Fisher Scientific | A-11034 | IF (1:200) |
| Antibody | AF546-goat IgG anti-rabbit IgG antibody (goat polyclonal) | Thermo Fisher Scientific | A-11035 | IF (1:200) |
| Other | Acti-stain-488 Phalloidin | Cytoskeleton | PHDG1-A | IF (200 nM) |
| Other | Acti-stain-555 Phalloidin | Cytoskeleton | PHDH1-A | IF (200 nM) |
| Antibody | Rabbit IgG anti-mouse NMIIA antibody (rabbit polyclonal) | Abcam | ab75590 | IF (1:100) |
| Antibody | Rabbit IgG anti-mouse pCD79a (Y182) (rabbit monoclonal) | Cell Signaling Technology | 14732 S | IF (1:100) |
| Antibody | Rabbit IgG anti-mouse pSyk (Y519/520) (rabbit monoclonal) | Cell Signaling Technology | 2710 S | IF (1:100) |
| Antibody | Rabbit IgG anti-mouse pSHIP-1 (Y1020) (rabbit polyclonal) | Cell Signaling Technology | 3941 S | IF (1:100) |
| Antibody | Rabbit IgG anti-mouse Syk (rabbit polyclonal) | Thermo Fisher Scientific | PA5-17812 | IF (1:100) |
| Antibody | Rabbit IgG anti-mouse SHIP-1 (rabbit polyclonal) | Thermo Fisher Scientific | PA5-115894 | IF (1:100) |
| Software, algorithm | MATLAB | MathWorks | R2022a | |
| Software, algorithm | Fiji-ImageJ | Fiji organization | Version 2.9.0/1.53t | |
| Software, algorithm | GraphPad Prism | GraphPad | Version 9.2.0 |
Additional files
-
MDAR checklist
- https://cdn.elifesciences.org/articles/87833/elife-87833-mdarchecklist1-v2.docx
-
Source code 1
Acquiring masks of B-cell contact zones from IRM images.
This MATLAB script inputs raw 16-bit .nd2 images and outputs a binary mask of all detected contact zones for further analysis.
- https://cdn.elifesciences.org/articles/87833/elife-87833-code1-v2.zip
-
Source code 2
Acquiring a mask of a B-cell contact zone from an IRM time-lapse image.
This MATLAB script tracks the contact zone of a B-cell from time-lapse images and outputs a time-lapse mask file.
- https://cdn.elifesciences.org/articles/87833/elife-87833-code2-v2.zip
-
Source code 3
Analyzing time-lapse images frame-by-frame for each B-cell.
This MATLAB liveScript comprises several sections, including Source codes 5-8. It inputs time-lapse 16-bit .tiff images of a single cell consisting of IRM and two fluorescent channels. It outputs contact zone area (µm2), MFI, and TFI as an Excel file.
- https://cdn.elifesciences.org/articles/87833/elife-87833-code3-v2.zip
-
Source code 4
Saving sets of time-lapse images to specified directory locations.
This MATLAB script saves a single time-lapse file for further analysis.
- https://cdn.elifesciences.org/articles/87833/elife-87833-code4-v2.zip
-
Source code 5
Quantifying fluorescence intensity from time-lapse images.
This MATLAB script analyzes fluorescent intensity in time-lapse images of three-channels: IRM and two fluorescent channels.
- https://cdn.elifesciences.org/articles/87833/elife-87833-code5-v2.zip
-
Source code 6
Exporting quantified data to an Excel file.
This MATLAB script exports timelapse data for one B-cell into a specified Excel file.
- https://cdn.elifesciences.org/articles/87833/elife-87833-code6-v2.zip
-
Source code 7
Generating kymographs from a specified channel of a time-lapse TIRF image.
This MATLAB script generates eight radially equally spaced kymographs from time-lapse images of a B-cell consisting of IRM and two fluorescent channels.
- https://cdn.elifesciences.org/articles/87833/elife-87833-code7-v2.zip
-
Source code 8
Quantifying mean (MFI) and total fluorescence intensity (TFI) in the B-cell contact zone from TIRF images.
This MATLAB script inputs a list of binary masks of B-cell contact zones, quantifies data using Source code 3, and generates a data table for each contact zone.
- https://cdn.elifesciences.org/articles/87833/elife-87833-code8-v2.zip
-
Source code 9
Quantifying contact zone area, MFI, and TFI from one three-channel 16-bit .nd2 image.
This MATLAB script inputs a three-channel image, including an IRM, and two fluorescent channels (labeled 'red' and 'green'), and a mask of all B-cell contact zones in the image. It calculates and outputs the contact zone area (µm2) and MFI and TFI of the 'red' and the 'green' channels.
- https://cdn.elifesciences.org/articles/87833/elife-87833-code9-v2.zip
-
Source code 10
Detecting fluorescent puncta from still or time-lapse TIRF images of B-cells.
This MATLAB script identifies AF546-Fab' clusters and signaling molecule puncta from 16-bit .nd2 images consisting of three channels: IRM, AF546-Fab', and (stained) signaling molecule. Inputs B-cell contact zone masks, utilizes Source code 11 to quantify AF546-Fab' peak intensity, Fab’ MFI, and signaling molecule MFI in each detected cluster, and generates the data table.
- https://cdn.elifesciences.org/articles/87833/elife-87833-code10-v2.zip
-
Source code 11
Quantitative analysis of individual AF546-Fab' clusters or signaling molecule puncta.
This MATLAB script quantifies Fab' peak intensity, Fab' MFI, and signaling molecule MFI in each cluster or puncta detected in TIRF images.
- https://cdn.elifesciences.org/articles/87833/elife-87833-code11-v2.zip
-
Source code 12
Quantitative analysis of AF546-Fab’ cluster from time-lapse TIRF images.
This MATLAB script is composed of several sections with some sub-functions (Source code 13 and 14). It inputs time-lapse masks delineating B-cell contact zones from time-lapse images, identifies AF546-Fab' clusters in one B-cell contact zone for every frame in the original time-lapse TIRF image, generates tracks connecting the detected clusters, analyzes the peak intensity and MFI of AF546-Fab' in each cluster, and generates a data table.
- https://cdn.elifesciences.org/articles/87833/elife-87833-code12-v2.zip
-
Source code 13
Tracking AF546-Fab' clusters in time-lapse TIRF images.
This MATLAB script tracks detected clusters by creating a frame-by-frame association between two consecutive frames of time-lapse TIRF images.
- https://cdn.elifesciences.org/articles/87833/elife-87833-code13-v2.zip
-
Source code 14
Quantitative analysis of AF546-Fab' clusters tracked within time-lapse images.
This MATLAB script analyzes detected AF546-Fab' clusters and quantifies AF546 peak intensity and MFI in that cluster.
- https://cdn.elifesciences.org/articles/87833/elife-87833-code14-v2.zip
Download links
A two-part list of links to download the article, or parts of the article, in various formats.
Downloads (link to download the article as PDF)
Open citations (links to open the citations from this article in various online reference manager services)
Cite this article (links to download the citations from this article in formats compatible with various reference manager tools)
N-WASP-dependent branched actin polymerization attenuates B-cell receptor signaling by increasing the molecular density of receptor clusters
eLife 12:RP87833.
https://doi.org/10.7554/eLife.87833.3


