The yeast RNA methylation complex consists of conserved yet reconfigured components with m6A-dependent and independent roles
- The Francis Crick Institute, United Kingdom
- Department of Molecular Genetics, Weizmann Institute of Science, Israel
- Human Technopole, Italy
- Whitehead Institute for Biomedical Research, United States
- Charité Universitätsmedizin Berlin, Department of Biochemistry, Germany
Figures
Figure 1 with 1 supplement
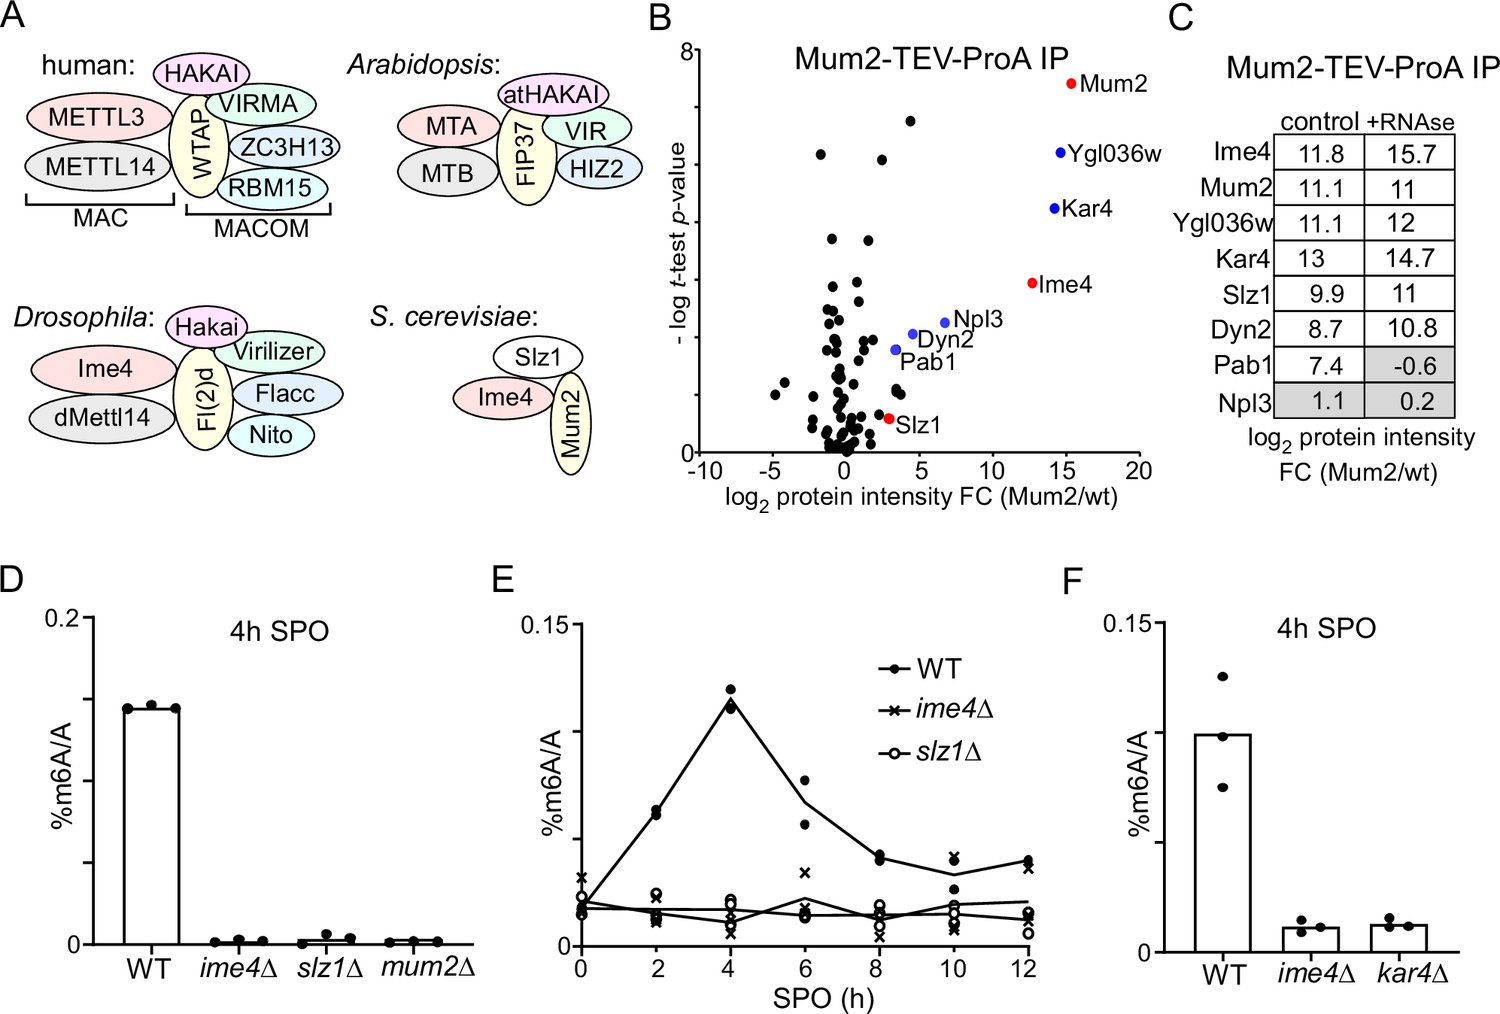
Identification of Mum2-interacting proteins.
(A). Scheme of methyltransferase complexes (MTCs) in mammals, Drosophila, Arabidopsis, and yeast. Colour indicates matching orthologues. (B) Volcano plots of Mum2-TEV-ProA compared to untagged control. Diploid cells harbouring Mum2 tagged with TEV-ProA (FW7873) or untagged control (FW1511) were induced to enter meiosis. Protein extracts were incubated with ProA-coated paramagnetic beads. TEV protease was used to elute Mum2 from the beads. Significantly enriched proteins are labelled in blue and known subunits of the MIS complex are labelled in red. (C) Similar analysis as in (B), except that during IP extracts were either untreated (left panel) or RNase treated (right panel). (D) m6A levels as determined by LC-MS in WT diploid cells, or diploid cells harbouring ime4Δ, mum2Δ, or slz1Δ (FW1511, FW7030, FW6535, and FW6504). In short cells were grown to saturation in rich medium (YPD), shifted to BYTA and grown for another 16 hr, then shifted to sporulation medium (SPO). Samples were taken at 4 hr in SPO. Total RNA was extracted and followed by two rounds of polyA RNA purification. Subsequently, RNA was digested into nucleosides and m6A was quantified my LC-MS. The means of n = 3 biological replicates are shown. (E) Same analysis as in (D), except that multiple time points after shifting cells to SPO were taken (0, 2, 4, 6, 8, 10, 12 hr in SPO). WT, slz1Δ, or ime4Δ diploid cells were used. The means of n = 2 biological repeats are shown. (F) m6A levels in WT, ime4Δ, and kar4Δcells (FW1511, FW7030, FW8246). Samples were collected at 4 hr in SPO. The means of n = 3 biological replicates are shown.
Figure 1—figure supplement 1
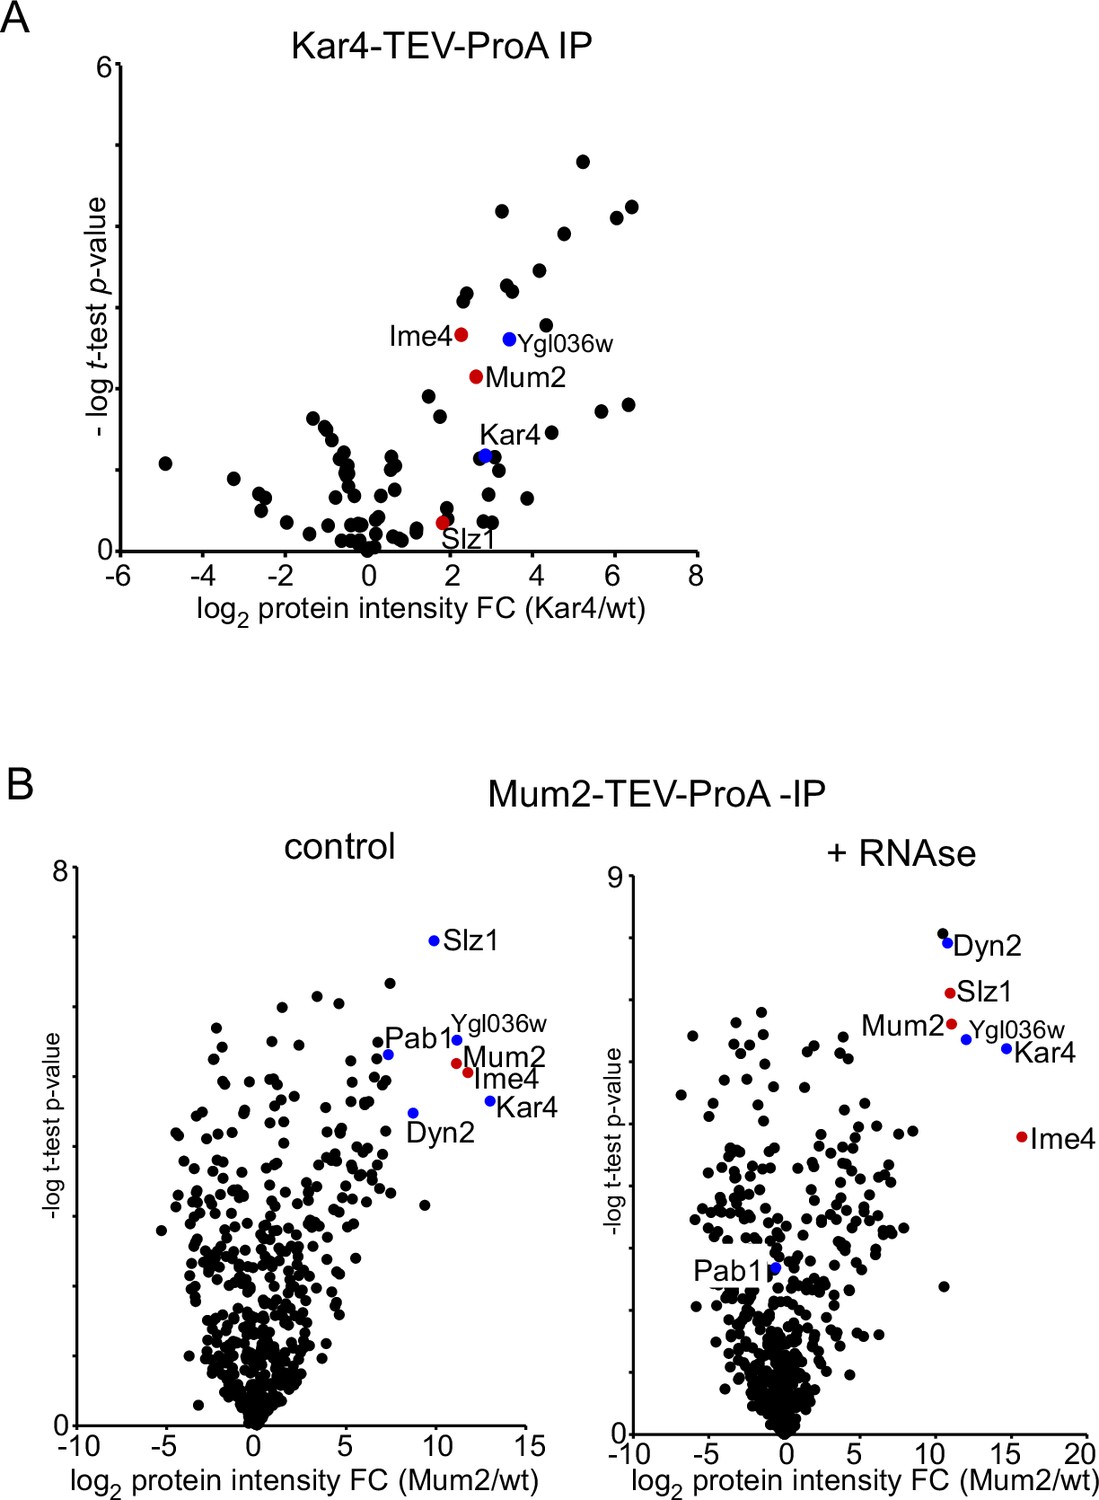
Identification of Mum2-interacting proteins.
(A) Diploid cell harbouring Kar4 tagged with TEV-ProA (FW9308) or untagged control (FW1511) were induced to enter meiosis and sample was taken at 4 hr in sporulation medium (SPO). Protein extracts were generated and incubated with ProA-coated paramagnetic beads. Subsequently, TEV protease was used to elute Mum2 from the beads. Shown are volcano plots of Kar4-TEV-ProA compared to untagged control. Kar4 and Ygl036w, which were enriched in Mum2 IP-MS of Figure 2B, are labelled in blue. Subunits of the MIS complex are labelled in red. (B) Similar analysis as in (A), except that during Mum2-TEV-ProA and untagged control IP extracts were either untreated or RNase treated. Shown are volcano plots of Mum2-TEV-ProA compared to untagged control were either untreated (left panel) or RNase treated (right panel). Kar4, Ygl036w, Dyn2, and Pab1, which were enriched in Mum2 IP-MS of Figure 2B, are labelled in blue. Subunits of the MIS complex are labelled in red.
Figure 2 with 1 supplement
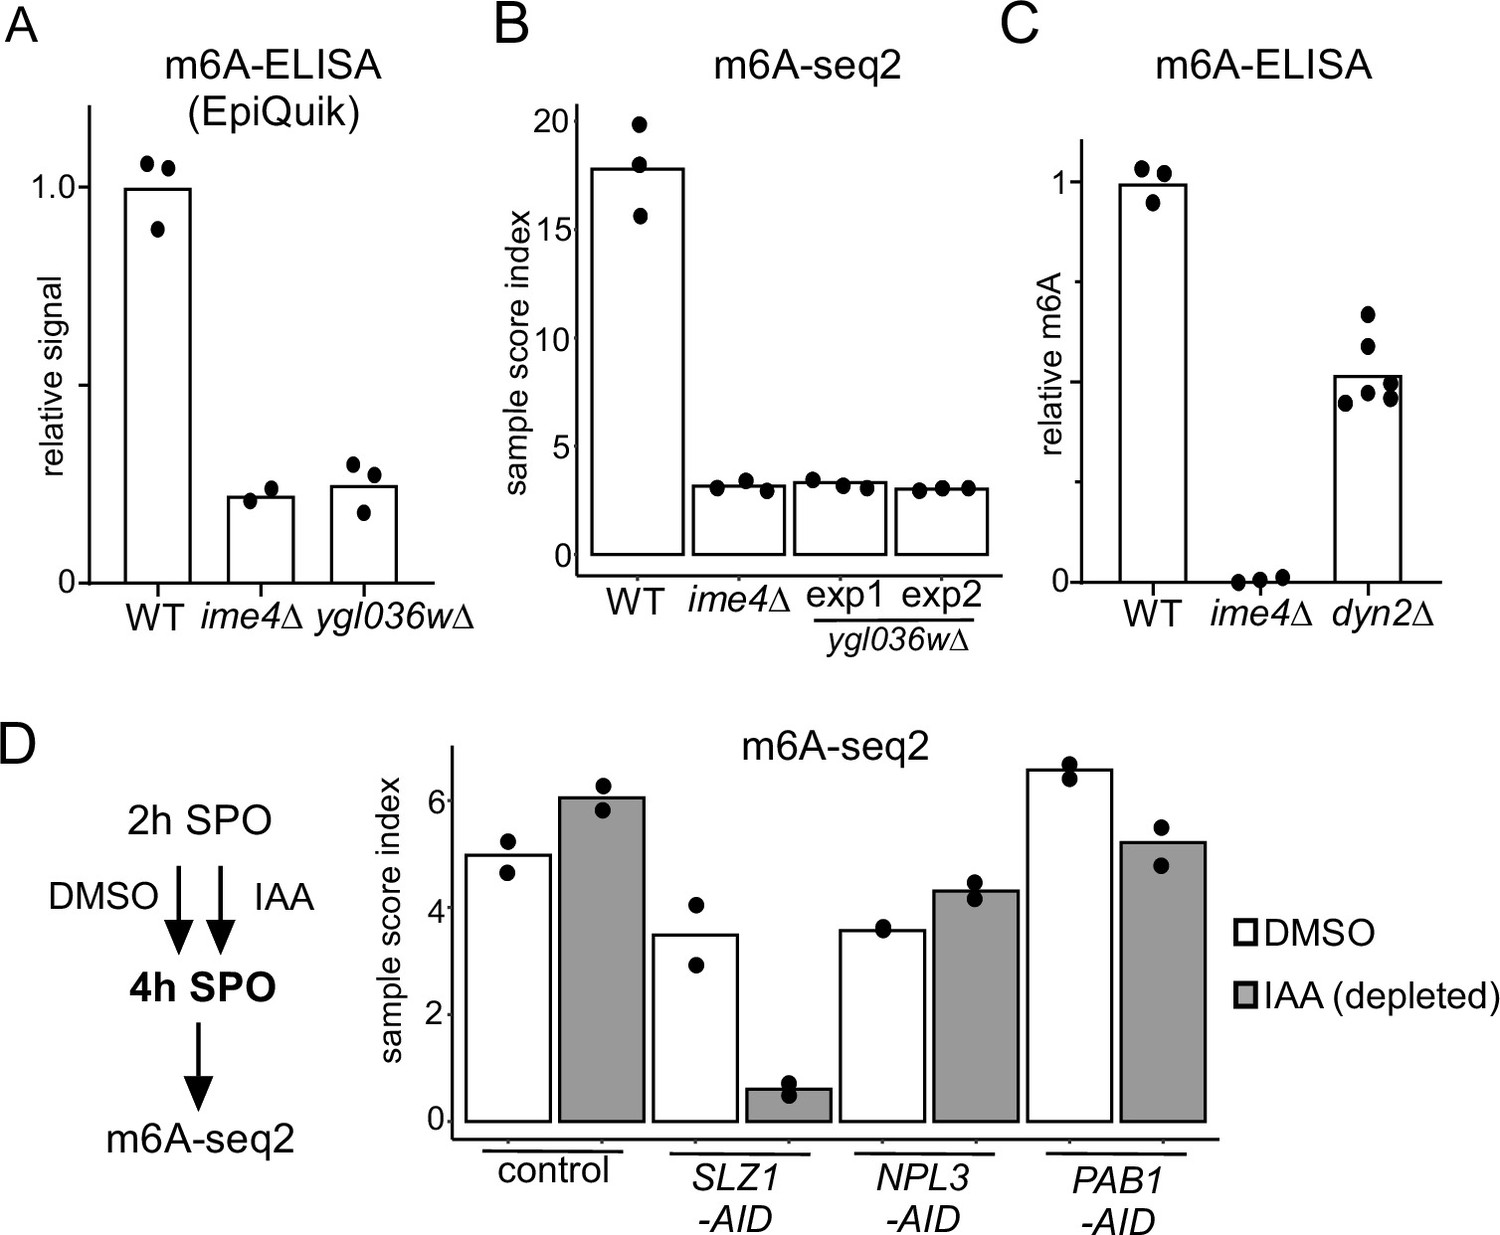
Functional characterization of Mum2 interactors.
(A) WT, ime4Δ, and ygl036wΔ cells (FW1511, FW7030, FW9307) were induced to enter meiosis. RNA was extracted, and polyA RNA was purified. m6A levels were determined by m6A-ELISA kit supplied by Epiquik. The means of n = 3 biological replicates are shown. (B) m6A-seq2 analysis of strains and condition described in (A). Two independent clones of ygl036wΔ were used for the analysis. Shown are the sample index score representing 1308 known of m6A sites. The means of n = 3 biological repeats are shown. (C) m6A levels of WT, ime4Δ, and dyn2Δ cells (FW1511, FW7030, FW10442). RNA was extracted, and polyA RNA was purified. m6A levels were determined by a non-commercial m6A-ELISA assay (Ensinck et al., 2023). The means of n = 3 biological replicates are shown for WT and ime4Δ, and n = 6 for dyn2Δ. (D) m6A-seq2 analysis after Npl3, Pab1, and Slz1 depletion. Diploid cells containing PAB1-AID, NPL3-AID, SLZ1-AID (FW10388, FW10389, FW10386) were treated at 2 hr in SPO for 2 hr with DMSO or IAA and CuSO4 for rapid depletion. A control strain was included that only harboured the TIR1 ligase expressed from the CUP1 promoter (FW5737). Shown are the m6A-sample indices, quantifying the overall levels of enrichment over 1308 previously defined m6A sites. The means of n = 2 biological repeats are shown.
Figure 2—figure supplement 1

Functional characterization of Mum2 interactors.
Depletion of the NPL3-AID, PAB1-AID, SLZ1-AID, alleles (FW10388, FW10389, FW10386). Cells were induced to enter meiosis. After 4 hr in sporulation medium (SPO), cells were treated with IAA and CuSO4 or mock treated. Samples were taken at the indicated time points. Western blot membranes were probed with anti-V5 antibodies and anti-Hxk1 antibodies as a loading control. A representative experiment is shown.
-
Figure 2—figure supplement 1—source data 1
Western blot of auxin-induced degron (AID) depletion.
- https://cdn.elifesciences.org/articles/87860/elife-87860-fig2-figsupp1-data1-v1.zip
-
Figure 2—figure supplement 1—source data 2
Western blot of loading control Hxk1.
- https://cdn.elifesciences.org/articles/87860/elife-87860-fig2-figsupp1-data2-v1.zip
-
Figure 2—figure supplement 1—source data 3
LI-COR scan auxin-induced degron (AID) and Hxk1.
- https://cdn.elifesciences.org/articles/87860/elife-87860-fig2-figsupp1-data3-v1.zip
Figure 3 with 1 supplement
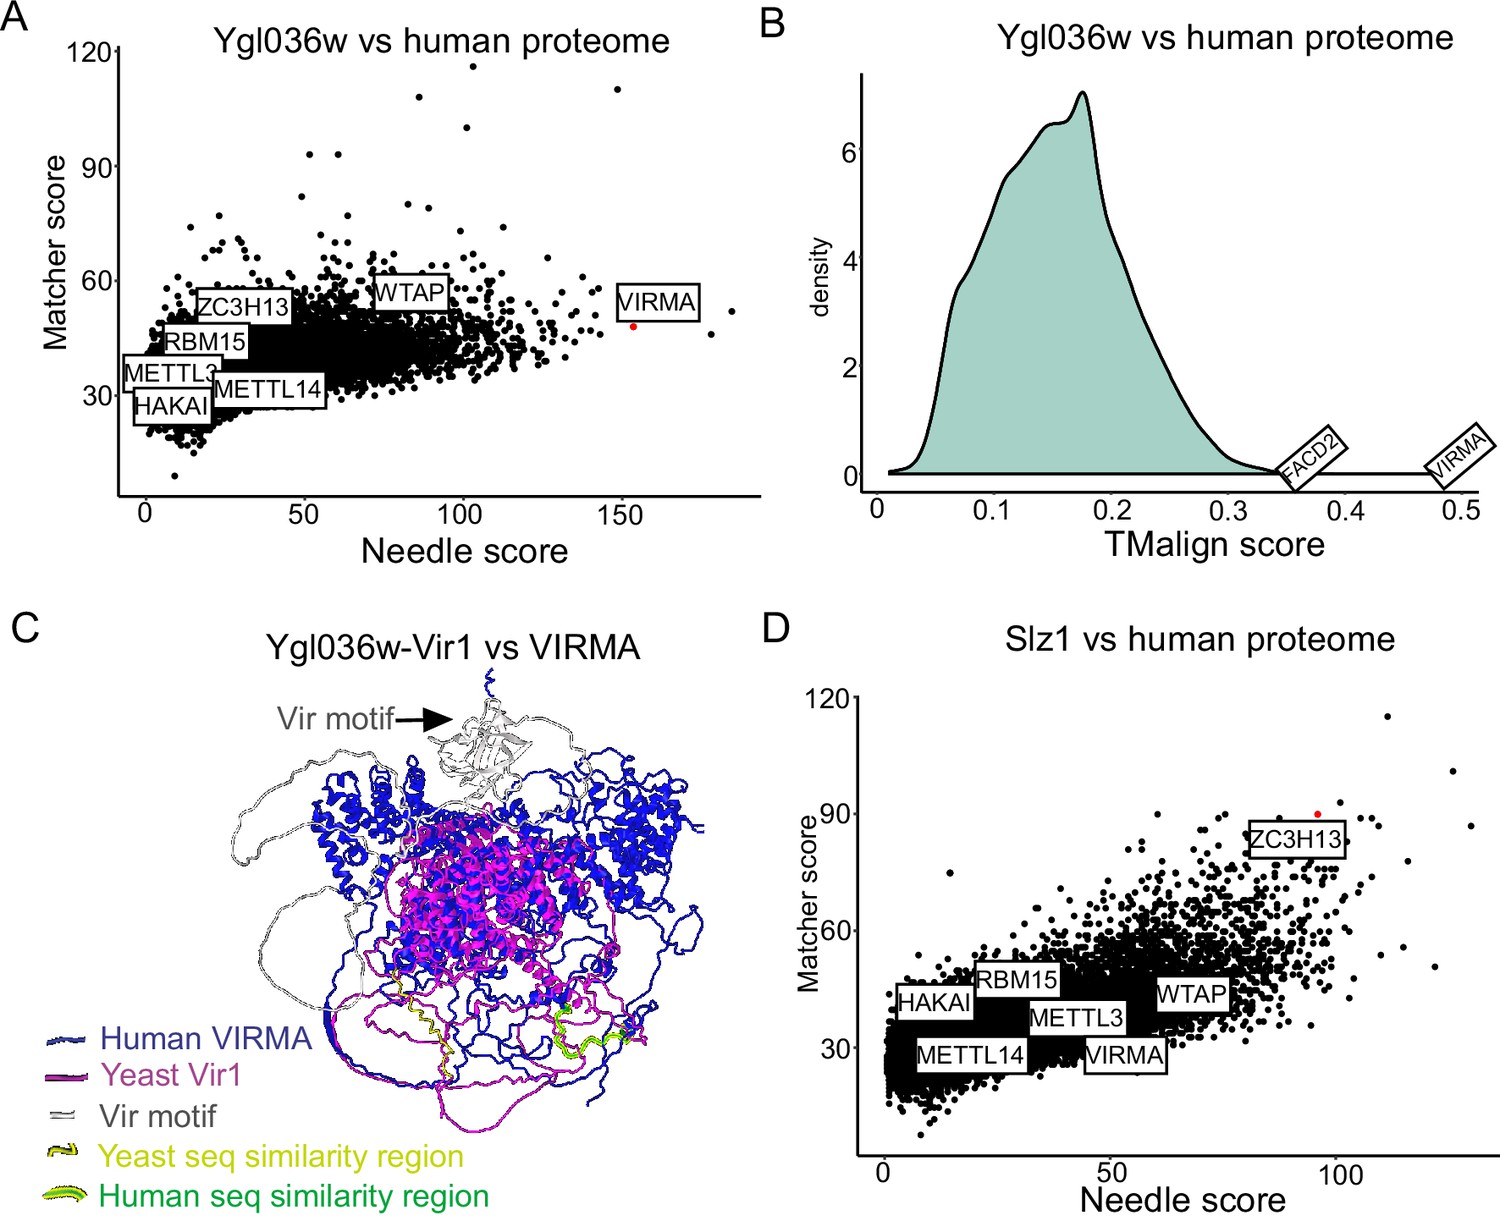
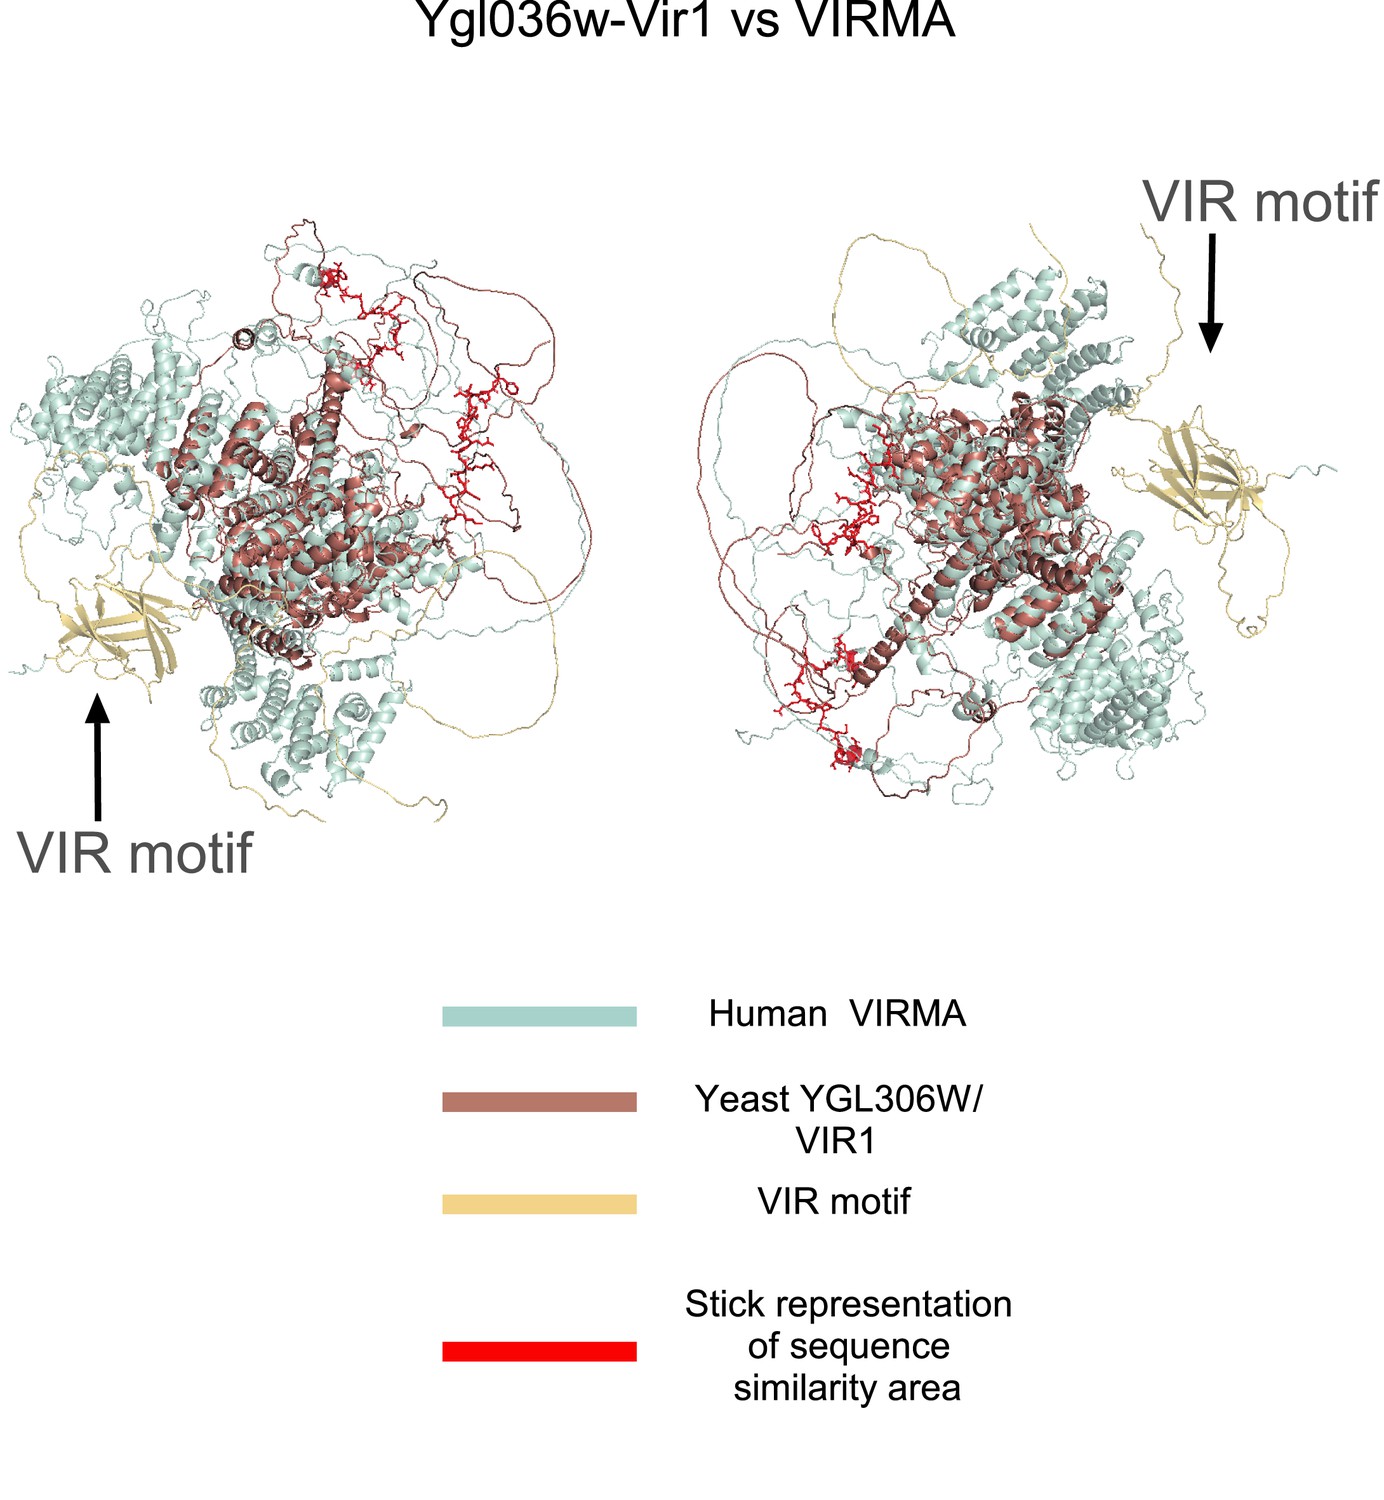
Ylg036w-Vir1 and Slz1 have orthologues in humans.
(A) Pairwise sequence comparison of Ygl036w against all human protein coding genes. Global similarity scores (using Needle) are displayed on the x-axis, whereas local similarity scores (using Matcher) are displayed on the y-axis. (B) Pairwise structural similarity of Ygl036w against all human protein coding genes, using TMalign algorithm. A histogram of the TMalign density scores is displayed, along with an indication of the score against VIRMA, the top hit in this analysis, and the second highest hit, FACD2. TM-scores were calculated and normalized using the query gene length, Ygl036w. (C) Overlay of Alpha-fold predicted structures of Ygl036c-Vir1 and human VIRMA. Human VIRMA is shown in blue and Yeast Ygl036c-Vir1 is shown in pink. Also indicated are the Vir motif and regions with strong sequence similarities. (D) Analysis as in (A) using Slz1 as a query.
Figure 3—figure supplement 1
Ylg036w-Vir1 and Slz1 have orthologues in humans.
Overlay of Alpha-fold predicted structures of Ygl036c-Vir1 and human VIRMA. Human VIRMA is shown in blue and yeast Ygl036c-Vir1 is shown in pink. Also indicated are the Vir motif and regions with strong sequence similarities. Same figure as Figure 3C but enlarged.
Figure 4 with 1 supplement
Topological and structural properties of the yeast methyltransferase complexes (MTC).
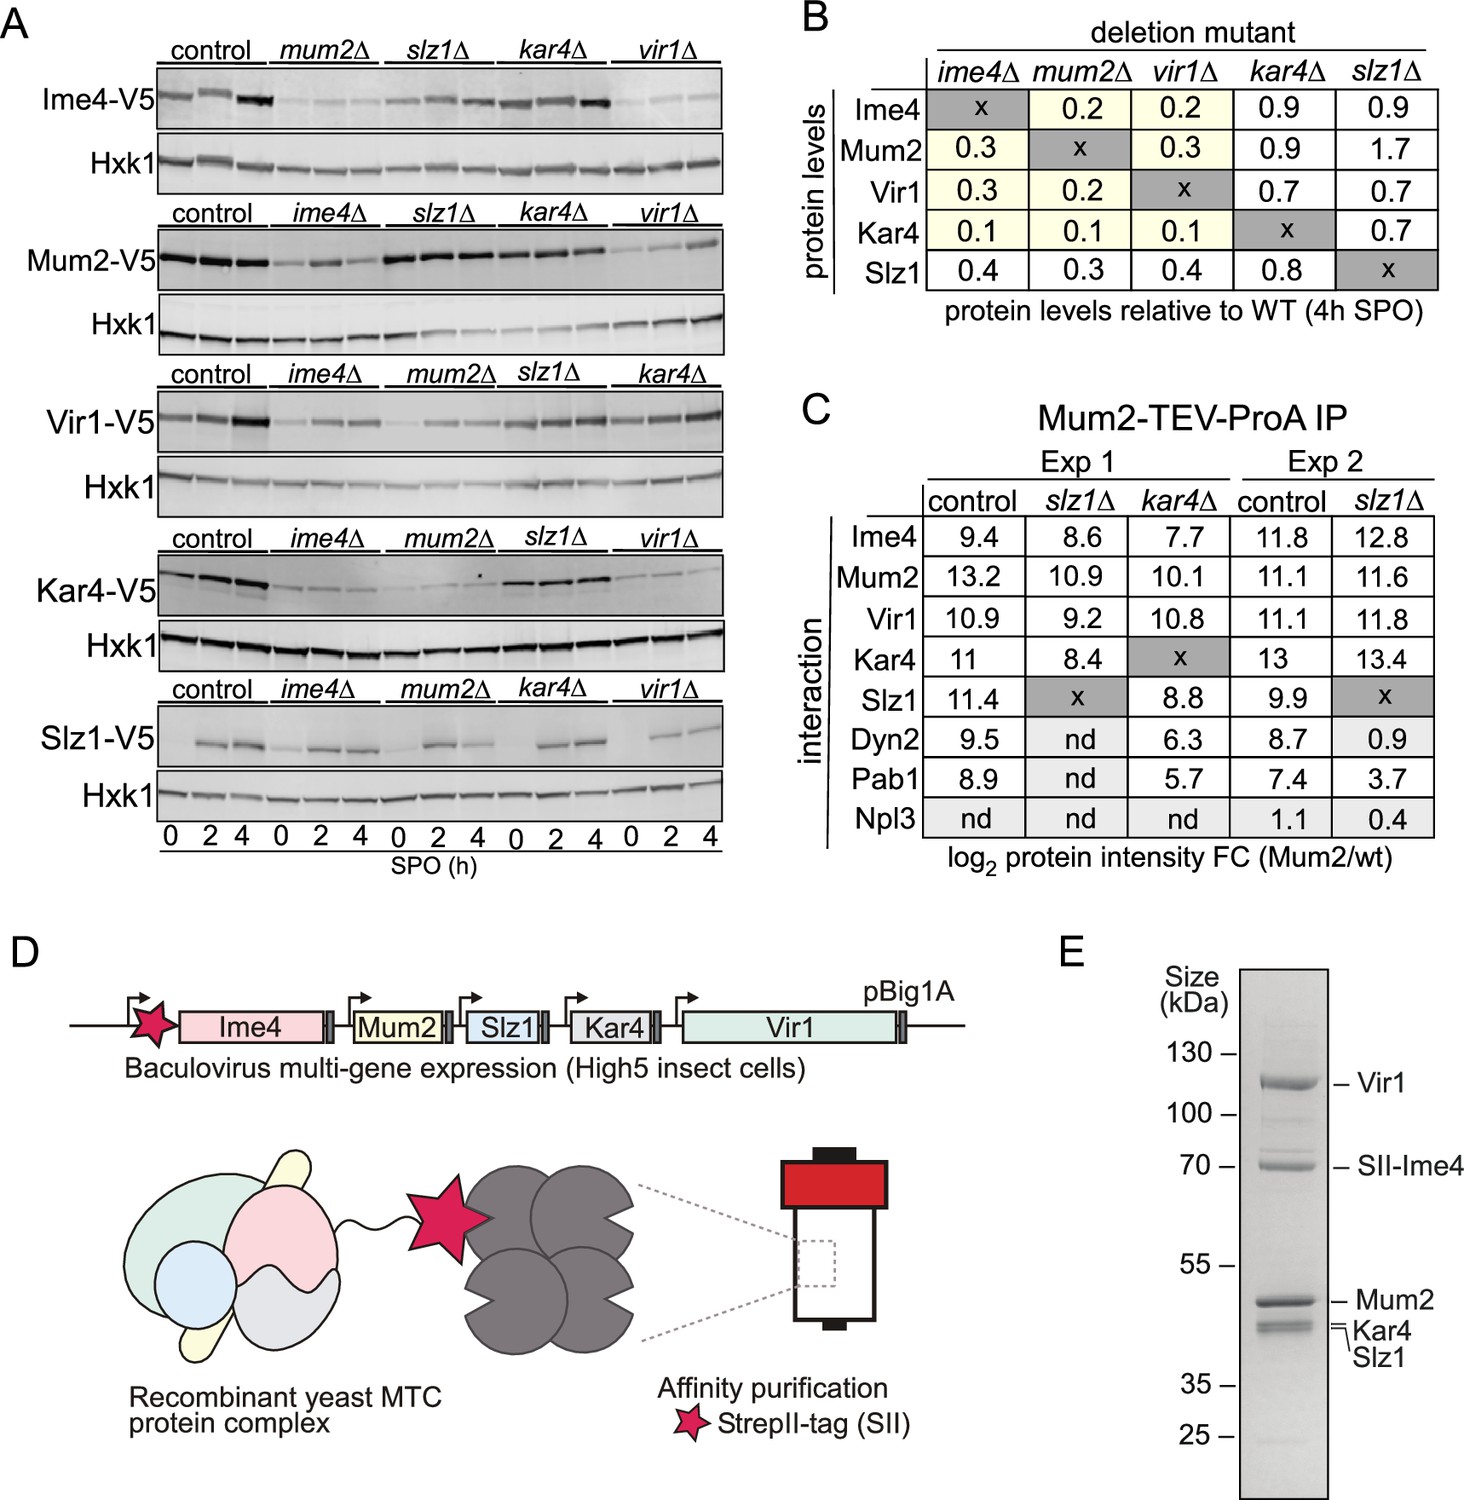
(A) Ime1, Mum2, Vir1, Kar4, and Slz1 expression depends on the presence of MTC components. WT, mum2D, ime4Δ, slz1Δ, kar4Δ, or vir1Δ were examined for Ime4-V5 (first panel, FW6057, FW8362, FW8264, FW8633, and FW9483), Mum2-V5 (second panel, FW6500, FW9394, FW6534, FW9396, and FW9398), Vir1-V5 (third panel, FW9666, FW9663, FW9668, FW9670, and FW9643), Kar4-V5 (fourth panel, FW8216, FW9484, FW8212, FW9482, and FW9481), or Slz1-V5 (fifth panel, FW6502, FW9479, FW9477, FW9480, and FW9478) during early meiosis. Samples were taken at the indicated time points. Western blots were probed with anti-V5 antibodies and anti-Hxk1 as a loading control. (B) Table of western blot quantifications of the 4 hr time point described in (C). Each row represents the protein expression (Ime4-V5, Mum2-V5, Vir1-V5, Kar4-V5, and Slz1-V5) and each column the deletion mutant (mum2D, ime4Δ, slz1Δ, kar4Δ, or vir1Δ). Highlighted in yellow are the MTC components affected in protein levels (<0.5), but not at the mRNA levels. (C) Diploid cells untagged or harbouring Mum2 tagged with TEV-ProA in WT, slz1Δ, or kar4Δ background (FW1511, FW7873, FW10158, and FW10159) were induced to enter meiosis. Protein extracts were incubated with ProA-coated paramagnetic beads. TEV protease was used to elute Mum2 from the beads. Shown are the enrichments for Ime4, Mum2, Vir1, Kar4, Slz1, Pab1, and Npl3. Two independent experiments are shown for slz1Δ. nd = not detected. (D) Purification of the five-subunit recombinant m6A writer complex. Schematic representation showing the baculovirus recombinant co-expression and purification of the yeast MTC with five subunits (Ime4, Mum2, Vir1, Kar4, and Slz1) in insect cells. Genes are depicted by rectangles, promoters by arrows, and terminators by grey boxes. The star in magenta represents the Strep-tag in the N-terminal domain of Ime4. (E) SDS-PAGE analysis of the purified recombinant m6A writer complex after affinity. Identities of bands confirmed by MS are labelled.
-
Figure 4—source data 1
LI-COR scan Ime4-V5 and Hxk1.
- https://cdn.elifesciences.org/articles/87860/elife-87860-fig4-data1-v1.zip
-
Figure 4—source data 2
LI-COR scan Mum2-V5 and Hxk1.
- https://cdn.elifesciences.org/articles/87860/elife-87860-fig4-data2-v1.zip
-
Figure 4—source data 3
LI-COR scan Vir1-V5 and Hxk1.
- https://cdn.elifesciences.org/articles/87860/elife-87860-fig4-data3-v1.zip
-
Figure 4—source data 4
LI-COR scan Kar4-V5 and Hxk1.
- https://cdn.elifesciences.org/articles/87860/elife-87860-fig4-data4-v1.zip
-
Figure 4—source data 5
LI-COR scan Slz1-V5 and Hxk1.
- https://cdn.elifesciences.org/articles/87860/elife-87860-fig4-data5-v1.zip
-
Figure 4—source data 6
Uncropped gel.
- https://cdn.elifesciences.org/articles/87860/elife-87860-fig4-data6-v1.zip
Figure 4—figure supplement 1
Topological and structural properties of the yeast methyltransferase complexes (MTC).
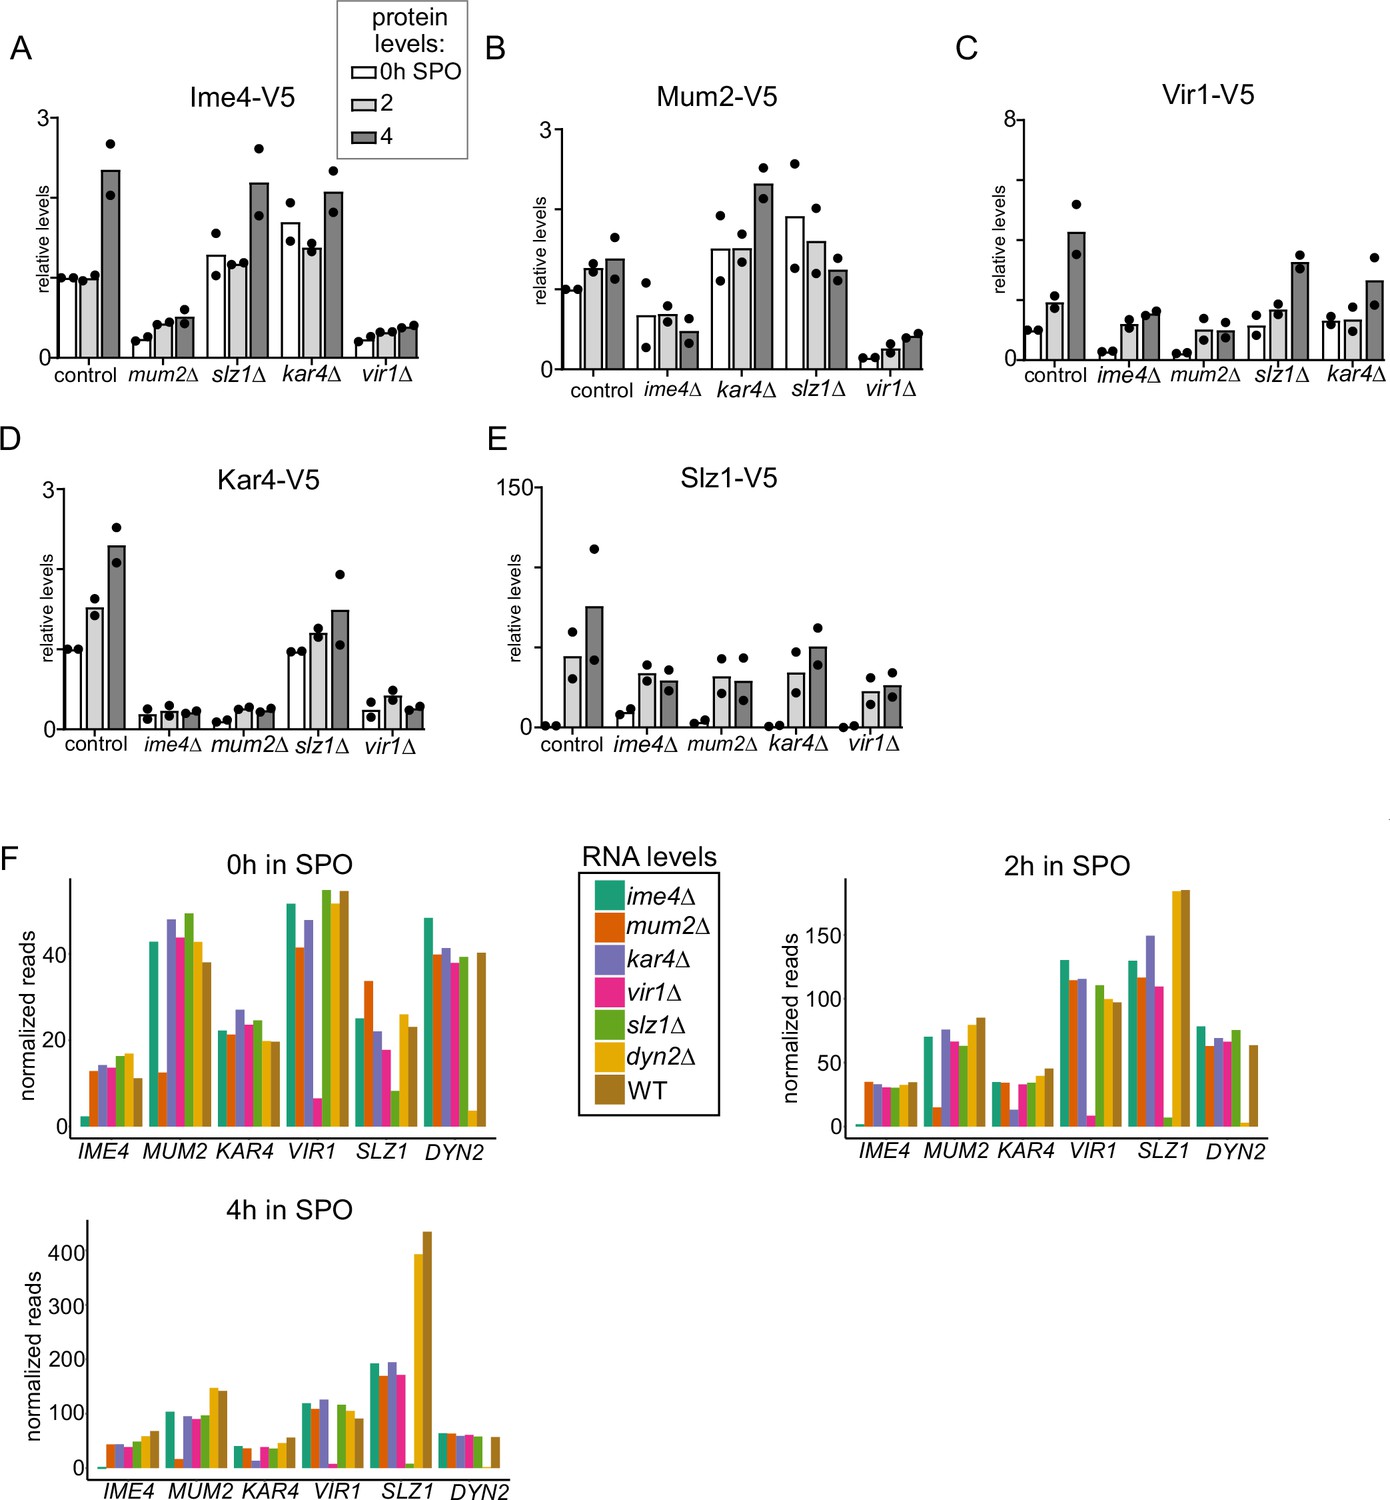
(A–E). Ime4, Mum2, Vir1, Kar4, and Slz1 protein expression depends on the presence of MTC subunits. Same data as described in Figure 4A. Western blots were probed with anti-V5 antibodies and anti-Hxk1 antibodies as a loading control. Western blot signals were quantified and the signal for the control at 0 hr was set to 1. The mean signal for n = 2 biological repeats is shown. (F) mRNA expression (normalized read counts) of IME4, MUM2, VIR1, SLZ1, and DYN2 mRNA in control, ime4Δ, mum2Δ, slz1Δ, kar4Δ, vir1Δ, and dyn2Δ (FW1511, FW7030, FW6535, FW6504, FW8246, FW9307, and FW10442) as determined by RNA-seq (see Figure 5 for details) at 0 hr, 2 hr, and 4 hr in sporulation medium (SPO).
Figure 5 with 1 supplement
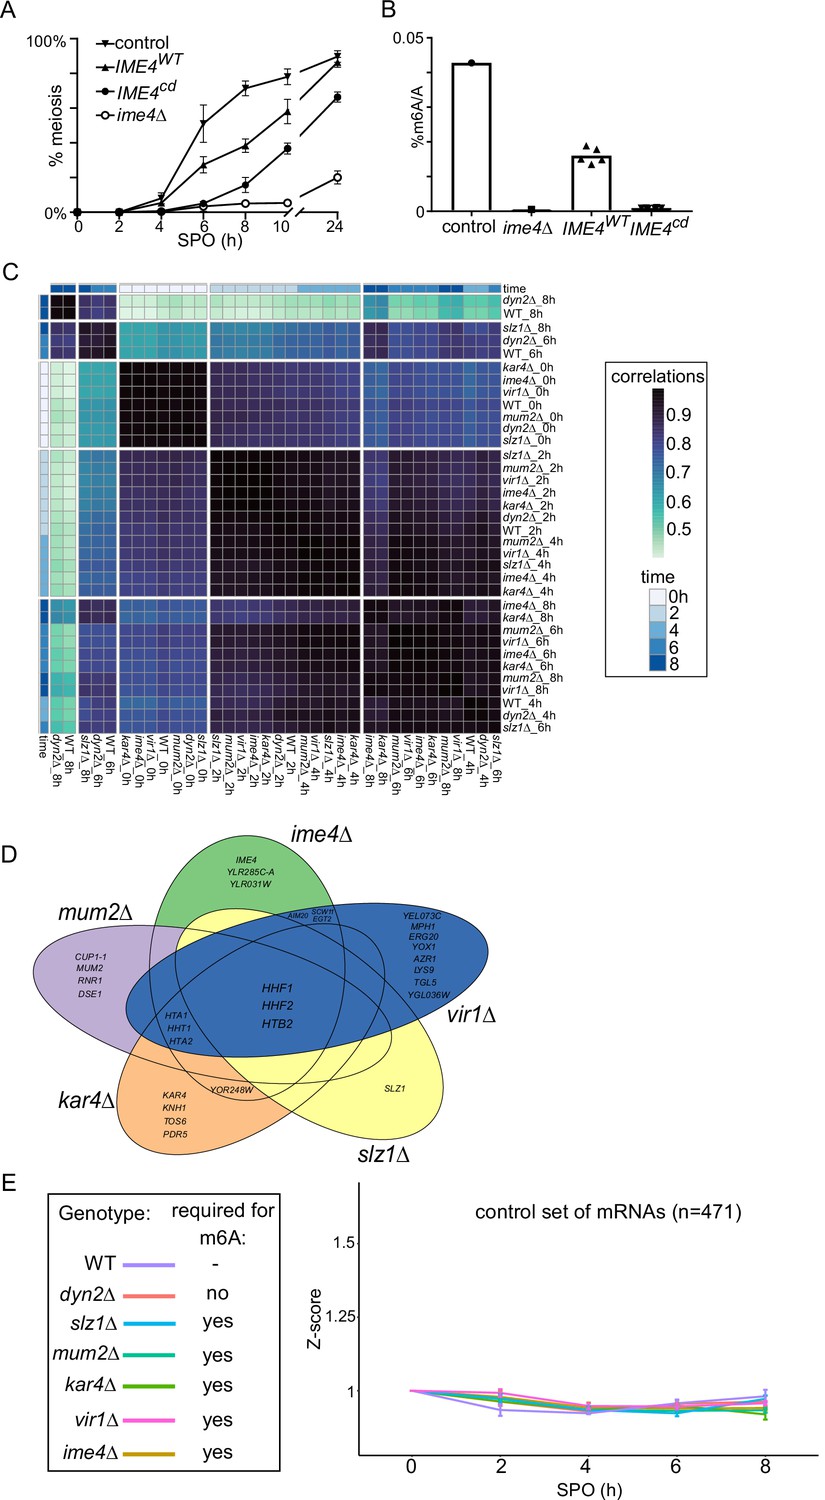
N6-methyladenosine (m6A)-dependent and -independent roles of the methyltransferase complexes (MTC) in meiosis.
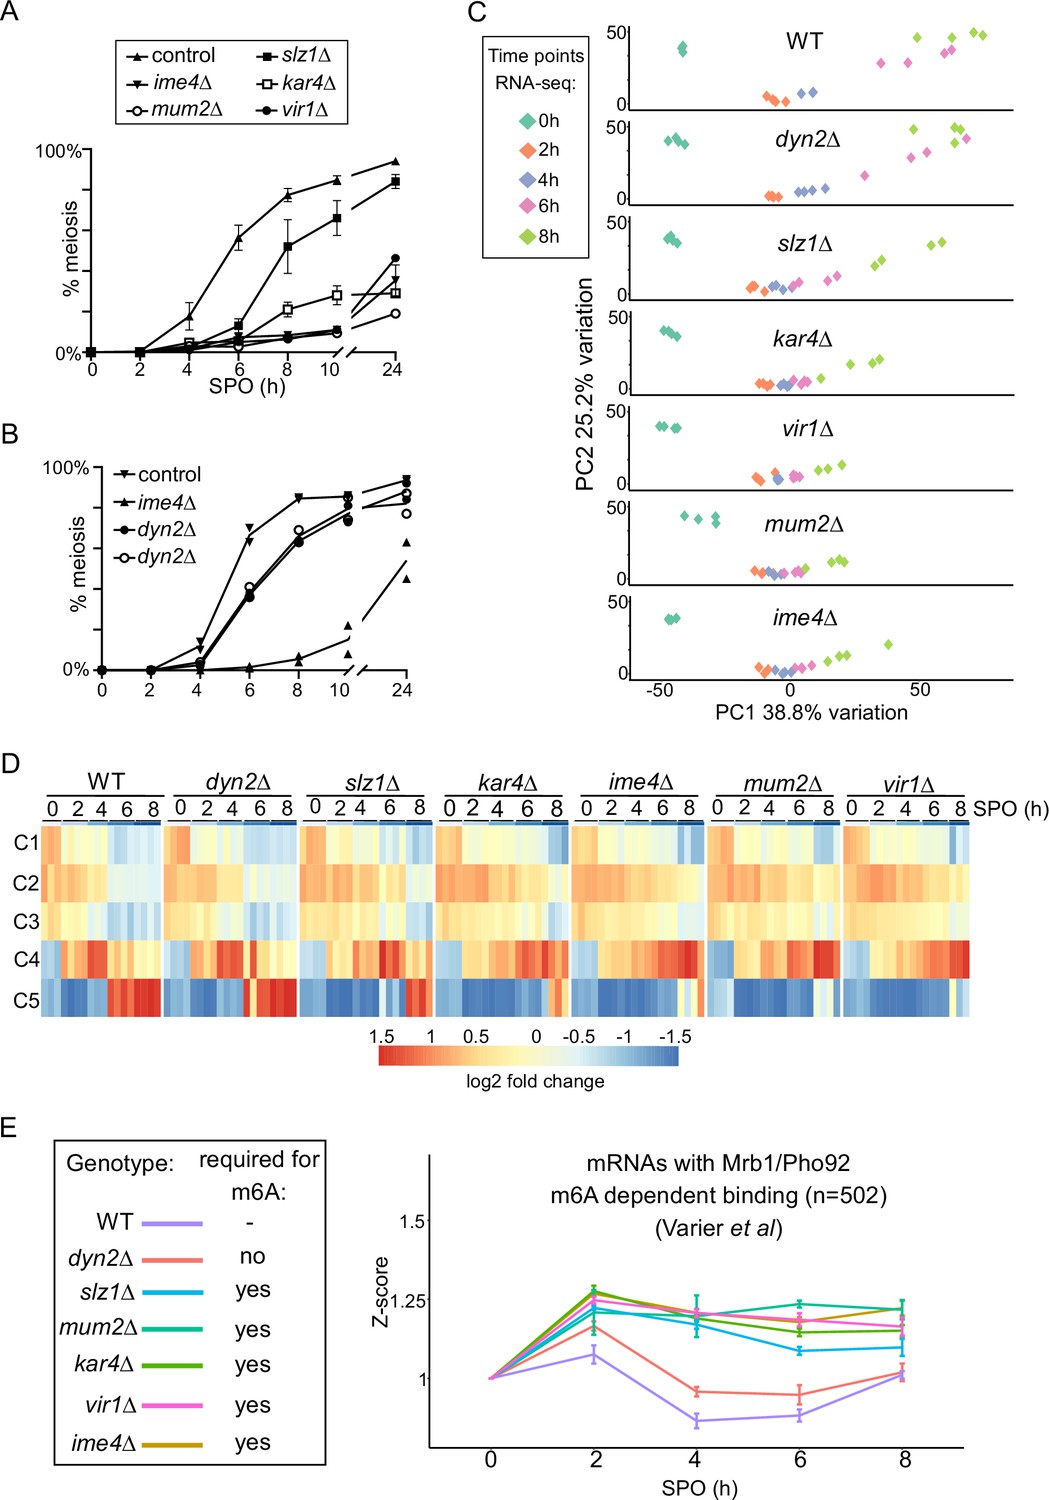
(A) Onset of meiosis in WT, ime4Δ, mum2Δ, slz1Δ, kar4Δ, and vir1Δ (FW1511, FW7030, FW6535, FW6504, FW8246, and FW9307). Cells induced to enter meiosis. Samples were taken at the indicated time points for DAPI staining. Cells were fixed, stained with DAPI, and nuclei were counted for at least 200 cells per biological repeat. Cells with two or more DAPI masses were considered to undergo meiosis. The mean and SEM of n = 3 biological repeats are displayed. (B) Similar analysis as (A), except that the WT, ime4Δ, and dyn2Δ were analysed (FW1511, FW7030, FW10442, and FW10443). For the analysis, two independent dyn2Δ strains were used. The means of n = 2 biological repeats are displayed. (C) Principal component analysis (PCA) of gene expression measurements across diverse strains and time points, done using PCAtools 2.6.0 for R. Strains described in (A) and (B) were induced to enter synchronized meiosis and samples were taken at the indicated time points (0, 2, 4, 6, and 8 hr in sporulation medium [SPO]). For analysis, n = 4 biological repeats were used, except for ime4Δ_4h, ime4Δ_0h, and vir1Δ_8h, which had an n = 3. (D) Median expression patterns in WT and MTC mutants of five predefined gene clusters representing early metabolic genes (C1, n = 67), early meiotic genes (C2, n = 42; C3, n = 34), early to middle meiotic genes (C4, n = 53), and middle meiotic genes (C5, n = 136) (Chu et al., 1998). (E) Median gene expression fold change from time point 0 of Mrb1/Pho92-bound transcripts during the time course across the different deletion mutants. Dataset of Mrb1/Pho92 iCLIP-based targets associating with RNA in an m6A-dependent manner identified in Varier et al., 2022 was used for the analysis. For each transcript, a Z-score was calculated with respected to the 0 hr time point. The means of at least n = 3 biological replicates are shown, and error bars represent the standard error of the mean.
Figure 5—figure supplement 1
N6-methyladenosine (m6A)-dependent and -independent functions of the methyltransferase complexes (MTC) in meiosis.
(A) Cells induced to enter meiosis. Samples were taken at the indicated time points for DAPI staining. Cells were fixed, stained, and DAPI masses were counted for at least 100 cells per biological repeat. Cells with two or more DAPI masses were considered meiosis. Similar analysis as (A), except that catalytic dead mutant of Ime4 was analysed (IME4CD). For the analysis, we used an ime4 deletion mutant strain that had either plasmid integrated harbouring IME4WT or IME4CD (FW1511, FW7030, FW8736, and FW8773). The mean and SEM of n = 3 biological repeats are displayed. (B) m6A levels in WT, ime4Δ, IME4WT, or IME4CD (FW1511, FW7030, FW8736, and FW8773). Samples were collected at 4 hr in sporulation medium (SPO) of m6A-MS analysis. The means of n = 3 biological replicates are shown. (C) Clustering analysis of the RNA-seq experiment described in Figure 5C. (D) Venn diagram showing the transcripts that significantly changed in the deletion mutants of the 2 hr time point. (E) Median gene expression fold change from time point 0 of a random group of mRNAs (n = 471) during the time course across the different deletion mutants. For each transcript, a Z-score was calculated with respected to the 0 hr time point. The mean sof at least n = 3 biological replicates are shown, and error bars represent the standard error of the mean.
Figure 6 with 1 supplement
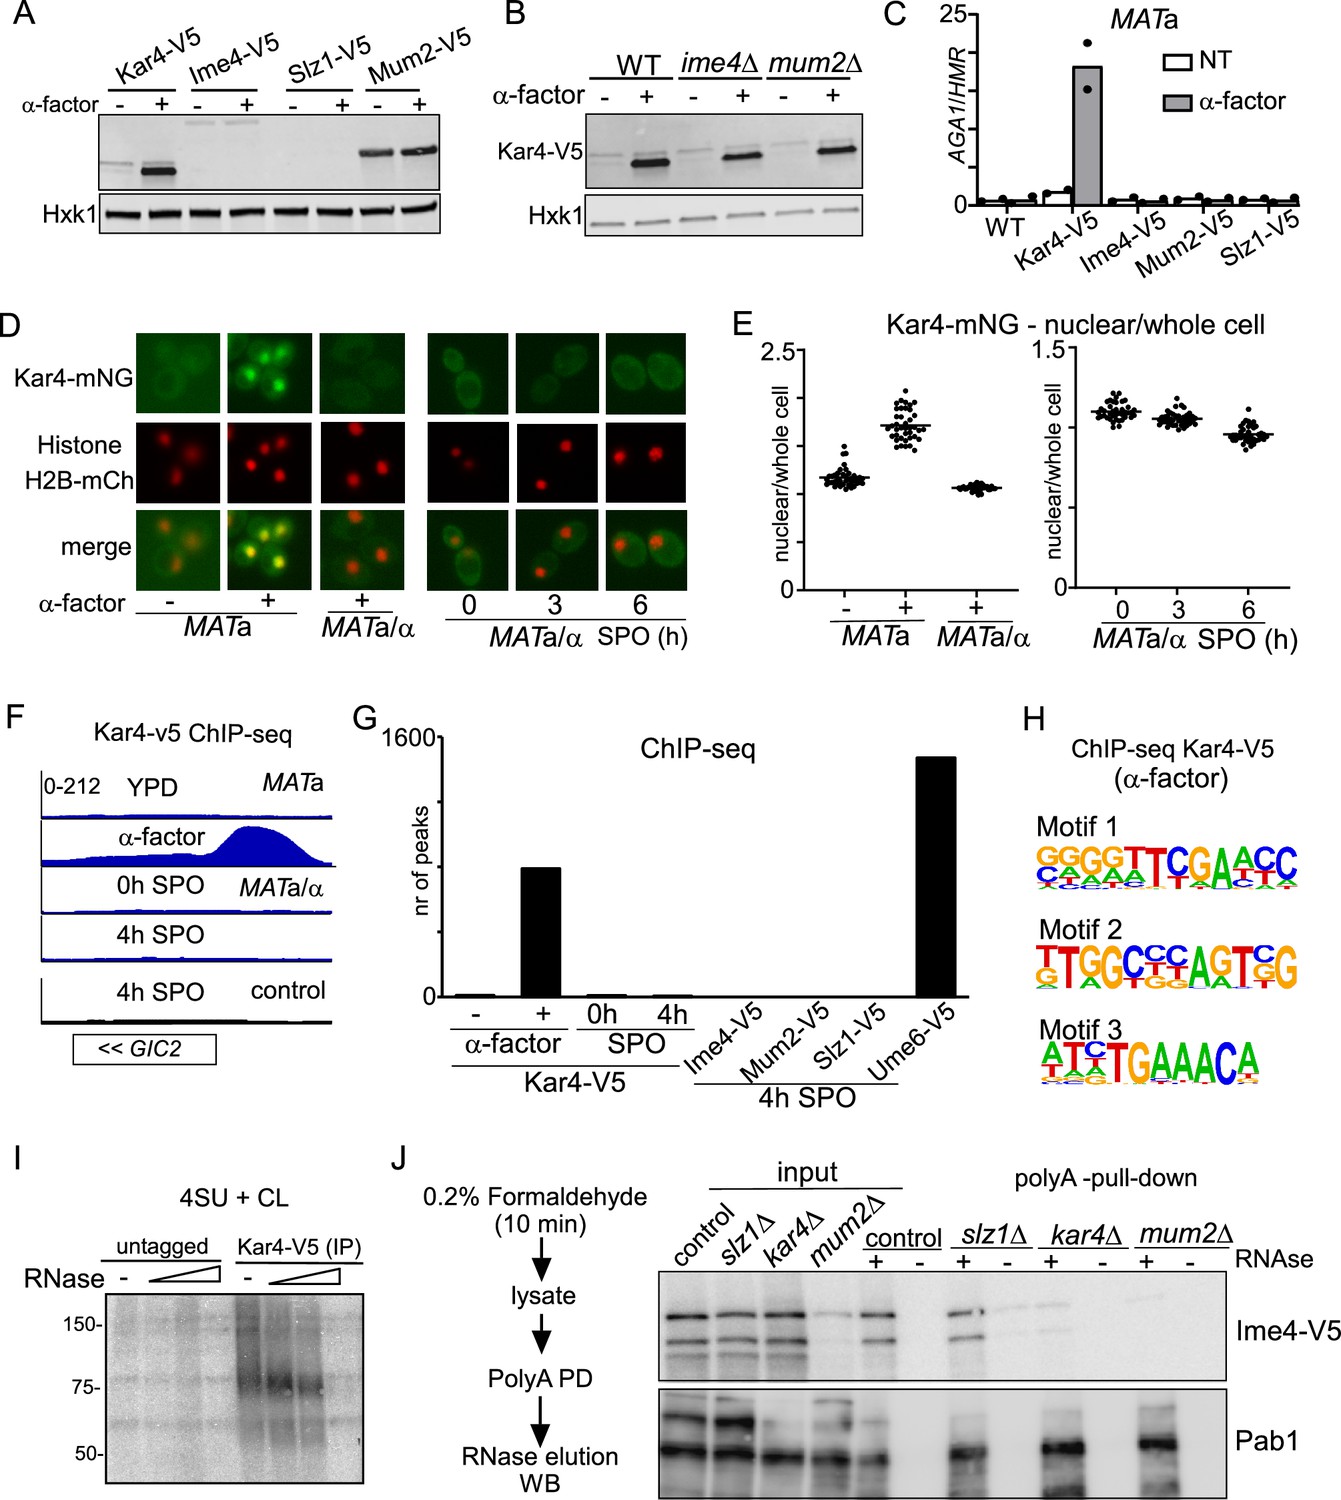
Kar4 functions during mating and meiosis differ.
(A) Expression of Kar4, Ime4, Slz1, and Mum2, either untreated or treated with mating pheromone. MATa harbouring V5 tagged alleles of Kar4, Slz1, Ime4, or Mum2 (FW8199, FW6426, FW5898, and FW6428) cells were grown in rich medium (YPD) until exponential growth, and then treated with α-factor for 30 min. Samples were collected for western blot and probed with anti-V5 antibodies. Hxk1 was used as a loading control. (B) Kar4 expression in WT, ime4Δ, or mum2Δ MATa cells (FW8199, FW9415, FW8574) untreated or treated α-factor. Samples were collected for western blot and probed with anti-V5 antibodies. Hxk1 was used as a loading control. (C) Chromatin immunoprecipitation (ChIP) of untagged control, Kar4-V5, Ime4-V5, Mum2-V5, and Slz1-V5 MATa cells (FW1509, FW8199, FW5898, FW6426, and FW6428). Cells were grown in YPD and were either not treated or treated with α factor for 2 hr. (D) Kar4 localization in cells in rich medium, either untreated or treated α-factor and in cells entering meiosis. Cells were induced to enter meiosis in sporulation medium (SPO), and samples were taken at 0, 3, and 6 hr in SPO. Kar4 fused to mNeongreen (mNG) was used for the analysis. To determine nuclear Kar4-mNG signal, we used histone H2B fused to mCherry (H2B-mCh). For the analysis, we used MATa and MATa/α cells (FW8615 and FW8646). Representative images are shown. (E) Quantification of nuclear over whole cell mean signal for Kar4-mNG of data in (C). At least n = 50 cells were quantified for the analysis. (F) Chromatin immunoprecipitation followed by deep-sequencing (ChIP-seq) of MATa Kar4-V5 (FW8199) untreated or treated with α factor, and MATa/α Kar4-V5 (FW8616) at 0 and 4 hr in SPO as well as untagged control cells (FW1509 and FW1511). Samples were crosslinked with formaldehyde, extracts were sonicated, and protein-DNA complexes were purified using anti-V5 agarose beads and reverse crosslinked. Purified DNA was subjected to deep sequencing. ChIP-seq signals for the GIC2 and FUS1 loci are shown. (G) Quantification of the number of ChIP-seq peaks. (H) Motif analysis of Kar4-binding sites identified in Kar4-V5 ChIP-seq of α factor treated cells. (I) Photo-activatable crosslinking of Kar4. Control and Kar4 (FW1511 and FW8633) cell entering meiosis were incubated with 4thiouracil (4TU). Cells were UV-crosslinked, and Kar4 was immunoprecipitated from protein extracts. The Kar4-IP was treated with different concentrations of RNase, and subsequently radioactively labelled p32. Kar4-RNA complexes were separated by SDS-PAGE. (J) Chemical RNA-protein interactome analysis for assessing Ime4 binding to RNA. For the analysis, we used Ime4-V5 cells in control, slz1Δ, kar4Δ, mum2Δ backgrounds (FW6057, FW8362, FW8264, and FW8633). In short, cells entering meiosis (4 hr SPO) were crosslinked with formaldehyde, polyA mRNAs were pulled down from protein extracts with oligo-dT coated magnetic beads, washed, samples were eluted with RNase, and assessed by western blotting. Membranes were probed for anti-V5 to detect Ime4. As a positive control, membranes were probed with anti-Pab1.
-
Figure 6—source data 1
LI-COR scan Kar4-V5 and Hxk1.
- https://cdn.elifesciences.org/articles/87860/elife-87860-fig6-data1-v1.zip
-
Figure 6—source data 2
LI-COR scan Kar4-V5 and Hxk1.
- https://cdn.elifesciences.org/articles/87860/elife-87860-fig6-data2-v1.zip
-
Figure 6—source data 3
Autoradiograph of Kar4-V5 IP.
- https://cdn.elifesciences.org/articles/87860/elife-87860-fig6-data3-v1.zip
-
Figure 6—source data 4
Western blot of Ime4-V5.
- https://cdn.elifesciences.org/articles/87860/elife-87860-fig6-data4-v1.zip
-
Figure 6—source data 5
Western blot of Pab1.
- https://cdn.elifesciences.org/articles/87860/elife-87860-fig6-data5-v1.zip
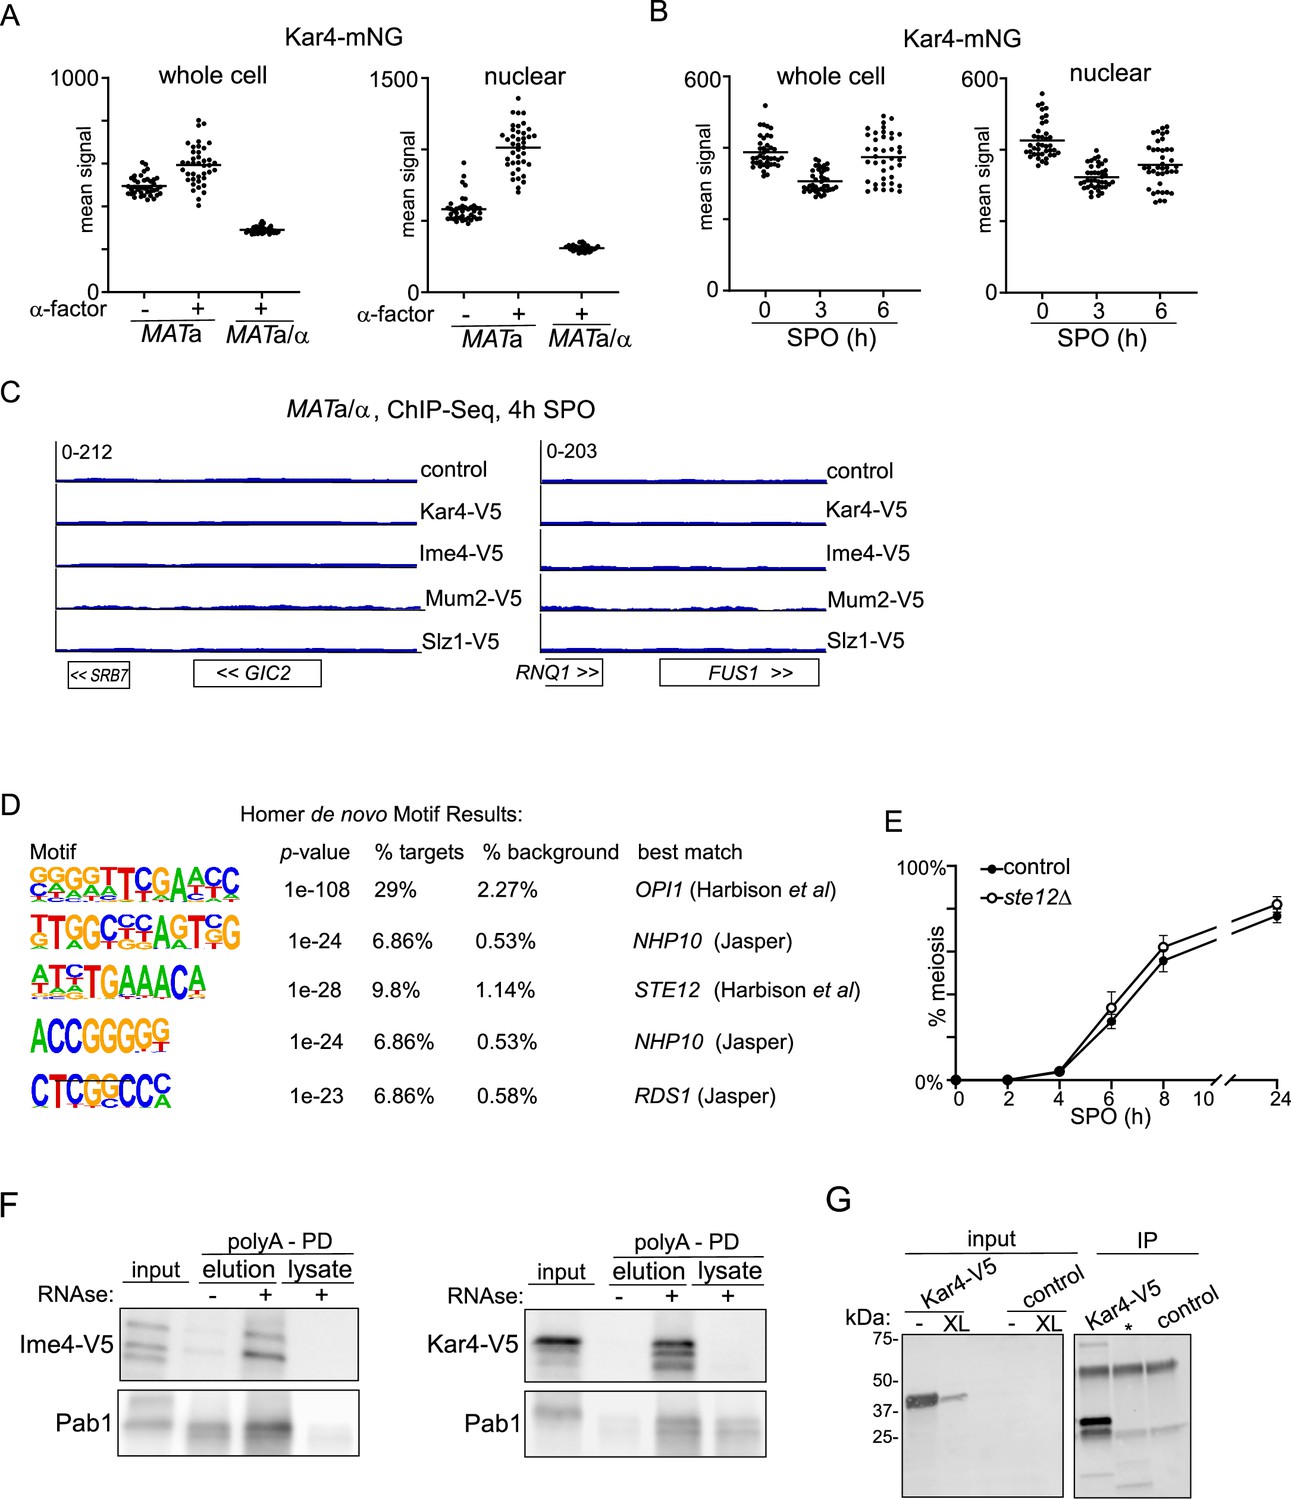
Figure 6—figure supplement 1
Kar4 functions during mating and meiosis differ.
(A) Kar4 localization in cells untreated or treated α-factor. Kar4 fused to mNeongreen (mNg) was used for the analysis. To determine nuclear Kar4-mNg signal, we used histone H2B fused to mCherry (H2B-mCh). For the analysis, we used MATa and MATa/αcells (FW8615 and FW8646). Quantification of nuclear (left panel) and whole-cell (right panel) mean signal for Kar4-mNg. At least n = 50 cells were quantified for the analysis. (B) Similar analysis as (A), except MATa/αdiploid cells entering meiosis were used for the analysis. Cells were induced to enter meiosis in sporulation medium (SPO), and samples were taken at 0, 3, and 6 hr in SPO. At least n = 50 cells were quantified for the analysis. (C) ChIP-seq of control, Kar4-V5, Ime4-V5, Mum2-V5, and Slz1-V5 MATa/α diploid cells (FW1511, FW8216, FW6057, FW6500, and FW6502). ChIP-seq data for the GIC2 and FUS1 loci are shown. (D) Motif analysis of Kar4 binding sites identified in α factor-treated Kar4-V5 ChIP-seq data. Motifs were identified using the Homer software package. (E) Onset of meiosis in WT and ste12Δ (FW1511, FW9017). Cells induced to enter meiosis. Samples were taken at the indicated time points for DAPI staining. Cells were fixed, stained, and DAPI masses were counted for at least 100 cells per biological repeat. Cells with two or more DAPI masses were considered meiosis. The mean and SEM of n = 3 biological repeats are displayed. (F) Chemical RNA-protein interactome analysis for assessing Ime4 and Kar4 binding to RNA. For the analysis, we used Ime4-V5 and Kar4-V5 cells (FW6057 and FW8633). In short, cells entering meiosis (4 hr SPO) were crosslinked with formaldehyde, polyA mRNAs were pulled down from protein extracts with oligo-dT coated magnetic beads, washed, samples were eluted with RNase, and assessed by western blotting. Membranes were probed for anti-V5 to detect Ime4. As a positive control, membranes were probed with anti-Pab1. As a negative control, sample extract treated with RNase was included. (G) Photo-activatable crosslinking of Kar4. Control and Kar4 (FW1511 and FW8633) cell entering meiosis were incubated with 4thiouracil (4TU). Cells were UV-crosslinked, and Kar4 was immunoprecipitated from protein extracts, and western blot membranes for Kar4 with anti V5 antibodies. * is an unrelated sample.
-
Figure 6—figure supplement 1—source data 1
Western blot of Kar4-V5.
- https://cdn.elifesciences.org/articles/87860/elife-87860-fig6-figsupp1-data1-v1.zip
-
Figure 6—figure supplement 1—source data 2
Western blot of Pab1.
- https://cdn.elifesciences.org/articles/87860/elife-87860-fig6-figsupp1-data2-v1.zip
-
Figure 6—figure supplement 1—source data 3
Western blot of input and IP Kar4-V5.
- https://cdn.elifesciences.org/articles/87860/elife-87860-fig6-figsupp1-data3-v1.zip
Figure 7
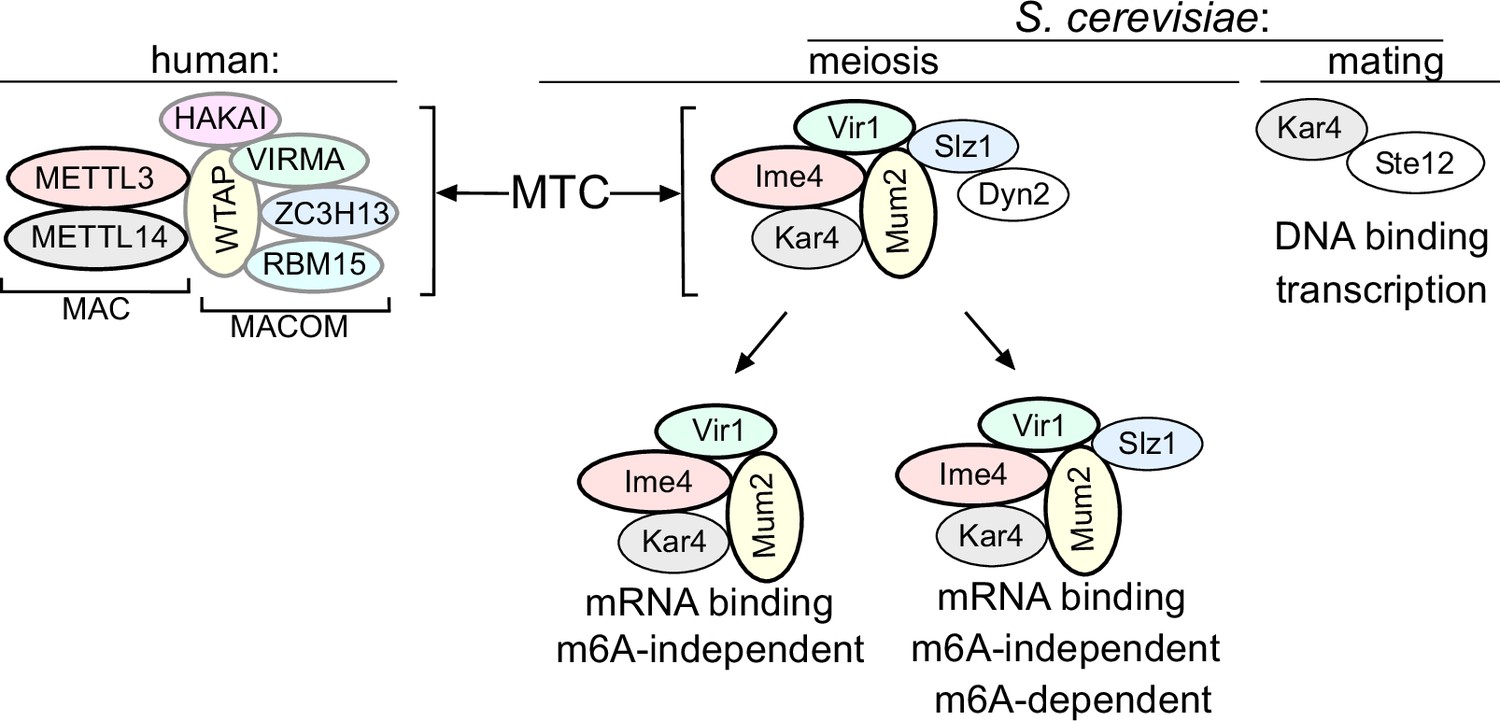
Model of the yeast methyltransferase complexes (MTC).
Comparison of the yeast and the human MTCs. The human MTC consists of MAC and MACOM subcomplexes, while the yeast MTC forms a single complex. The conserved subunits are colour indicated. Mum2, Vir1, and Ime4 mutually stabilize each other. Further indicated are the m6A-dependent and m6A-independent MTC requirements, and Kar4’s separate function in mating.
Additional files
-
Supplementary file 1
MS data.
- https://cdn.elifesciences.org/articles/87860/elife-87860-supp1-v1.xlsx
-
Supplementary file 2
RNA-seq data.
- https://cdn.elifesciences.org/articles/87860/elife-87860-supp2-v1.csv
-
Supplementary file 3
Genotypes of strains used.
- https://cdn.elifesciences.org/articles/87860/elife-87860-supp3-v1.xlsx
-
Supplementary file 4
Oligo nucleotide sequences used.
- https://cdn.elifesciences.org/articles/87860/elife-87860-supp4-v1.docx
-
Supplementary file 5
Plasmids used.
- https://cdn.elifesciences.org/articles/87860/elife-87860-supp5-v1.docx
-
Supplementary file 6
List of annotated m6A sites used for m6Aseq analysis.
- https://cdn.elifesciences.org/articles/87860/elife-87860-supp6-v1.xlsx
-
Supplementary file 7
TES coordinates used for RNA-seq.
- https://cdn.elifesciences.org/articles/87860/elife-87860-supp7-v1.csv
-
MDAR checklist
- https://cdn.elifesciences.org/articles/87860/elife-87860-mdarchecklist1-v1.pdf
Download links
A two-part list of links to download the article, or parts of the article, in various formats.
Downloads (link to download the article as PDF)
Open citations (links to open the citations from this article in various online reference manager services)
Cite this article (links to download the citations from this article in formats compatible with various reference manager tools)
The yeast RNA methylation complex consists of conserved yet reconfigured components with m6A-dependent and independent roles
eLife 12:RP87860.
https://doi.org/10.7554/eLife.87860.3


