An in vitro model for vitamin A transport across the human blood–brain barrier
- Department of Chemical and Biological Engineering, University of Wisconsin, United States
Figures
Figure 1
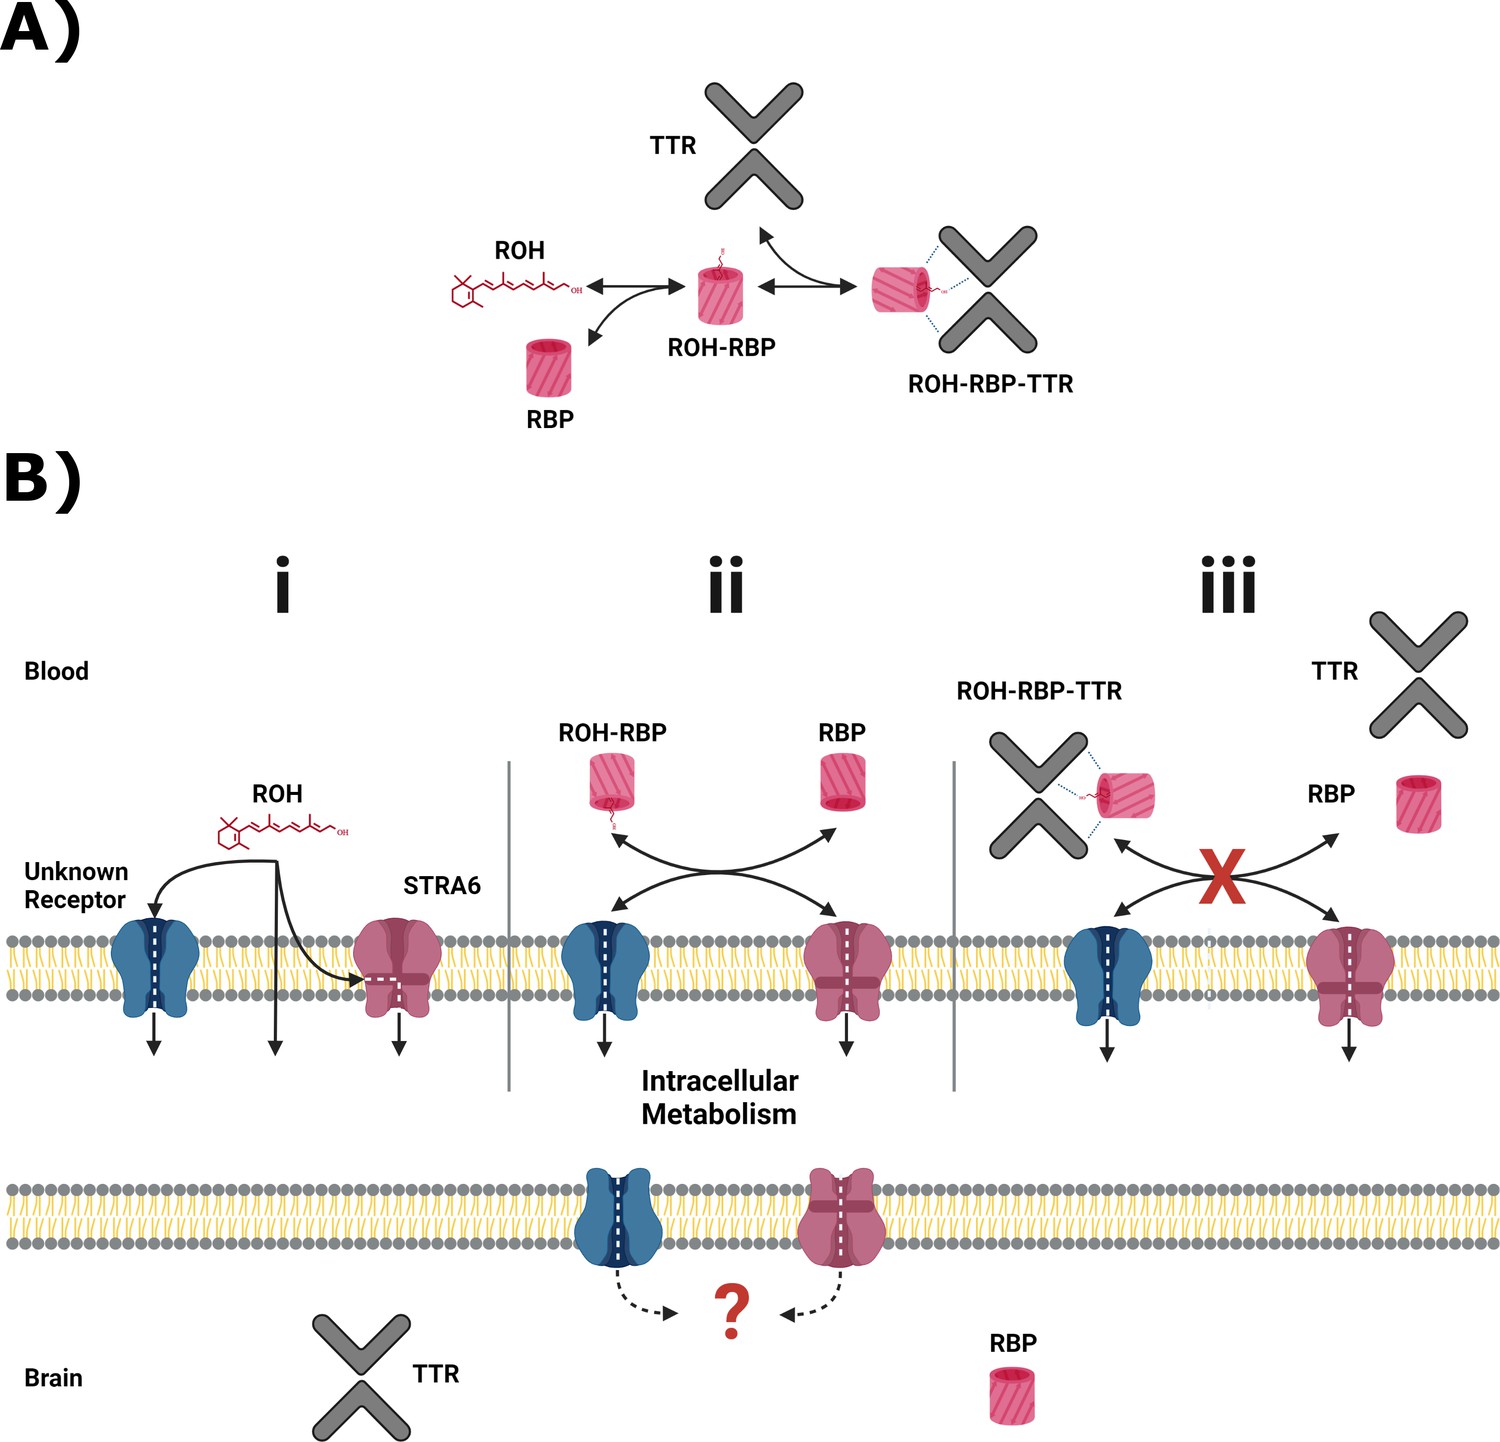
Primary serum vitamin A carriers and potential routes of delivery at the blood–brain barrier (BBB).
(A) Principal retinol distribution between free-lipid and protein-bound states in the blood. Retinol (ROH) in the blood partitions between free-lipid and protein-complexed states, with retinol-binding protein (RBP) and transthyretin (TTR) serving as the principal serum ROH transporters. (B) Putative ROH delivery mechanisms at the BBB. Critically, RBP and TTR do not cross the BBB. (i) In the blood, free ROH may cross the BBB by lipophilic diffusion through the lipid bilayer or through a specific cell-surface transporter, such as STRA6. (ii) ROH in complex with RBP (ROH-RBP) is known to deliver ROH to cell-surface transporters, including STRA6. STRA6 is thought to mediate exchange of retinoids between blood and intracellular pools. The net accumulation or release of ROH is thereby dependent on the ratio of ROH-RBP and unbound RBP present in the blood. (iii) ROH-RBP is complexed with TTR as it circulates in the blood. The ROH-RBP-TTR complex has not been shown to directly bind to cell-surface transporters, including STRA6, suggesting that dissociation of ROH-RBP from TTR is required before ROH is internalized as shown in panel (ii). Regardless of the entry method, all ROH is thought to enter the intracellular retinoid metabolism. It is unknown how intracellular retinoids are transported into the brain. RBP and TTR are expressed in the brain and presumably transport ROH throughout the brain.
Figure 2
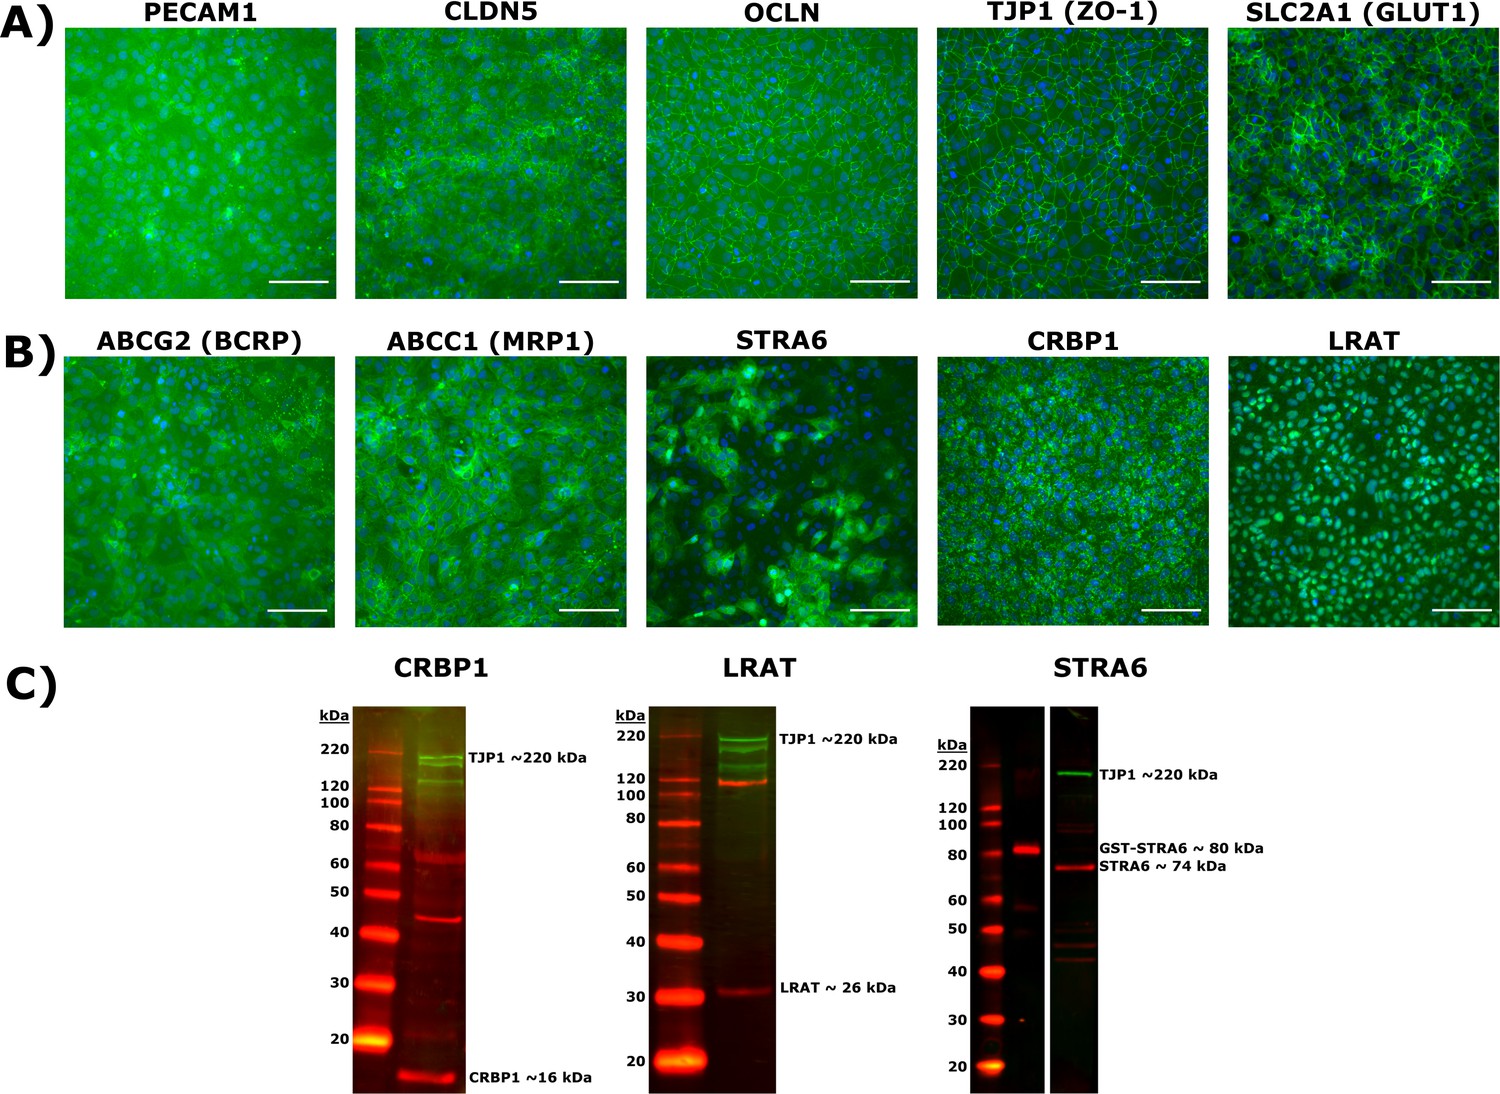
Induced pluripotent stem cells (iPSC)-derived brain microvascular endothelial-like cells (BMEC) marker and retinoid-related protein validation by immunocytochemistry and western blot.
(A) Expression of endothelial cell marker PECAM-1; tight junction and associated proteins CLDN5, OCLN, and TJP1 (ZO-1); glucose transporter SLC2A1 (GLUT1). Proteins are labeled in green and nuclear stain in blue. Scale bar equals 100 μm. (B) Expression of efflux transporters ABCG2 (BCRP), ABCC1 (MRP1), and retinoid-related proteins STRA6, CRBP1, and LRAT. Proteins are labeled in green and nuclear stain in blue. Scale bars equal 100 μm. (C) Western blots of CRBP1 (red), LRAT (red), and STRA6 (red) confirming antibody specificity. An antibody against TJP1 (green) is used as a BMEC-specific loading control in each blot. Polyclonal STRA6 antibody was additionally validated against recombinant GST-tagged STRA6.
-
Figure 2—source data 1
Raw unedited gel CRBP1.
- https://cdn.elifesciences.org/articles/87863/elife-87863-fig2-data1-v1.tif
-
Figure 2—source data 2
Raw unedited gel LRAT.
- https://cdn.elifesciences.org/articles/87863/elife-87863-fig2-data2-v1.tif
-
Figure 2—source data 3
Raw unedited gel STRA6.
- https://cdn.elifesciences.org/articles/87863/elife-87863-fig2-data3-v1.tif
-
Figure 2—source data 4
Annotated uncropped gels.
- https://cdn.elifesciences.org/articles/87863/elife-87863-fig2-data4-v1.pdf
Figure 3 with 1 supplement
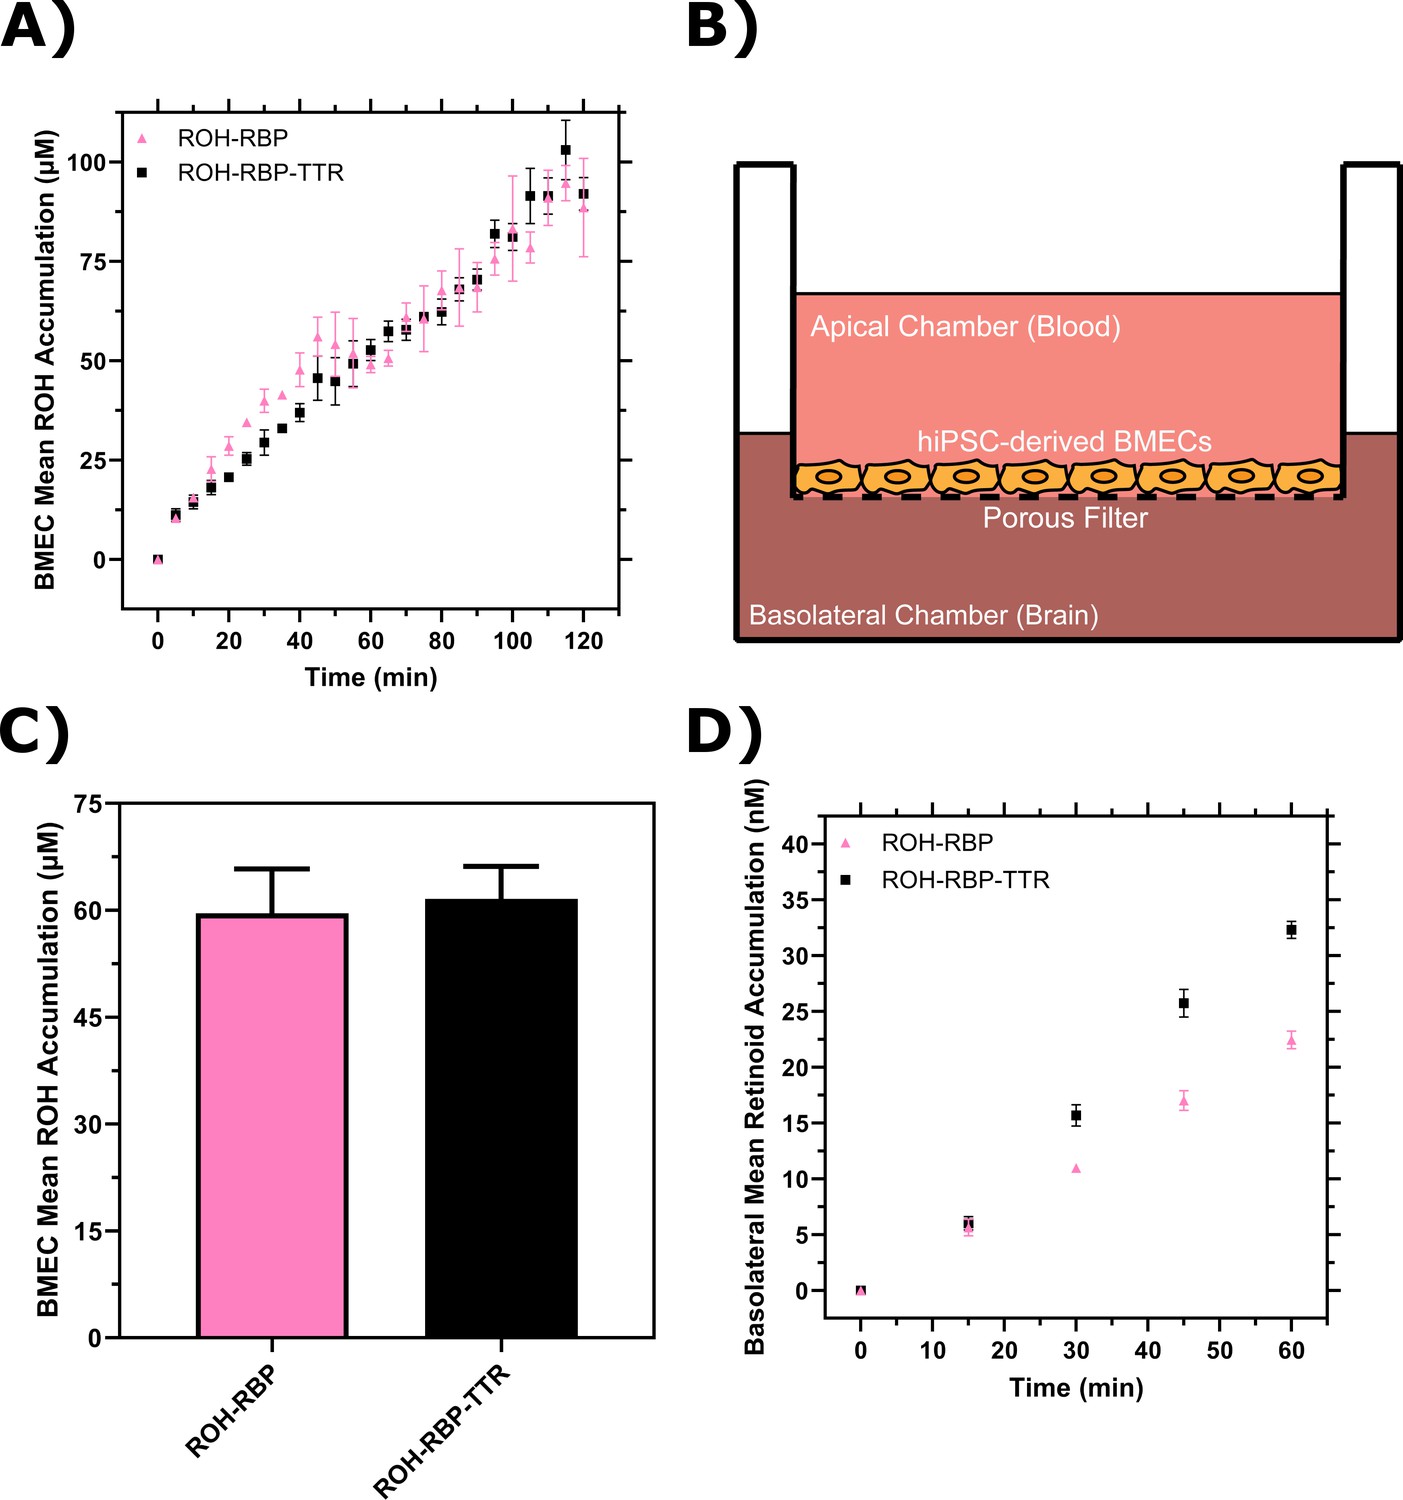
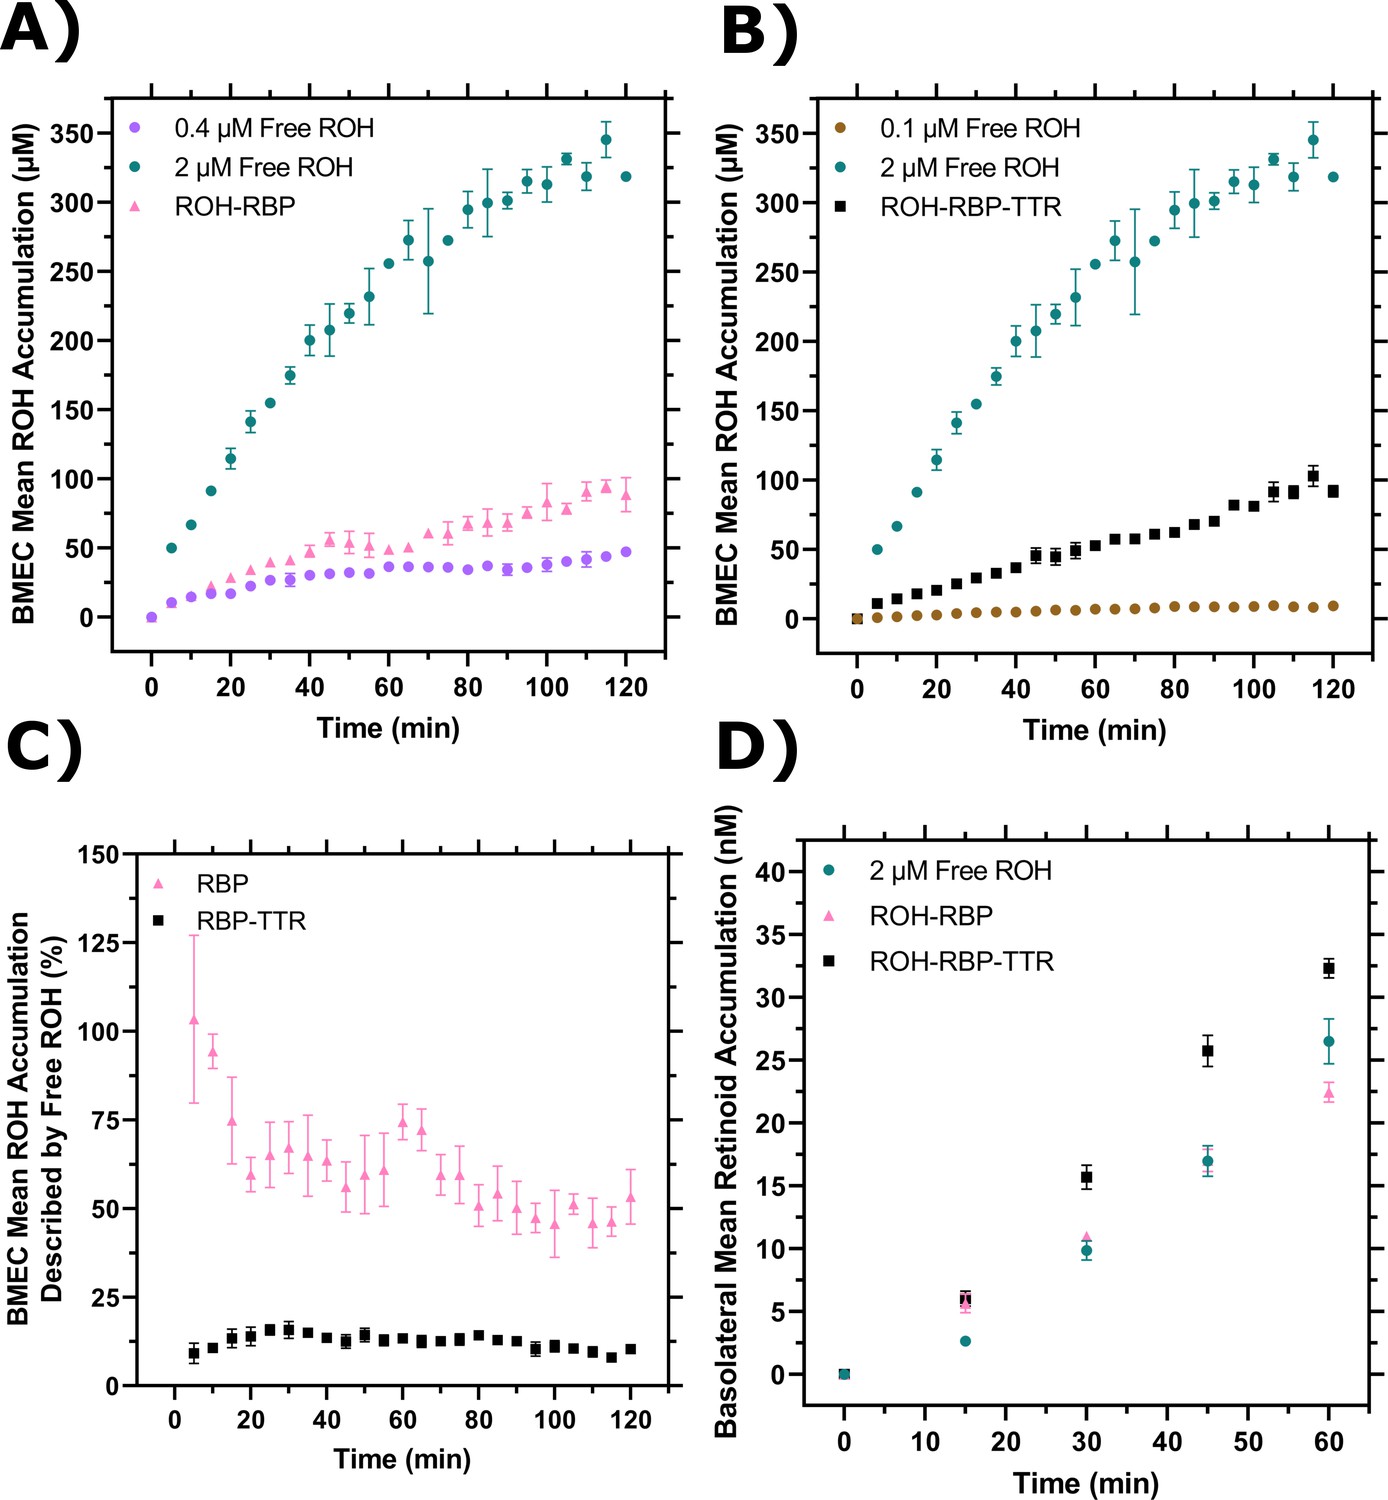
Brain microvascular endothelial-like cells (BMEC) retinol (ROH) uptake and permeation mediated by retinol-binding protein (RBP) or retinol-binding protein-transthyretin (RBP-TTR) complex.
(A) Mean ROH cellular accumulation as a function of time. Measured DPM values were converted to accumulated concentrations using the specific activity of 3H-ROH, the 3H-ROH:unlabeled ROH ratio (1:20), and the average cell volume. Error bars represent the standard deviation of three biological replicates. Fluid concentrations are typical of human blood concentrations at 2 µM ROH, 2 µM RBP, and 4 µM TTR. (B) Schematic of the Transwell apparatus. The semi-permeable support allows for BMEC basolateral efflux. (C) Mean ROH cellular accumulation in BMEC lysate after 60 min, collected from cells in Transwells. Measured DPM values were converted to accumulated concentrations using the specific activity of 3H-ROH, the 3H-ROH:unlabeled ROH ratio (1:20), and the calculated cell volume. (D) Kinetics of retinoid accumulation in the basolateral chamber. Error bars represent the standard deviation of four biological replicates. Measured DPM values were converted to accumulated concentrations using the specific activity of 3H-ROH, the 3H-ROH:unlabeled ROH ratio (1:20), and the volume of the basolateral chamber medium. Apical concentrations were 2 µM ROH, 2 µM RBP, and 4 µM TTR. No RBP or TTR was added to the basolateral chamber.
-
Figure 3—source data 1
Brain microvascular endothelial-like cells (BMEC) retinol (ROH) uptake and permeation mediated by retinol-binding protein (RBP) or retinol-binding protein-transthyretin (RBP-TTR) complex.
- https://cdn.elifesciences.org/articles/87863/elife-87863-fig3-data1-v1.xlsx
Figure 3—figure supplement 1

Individual brain microvascular endothelial-like cells (BMEC) retinol (ROH) accumulation curves.
Measured DPM values were converted to cellular concentrations using the specific activity of 3H-ROH, the 3H-ROH:unlabeled ROH ratio (1:20), and the calculated cell volume. Error bars represent the standard deviation of three biological replicates. Data are fit by a smoothed 10 point LOWESS function in order to better view the kinetic regimes. (A) 0.1 µM free ROH; (B) 0.4 µM free ROH; (C) 2 µM free ROH; (D) ROH-RBP; (E) ROH-muRBP; (F) ROH-RBP-TTR; and (G) ROH-RBP-muTTR.
Figure 4 with 1 supplement
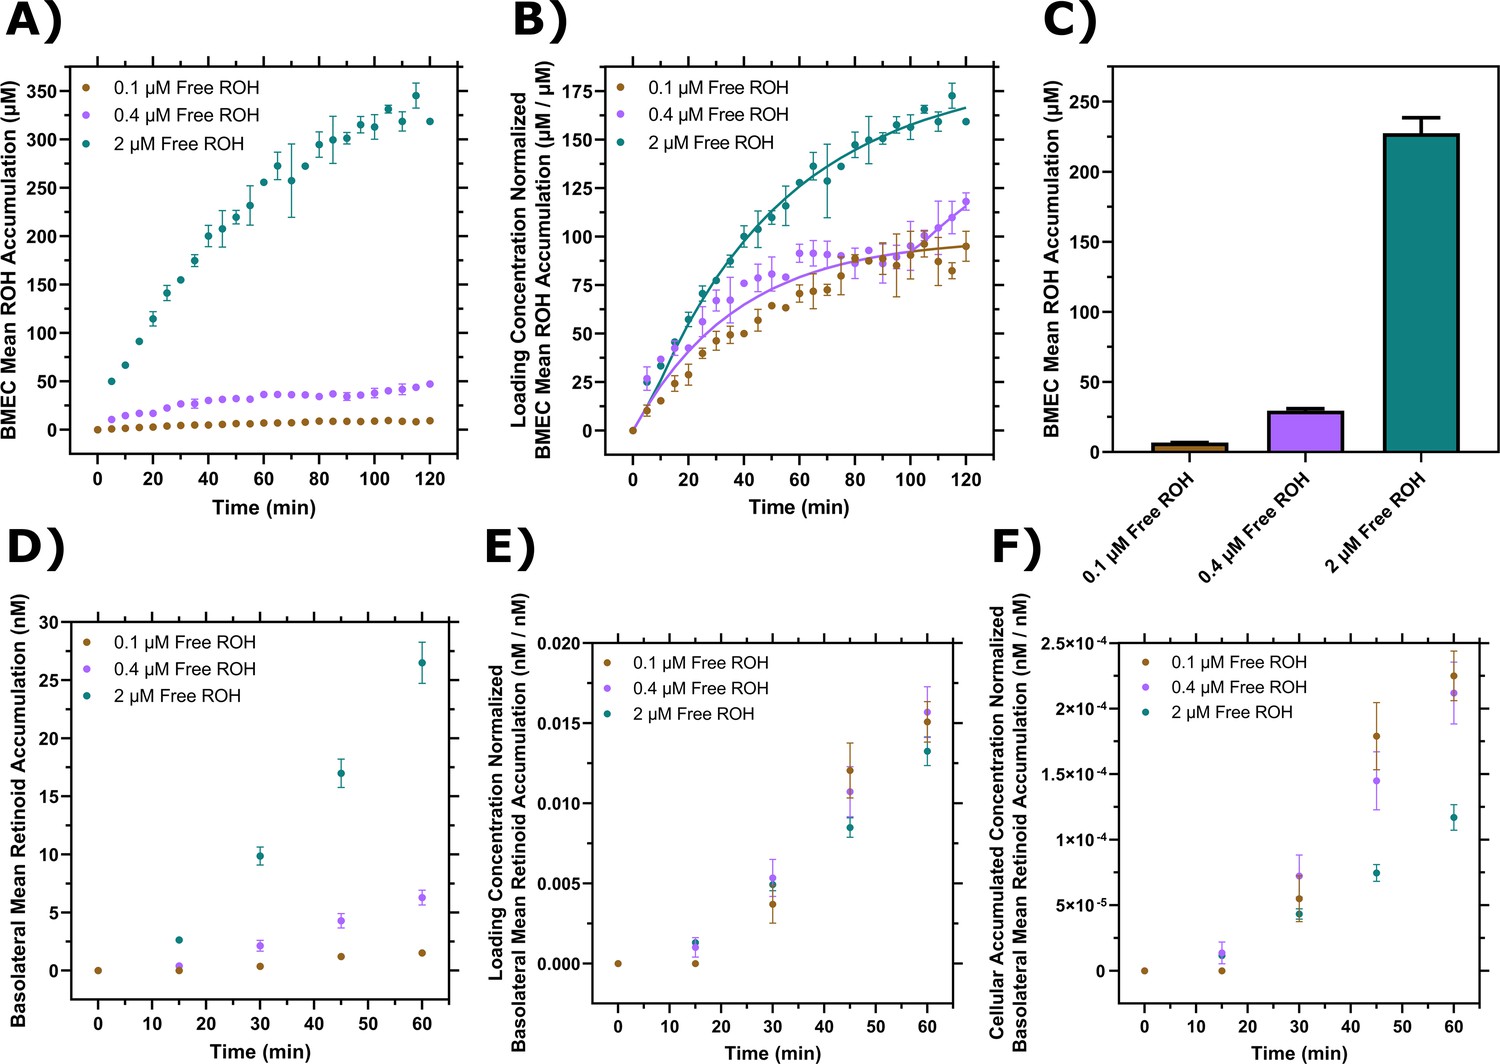
Brain microvascular endothelial-like cells (BMEC) retinol (ROH) uptake and permeation as a function of free ROH concentration.
(A) Mean ROH cellular accumulation as a function of time and free ROH concentration. Measured DPM values were converted to accumulated concentrations using the specific activity of 3H-ROH, the 3H-ROH:unlabeled ROH ratio (1:20), and the average cell volume. Error bars represent the standard deviation of three biological replicates. Fluid concentrations were 0.1, 0.4, or 2 µM ROH. No retinol-binding protein (RBP) or transthyretin (TTR) was present in the medium. (B) Mean ROH accumulation from panel (A) normalized by the ROH concentration in the medium. Data are fit by a simple partitioning model with a secondary uptake mechanism Equation 2 that triggers upon accumulation exceeding a fitted threshold value of ~36 µM. (C) Mean ROH cellular accumulation in BMEC lysate after 60 min, collected from cells in Transwells. Measured DPM values were converted to accumulated concentrations using the specific activity of 3H-ROH, the 3H-ROH:unlabeled ROH ratio (1:20), and the calculated cell volume. No RBP or TTR was added to either chamber. (D) Kinetics of retinoid accumulation in the basolateral chamber. Error bars represent the standard deviation of four biological replicates. Measured DPM values were converted to accumulated concentrations using the specific activity of 3H-ROH, the 3H-ROH:unlabeled ROH ratio (1:20), and the volume of the basolateral chamber medium. No RBP or TTR is added to either chamber. (E) Retinoid basolateral chamber accumulation normalized by the apical chamber ROH concentration. (F) Retinoid basolateral chamber accumulation normalized by the accumulated cellular ROH concentration at 60 min.
-
Figure 4—source data 1
Brain microvascular endothelial-like cells (BMEC) retinol (ROH) uptake and permeation as a function of free ROH concentration.
- https://cdn.elifesciences.org/articles/87863/elife-87863-fig4-data1-v1.xlsx
Figure 4—figure supplement 1
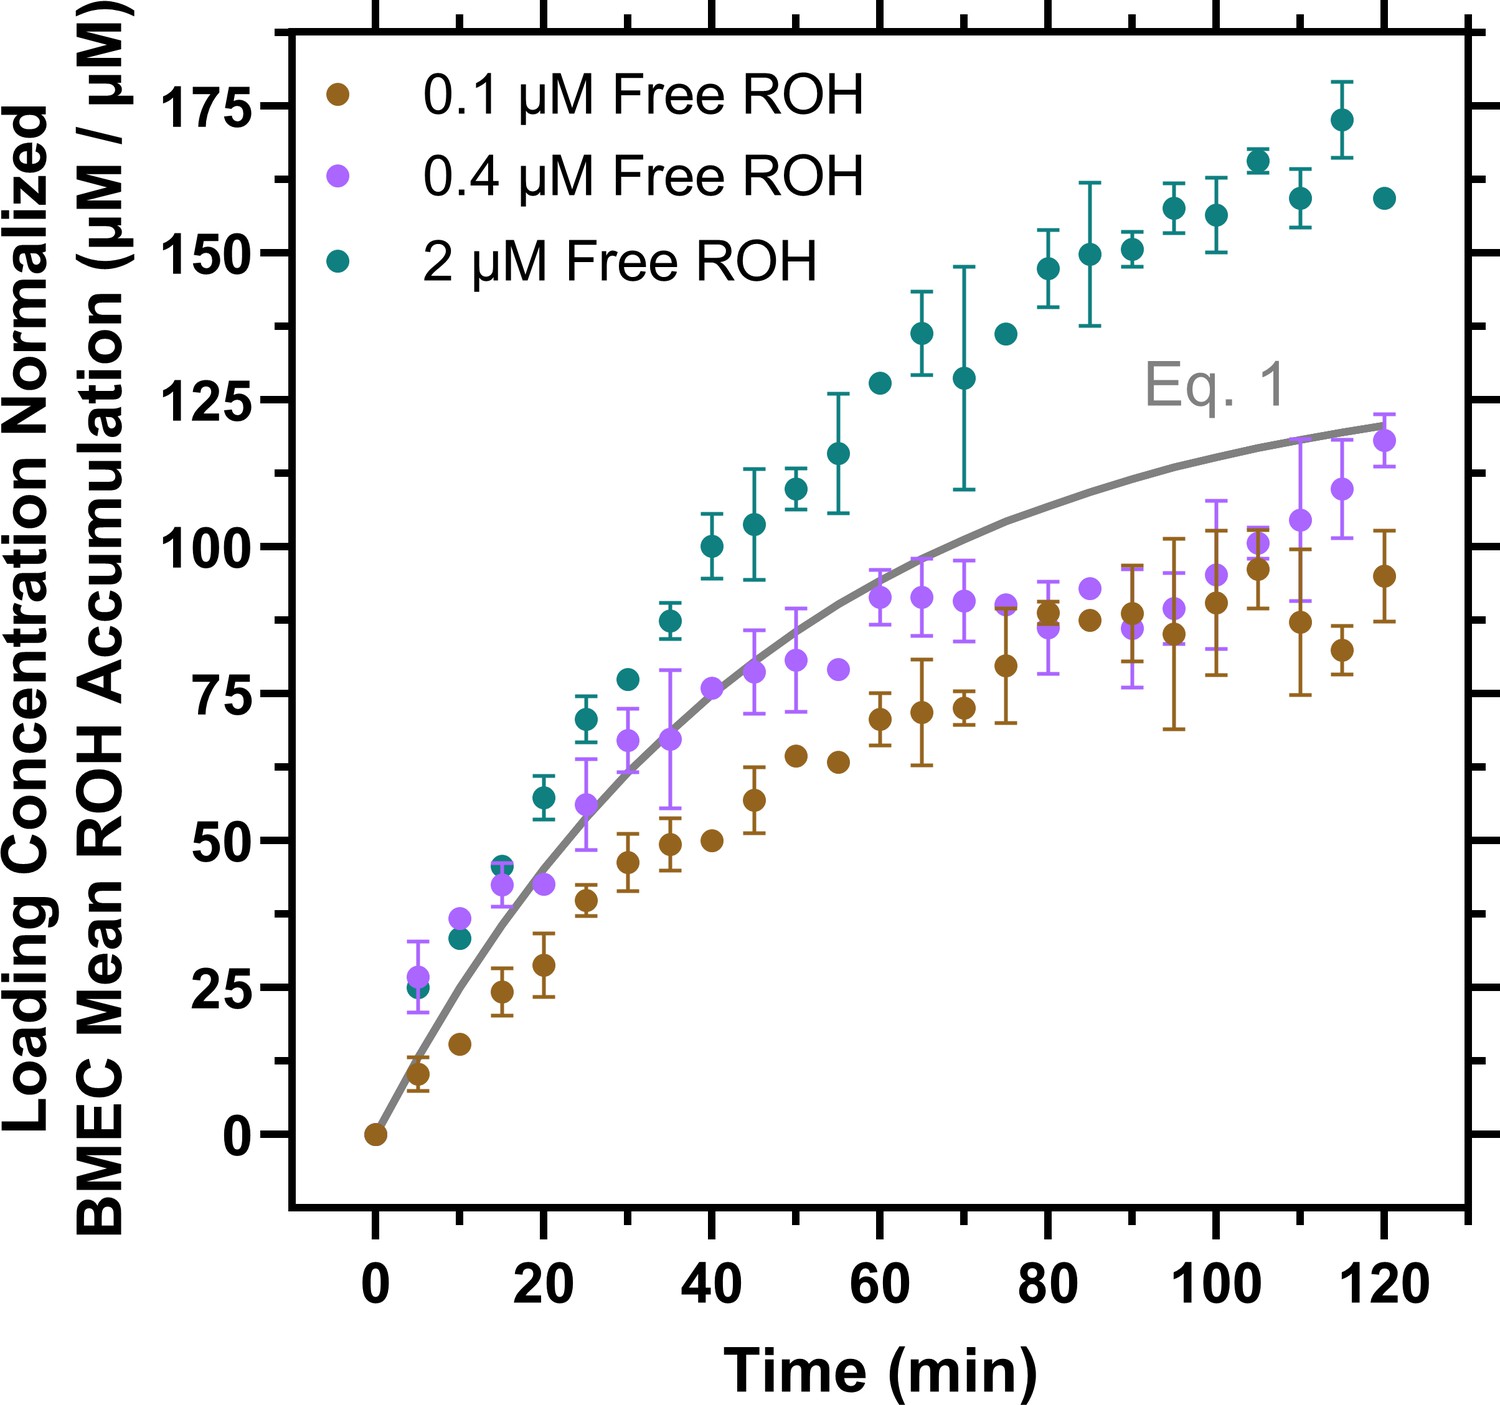
Mean retinol (ROH) accumulation partitioning model.
Data from Figure 4A are normalized by the ROH concentration in the medium and fit by a simple partitioning model (Equation 1 in gray). If this model were correct, the data at all free ROH concentrations would collapse onto a single curve described by Equation 1 .
Figure 5
Comparison of cellular retinol (ROH) accumulation and permeation with or without retinol-binding protein (RBP) or transthyretin (TTR).
(A) Cellular accumulation from ROH-RBP, replotted from Figure 3A, compared to 0.4 µM or 2 µM ROH, replotted from Figure 4A. The ROH-RBP solution is an equilibrated mixture of 2 µM ROH and 2 µM RBP, with a calculated protein-free (unbound) ROH concentration of 0.4 µM. (B) Cellular accumulation from ROH-RBP-TTR, replotted from Figure 3A, compared to 0.1 µM or 2 µM ROH, replotted from Figure 4A. The ROH-RBP-TTR solution is an equilibrated mixture of 2 µM ROH, 2 µM RBP, and 4 µM TTR, with a calculated protein-free (unbound) ROH concentration of 0.14 µM. (C) Percentage of cellular ROH accumulation from ROH-RBP or ROH-RBP-TTR that could be potentially described by the contribution of free ROH present in the protein samples (0.4 µM free ROH for ROH-RBP and 0.1 µM for ROH-RBP-TTR). (D) Comparison of basolateral retinoid permeation for free ROH, ROH-RBP, and ROH-RBP-TTR samples each containing 2 µM total ROH per sample.
Figure 6 with 1 supplement
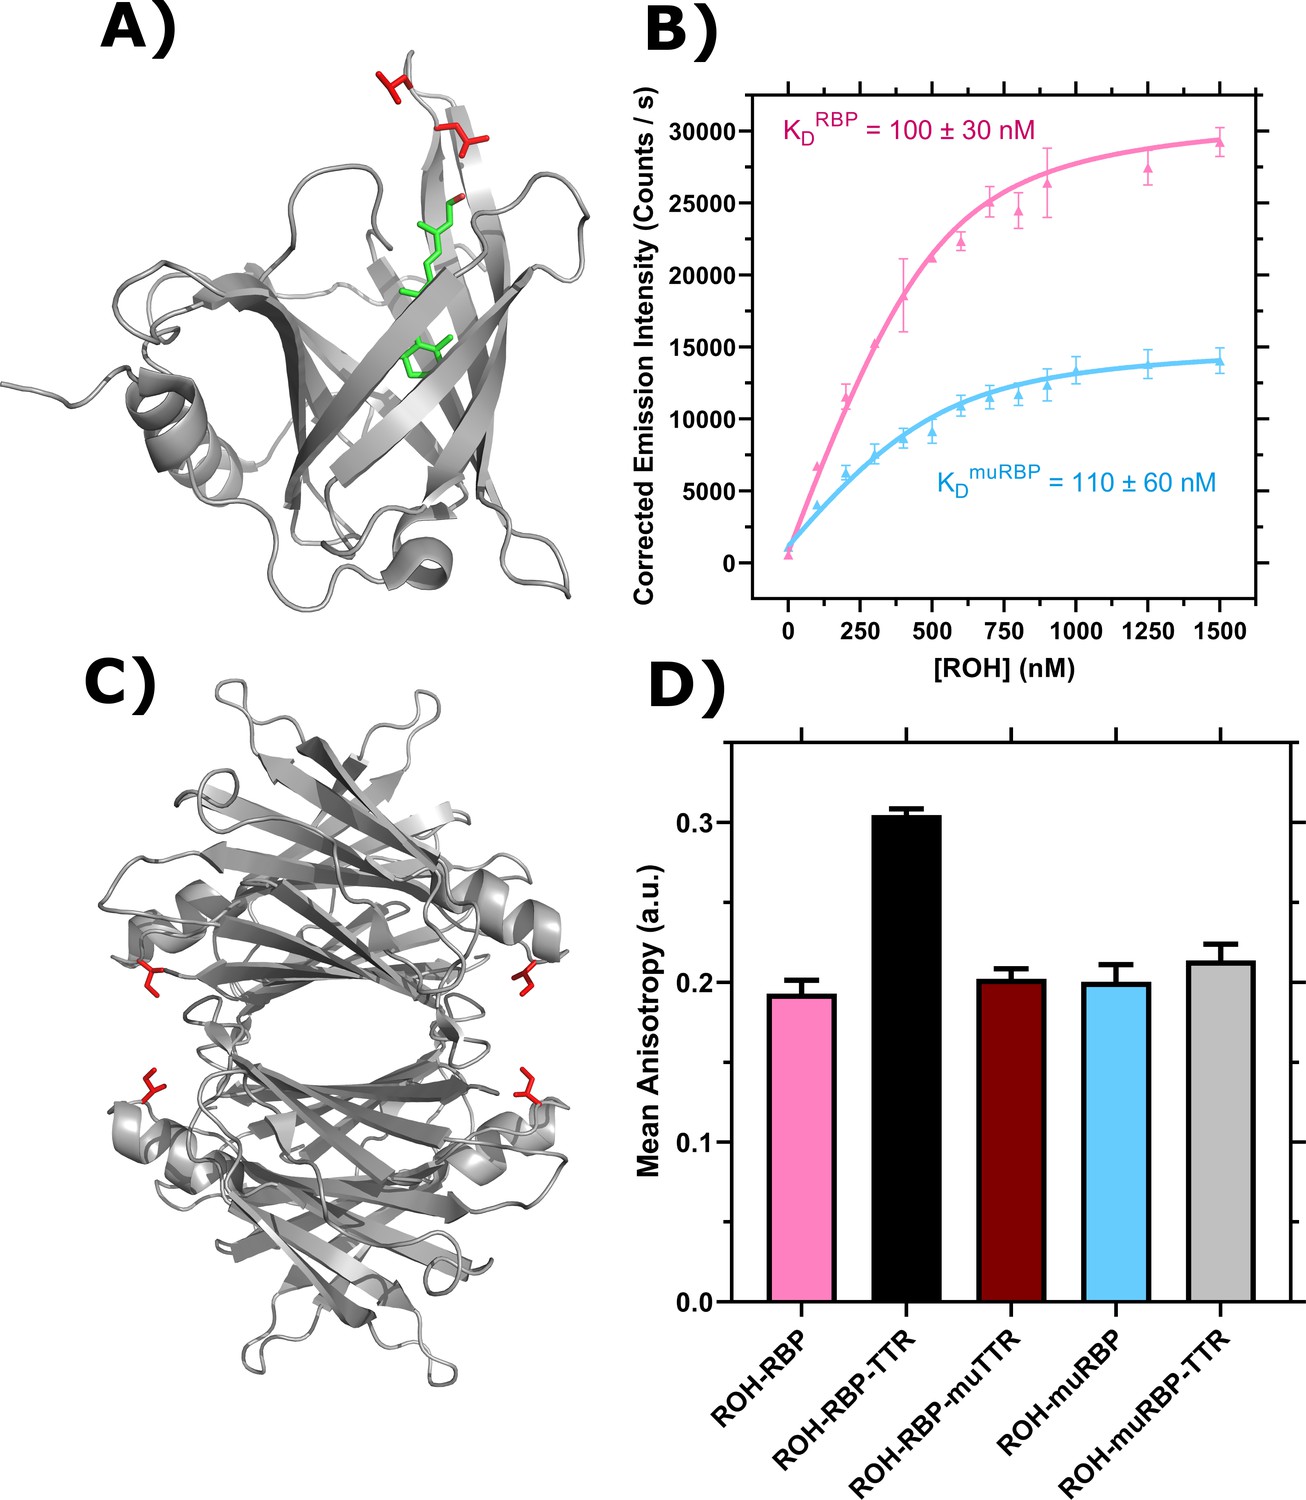
Characterization of retinol-binding protein (RBP), transthyretin (TTR), and mutants.
(A) PDB entry 5NU7 (Perduca et al., 2018). Ribbon diagram displays RBP with bound retinol (ROH) shown in green and L63 and L64 in red. (B) ROH binding to RBP (pink, adapted from Est and Murphy, 2020) and muRBP (blue) monitored by emission of ROH at 460 nm as an acceptor in resonance energy transfer from donor RBP tryptophan. Data are fit by nonlinear regression as described (Est and Murphy, 2020). Error bars represent the standard deviation of three independent replicates. (C) PDB entry 5CN3 (Yee et al., 2016). Ribbon diagram displays the TTR tetramer. I84 for each TTR monomer is shown in red. (D) Representative binding of 1 μM ROH-RBP or 1 μM ROH-muRBP to 4 μM TTR or 4 μM muTTR as measured by fluorescence anisotropy using the polarized emission of ROH at 460 nm. Error bars represent the standard deviation of three technical replicates.
-
Figure 6—source data 1
Characterization of retinol-binding protein (RBP), transthyretin (TTR), and mutants.
- https://cdn.elifesciences.org/articles/87863/elife-87863-fig6-data1-v1.xlsx
Figure 6—figure supplement 1

Normalized chromatographic analysis of wild-type retinol-binding protein (RBP) and L63R/L64S mutant RBP.
Spectra of both wild-type RBP (RBP), adapted from Est and Murphy, 2020, and L63R/L64S mutant RBP (muRBP) were normalized to their respective max absorbance signals at 280 nm and overlaid on the same plot. The vertical bars represent the retention time corresponding to the max signal for RBP. (A) Approximately 15 μg of either RBP or muRBP in PBS (pH 7.4) was injected onto a TOSOH TSKgel BioAssist G2SWxl analytical size-exclusion column operating at a flow rate of 1.0 mL/min of PBS (pH 7.4). (B) RBP and muRBP were concentrated and buffer exchanged into AEX Buffer A (25 mM Tris, 1 mM EDTA, pH 8.0). The protein samples were filtered through a 0.22 μm filter (Millipore) and slowly applied by syringe to a GE HiScreen diethylaminoethyl (DEAE) column pre-equilibrated with AEX Buffer A. The sample was allowed to adsorb for 10 min, then re-equilibrated for 10 min with AEX Buffer A at a flow rate of 1.0 mL/min. A step salt gradient (dotted line) was applied by mixing AEX Buffer A with high salt AEX Buffer B (25 mM Tris, 1 M NaCl, 1 mM EDTA, pH 8.0) at 1.0 mL/min.
Figure 7
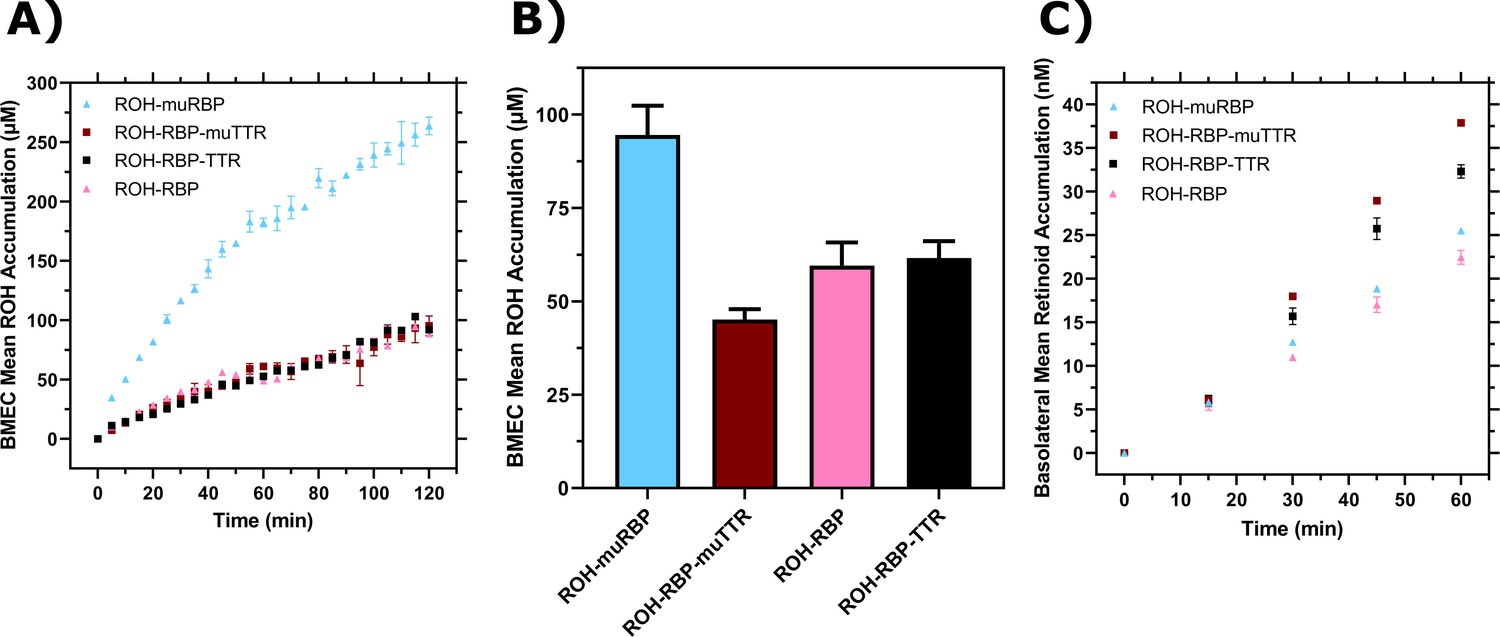
Comparison of retinol-binding protein (RBP) and transthyretin (TTR) to muRBP and muTTR.
(A) Mean retinol (ROH) cellular accumulation as a function of time and concentration. Error bars represent the standard deviation of three biological replicates. The medium contains 2 µM ROH equilibrated with 2 µM RBP, 2 µM muRBP, 2 µM RBP +4 µM TTR, or 2 µM RBP +4 µM muTTR. (B) Mean ROH cellular accumulation in brain microvascular endothelial-like cells (BMEC) lysate after 60 min, collected from cells in Transwells. Apical concentrations are the same as listed in panel (A). (C) Kinetics of retinoid permeation into the basolateral chamber comparing ROH-RBP, ROH-muRBP, ROH-RBP-TTR, and ROH-RBP-muTTR.
-
Figure 7—source data 1
Brain microvascular endothelial-like cells (BMEC) retinol (ROH) uptake and permeation mediated by retinol-binding protein (RBP) or retinol-binding protein-transthyretin (RBP-TTR) complex or their mutants.
- https://cdn.elifesciences.org/articles/87863/elife-87863-fig7-data1-v1.xlsx
Figure 8
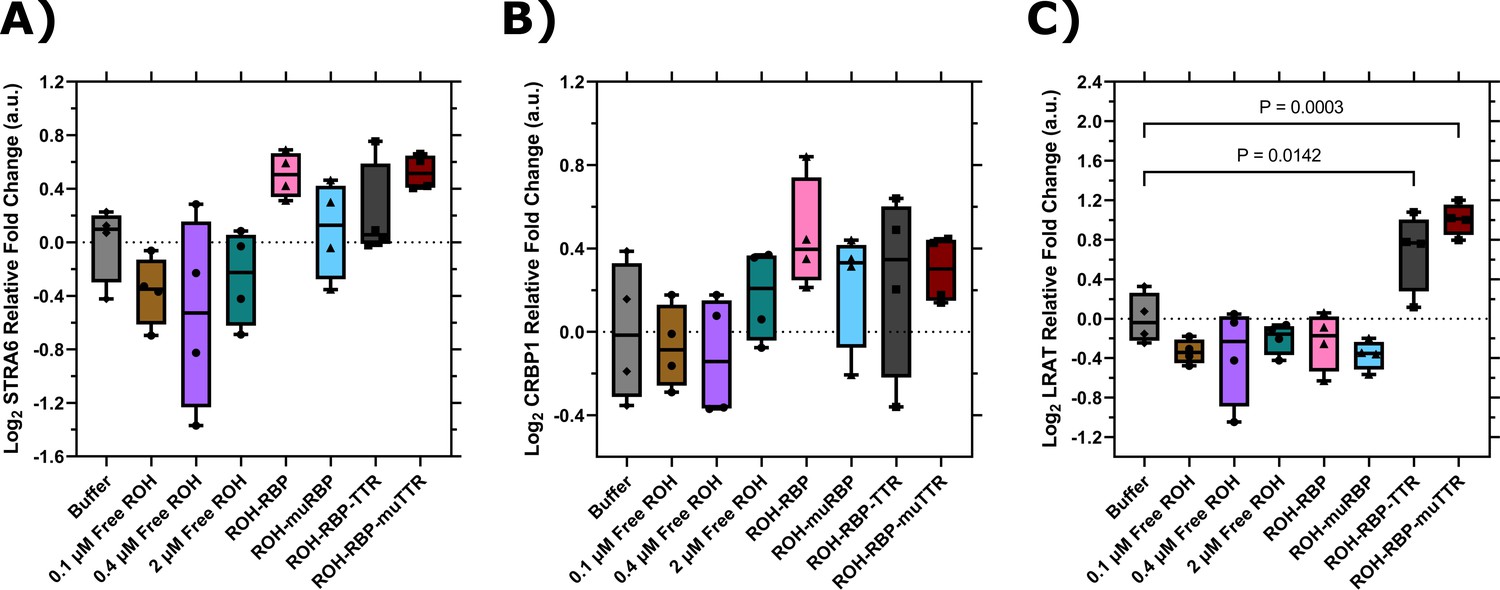
RT-qPCR data for brain microvascular endothelial-like cells (BMECs) treated with different retinol (ROH) modalities for 2 hr.
Expression values are normalized to the housekeeping gene, ACTB, and quantified relative to BMECs treated with HBSS alone. ΔΔCq data are presented in box-and-whisker format after log2 transformation with the values for each biological replicate displayed individually (N = 4). Statistical analyses were performed in Prism on log2 transformed ΔΔCq values via one-way ANOVA followed by Dunnett’s test using a confidence interval of 95%. (A) STRA6; (B) CRBP1; and (C) LRAT.
-
Figure 8—source data 1
RT-qPCR data for brain microvascular endothelial-like cells (BMECs) treated with different retinol (ROH) modalities for 2 hr.
- https://cdn.elifesciences.org/articles/87863/elife-87863-fig8-data1-v1.xlsx
Tables
Table 1
ROH and protein concentrations for BMEC accumulation and permeability assays.
| ROH distribution based on KD (µM)* | |||||
|---|---|---|---|---|---|
| Total ROH concentration (µM) | Delivery mode† | Free ROH | ROH-RBP | ROH-RBP-TTR | Notes |
| 0.1 | Free | 0.1 | 0 | 0 | |
| 0.4 | Free | 0.4 | 0 | 0 | |
| 2 | Free | 2 | 0 | 0 | |
| 2 | ROH-RBP | 0.4 | 1.6 | 0 | ROH partitions between free and RBP-bound states. |
| 2 | ROH-muRBP | 0.4 | 1.6 | 0 | muRBP binding affinity to TTR and possibly to STRA6 is abolished. |
| 2 | ROH-RBP-TTR | 0.14 | 0.18 | 1.68 | ROH partitions between free, RBP-bound, and RBP-TTR-bound states. |
| 2 | ROH-RBP-muTTR | 0.4 | 1.6 | 0 | ROH partitions between free and RBP-bound states. RBP does not bind to muTTR. |
-
BMEC, brain microvascular endothelial-like cells; muTTR, mutant I84A transthyretin; RBP, retinol-binding protein; ROH, retinol; TTR, transthyretin.
-
*
Distribution of ROH between unbound (free) and protein-bound states was calculated by assuming equilibrium and utilizing the known or measured KD for binding of RBP to ROH and for binding of TTR to ROH-RBP.
-
†
Delivery mode indicates whether ROH was supplied to the cell culture medium in the absence of binding protein (free) or pre-complexed with RBP, muRBP (L63R/L64S), RBP-TTR, or RBP-muTTR (I84A). Total RBP and TTR concentrations were 2 µM and 4 µM, respectively.
Table 2
Antibodies and staining information for immunocytochemistry.
| Antibody target | Manufacturer | Catalog number | Clonality | Host | Dilution | Fixative |
|---|---|---|---|---|---|---|
| PECAM1 | Thermo Fisher | RB-10333-P1 | Polyclonal | Rabbit | 1:25 | MeOH |
| CLDN5 | Thermo Fisher | 35-2500 | Monoclonal | Mouse | 1:200 | MeOH |
| OCLN | Thermo Fisher | 33-1500 | Monoclonal | Mouse | 1:50 | MeOH |
| TJP1 (ZO-1) | Thermo Fisher | 33-9100 | Monoclonal | Mouse | 1:200 | MeOH |
| SLC2A1 (GLUT1) | Thermo Fisher | MA1-37783 | Monoclonal | Mouse | 1:500 | MeOH |
| ABCG2 (BCRP) | MilliporeSigma | MAB4155 | Monoclonal | Mouse | 1:50 | 4% PFA |
| ABCC1 (MRP1) | MilliporeSigma | MAB4100 | Monoclonal | Mouse | 1:25 | MeOH |
| STRA6 | Abnova | H00064220-D01P | Polyclonal | Rabbit | 1:200 | 4% PFA |
| CRBP1 | Thermo Fisher | PA5-28713 | Polyclonal | Rabbit | 1:500 | MeOH |
| LRAT | Thermo Fisher | PA5-38556 | Polyclonal | Rabbit | 1:250 | MeOH |
Table 3
Antibodies and staining information for western blot.
| Antibody target | Manufacturer | Catalog number | Clonality | Host | Dilution |
|---|---|---|---|---|---|
| LRAT | Thermo Fisher | PA5-38556 | Polyclonal | Rabbit | 1:500 |
| CRBP1 | Thermo Fisher | PA5-28713 | Polyclonal | Rabbit | 1:1000 |
| STRA6 | Abnova | H00064220-D01P | Polyclonal | Rabbit | 1:1000 |
| TJP1 (ZO-1) | Thermo Fisher | 33-9100 | Monoclonal | Mouse | 1:1000 |
| TJP1 (ZO-1) | Thermo Fisher | 40-2200 | Polyclonal | Rabbit | 1:1000 |
Table 4
qPCR primer information.
| Gene | Expected product size (bp) | Oligo sequences5′ – forward primer – 3′5′ – reverse primer – 3′ | Final reaction concentration (nM) |
|---|---|---|---|
| LRAT | 149 | AGCCTGCTGTGGAACAACTG GCCAATCCCAAGACTGCTGA | 100 |
| CRBP1 | 175 | AGATCGTGCAGGACGGTGA CCCTTCTGCACACACTGGAG | 100 |
| STRA6 | 216 | ACACACAGGACCAACCTTCGAG GAGCACAGGCATGAGCACCA | 200 |
| ACTB | 218 | CATCCGCAAAGACCTGTACG CCTGCTTGCTGATCCACATC | 100 |
Additional files
-
Supplementary file 1
This file contains supporting data on mass balances, permeability, accumulation and partitioning.
(a) Mass balances for 3H-ROH. (b) Mass balances for 14C-sucrose. (c) Mean apparent permeability of 3H-ROH and 14C-sucrose. (d) Maximum percentage of fluid phase ROH accumulated by cells. (e) Partitioning model fits for BMEC free ROH accumulation.
- https://cdn.elifesciences.org/articles/87863/elife-87863-supp1-v1.docx
Download links
A two-part list of links to download the article, or parts of the article, in various formats.
Downloads (link to download the article as PDF)
Open citations (links to open the citations from this article in various online reference manager services)
Cite this article (links to download the citations from this article in formats compatible with various reference manager tools)
An in vitro model for vitamin A transport across the human blood–brain barrier
eLife 12:RP87863.
https://doi.org/10.7554/eLife.87863.2


