Rabies virus-based barcoded neuroanatomy resolved by single-cell RNA and in situ sequencing
- Allen Institute for Brain Science, United States
- McGovern Institute for Brain Research, Massachusetts Institute of Technology, United States
- Department of Electrical Engineering and Computer Science, Massachusetts Institute of Technology, Broad Institute of MIT and Harvard, United States
- Broad Institute of MIT and Harvard, United States
Figures
Figure 1
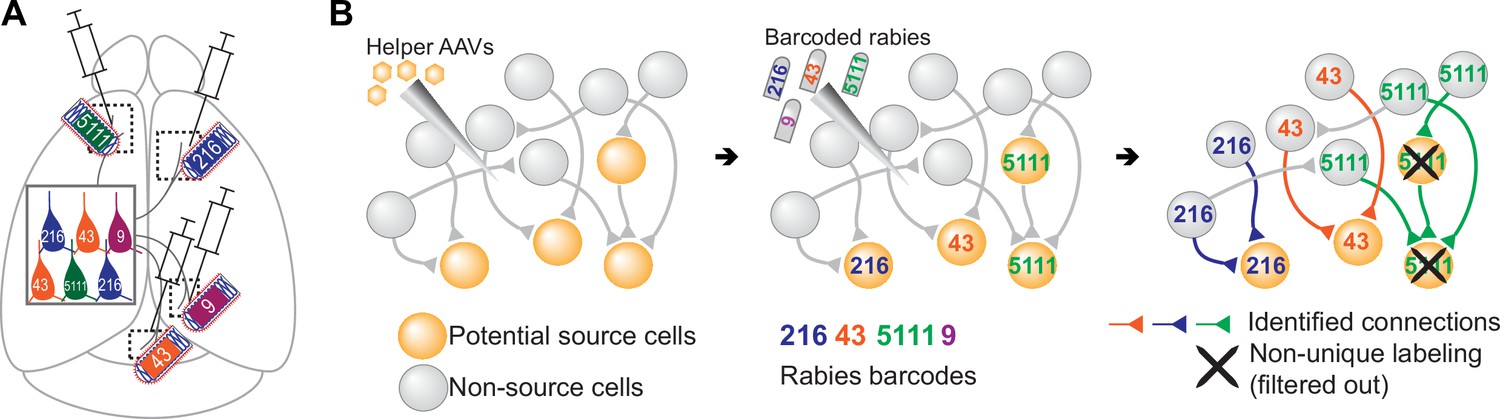
Models of multiplexed retrograde labeling and monosynaptic tracing using barcoded rabies virus.
(A) In multiplexed retrograde labeling, rabies viruses carrying different barcodes are injected into different brain regions, and retrogradely labeled neurons can be distinguished based on the barcodes they carry. Numbers and colors indicate different barcodes injected into each area. (B) In multiplexed monosynaptic tracing, potential source cells are first labeled by helper AAV viruses expressing TVA and rabies glycoprotein (yellow cells, left). These cells can be infected by barcoded rabies virus (barcodes are indicated by numbers, middle). These source cells can then pass the barcodes to presynaptic neurons (numbered gray cells, right). Both rabies barcodes and endogenous mRNAs can be read out to infer cell type connectivity. However, if multiple source cells share the same barcode, they may obscure single-cell connectivity mapping and must be filtered out (crossed out cells, right).
Figure 2 with 3 supplements
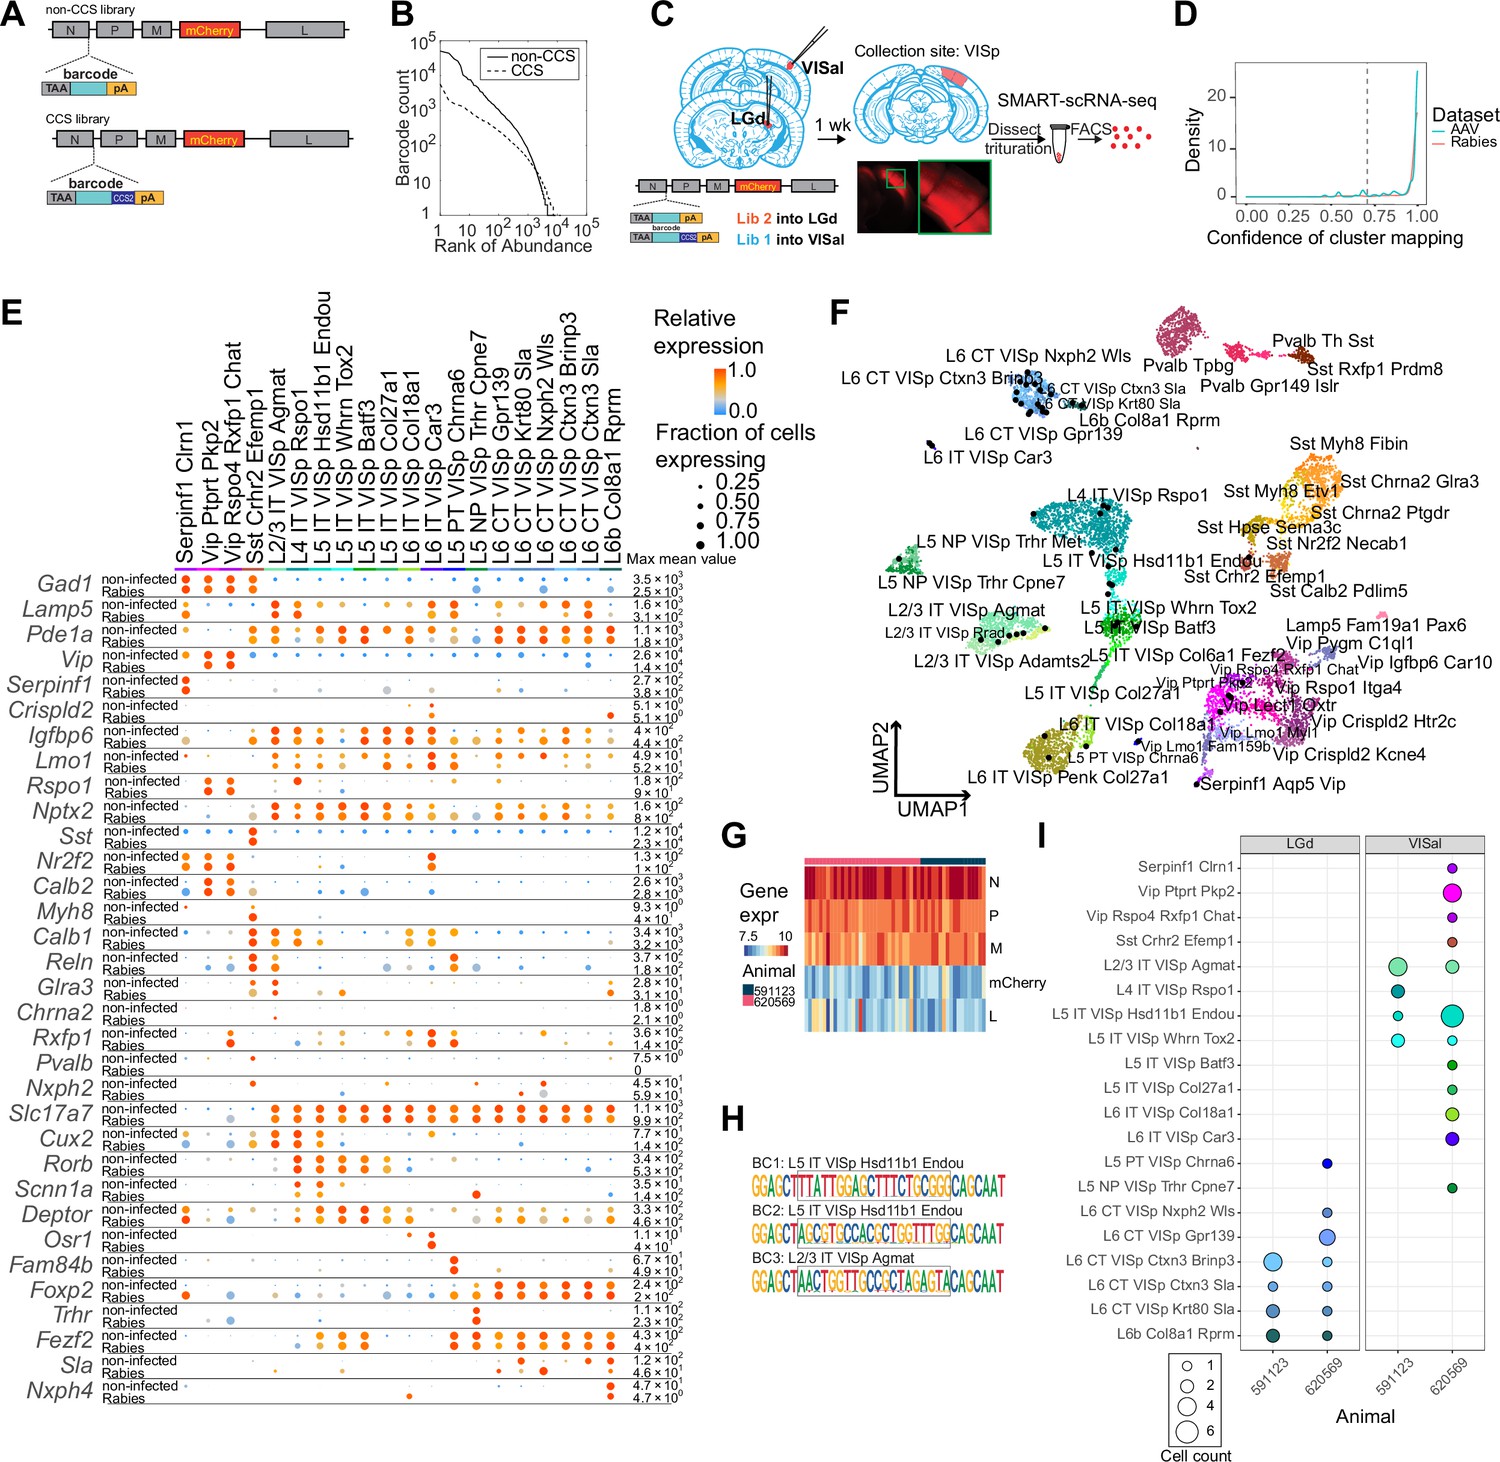
High-quality cell typing of rabies virus-barcoded neurons using single-cell RNA-seq.
(A) Illustration of the design of barcoded rabies virus libraries. (B) Barcode distribution in the CCS and non-CCS libraries. The y axis indicates the count of barcodes, which are sorted in descending order. The rank of the barcode is shown on the x axis. (C) An outline of the experiments. The two libraries are injected into VISal and LGd. After a week, VISp is dissected, and the mCherry-expressing cells are FACS-enriched and processed for single-cell RNA-seq. (D) Histogram showing the cluster mapping confidence of rabies-labeled cells from this study and AAV-labeled cells from Graybuck et al., 2021. (E) The expression of select marker gene in non-infected cells from Tasic et al., 2018 and in rabies-infected cells of matching cell types. Dot size indicates the proportion of cells with non-zero marker expression, and colors indicate relative gene expression levels scaled per row. (F) UMAP plot of gene expression patterns of cells infected with rabies virus (black) overlaid on non-infected cells from Tasic et al., 2018. The non-infected cells are color-coded by cluster identities and cluster names are indicated. (G) The expression of rabies-encoded genes in the sequenced cells. Columns indicate cells and rows indicate genes. Colors indicate the log transformed count for each rabies-encoded gene after scaling by the sum of all reads that mapped to viral constructs multiplied by 10,000. The bar on top indicates donor animals. (H) Example barcode sequences in three sequenced cells. Letter heights indicate probabilities at each position. Gray boxes indicate the barcode region. (I) Distribution of cell types of retrogradely labeled cells. Colors indicate cell types and match those in (F), and dot size indicates the number of cells. VISp, primary visual cortex; VISal, anterolateral visual cortex; LGd, dorsal lateral geniculate nucleus.
Figure 2—figure supplement 1
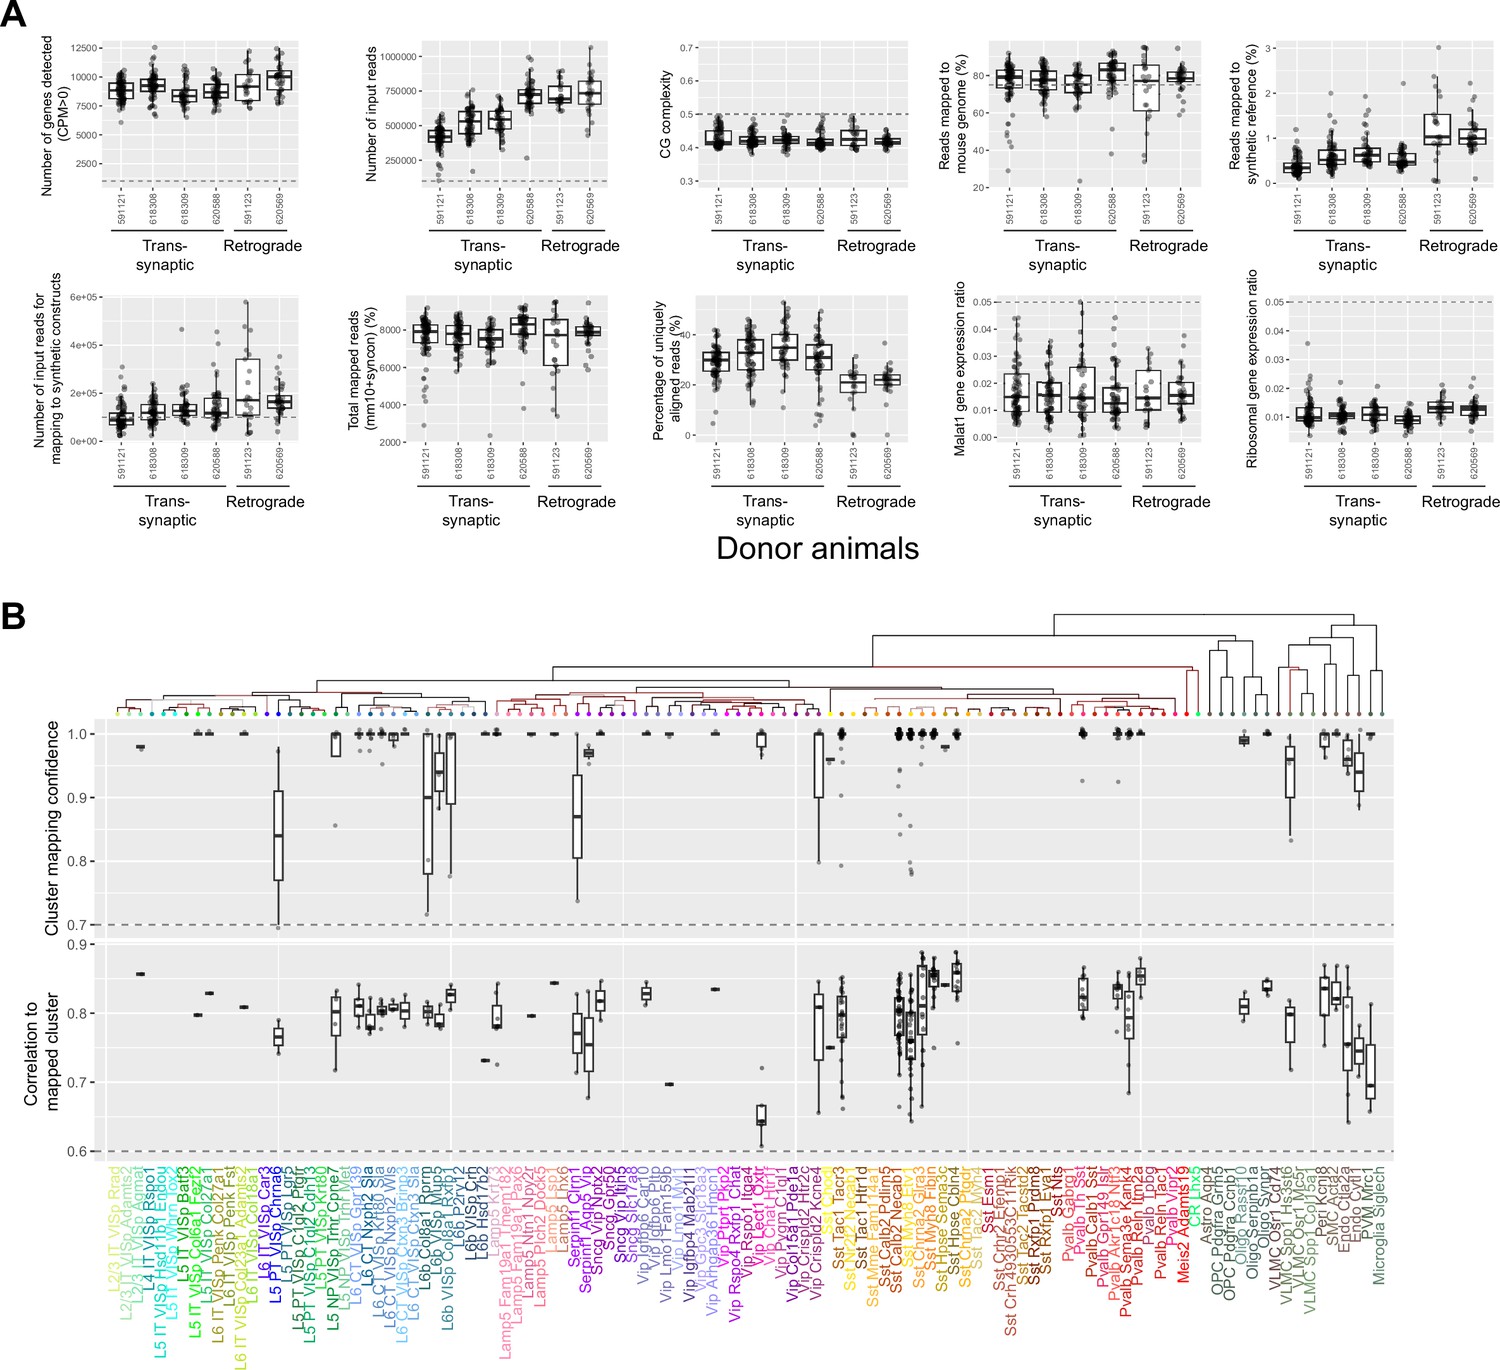
Quality control of scRNA-seq in rabies virus-infected cells.
(A) Quality control plots of scRNA-seq for two animals used in multiplexed retrograde labeling experiments (591123 and 620569) and four animals used in barcoded transsynaptic labeling experiments (591121, 618308, 618309, and 620588). (B) Cluster mapping confidence (top) and correlation to mapped cluster (bottom, see Materials and methods M7 for definitions) for rabies barcoded neurons. In both (A) and (B), boxes indicate quartiles and medians, and whiskers indicate range of data excluding outliers. Outliers are shown as individual dots.
Figure 2—figure supplement 2
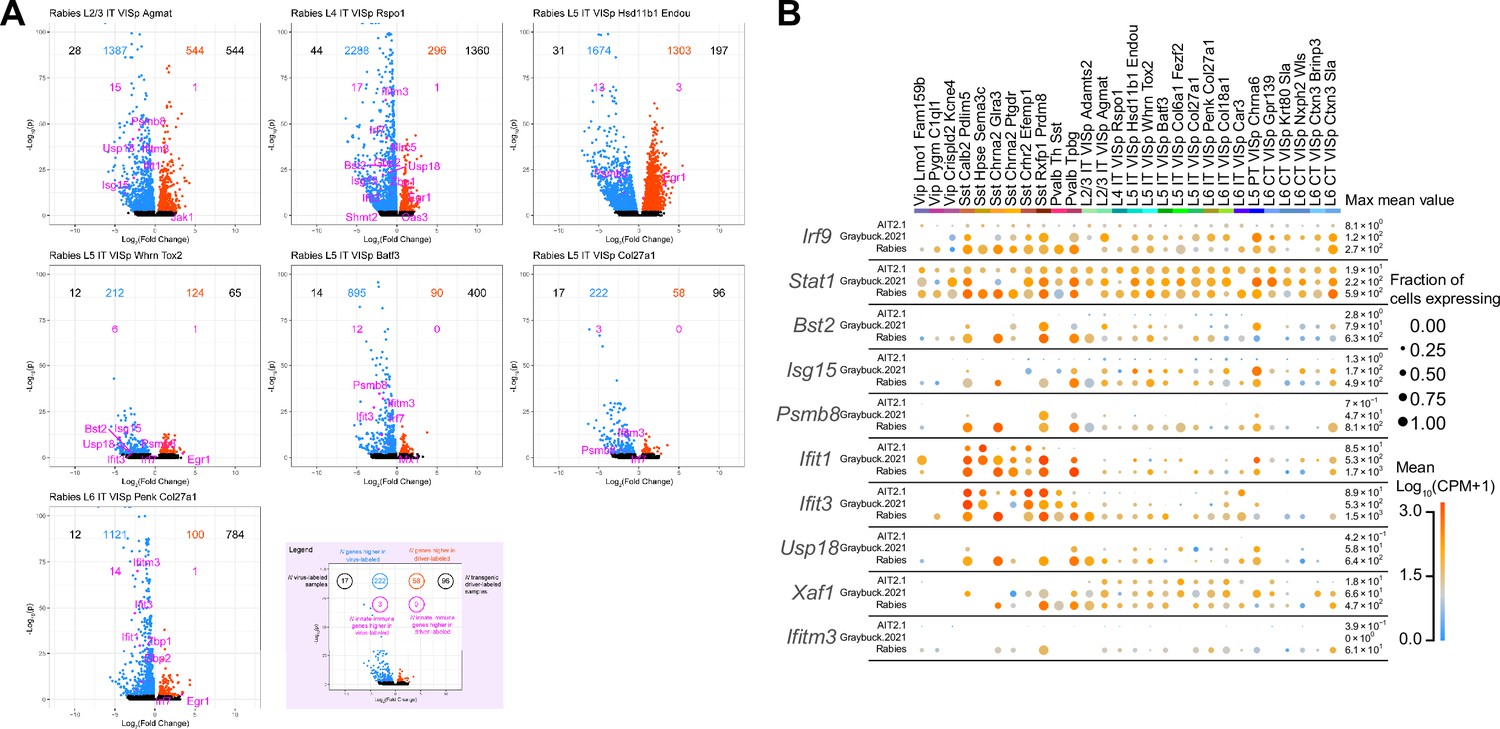
The expression of immune response-related genes in rabies virus-infected cells.
(A) Volcano plots showing differential expression of genes in clusters with more than 10 rabies infected cells across all six animals. X axes indicate and y axes indicate . Red/blue dots indicate genes that were up-regulated or down-regulated, respectively. (B) The expression of immune response related genes in uninfected cells from Tasic et al., 2018, AAV-infected cells from Graybuck et al., 2021, and rabies infected cells of matching cell types from this study. Top 10 genes that were upregulated in rabies infected cells were plotted. Dot size indicates the proportion of cells with nonzero expression, and colors indicate mean gene expression levels.
Figure 2—figure supplement 3

The expression of activity-related genes in rabies virus-infected cells and uninfected cells from Tasic et al., 2018.
Dot size indicates the proportion of cells with nonzero marker expression, and colors indicate relative gene expression levels scaled per row.
Figure 3
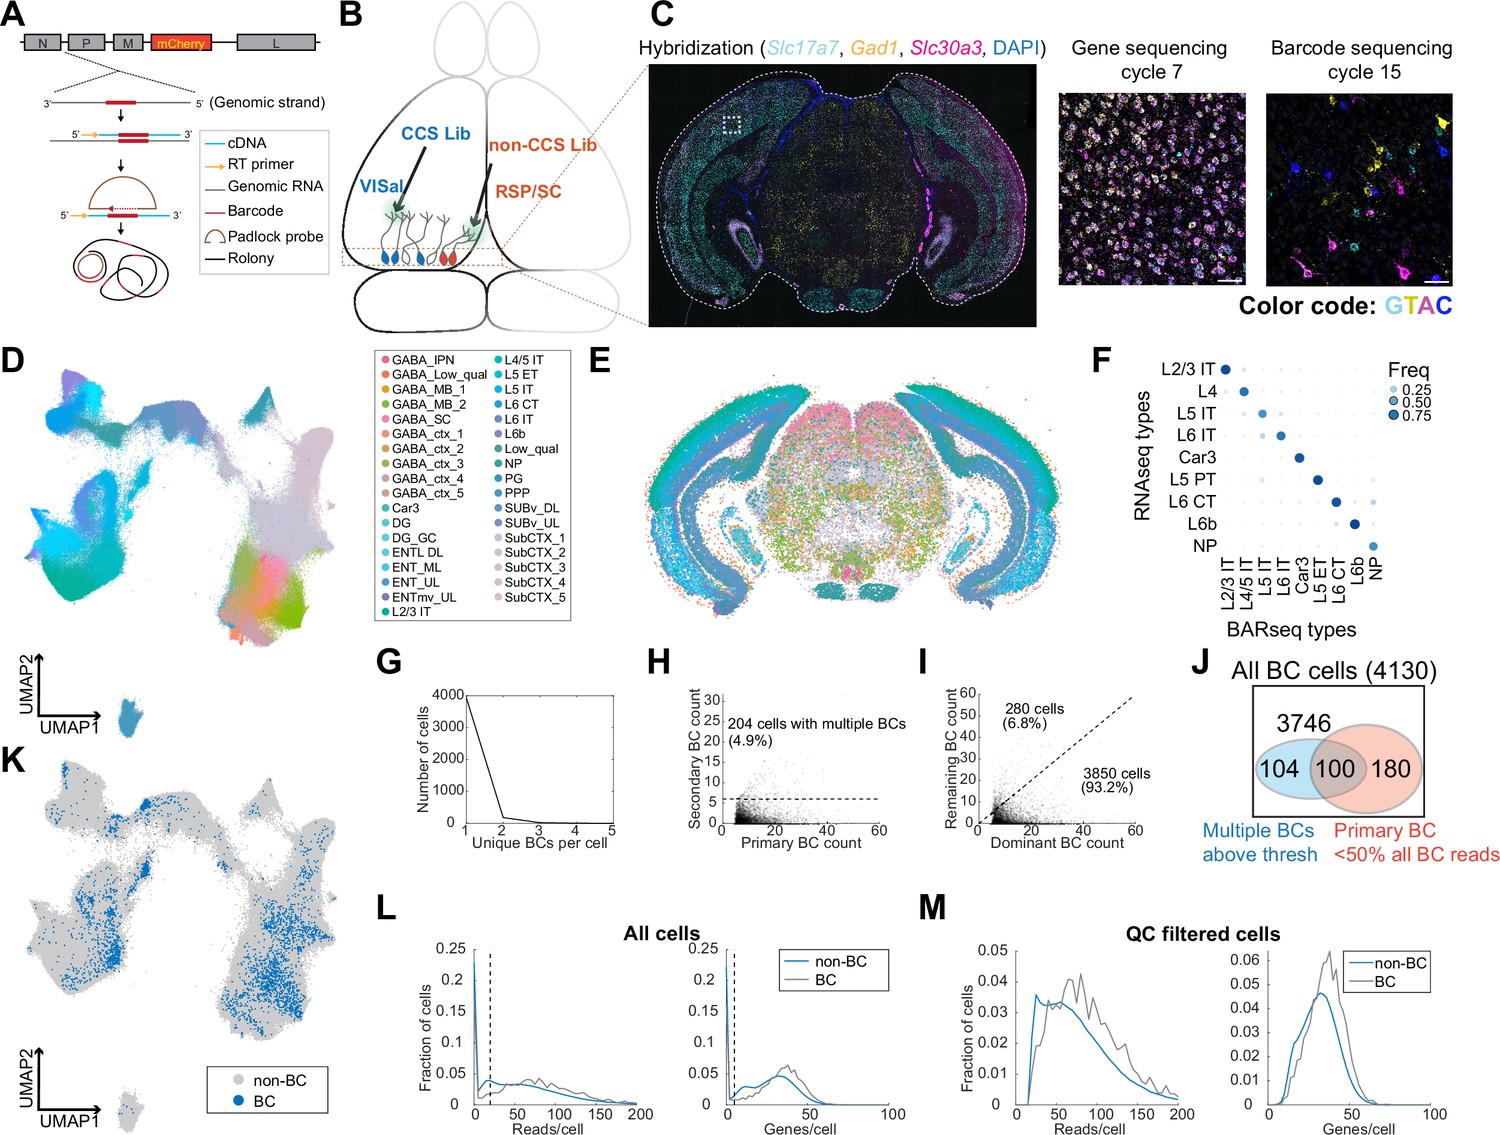
In situ sequencing identifies transcriptomic types of neurons infected with barcoded rabies virus.
(A) Illustration of probe designs and amplification approach for in situ sequencing of rabies barcodes. (B) Illustration of the experiments. The two libraries were injected in VISal and RSP/SC, and coronal sections from the boxed area were sequenced. Neurons that project to the two injection sites would be labeled with different sets of barcodes, as indicated by different colors. (C) Left, example image of a coronal section (outlined by a dashed line) during the hybridization cycle. The final sequencing cycles for genes and barcodes in the boxed area are shown on the right. The gene or nucleotide that corresponds to each color is indicated. Scale bars=50 µm. See Supplementary Tabel 3 for a list of genes interrogated. (D-E) All sequenced cells shown on a UMAP plot of their gene expression patterns (D) or on a representative coronal section (E). Colors indicate subclass-level cluster labels as shown in the legend. (F) Cluster matching between BARseq subclass-level clusters and subclasses from scRNA-seq (Tasic et al., 2018). Dot size and colors indicate the frequency that neurons from a BARseq cluster are assigned to a reference scRNA-seq cluster. (G) The number of cells (y axis) with the indicated number of barcodes per cell (x axis). (H) The count of the primary barcode (x axis) and the count of the second most abundant barcode (y axis) in each barcoded cell. Cells above the dotted line are considered as having more than one barcode per cell. (I) Counts of the most dominant barcode (x axis) and the remaining barcodes (y axis) in each cell. (J) Summary of the number of cells with more than one barcodes (blue) and/or cells in which the primary barcodes accounted for less than half of all barcode reads (red). The shapes are not drawn to scale. (K) UMAP plot as plotted in (D), color coded by whether the cells had barcodes. (L-M) Histograms showing the distribution of endogenous mRNA reads per cell and unique gene counts per cell in all cells (L) or the QC-filtered cells (M). In (L), the dotted vertical lines indicate QC thresholds. BC, Barcoded cells; VISal, anterolateral visual cortex; RSP, retrosplenial cortex; SC, superior colliculus.
Figure 4
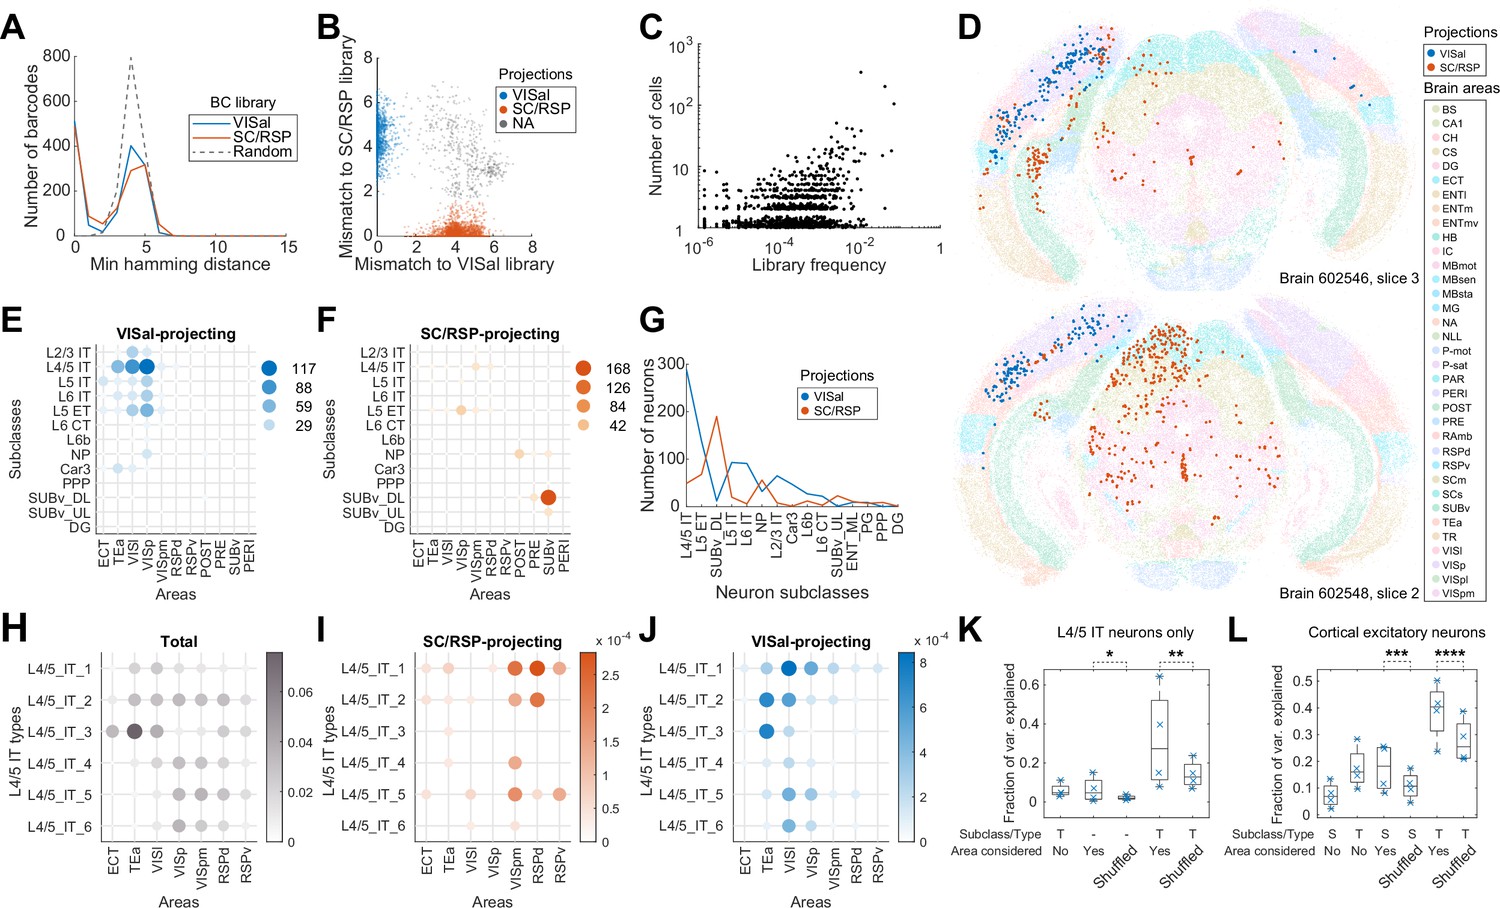
Multiplexed retrograde labeling recapitulates known cortical projections.
(A) Histograms showing the distribution of the minimum Hamming distance between each barcode and all other barcodes for barcodes in the VISal library (blue), the SC/RSP library (red), and random barcodes (dashed). (B) The distribution of mismatch between each sequenced barcode and the closest barcode in the CCS library (y axis) or in the non-CCS library (x axis). Colors indicate which library each barcode was mapped to. Gray cells did not match to either library, likely because the libraries were not sequenced to completion. (C) The frequencies of barcodes in the libraries (x axis) are plotted against the number of sequenced cells carrying those barcodes (y axis). Jitter is added on the y-axis to help visualize overlapping dots. (D) Two representative slices, one from each brain showing all sequenced cells on each slice. Barcoded cells are color-coded by projections and non-barcoded cells are color-coded by brain regions. (E-F) The number of neurons from each cortical area and each subclass that projected to either VISal (E) or SC/RSP (F). Dot size and colors indicate the number of cells. (G) The distribution of the number of projecting cells (y axis) for each subclass (x axis). (H)-(J) The fractions of the indicated L4/5 IT types in each cortical area (H) and the fraction of those that project to SC/RSP (I) or VISal (J). (K-L) Fractions of variance in the probability of projections explained by combinations of the compositional profiles of cell types (S: subclass, T: type, -: cell type was not used) with or without considering cortical areas (Area considered) for L4/5 IT neurons (K) or for all excitatory neurons (L). Boxes indicate median and quartiles, and whiskers indicate range of data. Each point (N = 4) indicate data from different slides, each containing two slices. *p=6 × 10–70, **p=6 × 10–58, ***p=7 × 10–78, ****p=6 × 10–37 comparing the means to 100 iterations of shuffled controls using two-tailed t-tests.
Figure 5 with 3 supplements
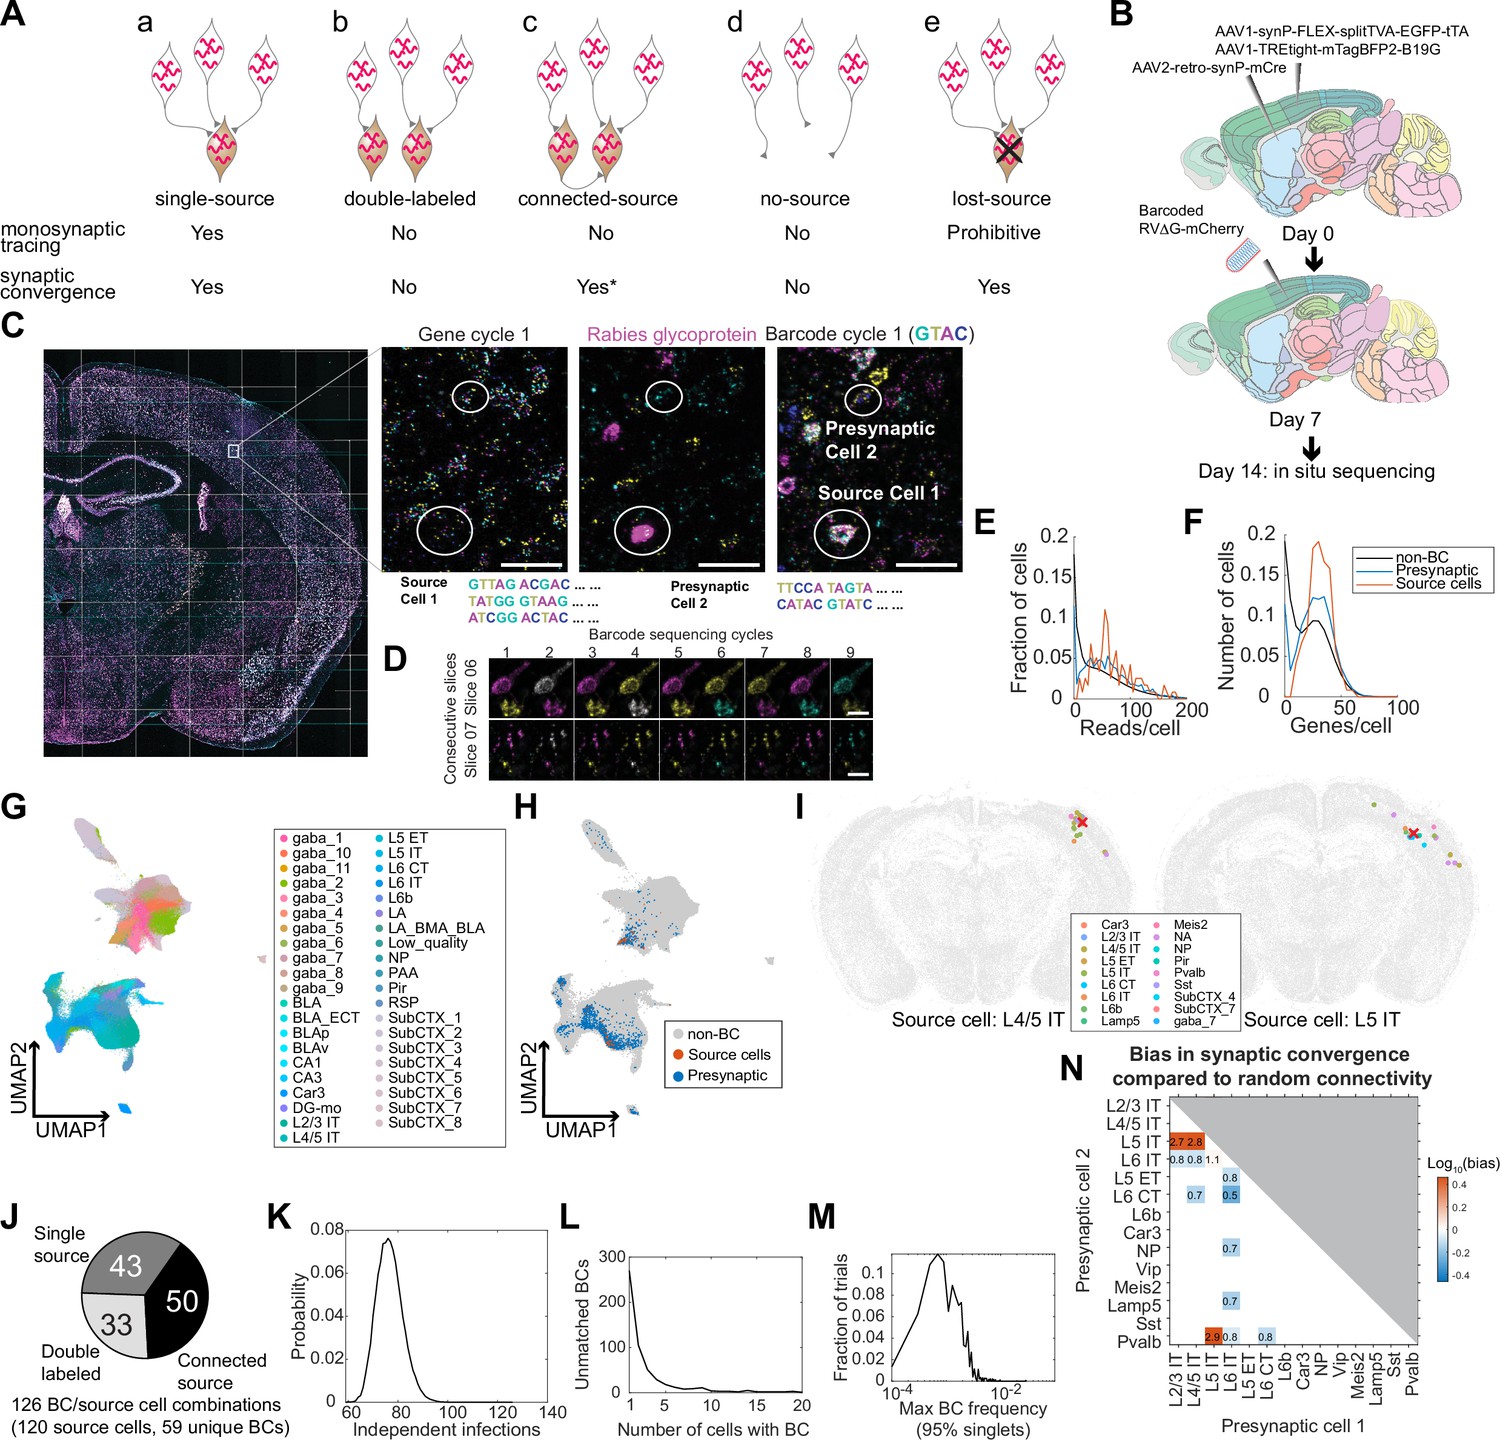
Multiplexed transsynaptic labeling by sequencing rabies barcodes in situ.
(A) Five possible types of barcode-sharing networks in a barcoded transsynaptic tracing experiment using rabies virus. Whether each network is compatible with monosynaptic tracing and/or mapping synaptic convergence is indicated below. *see text for considerations regarding connected-source networks. (B) Summary of the transsynaptic labeling experiment using barcoded rabies virus and in situ sequencing. (C) The image of a representative coronal section during sequencing. Images of the first gene sequencing cycle, the hybridization cycle, and the first barcode sequencing cycle of the boxed area are shown on the right. Scale bars=50 µm. (D) First nine barcode sequencing images of example neurons that were bisected onto two adjacent sections. Scale bars = 10 µm. (E-F) The distribution of endogenous mRNA reads per cell (E) and unique gene counts per cell (F) in non-barcoded cells (gray), barcoded cells (blue), and source cells (red). Dashed lines indicate quality control thresholds for gene expression. (G-H) UMAP plots of the gene expression patterns of all barcoded cells color-coded by the cluster label at the subclass level (G) or by whether the cell is a potential source cell or presynaptic cell (H). (I) Locations and cell types of two source cells (red cross) and presynaptic cells (dots) that shared the same barcodes. Colors of dots indicate transcriptomic types of presynaptic neurons. Transcriptomic types of source cells are indicated below each plot. All other cells from the coronal sections that the source cells were on were plotted in gray. (J) Estimated numbers of barcode/source cell combinations that belonged to each of the three networks with source cells. (K) The probability (y axis) of the number of independent infection events (x axis) to generate the same number of barcodes found in the source cells in the experiment. (L) Histogram showing the number of cells that shared each barcode that was not found in a source cell. (M) Histogram showing the distribution of the maximum barcode frequency in the virus library that ensures single infection for 95% of barcodes across 10,000 simulations. (N) The ratios between the observed number of converging outputs and the expected number from random connectivity between cortical subclasses of neurons. Colors correspond to log10 of ratios, and the ratios are indicated in the plot. Only values with false positive rate (FPR) < 0.05 are shown (see Materials and methods M14). As seen from the blue squares associated with L6 IT cells, these neurons were less likely to synapse onto the same post-synaptic neurons with other neuronal types (in particular L6 CT neurons, with only 50% of converging connections compared to those expected from random connectivity).
Figure 5—figure supplement 1
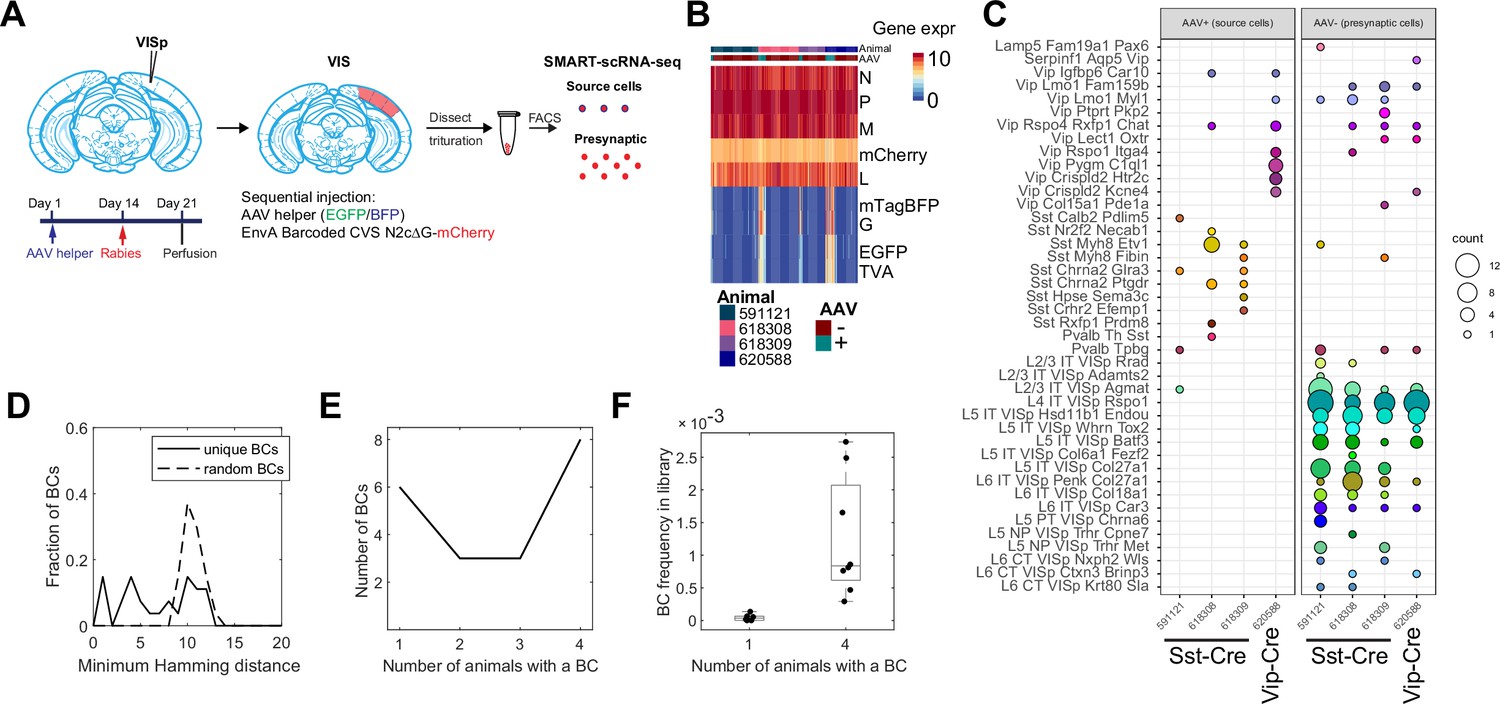
scRNA-seq is insufficient to resolve connectivity among transsynaptically labeled neurons using barcoded rabies virus.
(A) Outline of the trans-synaptic labeling experiment using scRNA-seq. In Cre-expressing animals, we sequentially injected AV helpers (day 1) and barcoded rabies virus (day 14), then dissected VISp on day 21, FACS-enriched mCherry and/or mTagBFP expressing cells, then performed scRNA-seq. (B) The expression of rabies encoded genes (top) and AAV-encoded genes (bottom) in sequenced cells. Columns indicate cells and rows indicate genes. Colors indicate the natural log of counts scaled by the sum of all viral reads multiplied by 10,000. The bars on the top indicate whether a cell is considered to have AAV or not and the donor animal. (C) The number of source cells (left) and presynaptic cells (right) of each cell type (rows) from each animal (columns). Colors indicate cluster identity and dot size indicates the number of cells. (D) Histogram showing the distribution of the minimum Hamming distance between each barcode and all other barcodes in the pool of sequenced barcodes (solid line) or random barcodes (dashed line). (E) Histogram showing the distribution of barcodes (y axis) that found in cells across the indicated number of animals (x axis). (F) Box plots showing the library frequency of barcodes found in one or four animals. All barcodes are indicated by dots. The boxes show medians and quartiles, and the whiskers indicate range. BC, Barcode; VISp, primary visual cortex.
Figure 5—figure supplement 2
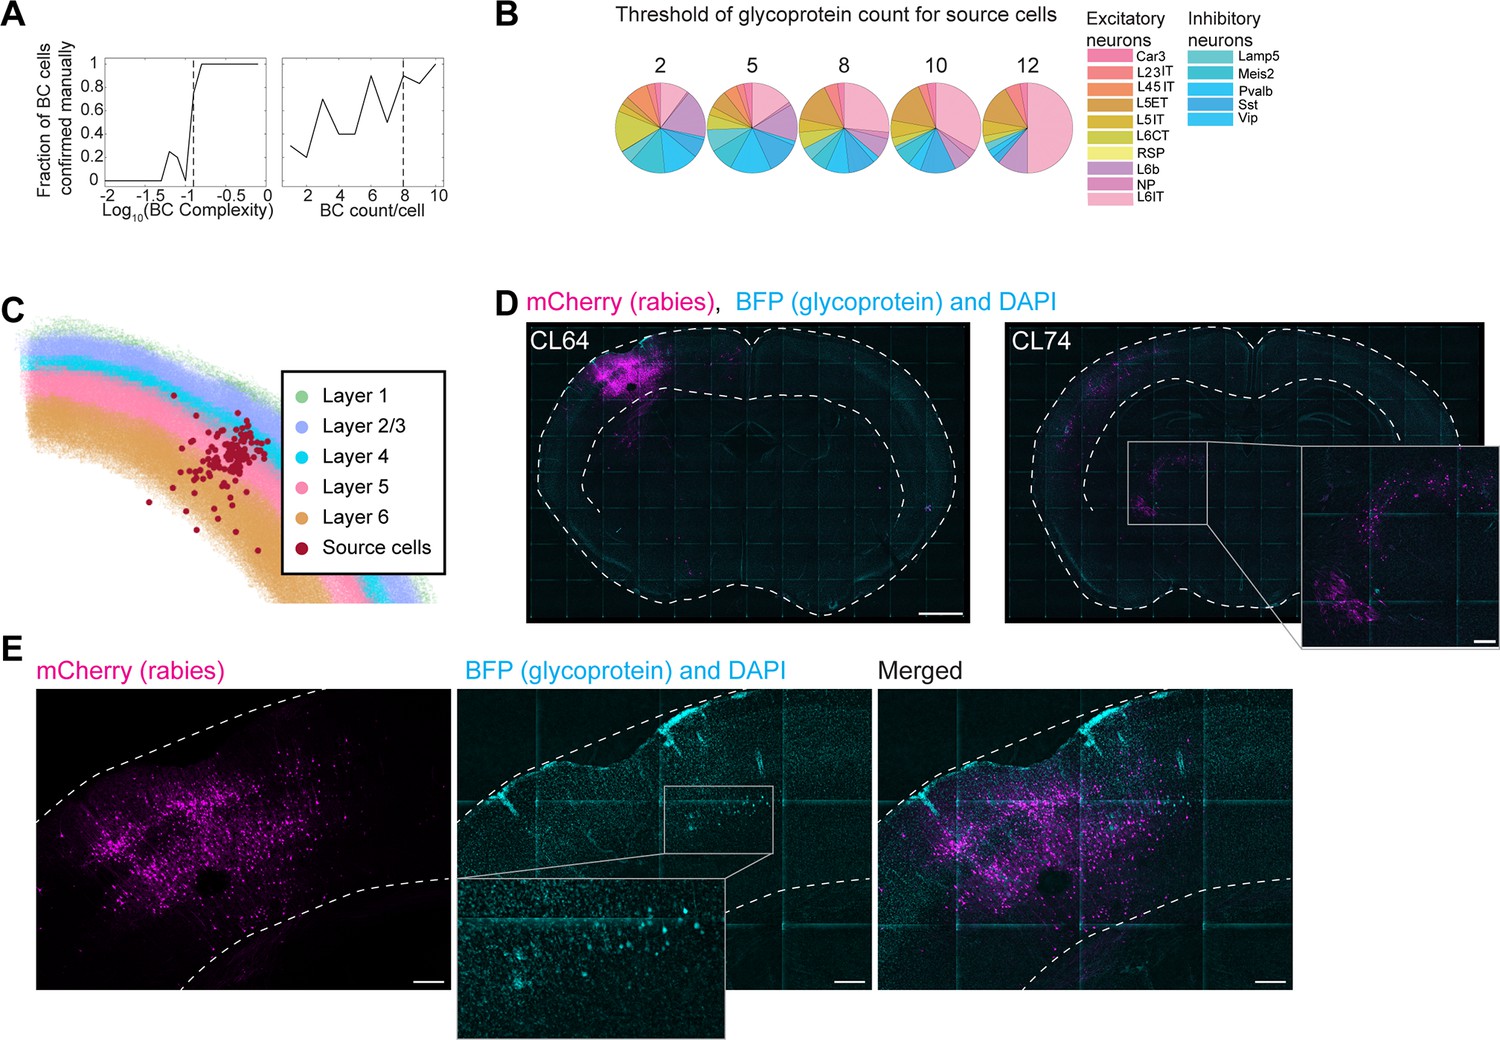
Barcoded transsynaptic labeling resolved by in situ sequencing.
(A) For barcoded cells with the indicated barcode complexity (x axis, left) or barcode counts per cell (x axis, right), two proofreaders manually determined whether each cell is a real barcoded cell based on sequencing images. The fraction of manually curated barcoded cells (y axis) are shown. Dashed lines indicate quality control thresholds for barcodes, which was determined based on these proofreading results. (B) The number of cells of each type with at least the indicated number of reads on the rabies glycoprotein. (C) Locations of source cells (red dots) relative to cortical layers, which are color coded as indicated. (D) Images of example slices showing mCherry expression from the rabies genome (magenta), BFP co-expressed with the glycoprotein (cyan), and DAPI (also cyan). Dashed lines indicate the locations of the cortex. The approximate coronal levels are indicated on each slice. Inset shows an amplified view of the boxed area in the thalamus. Scale bars=1 mm on the left, and 200 µm in the inset on the right. (E) Amplified views of the injection site area of the slice shown in (D). Note that cyan images show both DAPI and BFP, but BFP-expressing cells can be distinguished from DAPI staining by the shape of the cell bodies. Scale bars = 200 µm.
Figure 5—figure supplement 3
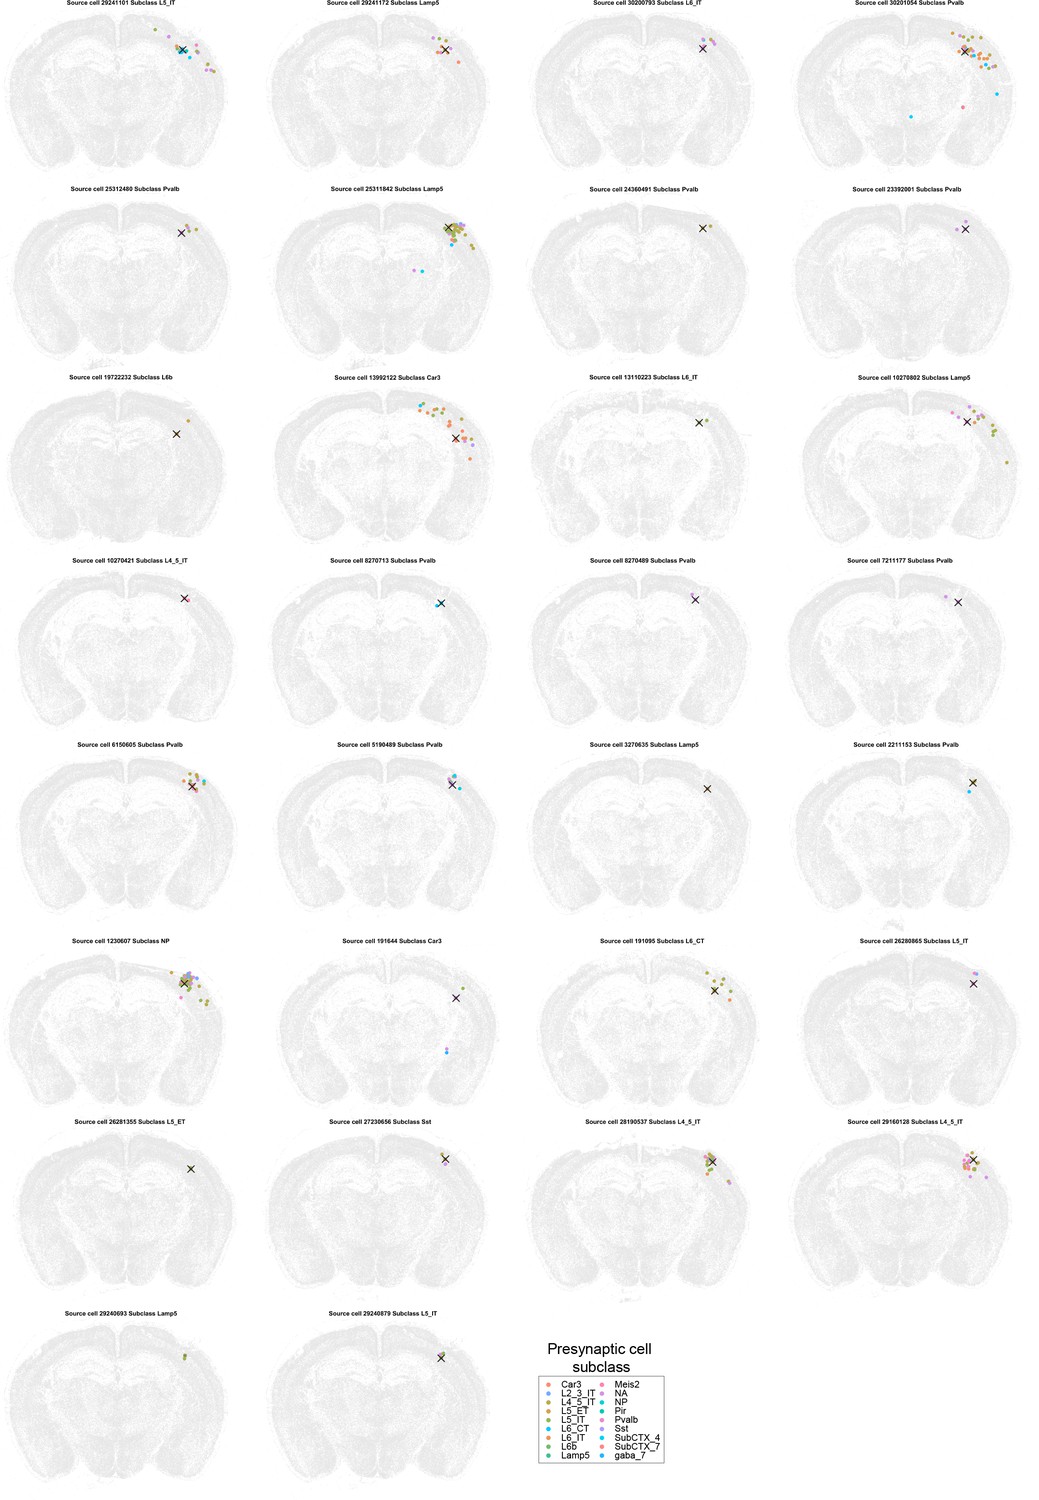
Presynaptic cells and source cells in all single-source networks.
In each plot, a source cell (red cross) and presynaptic cells (dots) that shared the same barcodes were plotted. Colors of dots indicate transcriptomic types of presynaptic neurons. Transcriptomic types of source cells are indicated below each plot. All other cells from the coronal sections that the source cells were on were plotted in gray.
Tables
Table 1
Number of cells in the scRNA-seq-based transsynaptic tracing and retrograde tracing experiments.
| Animal ID | N cells | After QC (total reads, genes detected, and GC content) | Mapping confidence > 0.7 | Mapping correlation > 0.6 | |
|---|---|---|---|---|---|
| Transsynaptic tracing | 591121 | 94 | 80 | 77 | 75 |
| 618308 | 80 | 71 | 69 | 64 | |
| 618309 | 60 | 46 | 45 | 42 | |
| 620588 | 61 | 55 | 53 | 51 | |
| Retrograde tracing | 591123 | 48 | 34 | 30 | 21 |
| 620569 | 48 | 41 | 40 | 33 | |
| Total | 443 | 371 | 354 | 295 |
Table 2
The numbers of barcoded cells that belonged to each type of network in the in situ sequencing-based trans-synaptic tracing experiment.
| Total | Single-source | Double-labeled | Connected-source | No-source | Lost-source | |
|---|---|---|---|---|---|---|
| Source cells and barcodes | 120 cells, 59 barcodes, 126 cell-barcode pairs | 42 cells, 43 barcodes, 43 cell-barcode pairs | Est. 33 cell-barcode pairs | Est. 50 cell-barcode pairs | 0 | 0 |
| presynaptic cells | 2590 cells (=381 + 979–6+677 + 566–7) | 381 cells | 979 cells (6 cells also contained a single-source barcode) | 677 cells (7 cells also had a lost-source barcode) | 566 cells (7 cells also had a no-source barcode) | |
| Barcodes in presynaptic cells | 535 barcodes (=31 + 16+427 + 61) | 31 barcodes | 16 barcodes | 427 | 61 | |
| Filtered out cells | 204 cells (with one G transcript and/or low-quality source cells) | NA | NA | NA | NA | NA |
Key resources table
| Reagent type (species) or resource | Designation | Source or reference | Identifiers | Additional information |
|---|---|---|---|---|
| Strain, strain background (Mus musculus) | C57BL/6 J (See Supplementary file 1 for details) | Jackson Laboratory | 000664 | |
| Recombinant DNA reagent | pRVdG-4mCherry (plasmid) | Weible et al., 2010 | Addgene_52488 | |
| Recombinant DNA reagent | RabV CVS-N2c(deltaG)-mCherry (plasmid) | Reardon et al., 2016 | Addgene_73464 | |
| Recombinant DNA reagent | pCAG-B19N (plasmid) | Chatterjee et al., 2018 | Addgene_59924 | |
| Recombinant DNA reagent | pCAG-B19P (plasmid) | Chatterjee et al., 2018 | Addgene_59925 | |
| Recombinant DNA reagent | pCAG-B19G (plasmid) | Chatterjee et al., 2018 | Addgene_59921 | |
| Recombinant DNA reagent | pCAG-B19L (plasmid) | Chatterjee et al., 2018 | Addgene_59922 | |
| Recombinant DNA reagent | pCAG-T7pol (plasmid) | Chatterjee et al., 2018 | Addgene_59926 | |
| Recombinant DNA reagent | pCAG-N2cN (plasmid) | This paper | Addgene_100801 | Used in rabies virus rescue (see Materials and methods M5) |
| Recombinant DNA reagent | pCAG N2cP (plasmid) | This paper | Addgene_100808 | Used in rabies virus rescue (see Materials and methods M5) |
| Recombinant DNA reagent | pCAG-N2cG (plasmid) | This paper | Addgene_100811 | Used in rabies virus rescue (see Materials and methods M5) |
| Recombinant DNA reagent | pCAG-N2cL (plasmid) | This paper | Addgene_100812 | Used in rabies virus rescue (see Materials and methods M5) |
| Sequence-based reagent | See Supplementary file 3 for details | Integrated DNA Technologies | NA | |
| Commercial assay or kit | MiSeq Reagent Nano Kit v2 (300-cycles) | Illumina | MS-103–1001 | |
| Commercial assay or kit | RevertAid Reverse Transcriptase | Thermo Fisher | EP0442 | |
| Commercial assay or kit | RiboLock RNase Inhibitor | Thermo Fisher | EO0384 | |
| Commercial assay or kit | Phusion High-Fidelity DNA Polymerase | Thermo Fisher | F530L | |
| Commercial assay or kit | Ampligase Thermostable DNA Ligase | Biosearch Technologies | A0110K | |
| Commercial assay or kit | RNase H | Qiagen | Y9220L | |
| Commercial assay or kit | Phi29 dna polymerase | Thermo Fisher | EP0094 | |
| Chemical compound, drug | Iodoacetamide, No-Weigh | Thermo Fisher | A39271 | |
| Chemical compound, drug | Bis-PEG9-NHS ester | BroadPharm | BP-21504 | |
| Software, algorithm | MATLAB | Mathworks | RRID: SCR_001622 | |
| Software, algorithm | R | R Project for Statistical Computing | RRID: SCR_001905 | |
| Software, algorithm | Custom scripts for data analysis/processing | This paper | See M15. Data and Code availability for links | |
| Other | AAV2-retro-syn-mCre (virus) | Jin et al., 2023b | Addgene_178515 (genome plasmid) | Helper virus for barcoded rabies virus (see Figure 5B) |
| Other | AAV1-syn-FLEX-splitTVA-EGFP-tTA (virus) | Liu et al., 2017 | Addgene_100798 (genome plasmid) | Helper virus for barcoded rabies virus (see Figure 5B) |
| Other | AAV1-TREtight-mTagBFP2-B19G (virus) | Liu et al., 2017 | Addgene_100799 (genome plasmid) | Helper virus for barcoded rabies virus (see Figure 5B) |
| Other | AAV1-TREtight-mTagBFP2-N2cG (virus) | This paper | Addgene_192838 (genome plasmid) | Helper virus for CVS-N2c strain of rabies virus (see Figure 5—figure supplement 1) |
| Other | N2c∆G-4mCherry_CCS2_20nt_HM(EnvA) (virus) | This paper | Barcoded rabies virus library used for monosynaptic tracing with scRNA-seq (see Materials and methods M5) | |
| Other | RV∆G-4mCherry_CCS2_20nt_HM(EnvA) (virus) | This paper | Barcoded rabies virus library used for monosynaptic tracing with BARseq (see Materials and methods M5) | |
| Other | RV∆G-4mCherry_CCS2_20nt_HM(B19G) (virus) | This paper | Barcoded rabies virus library used for retrograde labeling (see Materials and methods M5) | |
| Other | RV∆G-4mCherry_20-mer barcode(B19G) (virus) | This paper | Barcoded rabies virus library used for retrograde labeling (see Materials and methods M5) |
Table 3
List of filters and lasers used for in situ sequencing.
| Filters | ||
|---|---|---|
| Main dichroic | Filter names | |
| D1 | FF421/491/567/659/776-Di01 (Semrock) | |
| D2 | ZT405/514/635rpc | |
| D3 | FF421/491/572-Di01−25x36(Semrock) | |
| Emission filters | ||
| E1 | FF01-441/511/593/684/817(Semrock) | |
| E2 | FF01-565/24(Semrock) | |
| E4 | FF01-676/29(Semrock) | |
| E5 | FF01-775/140(Semrock) | |
| E7 | 69,401 m | |
| E8 | ZET532/640 m | |
| Imaging settings | ||
| Sequencing cycles | ||
| Channel | Filter combinations | laser |
| G | D2/E2 | 520 |
| T | D1/E1 | 546 |
| A | D2/E4 | 638 |
| C | D2/E5 | 638 |
| DIC | D2/E5 | DIA |
| Hybridization cycle | ||
| GFP | D3/E7 | 477 |
| YFP | D2/E2 | 520 |
| TxRed | D3/E7 | 546 |
| Cy5 | D2/E8 | 638 |
| DAPI | D1/E7 | 405 |
| DIC | D3/E7 | DIA |
Additional files
-
Supplementary file 1
Metadata of animals used in this study.
- https://cdn.elifesciences.org/articles/87866/elife-87866-supp1-v2.xlsx
-
Supplementary file 2
Viruses used in this study.
- https://cdn.elifesciences.org/articles/87866/elife-87866-supp2-v2.xlsx
-
Supplementary file 3
Gene panel and list of oligos used.
- https://cdn.elifesciences.org/articles/87866/elife-87866-supp3-v2.xlsx
-
MDAR checklist
- https://cdn.elifesciences.org/articles/87866/elife-87866-mdarchecklist1-v2.pdf
Download links
A two-part list of links to download the article, or parts of the article, in various formats.
Downloads (link to download the article as PDF)
Open citations (links to open the citations from this article in various online reference manager services)
Cite this article (links to download the citations from this article in formats compatible with various reference manager tools)
Rabies virus-based barcoded neuroanatomy resolved by single-cell RNA and in situ sequencing
eLife 12:RP87866.
https://doi.org/10.7554/eLife.87866.3


