Drosophila model to clarify the pathological significance of OPA1 in autosomal dominant optic atrophy
- Brain Research Institute, Niigata University, Japan
- School of Life Science and Technology, Tokyo Institute of Technology, Japan
- Research Initiatives and Promotion Organization, Yokohama National University, Japan
- Department of Biological Sciences, Graduate School of Science, Tokyo Metropolitan University, Japan
- Department of Gene Function and Phenomics, National Institute of Genetics, Japan
- Division of Ophthalmology and Visual Science, Graduate School of Medical and Dental Sciences, Niigata University, Japan
Figures
Figure 1 with 1 supplement
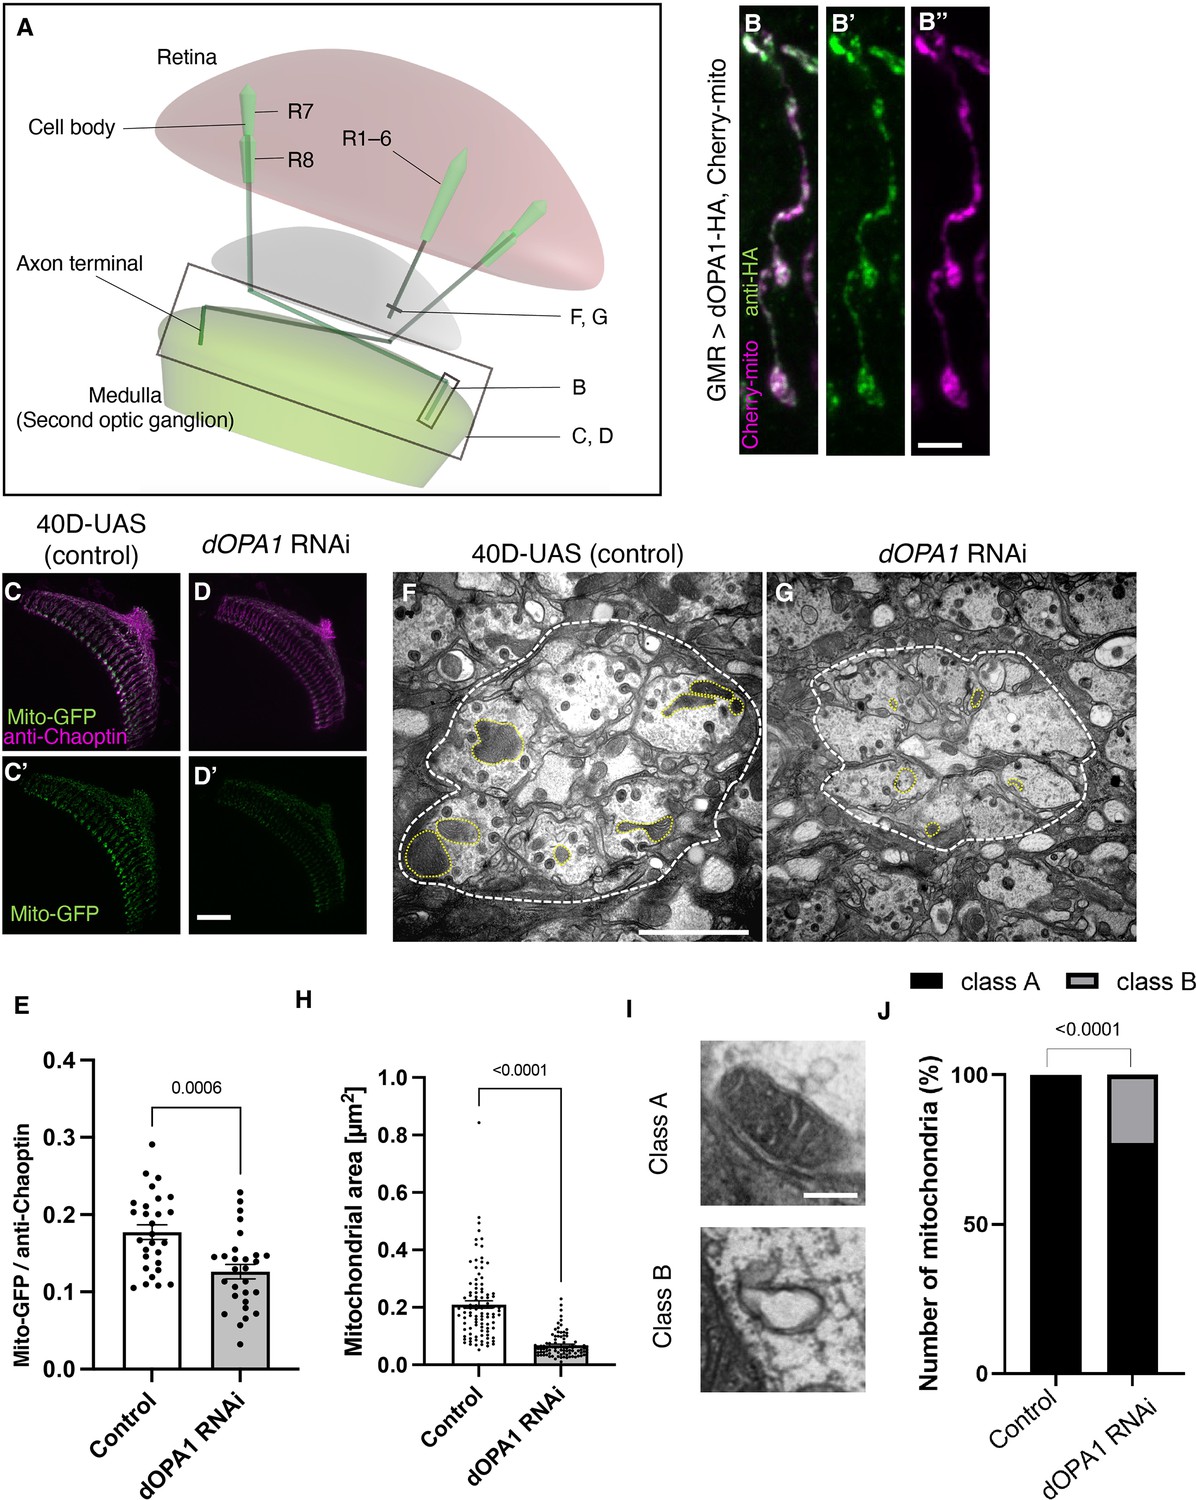
Effect of dOPA1 knockdown on mitochondrial density and size in retinal axons.
(A) Schematic illustration of the Drosophila visual system from a dorsal view, highlighting the arrangement of photoreceptor neurons. The rectangular area indicated in (B) represents a single R7/8 photoreceptor axon, as illustrated in the figure for (B). The rectangular areas highlighted in (C) and (D) encompass the entirety of R7/8 photoreceptor axons, as shown in the figures for (C) and (D). The lines marked in (F) and (G) denote cross-sections of R1–6 photoreceptor axons, as depicted in the figures for (F) and (G). (B) Visualization of mitochondria and dOPA1 in a set of R7/8 axons. Mitochondria were visualized using the expression of mCherry-mito driven by GMR-Gal4 (magenta) while HA-tagged dOPA1 was immunostained using the anti-HA antibody (green). Scale bar: 3 µm. (C, D) Representations of mitochondria visualized using the expression of Mito-GFP driven by GMR-Gal4 (green), 1 day after eclosion. Retinal axons were labeled using the anti-Chaoptin antibody (magenta). Scale bar: 30 µm. (E) Quantification of Mito-GFP intensity. Mito-GFP levels were calculated by dividing the Mito-GFP fluorescence intensity by the anti-Chaoptin signal intensity. Control (n=28 optic lobes) and dOPA1 RNAi (n=28 optic lobes). The data are presented as mean ± SEM. (F, G) Electron micrographs of cross-sections of the R1–6 retinal axons in the lamina of the Control (F) and dOPA1 knockdown (G) on the day of eclosion. Yellow circles and white dotted lines indicate mitochondria and a lamina column, respectively. Scale bar: 2 µm. (H) Quantification of the mitochondrial area. Control (n=96 mitochondria) and dOPA1 RNAi (n=92 mitochondria). Data are expressed as mean ± SEM. (I) Representative EM images showing mitochondria with a densely packed matrix structure (classified as Class A) and collapsed mitochondria (classified as Class B). Scale bar: 500 nm. (J) Quantification of the mitochondria classified into Class A and Class B. Control (n=96 mitochondria) and dOPA1 RNAi (n=92 mitochondria). See the Supplementary file 1 for the genotypes of the Drosophila used in the experiments.
Figure 1—figure supplement 1
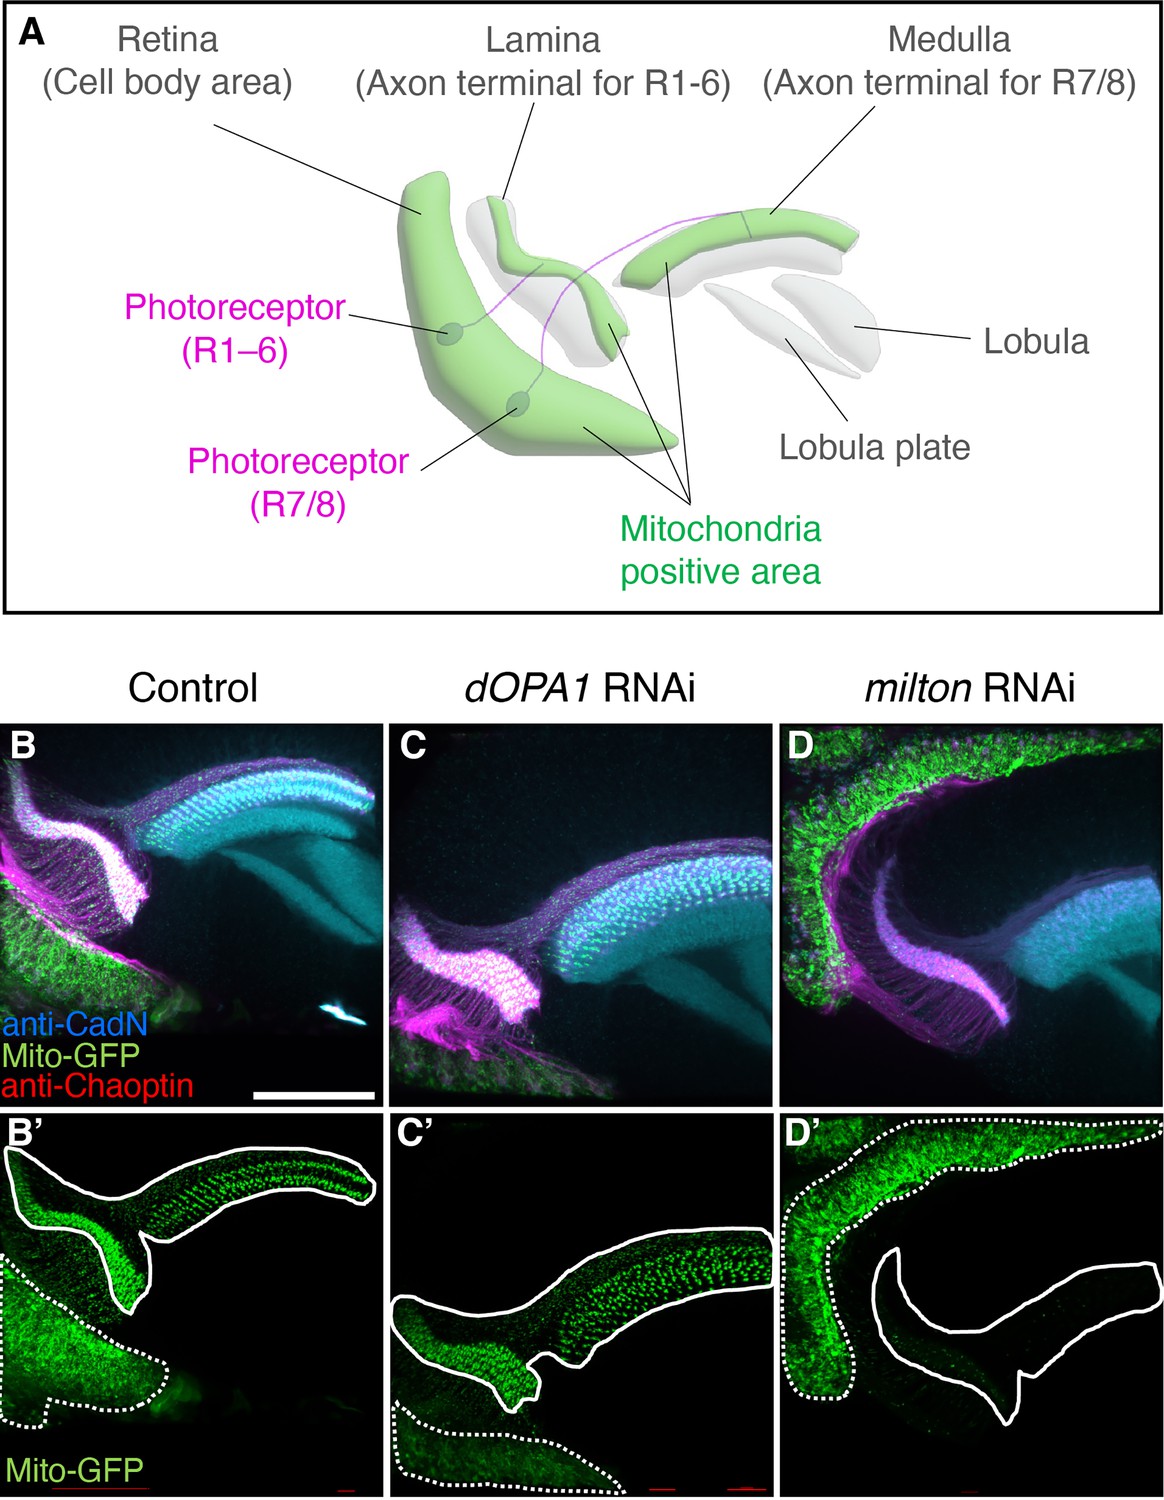
Analysis of trafficking defects in axons of dOPA1 knockdown flies.
Schematic illustration of the Drosophila visual system around 24 hr after puparium formation. The cell bodies of photoreceptors (magenta) are found in the retina; type 1–6 photoreceptors project their axons to the lamina of the primary optic ganglion. The axons of type 7/8 photoreceptors project into the medulla of the secondary optic ganglion. Mitochondria are abundantly located in their cell bodies and axon terminals (green). Higher-order visual centers include the lobula and lobula plate. (B–D) Neuropil and photoreceptor cells were labeled using an anti-CadN antibody (cyan) and anti-Chaoptin antibody (magenta), respectively. Mitochondria were visualized using the expression of Mito-GFP driven by GMR-Gal4 (green). (B, B') and (C, C') show whole photoreceptors in the RNAi Control and dOPA1 knockdown, respectively. The regions indicated by dashed and solid lines in (B', C', D') indicate the cell body and axonal areas, respectively. (D, D') shows whole photoreceptors in milton knockdown. Scale bar: 50 µm. See the Supplementary file 1 for the genotypes of the Drosophila used in the experiments.
Figure 2
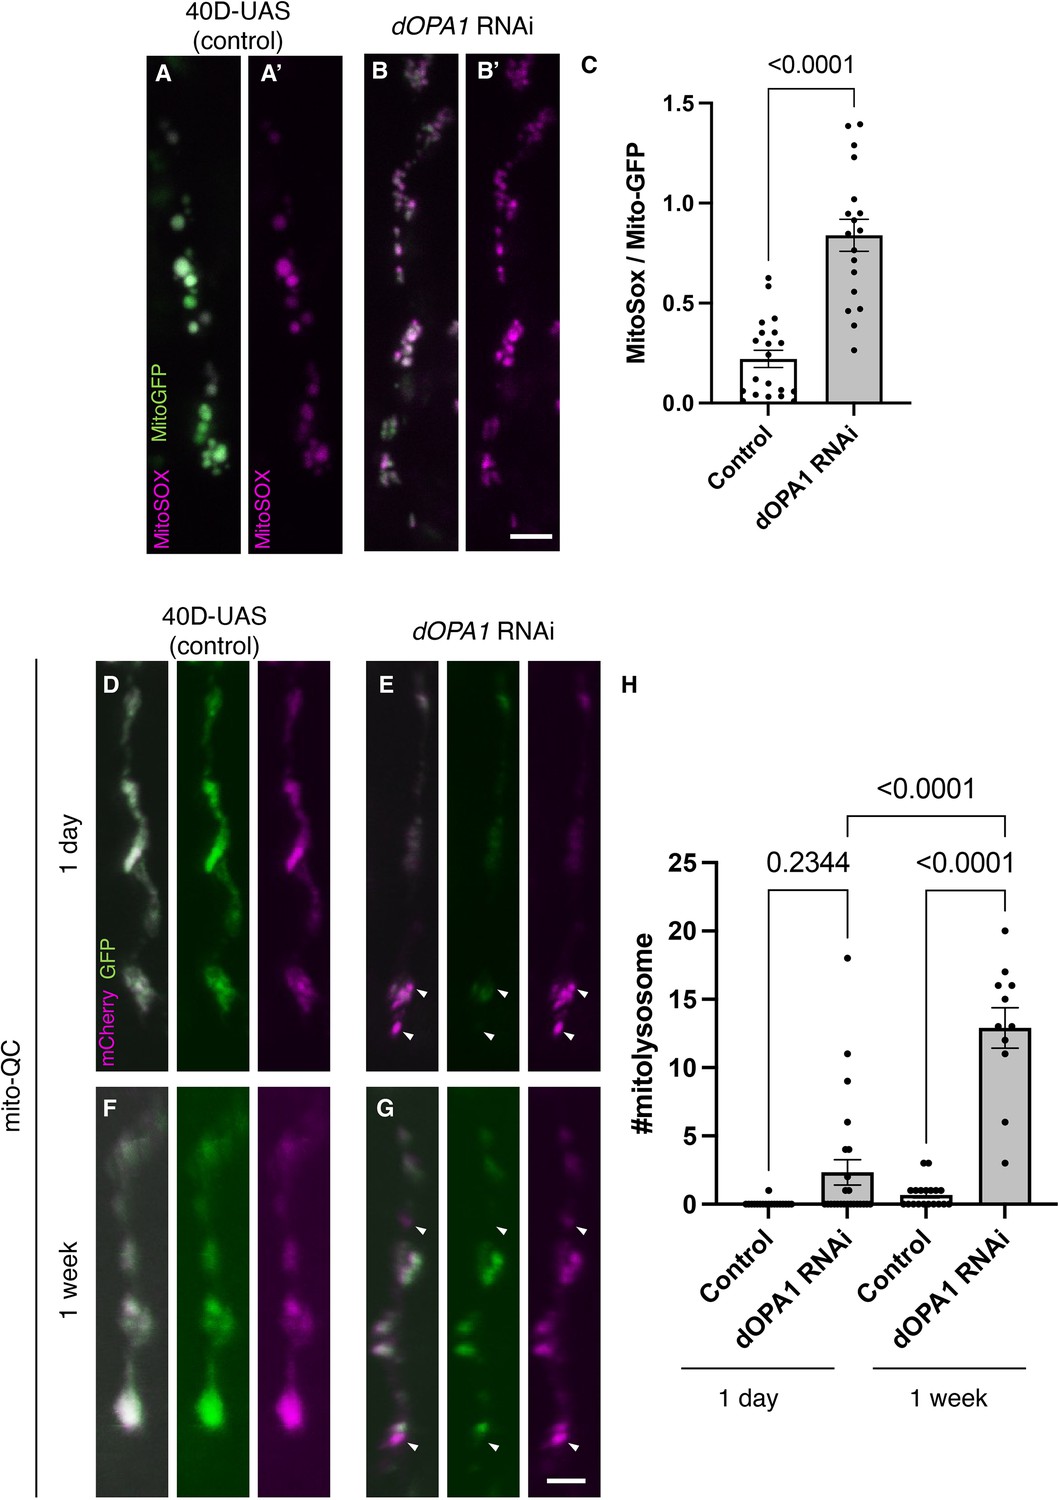
Elevated reactive oxygen species (ROS) and mitophagy activity levels in the dOPA1 knockdown.
(A, B) Mitochondrial ROS levels in a set of the R7/8 retinal axon visualized using Mito-GFP (green) driven by GMR-Gal4 and MitoSOX (magenta) to specifically detect superoxide, an indicator of oxidative stress. Representative images of a retinal axon in the Control (A, A') and dOPA1 knockdown (B, B'). (C) Quantification of ROS levels for each genotype. ROS levels were determined by dividing the fluorescence intensity of MitoSOX by that of Mito-GFP, highlighting the significant increase in ROS levels in dOPA1 knockdown flies compared to controls, suggesting enhanced mitochondrial stress and dysfunction upon dOPA1 depletion. Control (n=20 optic lobes) and dOPA1 RNAi (n=18 optic lobes). Scale bar: 3 µm. Data are presented as mean ± SEM. (D, E) Mitophagy activity in a set of the R7/8 retinal axon visualized by a genetic marker, mitoQC, driven by GMR-Gal4. Representative images of a retinal axon in the Control 1 day after eclosion (D), dOPA1 knockdown 1 day after eclosion (E), the Control 1 week after eclosion (F), dOPA1 knockdown 1 week after eclosion (G). The arrowheads indicate a mitolysosome that is positive for mCherry and negative for GFP. (H) Quantification of the mitophagy activity each genotype. The number of the mitolysosomes were counted in each genotype. The significant increase in the number of the mitolysosomes in dOPA1 knockdown flies compared to controls after 1 week, suggesting enhanced mitophagy upon dOPA1 depletion. Control 1d (n=18 optic lobes), Control 1 week (n=19 optic lobe), dOPA1 RNAi 1d (n=24 optic lobes), and dOPA1 RNAi 1 week (n=11 optic lobes). Scale bar: 3 µm. Data are presented as mean ± SEM. See the Supplementary file 1 for the genotypes of the Drosophila used in the experiments.
Figure 3 with 2 supplements
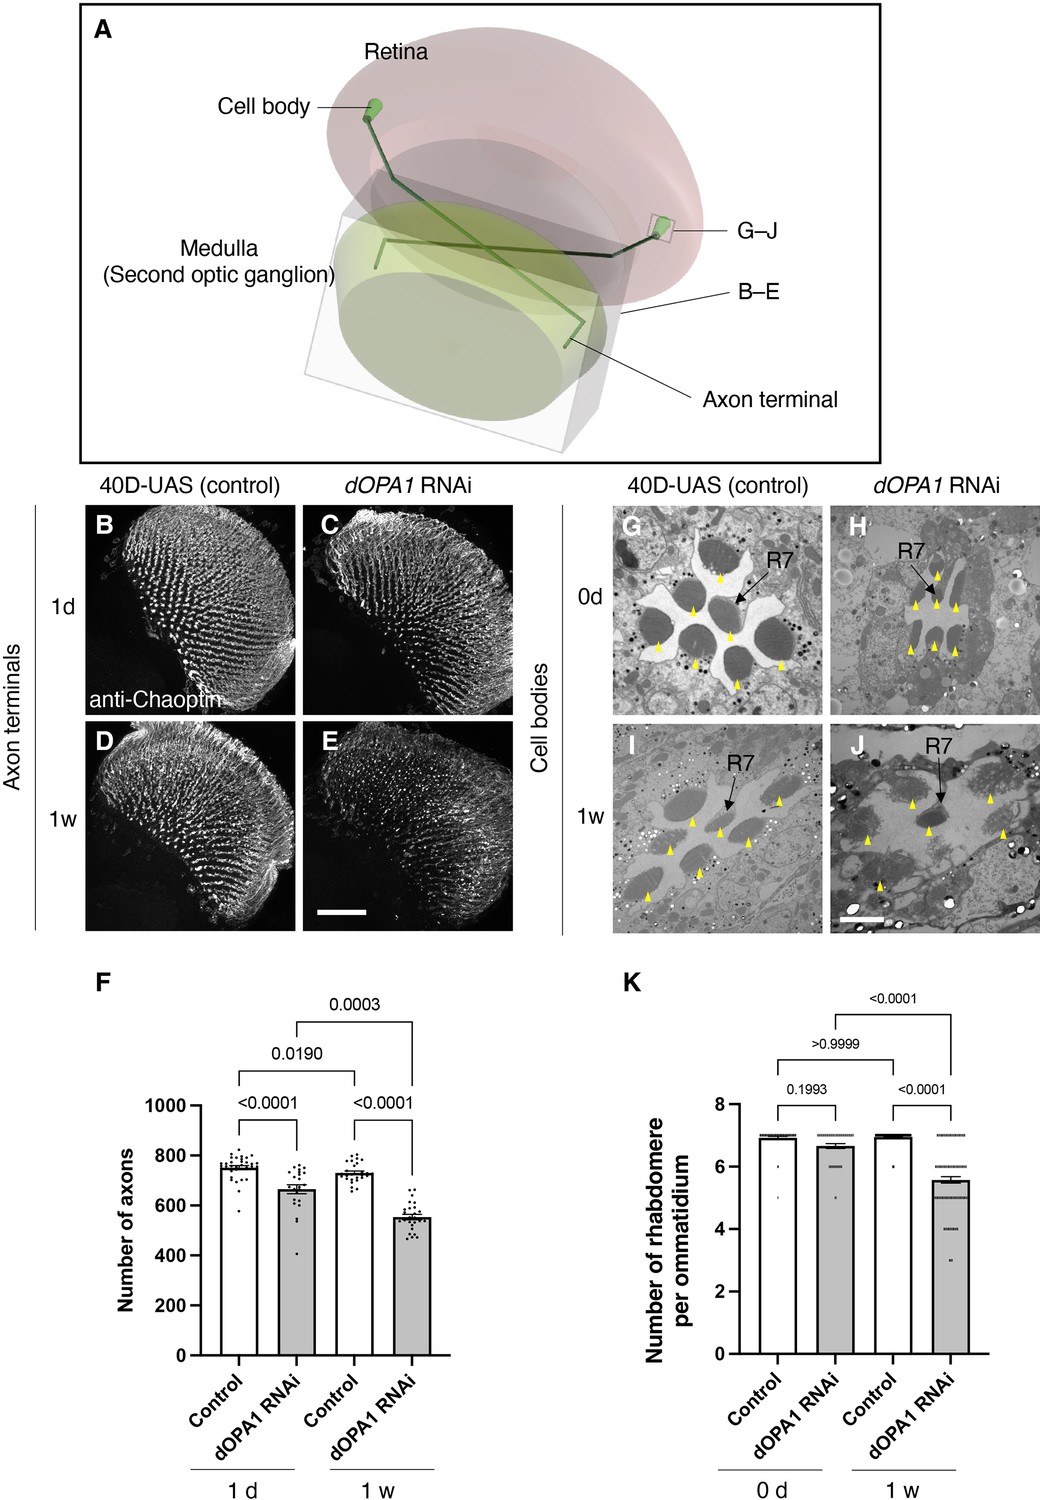
Effect of dOPA1 knockdown on photoreceptor neurodegeneration in Drosophila.
Schematic of the visual system in Drosophila. A set of R7/8 photoreceptors project their axons to the second optic ganglion medulla. The rectangular prism indicated in B–E represents the area of the whole medulla, as shown in the figure for (B–E). The square marked in G–J denote cross-sections of the cell bodies of the photoreceptors, as depicted in the figures for (G–J). (B–E) All R7 and R8 axon terminals project to the medulla. dOPA1 in the photoreceptor was knocked down by GMR-Gal4. 40D-UAS was used as a Control to match the number of UAS sequences recognized by Gal4. One day after eclosion in Control (B) and dOPA1 knockdown (C), and 1 week after in Control (D) and dOPA1 knockdown (E). The retinal axons were stained with anti-Chaoptin, a photoreceptor-specific antibody. Scale bar = 50 μm. (F) Number of axons at each time point in R7 neurons for each situation quantified by MeDUsA (method for the quantification of degeneration using fly axons). At 1 day of Control (n=34 optic lobes) and dOPA1 RNAi (n=23 optic lobes), and at 1 week of Control (n=28 optic lobes) and dOPA1 RNAi (n=26 optic lobes). Data are expressed as mean ± SEM. (G–J) Electron micrographs of cross-sections of the photoreceptor cell bodies in the ommatidia of the retina. Rhabdomeres are shown as yellow arrowheads. The day of eclosion in Control (G) and dOPA1 knockdown (H), and 1-week-old adults of Control (I) and dOPA1 knockdown (J). Scale bar = 2 μm. (K) Quantification of the number of rhabdomeres for each genotype and time point. At 0 day in Control (n=50 ommatidia) and dOPA1 RNAi (n=127 ommatidia), and at 1 week in Control (n=50 ommatidia) and dOPA1 RNAi (n=117 ommatidia). Data are expressed as mean ± SEM. See the Supplementary file 1 for the genotypes of the Drosophila used in the experiments.
Figure 3—figure supplement 1
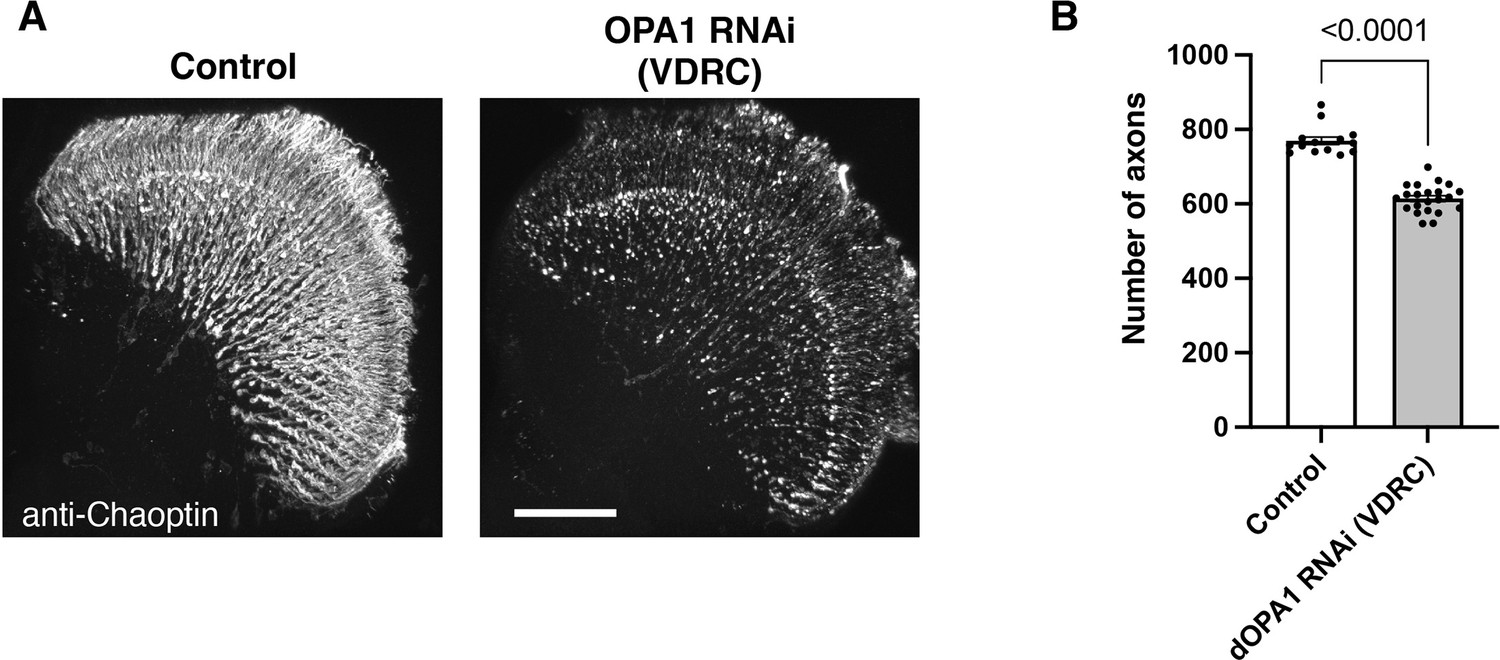
The impact on the retinal axons of another RNAi line in Drosophila OPA1.
(A) The images show the representations of retinal axons labeled with an anti-Chaoptin antibody (gray). Control and dOPA1 RNAi (VDRC 106290) from VDRC 2 weeks after eclosion. Scale bar: 50 µm. (B) Quantification of the number of axons for each genotype. Control (n=14 optic lobes) and dOPA1 RNAi (VDRC 106290) (n=22 optic lobes). The data are presented as mean ± SEM. See the Supplementary file 1 for the genotypes of the Drosophila used in the experiments.
Figure 3—figure supplement 2
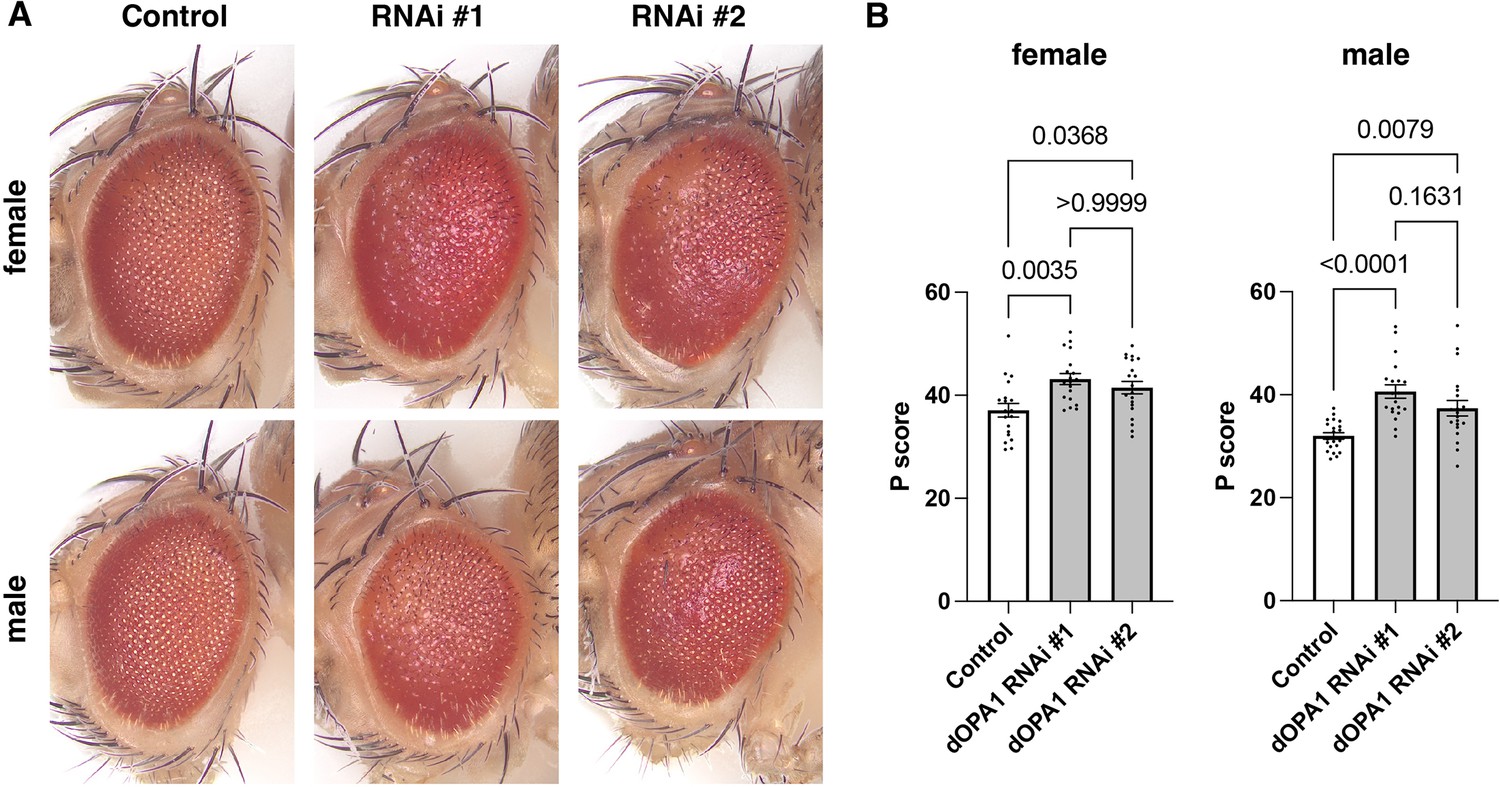
Evaluation of the impact on Drosophila compound eyes due to knockdown of dOPA1.
(A) Bright-field microscopic images of representative fly eyes expressing 40D-UAS (control), RNAi #1 (BDSC 32358), and RNAi #2 (VDRC 106290) using the GMR-Gal4 driver. (B) Graph representing the P score of each genotype: female control (n=19), female RNAi #1 (n=19), female RNAi #2 (n=20), male control (n=21), male RNAi #1 (n=20), and male RNAi #2 (n=20). See the Supplementary file 1 for the genotypes of the Drosophila used in the experiments.
Figure 4
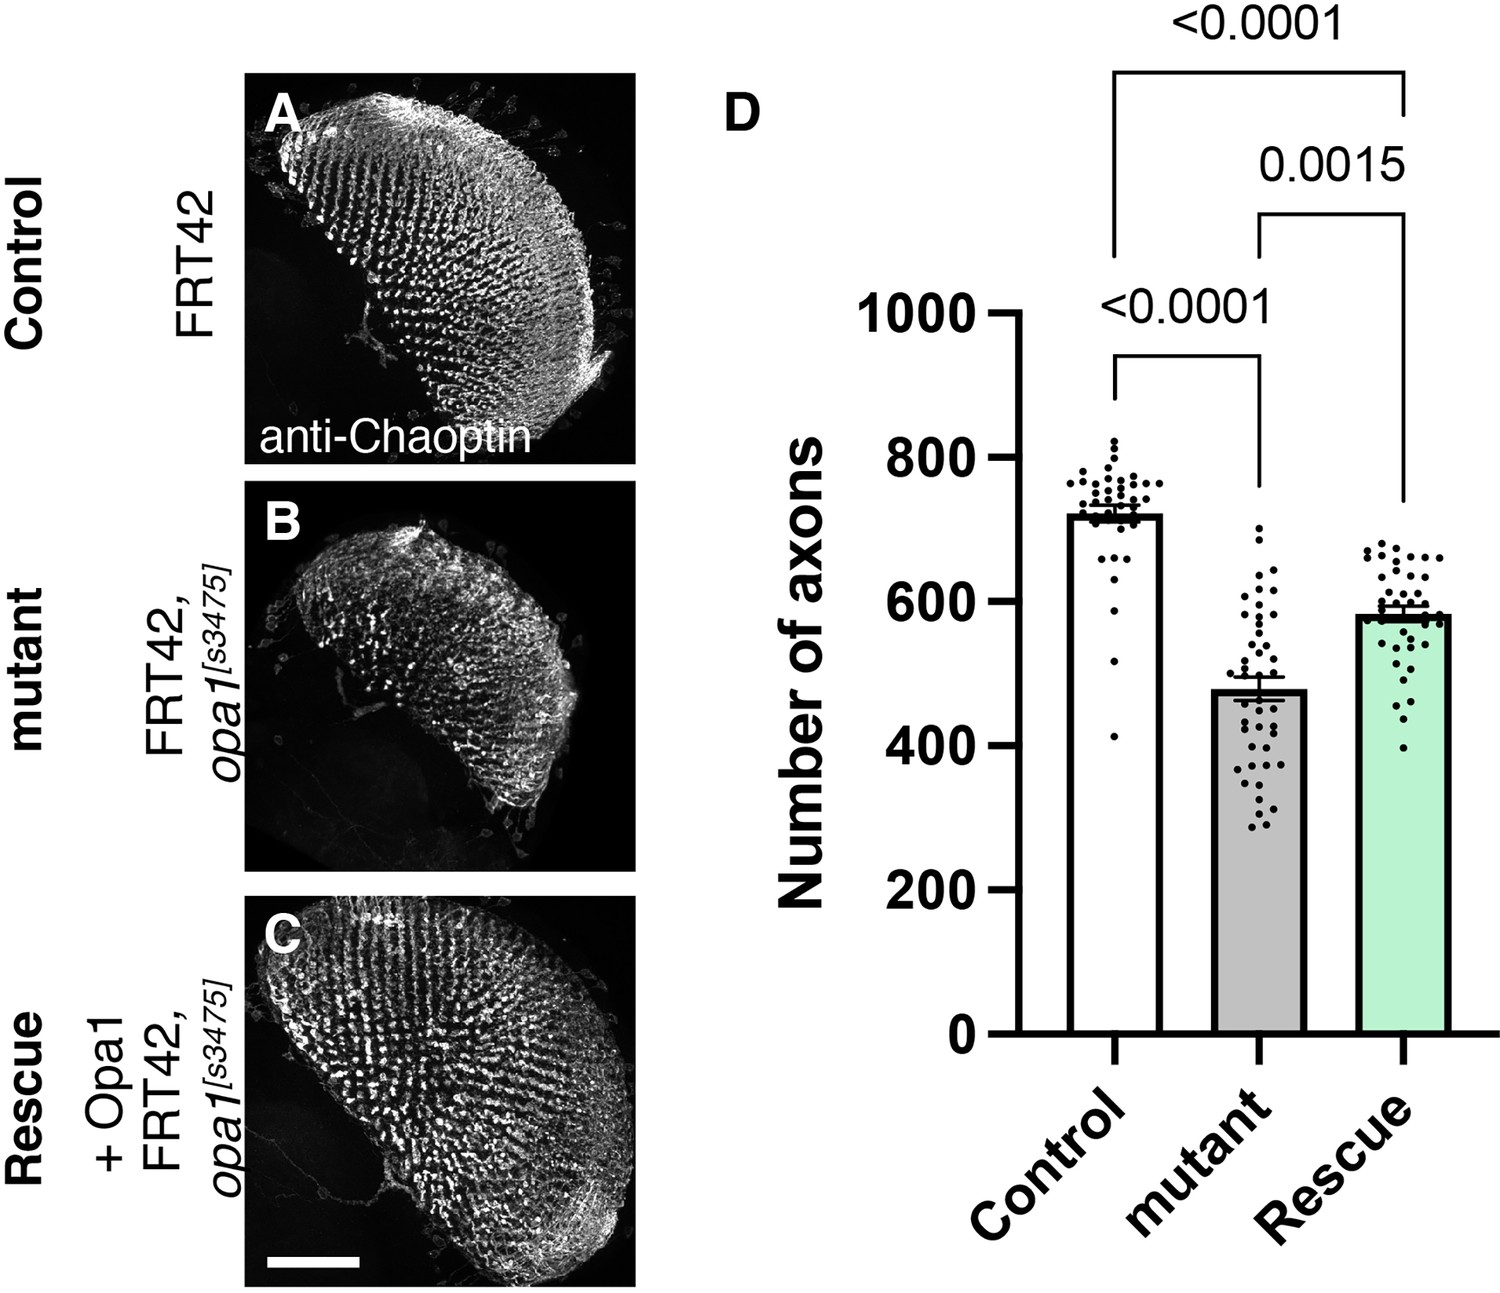
Role of dOPA1 in the retinal axon according to mutant analysis.
(A–C) Representations of retinal axons labeled with an anti-Chaoptin antibody (gray), 1 day after eclosion. The images show Control (A), dOPA1s3475 somatic mosaic flies (B), and dOPA1s3475 somatic mosaic flies expressing the eye-specific full-length dOPA1 (C). Scale bar: 50 µm. (D) Quantification of the number of axons for each genotype. Control (n=41 optic lobes), mutant (n=45 optic lobes), and rescue (n=41 optic lobes). The data are presented as mean ± SEM. See the Supplementary file 1 for the genotypes of the Drosophila used in the experiments.
Figure 5 with 1 supplement
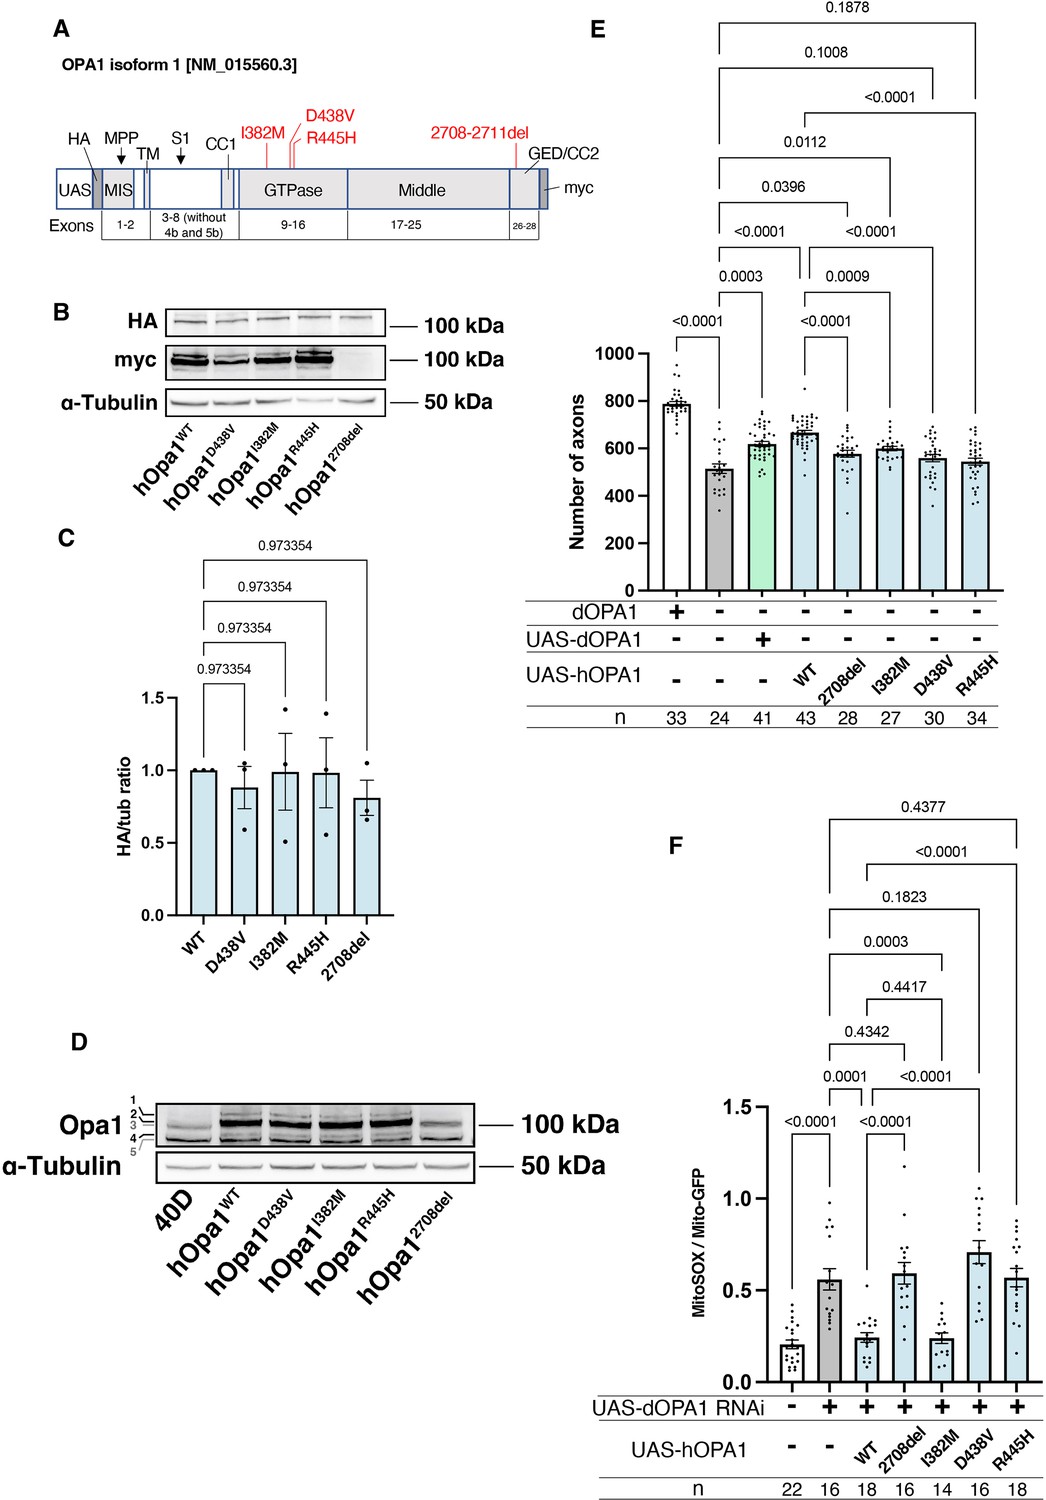
Verification of the pathological significance of disease mutations in hOPA1.
(A) Schematic illustration of the hOPA1 gene construct with HA and myc tags in the UAS-based vector. hOPA1 includes a mitochondrial import sequence (MIS) cleaved by mitochondrial processing peptidase (MPP), a transmembrane region (TM), a coiled-coil region (CC1), a GTPase domain, a Middle domain, and a GTPase effector domain (GED) containing a coiled-coil region (CC2). The sites of variants (I382M, D438V, R445H, and a deletion from 2708 to 2711) are shown in red. S1 is the site cleaved by OMA1. (B) Western blot analysis to confirm the expression of hOPA1 variants. hOPA1_WT, hOPA1_D438V, hOPA1_I382M, hOPA1_R445H, and hOPA1_2708del were expressed in whole Drosophila bodies and detected using anti-HA and anti-myc antibodies. α-Tubulin was used as a loading Control. (C) Quantification of the expression levels of the OPA1 protein for each variant. hOPA1_WT (n=3), D438V (n=3), I382M (n=3), R445H (n=3), and 2708del (n=3). The data are presented as mean ± SEM. (D) Detection of hOPA1 expression in vivo in Drosophila using anti-OPA1. Band 1 represents the full-length OPA1, which includes the MIS, while Band 2 corresponds to the long-form OPA1 (L-OPA1), cleaved at the MPP. Bands 3 and 5 potentially detect the endogenous dOPA1. Band 4 is thought to represent the short-form OPA1 (S-OPA1). (E) Rescue experiments were conducted to assess the expression of each hOPA1 variant, including dOPA1, in the retina axons of dOPA1 mutant somatic clones. The sample size is indicated (n). Data are presented as mean ± SEM. (F) Quantification of mitochondrial reactive oxygen species (ROS) levels upon expression of hOPA1 variants in the context of dOPA1 knockdown. Control (n=22 optic lobes), dOPA1 RNAi (n=16 optic lobes), hOPA1_WT with dOPA1 RNAi (n=18 optic lobes), hOPA1_2708-2711del with dOPA1 RNAi (n=16 optic lobes), hOPA1_I382M with dOPA1 RNAi (n=14 optic lobes), hOPA1_D438V with dOPA1 RNAi (n=16 optic lobes), and hOPA1_R445H with dOPA1 RNAi (n=18 optic lobes). Data are presented as mean ± SEM. See the Supplementary file 1 for the genotypes of the Drosophila used in the experiments.
Figure 5—figure supplement 1
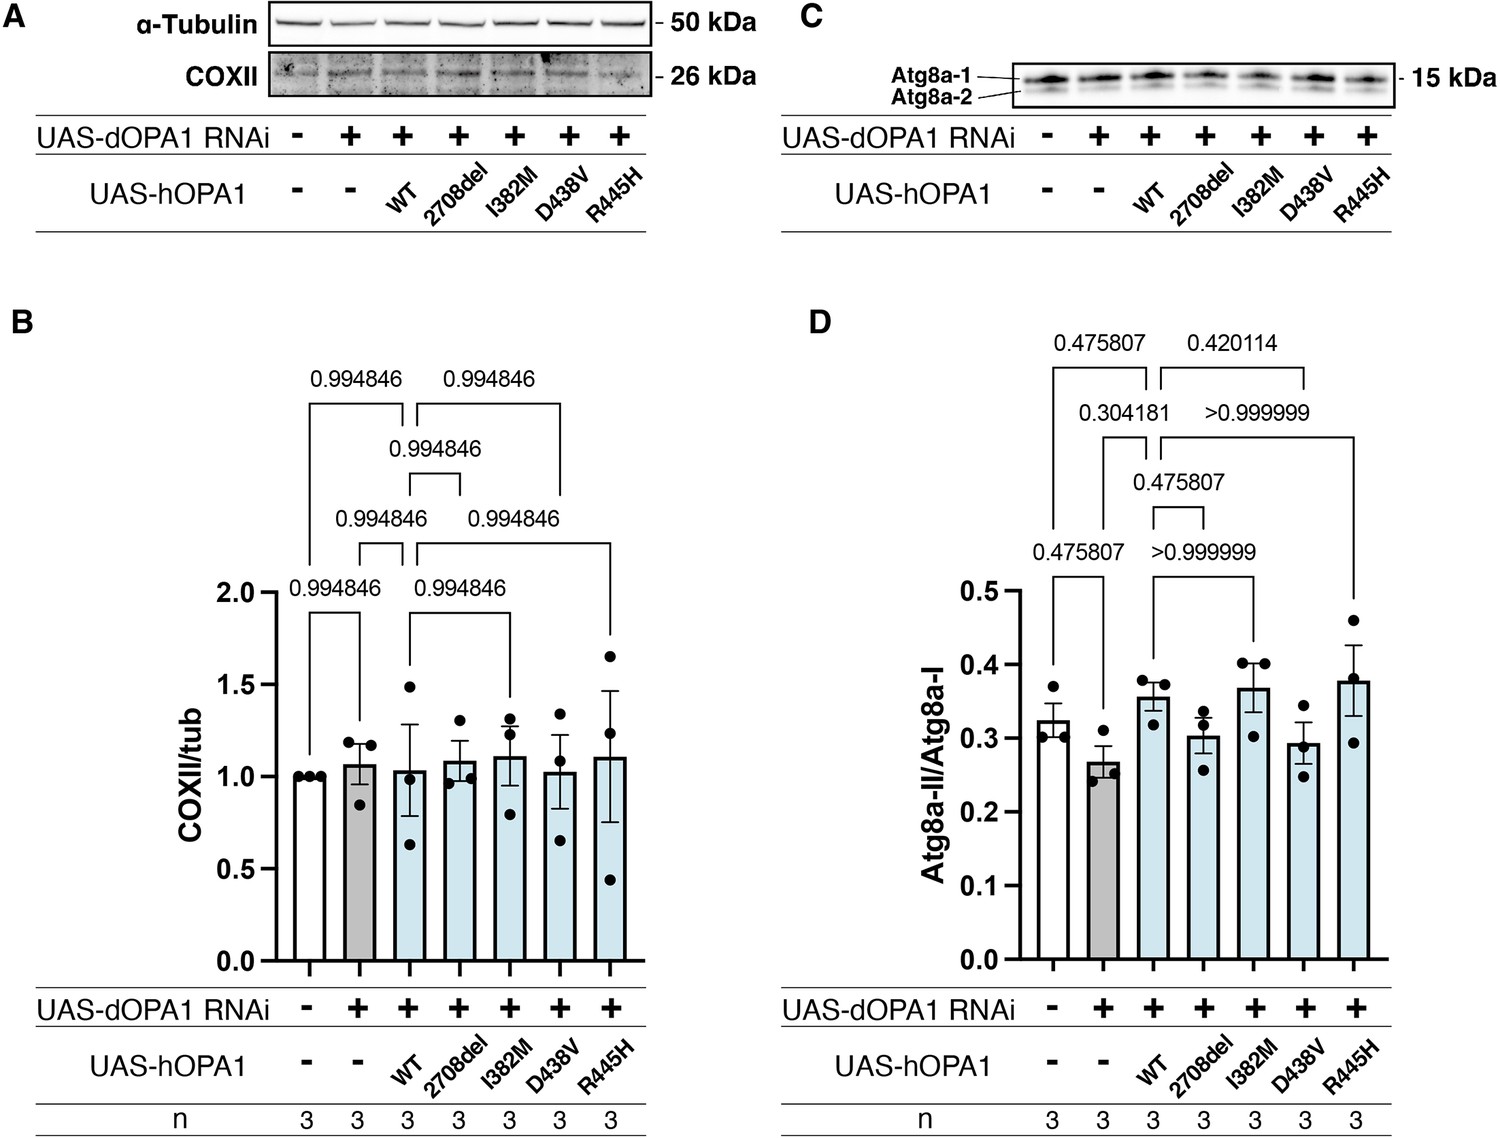
Effects of hOPA1 variants on COXII expression and autophagy in the context of dOPA1 knockdown.
(A) Western blot analysis to show the expression of COXII upon expression of hOPA1 variants in the context of dOPA1 knockdown. (B) Quantification of COXII protein levels. Control (n=3), luciferase RNAi with dOPA1 RNAi (n=3), hOPA1_WT with dOPA1 RNAi (n=3), hOPA1_2708-2711del with dOPA1 RNAi (n=3), hOPA1_I382M with dOPA1 RNAi (n=3), hOPA1_D438V with dOPA1 RNAi (n=3), and hOPA1_R445H with dOPA1 RNAi (n=3). Data are presented as mean ± SEM. (C) Western blot analysis to show the expression of Atg8a-1 and Atg8a-2 upon expression of hOPA1 variants in the context of dOPA1 knockdown. (D) Quantification of the ratio of Atg8a-2 and Atg8a-1. Control (n=3), luciferase RNAi with dOPA1 RNAi (n=3), hOPA1_WT with dOPA1 RNAi (n=3), hOPA1_2708-2711del with dOPA1 RNAi (n=3), hOPA1_I382M with dOPA1 RNAi (n=3), hOPA1_D438V with dOPA1 RNAi (n=3), and hOPA1_R445H with dOPA1 RNAi (n=3). Data are presented as mean ± SEM.
Figure 6 with 3 supplements
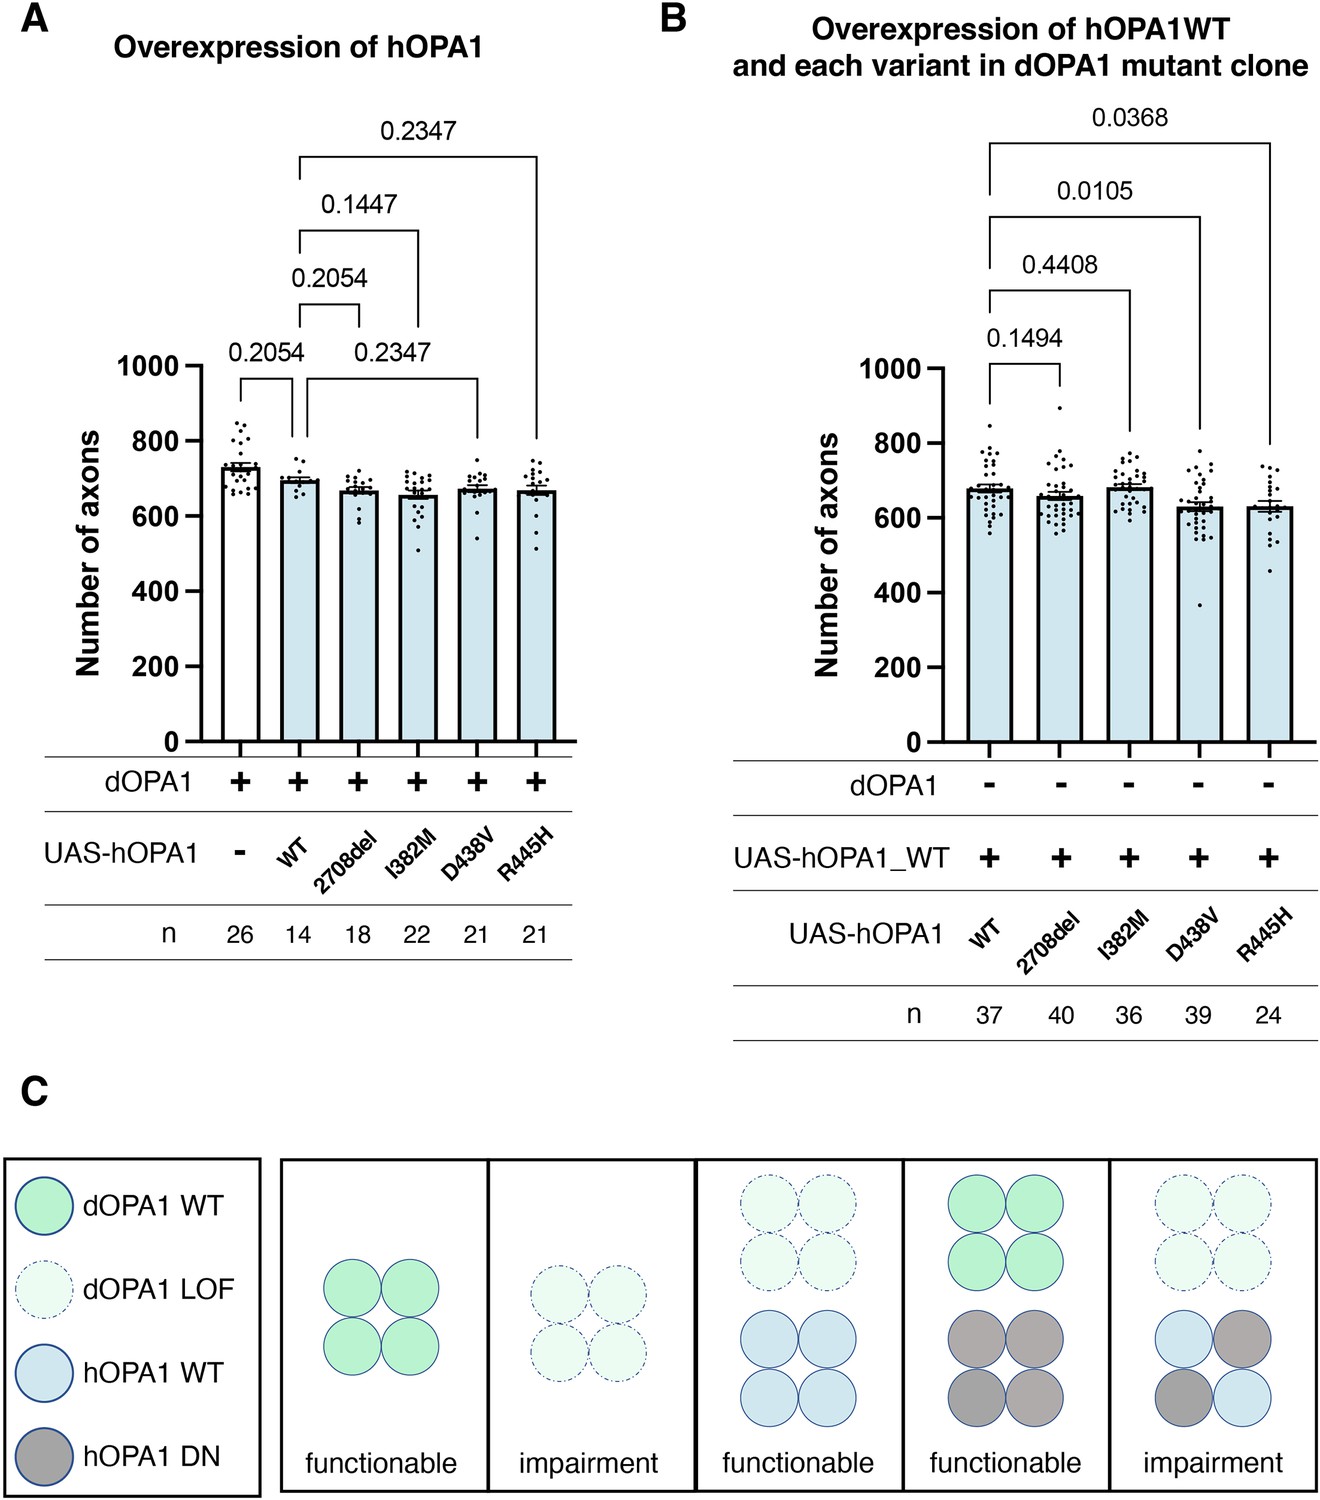
Loss-of-function (LOF) or dominant-negative (DN) effects of disease mutations in hOPA1.
(A) Impact of each human OPA1 variant on the axon number in the optic nerve of Drosophila as quantified using MeDUsA (method for the quantification of degeneration using fly axons). (B) Expression of both hOPA1 wild-type (WT) and its respective variants was analyzed in photoreceptors lacking dOPA1, and the number of axons was quantified using the MeDUsA. The sample size is indicated (n). Data are expressed as mean ± SEM. (C) Schematic representation of interspecies differences in OPA1 interactions and the interchangeability of OPA1 between human and fly. See the Supplementary file 1 for the genotypes of the Drosophila used in the experiments.
Figure 6—figure supplement 1
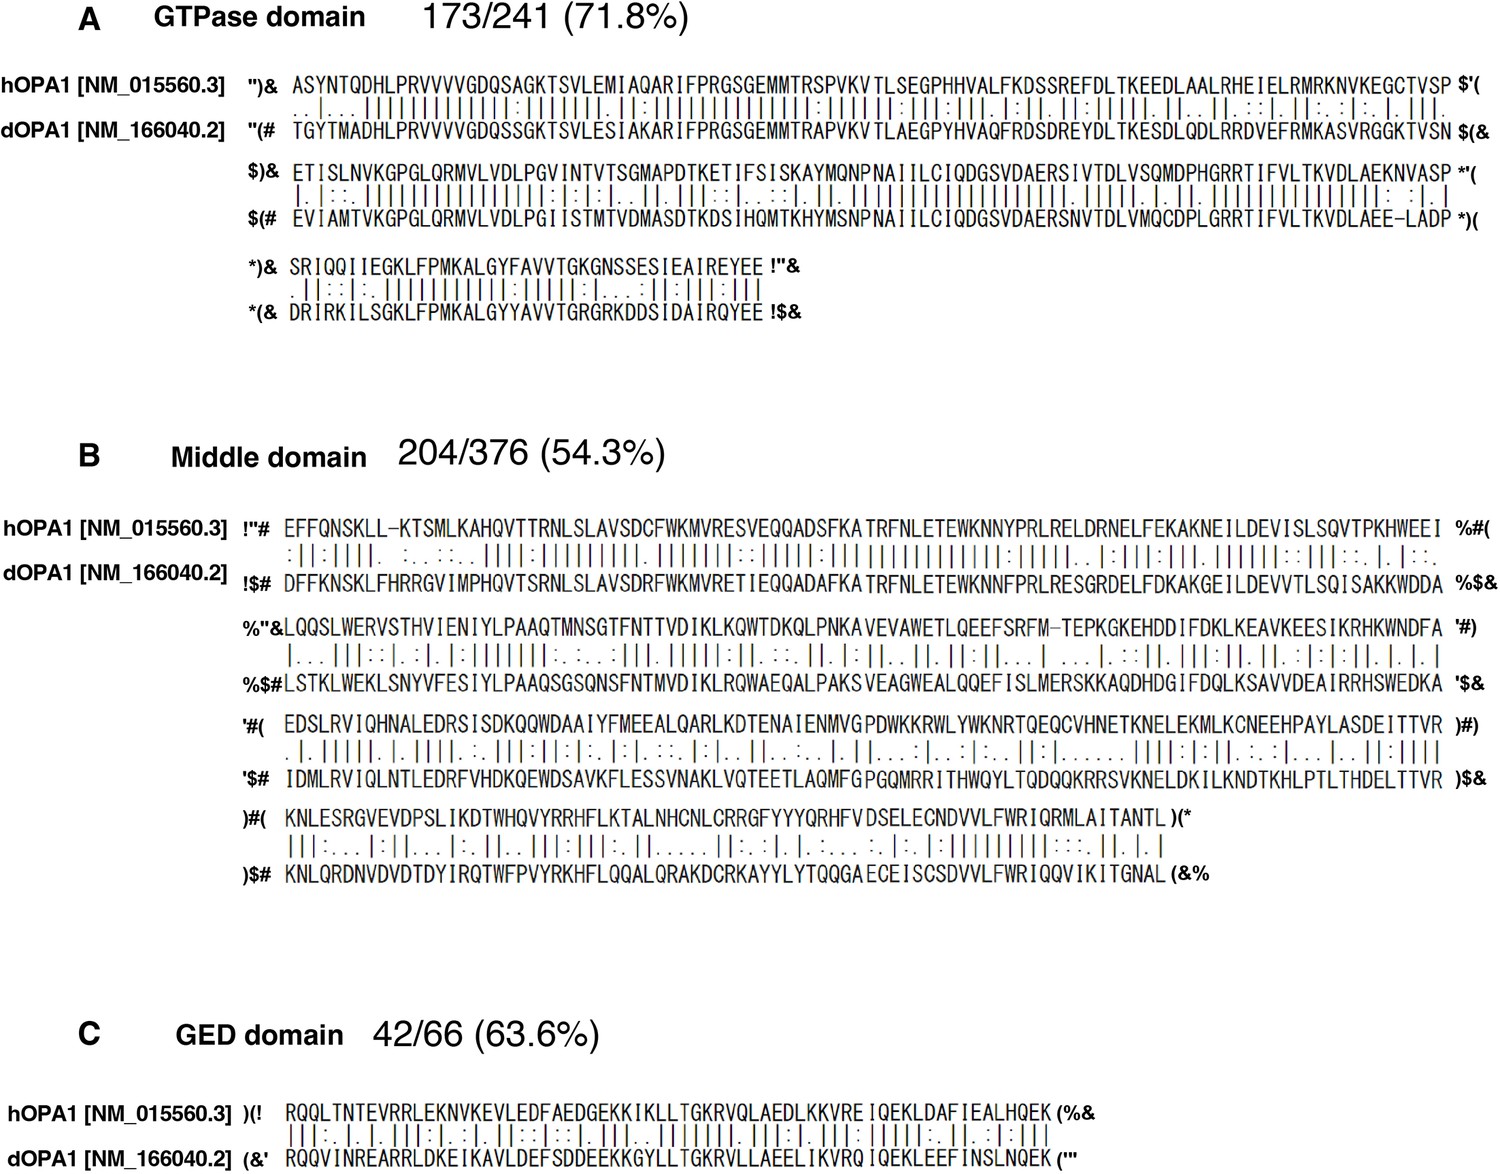
Pairwise alignment of GTPase, Middle, and GED domains of hOPA1 and dOPA1.
(A–C) The amino acid sequences of hOPA1 ([NM_015560.3]) and dOPA1 ([NM_166040.2]) were aligned using EMBOSS Needle. GTPase domain (A), Middle domain (B), and GED domain (C). Each percentage value represents the degree of identity within the amino acid sequence. GTPase domain (280–520), Middle domain (521–894), and GED domain (895–907). The beginning and end of each domain were reported previously (Liesa et al., 2009).
Figure 6—figure supplement 2
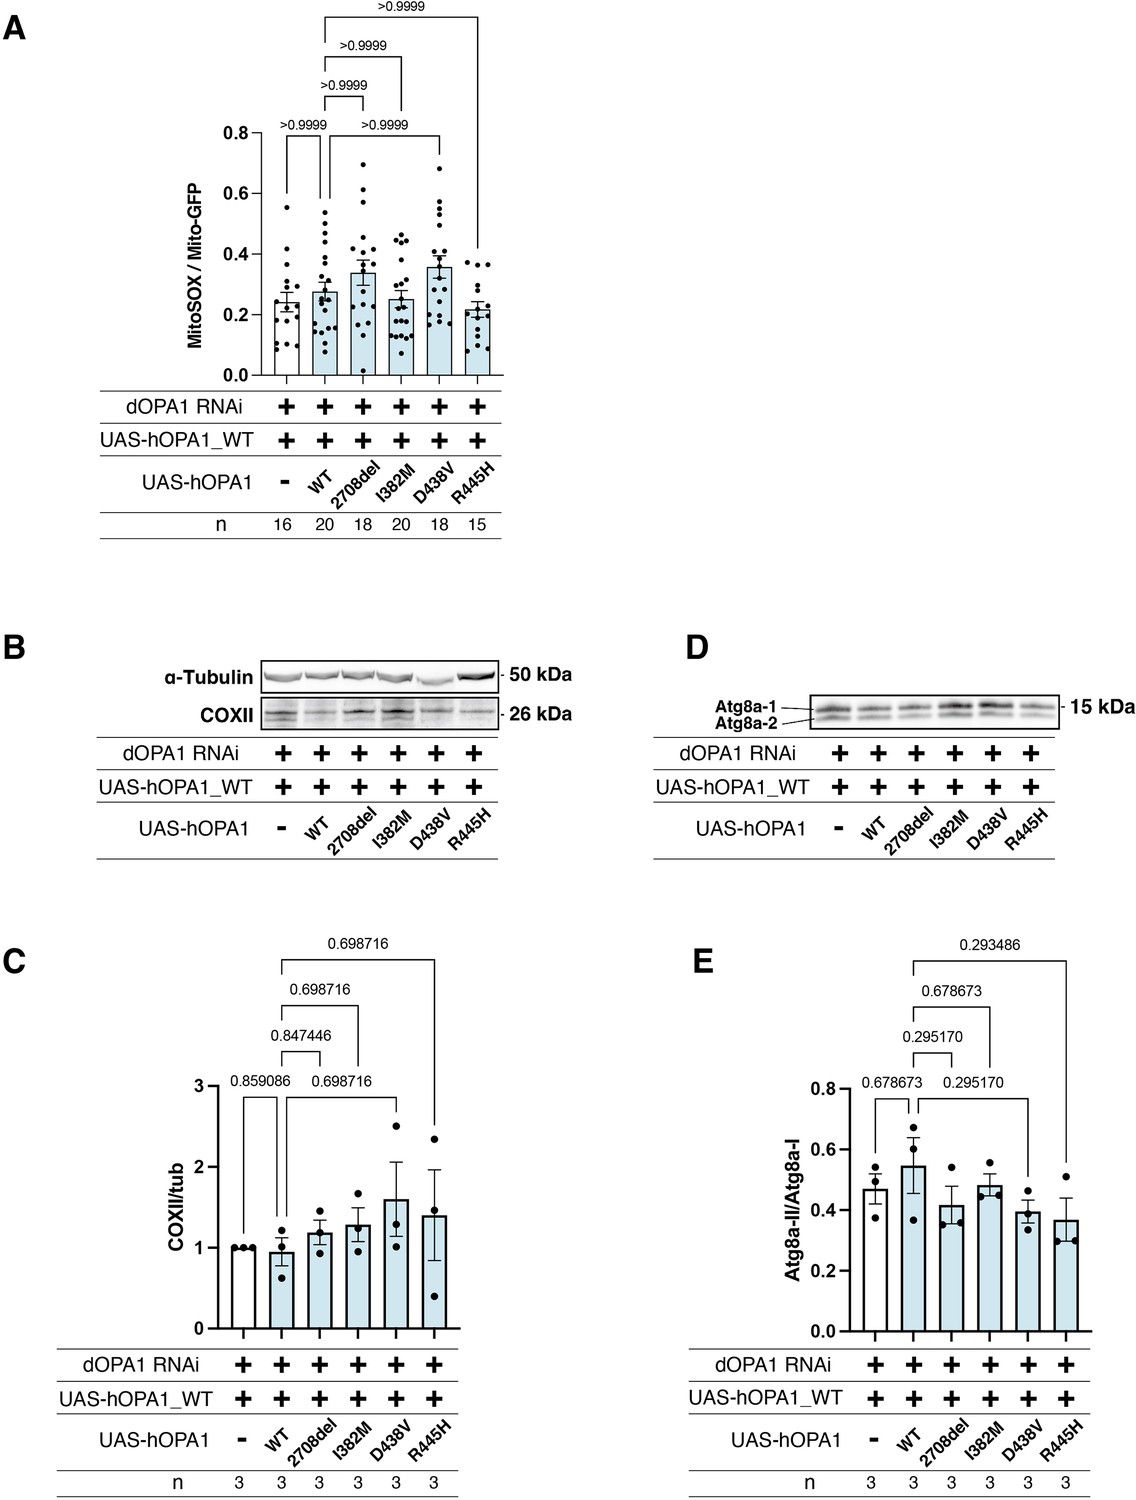
Comparative analysis of mitochondrial reactive oxygen species (ROS) levels, COXII expression, and autophagy between hOPA1 wild-type and the variants expression under dOPA1 knockdown conditions.
(A) Impact on mitochondrial ROS levels upon expression of wild-type hOPA1 and its variants under conditions of dOPA1 knockdown. Control (n=16 optic lobes), hOPA1_WT (n=20 optic lobes), hOPA1_2708-2711del (n=18 optic lobes), hOPA1_I382M (n=20 optic lobes), hOPA1_D438V (n=18 optic lobes), and hOPA1_R445H (n=15 optic lobes). Data are presented as mean ± SEM. (B) Western blot analysis to show the expression of COXII upon expression of wild-type hOPA1 and its variants under condition of dOPA1 knockdown. (C) Quantification of COXII protein levels. Control (n=3), hOPA1_WT (n=3), hOPA1_2708-2711del (n=3), hOPA1_I382M (n=3), hOPA1_D438V (n=3), and hOPA1_R445H (n=3). Data are presented as mean ± SEM. (D) Western blot analysis to show the expression of Atg8a-1 and Atg8a-2 upon expression of wild-type hOPA1 and its variants under condition of dOPA1 knockdown. (E) Quantification of the ratio of Atg8a-2 and Atg8a-1. Control (n=3), hOPA1_WT (n=3), hOPA1_2708-2711del (n=3), hOPA1_I382M (n=3), hOPA1_D438V (n=3), and hOPA1_R445H (n=3). Data are presented as mean ± SEM. See the Supplementary file 1 for the genotypes of the Drosophila used in the experiments.
Figure 6—figure supplement 3
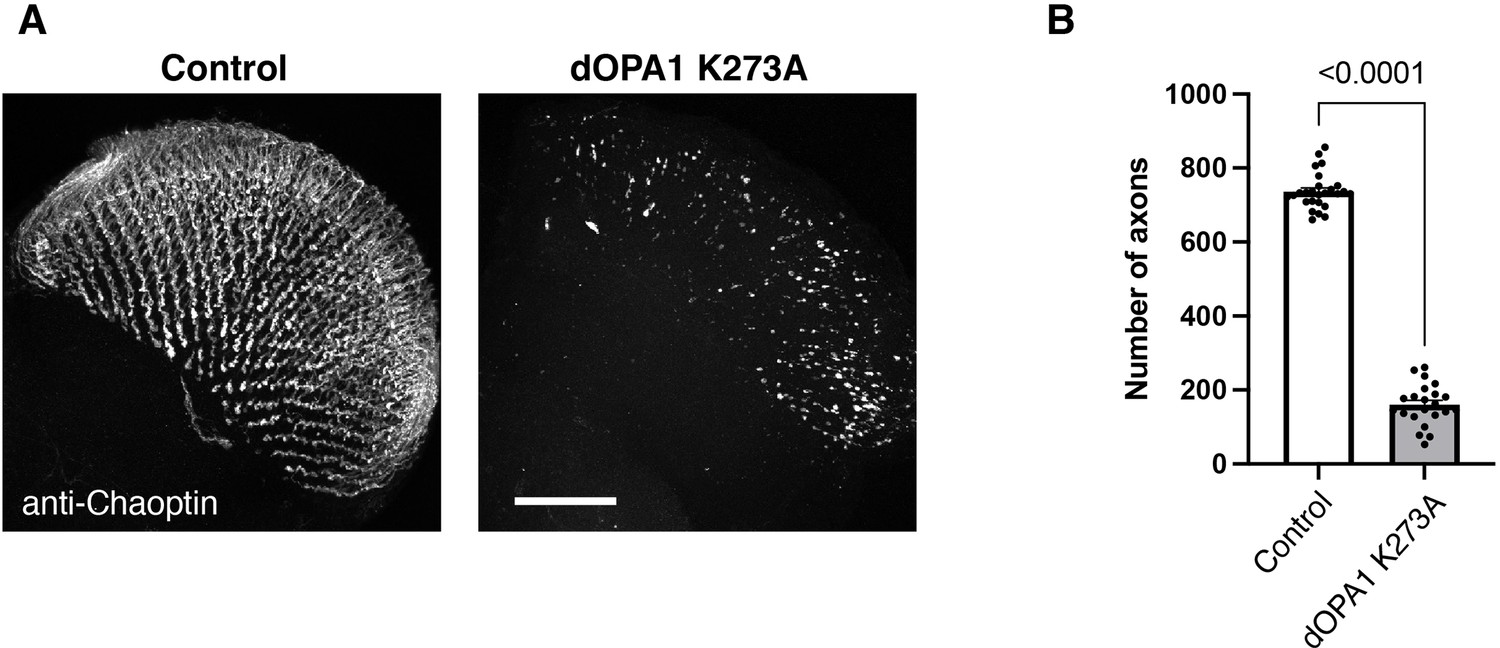
The effect of a dominant-negative mutation in dOPA1.
(A) The images show the representations of retinal axons labeled with an anti-Chaoptin antibody (gray). Control and the expression of a presumably GTPase-negative form of dOPA1K273A 1 week after eclosion. Scale bar: 50 µm. (B) Quantification of the number of axons for each genotype. Control (n=26 optic lobes) and dOPA1K273A (n=22 optic lobes). The data are presented as mean ± SEM. See the Supplementary file 1 for the genotypes of the Drosophila used in the experiments.
Additional files
-
Supplementary file 1
The genotypes of the Drosophila used in the experiments.
Detailed information about the specific genotypes of Drosophila used in each experiment described in the manuscript, including the relevant genetic constructs, mutations, and background strains.
- https://cdn.elifesciences.org/articles/87880/elife-87880-supp1-v1.docx
-
MDAR checklist
- https://cdn.elifesciences.org/articles/87880/elife-87880-mdarchecklist1-v1.pdf
Download links
A two-part list of links to download the article, or parts of the article, in various formats.
Downloads (link to download the article as PDF)
Open citations (links to open the citations from this article in various online reference manager services)
Cite this article (links to download the citations from this article in formats compatible with various reference manager tools)
Drosophila model to clarify the pathological significance of OPA1 in autosomal dominant optic atrophy
eLife 12:RP87880.
https://doi.org/10.7554/eLife.87880.3


