A dual function of the IDA peptide in regulating cell separation and modulating plant immunity at the molecular level
- Section for Genetics and Evolutionary Biology, Department of Biosciences, University of Oslo, Norway
- Institute for Developmental Genetics and Cluster of Excellence on Plant Sciences, Heinrich Heine University, Germany
- Gregor Mendel Institute (GMI), Austrian Academy of Sciences, Vienna Biocenter (VBC), Austria
Figures
Figure 1 with 7 supplements
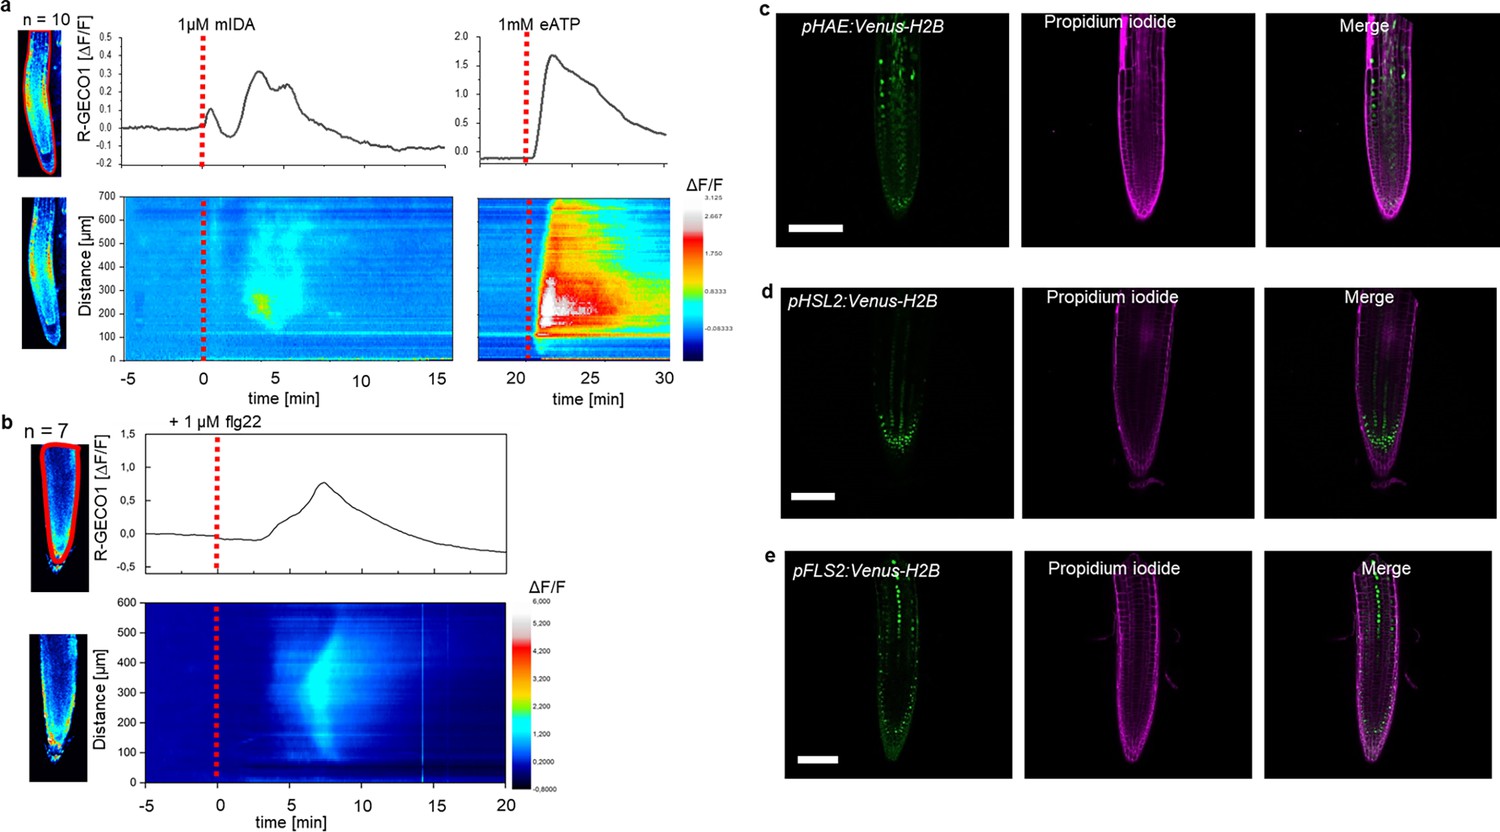
mIDA-induced [Ca2+]cyt release in Arabidopsis roots correlates with pHAE and pHSL2 activity.
(a) Normalized R-GECO1 fluorescence intensities (ΔF/F) were measured from regions of interest (ROI) (upper panel, outlined in red) in the meristematic and elongation zone of the root. Fluorescence intensities (ΔF/F) over time of the whole root represented in a heat map (lower panel). Shown are cytosolic calcium concentration ([Ca2+]cyt) dynamics in the ROI in response to 1 µM mIDA over time. (see also Figure 1—video 1). Red lines at 5 min (min) indicates application of mIDA peptide or application of eATP at 22 min. Representative response from 10 roots (Figure 1—figure supplement 2). The increase in [Ca2+]cyt response propagates through the roots as two waves. (b) For comparison; Normalized R-GECO1 fluorescence intensities (ΔF/F) measured from regions of interest (ROI) (outlined in red, upper panel) in response to 1 μM flg22 over time. Fluorescence intensities (ΔF/F) over time of the whole root represented in a heat map (lower panel). Red line at 0 min (min) indicates application of flg22 peptide. Representative response from 7 roots (Figure 1—figure supplement 2). The increase in [Ca2+]cyt response propagates through the roots as a single wave seen as normalized R-GECO1 fluorescence intensities (ΔF/F) shown as a heat map (see also Figure 1—video 2). (c, d, e) Expression of the receptors (c), pHAE:Venus-H2B (d), pHSL2:Venus-H2B and (e), pFLS2:Venus-H2B in 7 days-old roots. Representative pictures of n=8. Scale bar = 50 µm, single plane image, magenta = propidium iodide stain.
Figure 1—figure supplement 1
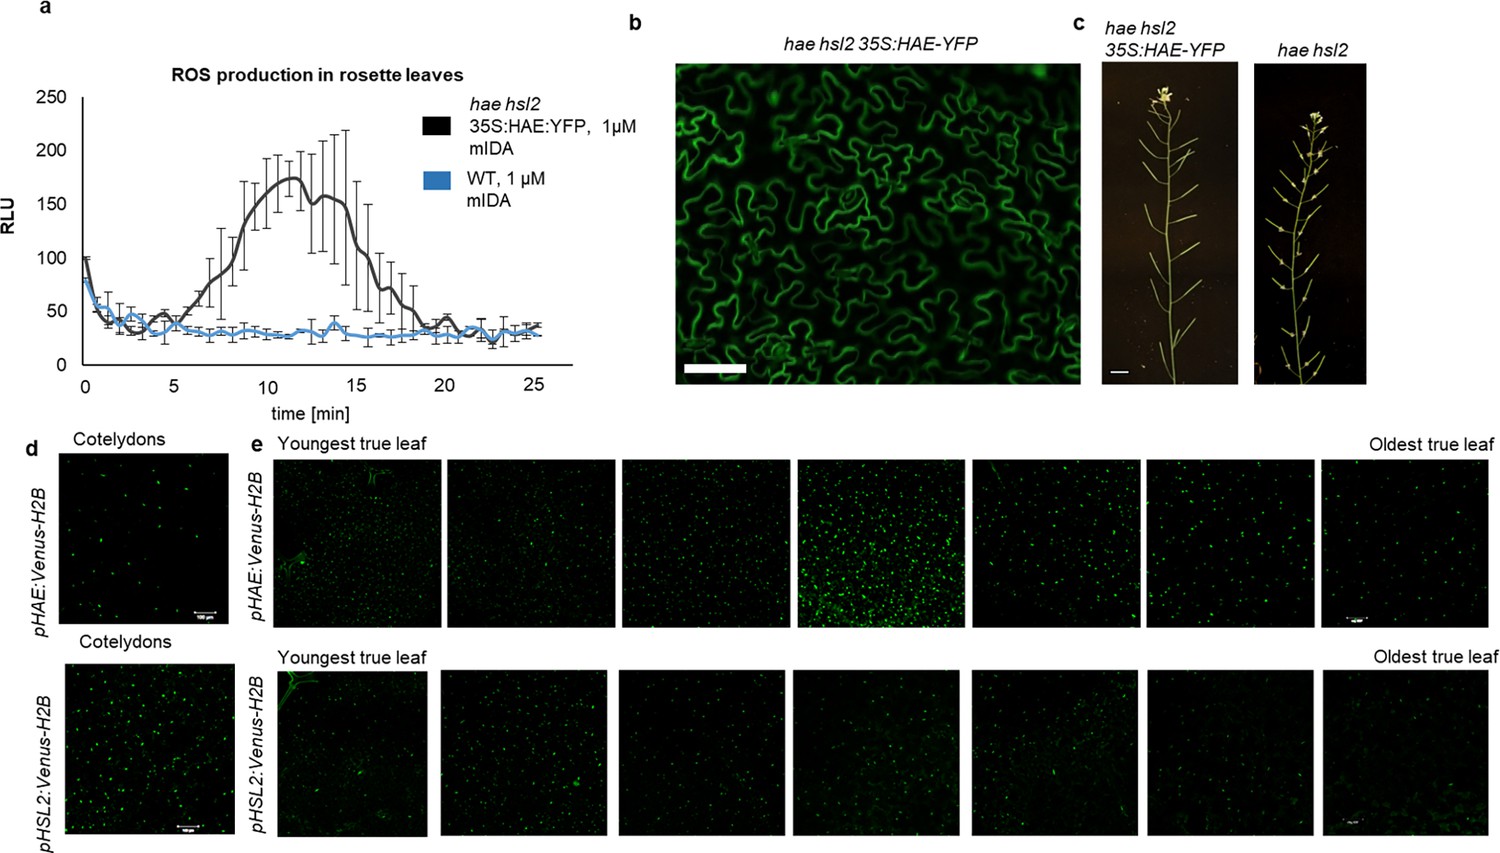
IDA induces ROS production in Arabidopsis.
(a) ROS production detected by the luminol-based assay was monitored over time as RLU. ROS production from hae hsl2 leaf disks expressing 35 S:HAE-YFP in response to 1 μM mIDA (black) and in WT control (blue). (b) Fluorescent image of hae hsl2 rosette leaves expressing 35 S:HAE:YFP. Signal is detected in the plasma membrane of cells in the epidermal layer. Representative picture. Scale bar = 50 μm. (c) 35 S:HAE-YFP complements the hae hsl2 mutant abscission phenotype of observed. Scale bar = 1 cm. (d, e) Microscopic analysis of pHAE:Venus-H2B (upper panel) and pHSL2-Venus-H2B (lower panel) in (d) cotelydons of 7 days old seedlings and in (e) rosette leaves of a 22 days old Arabidopsis plant containing 7 true leaves. Expression in each leaf is shown from youngest (left) to oldest (right). Scale bar = 100 μm.
Figure 1—figure supplement 2
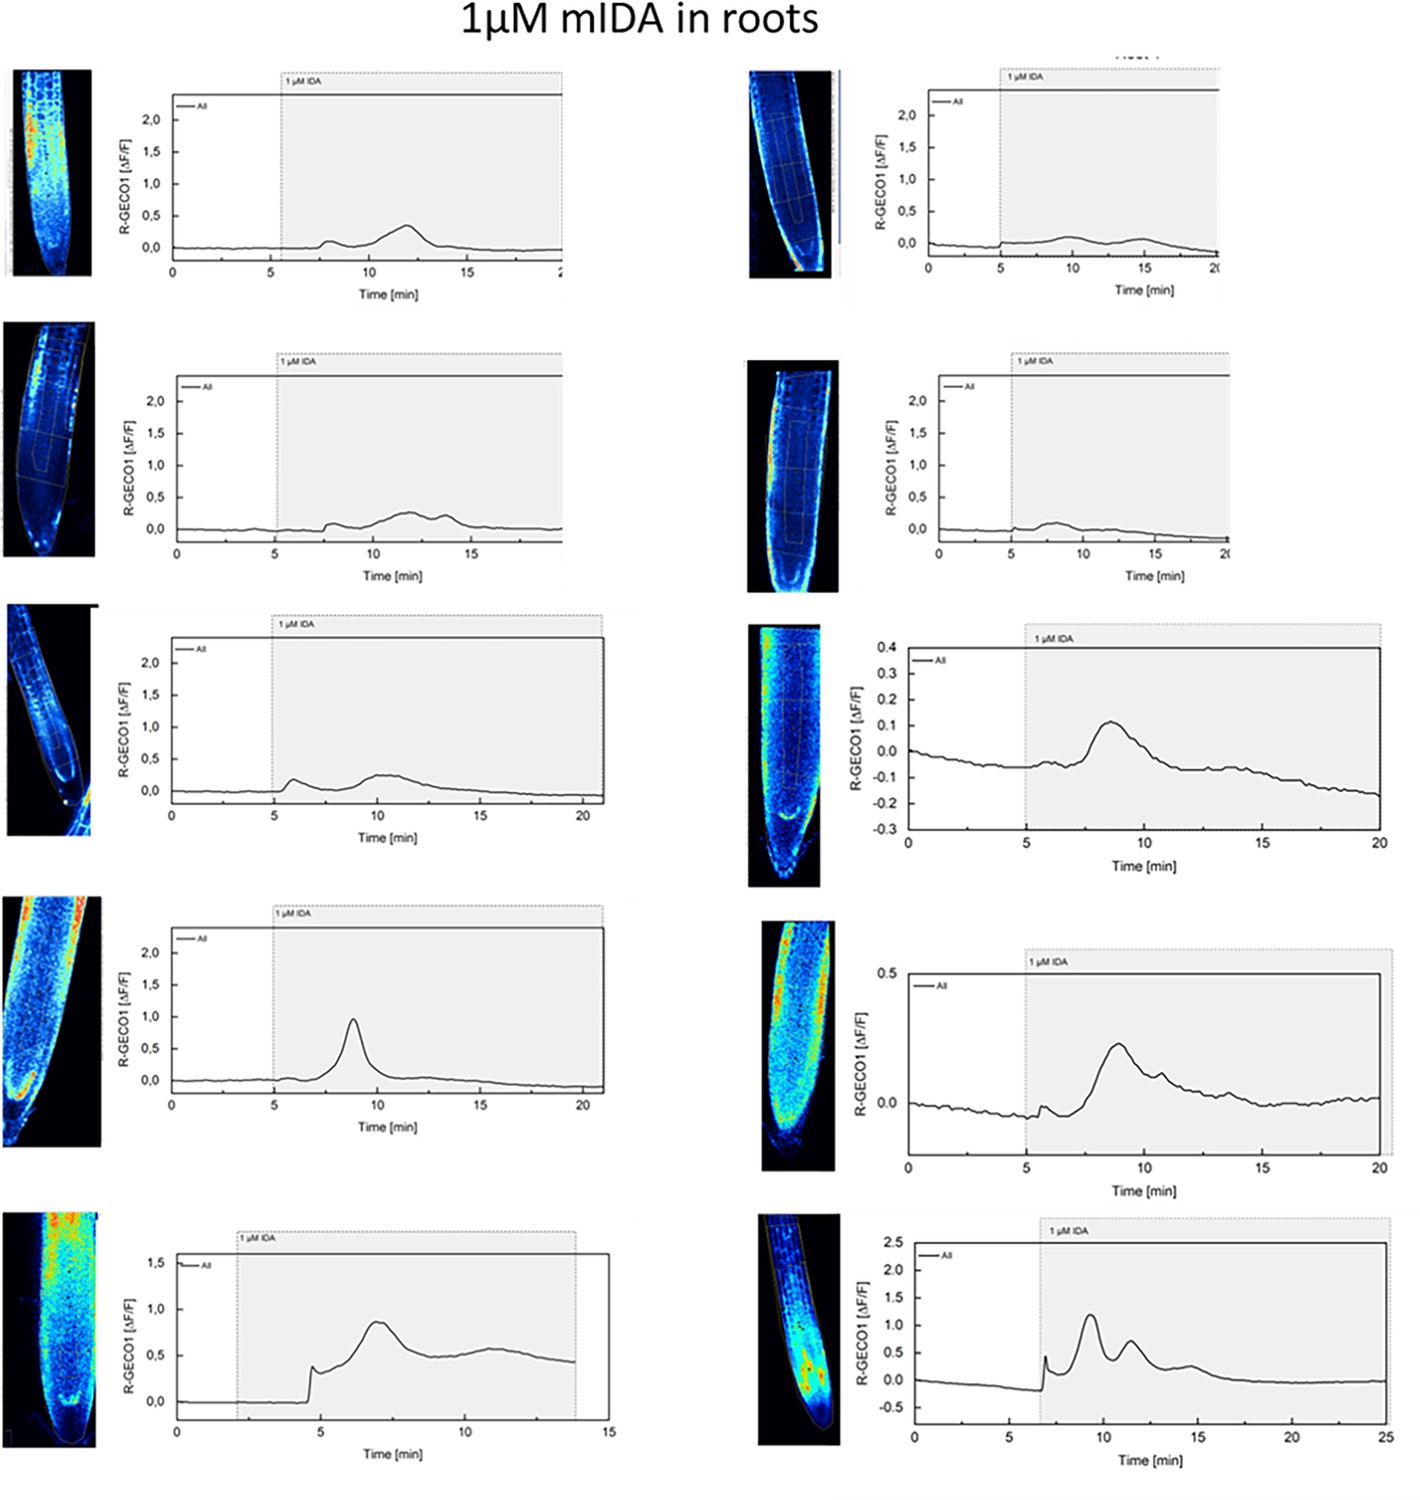
mIDA-induced [Ca2+]cyt release in Arabidopsis roots.
Shown are cytosolic calcium concentration ([Ca2+]cyt) dynamics in the ROI in response to 1 µM mIDA over time. Normalized R-GECO1 fluorescence intensities (ΔF/F) were measured from a region of interest (ROI) containing the meristematic and elongation zone of the root.
Figure 1—figure supplement 3
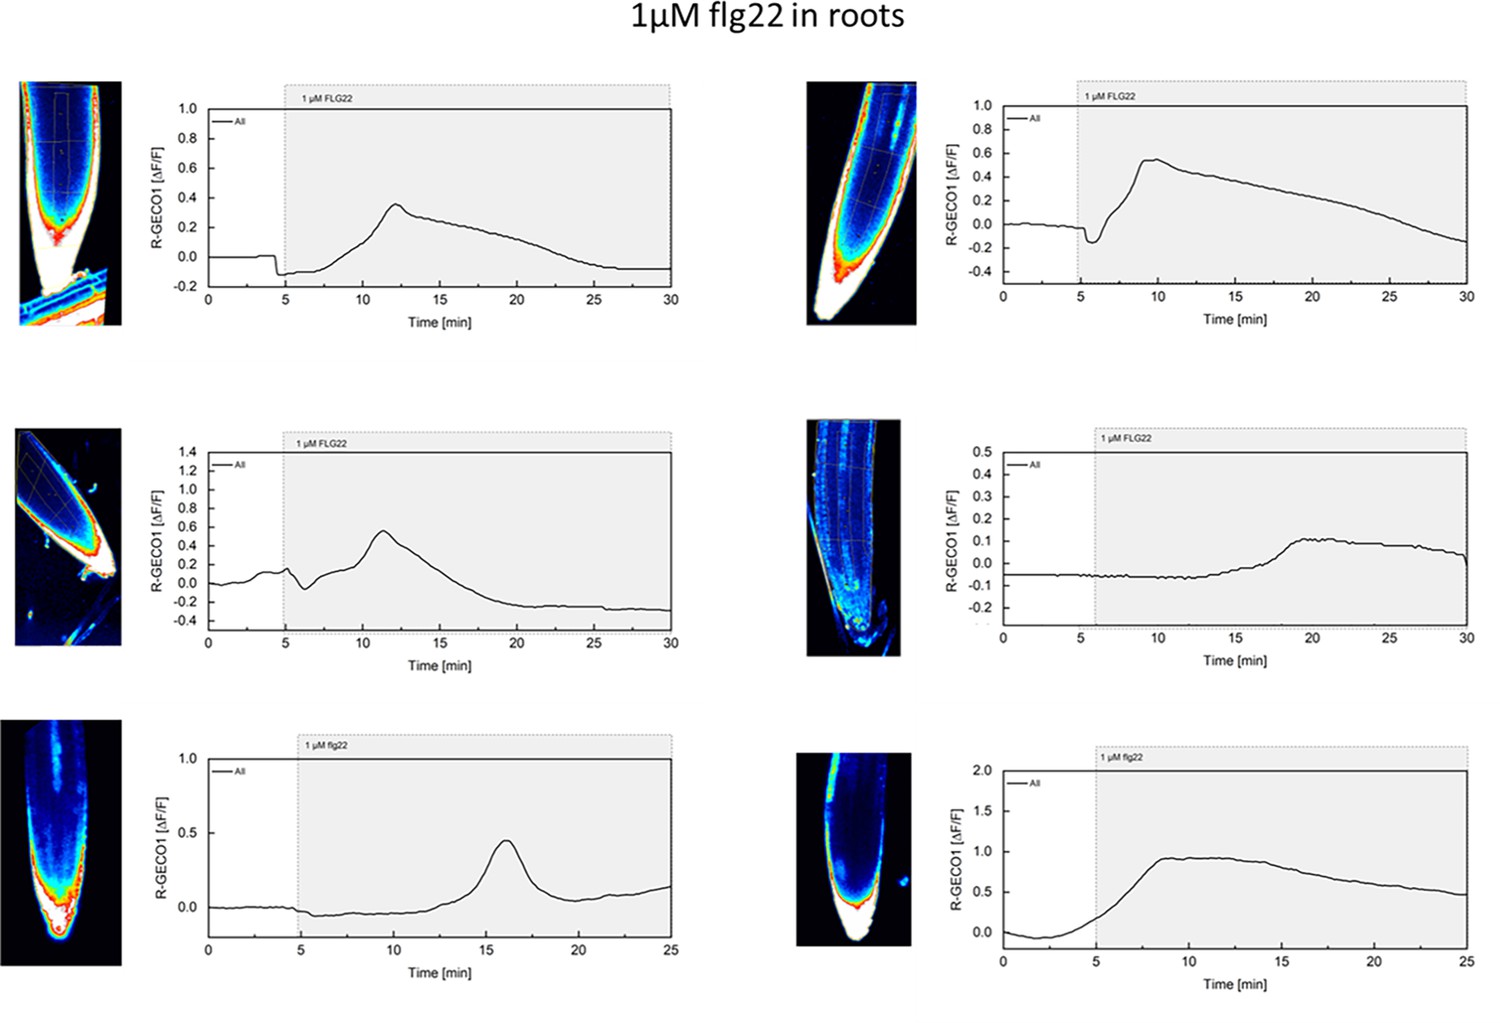
flg22-induced [Ca2+]cyt release in Arabidopsis roots.
Shown are cytosolic calcium concentration ([Ca2+]cyt) dynamics in the ROI in response to 1 µM flg22 over time. Normalized R-GECO1 fluorescence intensities (ΔF/F) were measured from a region of interest (ROI) containing the meristematic and elongation zone of the root.
Figure 1—figure supplement 4
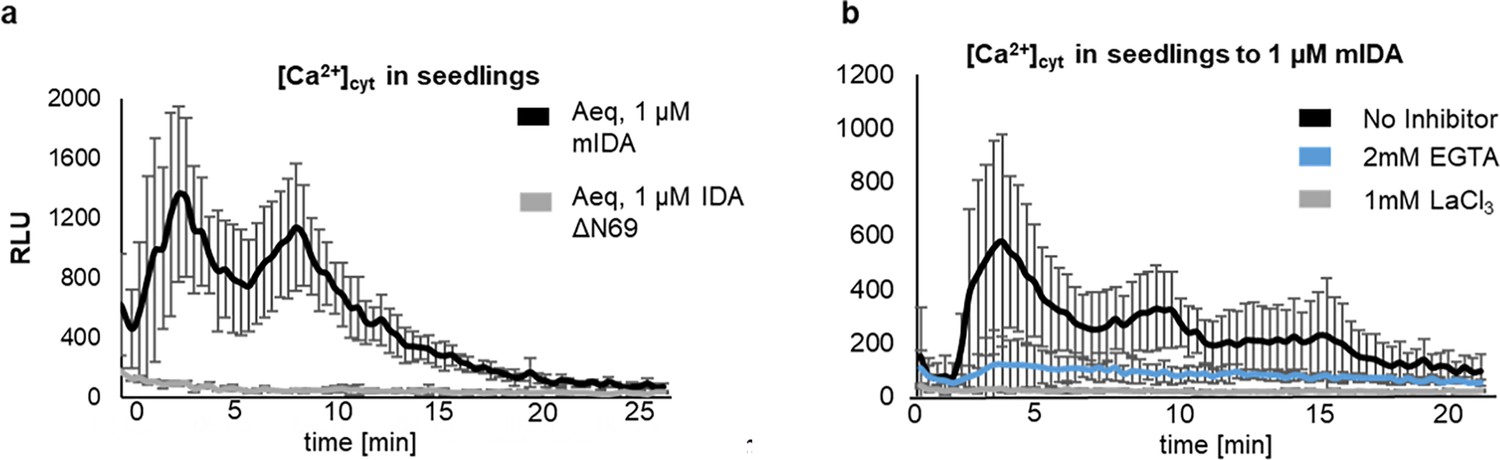
The IDA triggered increase in [Ca2+]cyt is abolished in the presence of Ca2+ inhibitors.
(a) Increase in [Ca2+]cyt in 7 days old seedlings expressing the cytosolic localized Aequorin-based luminescence Ca2+ sensor (Aeq) measured in relative light units (RLU) treated with 1 μM mIDA (black). No response is observed in Aeq seedlings treated with 1 μM IDAΔN69 (gray). (b) Increase in [Ca2+]cyt in 7 days old seedlings expressing the cytosolic localized Aequorin-based luminescence Ca2+ sensor (Aeq) measured in relative light units (RLU) treated with 1 μM mIDA. No response is observed in Aeq seedlings treated with 1 mM EGTA (blue) or 1 mM LaCl3 (grey). Curves represent average of three independent experiments with four to six replicates in each experiment.
Figure 1—video 1
[Ca2+]cyt dynamics in R-GECO1 expressing root tip in response to 1 µM mIDA.
Ten-days-old roots were treated with 1 µM mIDA and changes in [Ca2+]cyt was recorded over time. Response shown as normalized fluorescence intensities (∆F/F). Images were recorded with a frame rate of 5 s. Video corresponds to measurements shown in Figure 1a. Representative response from 10 roots. Time shown as, hh:mm:ss.
Figure 1—video 2
[Ca2+]cyt dynamics in R-GECO1 expressing root tip in response to 1 µM flg22.
Ten days-old roots were treated with 1 µM flg22 and changes in [Ca2+]cyt was recorded over time. Response shown as normalized fluorescence intensities (∆F/F). Images were recorded with a frame rate of 5 s. Video corresponds to measurements shown in Figure 1b. Representative response from 7 roots. Time shown as, hh:mm:ss.
Figure 1—video 3
[Ca2+]cyt dynamics in R-GECO1 expressing root tip in response to 1 mM eATP.
1 mM eATP induces a strong increase in [Ca2+]cyt and was added as a last treatment to all roots acting as a positive control. Response shown as normalized fluorescence intensities (∆F/F). Images were recorded with a frame rate of 5 seconds. Video corresponds to measurements shown in Figure 1a. Representative response from 10 roots. Time shown as, hh:mm:ss.
Figure 2 with 6 supplements
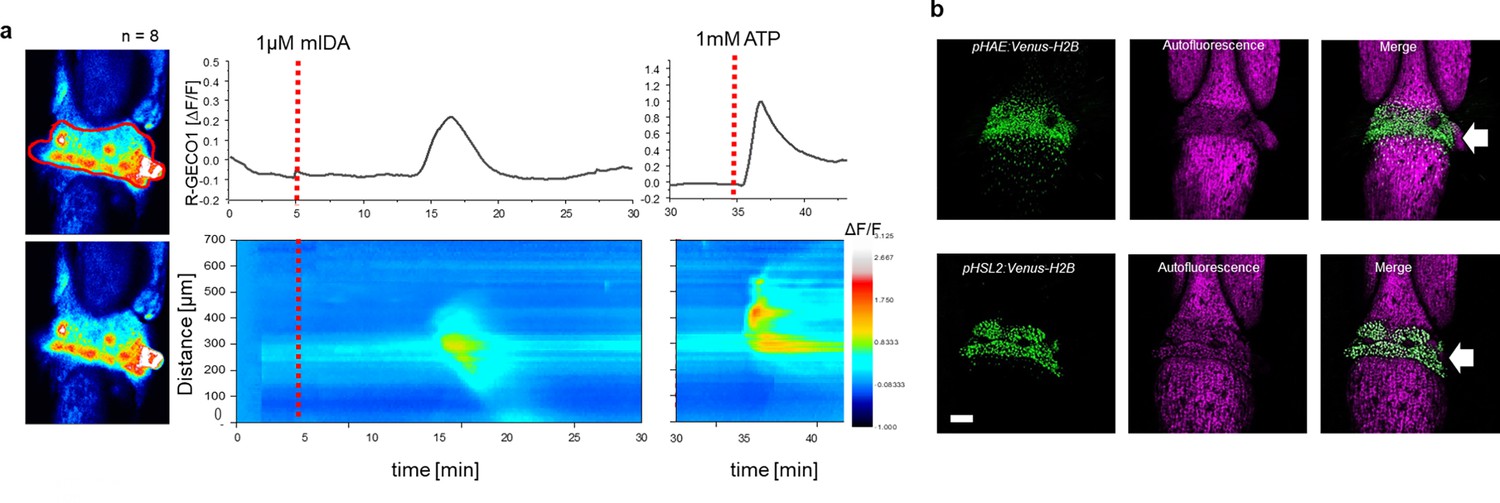
mIDA-induced [Ca2+]cyt release in Arabidopsis abscission zones.
(a) Normalized R-GECO1 fluorescence intensities (ΔF/F) were measured from regions of interest (ROI) (outlined in red) in floral abscission zone (AZ)s. Shown are cytosolic calcium concentration ([Ca2+]cyt) dynamics in the ROI in response to 1 µM mIDA over time (see also Figure 2—video 1). Representative response from 8 flowers (Figure 2—figure supplement 2). Red lines at 5 min (min) indicates application of mIDA peptide or application of eATP at 35 min (for AZs), respectively. The increase in [Ca2+]cyt response propagates through the AZ as a single wave. (b) Expression of pHAE:Venus-H2B and pHSL2:Venus-H2B in flowers at position 6 (See Figure 2—figure supplement 1a for positions; arrowhead indicates AZ). Representative pictures of n=8, scale bar = 100 µm, maximum intensity projections of z-stacks.
Figure 2—figure supplement 1
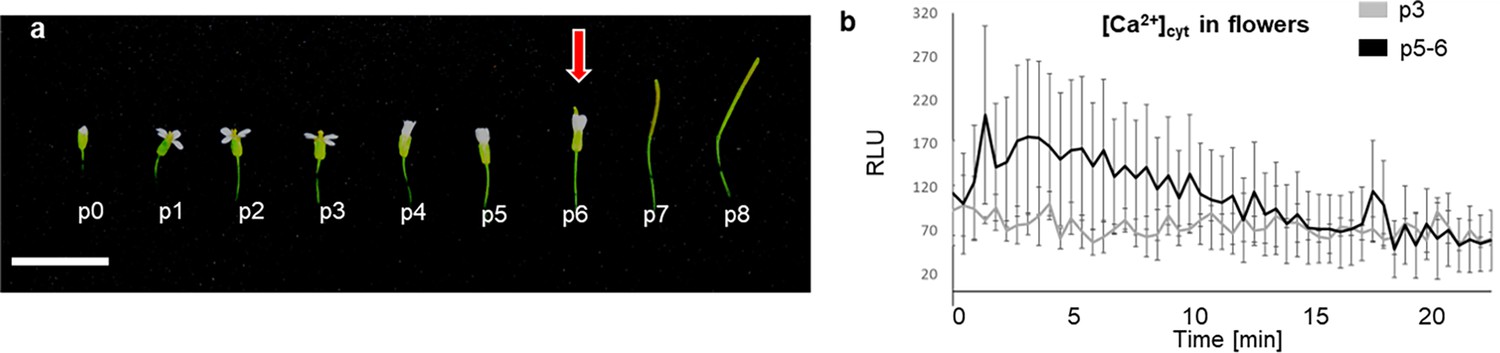
mIDA induces a Ca2+ response in flowers.
(a) Arabidopsis flowers and siliques at different developmental stages. Flowers along the main inflorescence are counted from the first flower with visible white petals at the top of the inflorescence and is defined as p 1. Subsequently older flowers along the inflorescence (p0–p8). Cell wall remodeling in AZ cells, accompanied with a reduction in petal breakstrength (the force required to remove a petal from the receptacle) is initiated at p6 (red arrow). By p7 AZ cells have undergone cell separation and the floral organs have abscised. P=position. Scale bar = 1 cm. (b) Increase in [Ca2+]cyt in flowers expressing the cytosolic localized Aequorin-based luminescence Ca2+ sensor (Aeq) measured in relative light units (RLU) treated with 1 μM mIDA. A [Ca2+]cyt increase is observed in flowers where there is an initial weakening of the cell walls (p5-6) (black). No increase in luminescence was observed in Aeq expressing flowers of an earlier developmental stage (p3) (gray). Curves show representative measurements. Three independent experiments were performed with four to six replicates in each experiment.
Figure 2—figure supplement 2
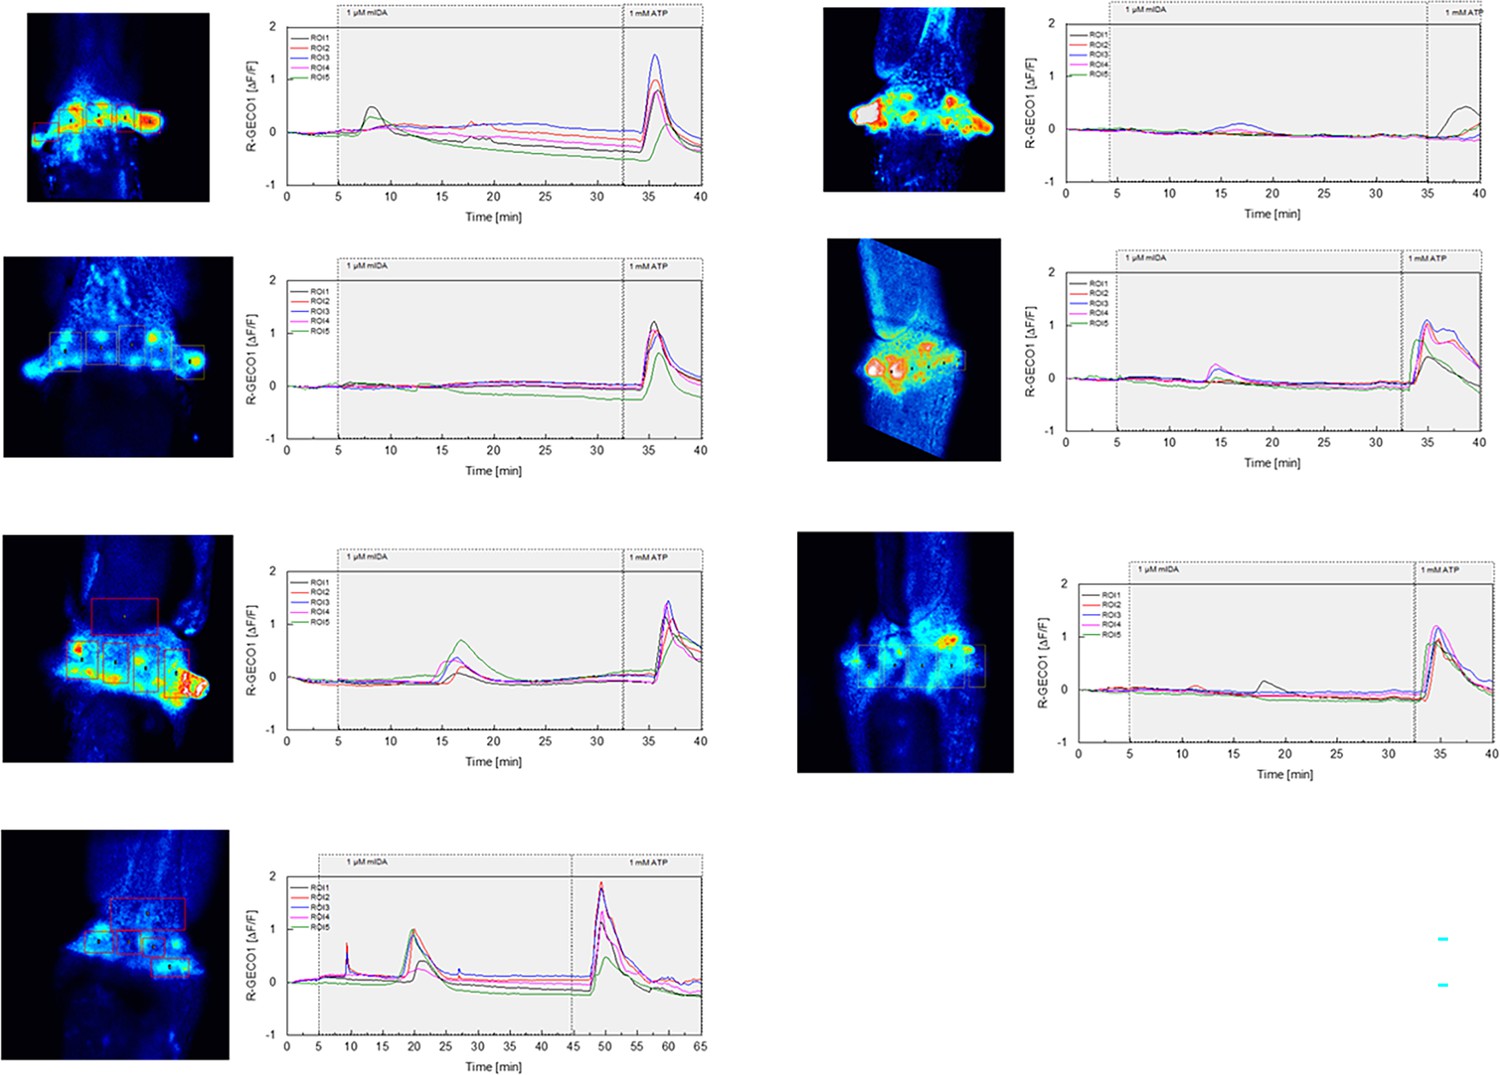
mIDA-induced [Ca2+]cyt release in Arabidopsis abscission zones.
Normalized R-GECO1 fluorescence intensities (ΔF/F) were measured from regions of interest (ROIs) in floral abscission zone (AZ)s. Shown are cytosolic calcium concentration ([Ca2+]cyt) dynamics in the ROI1-5 in response to 1 µM mIDA over time.
Figure 2—figure supplement 3
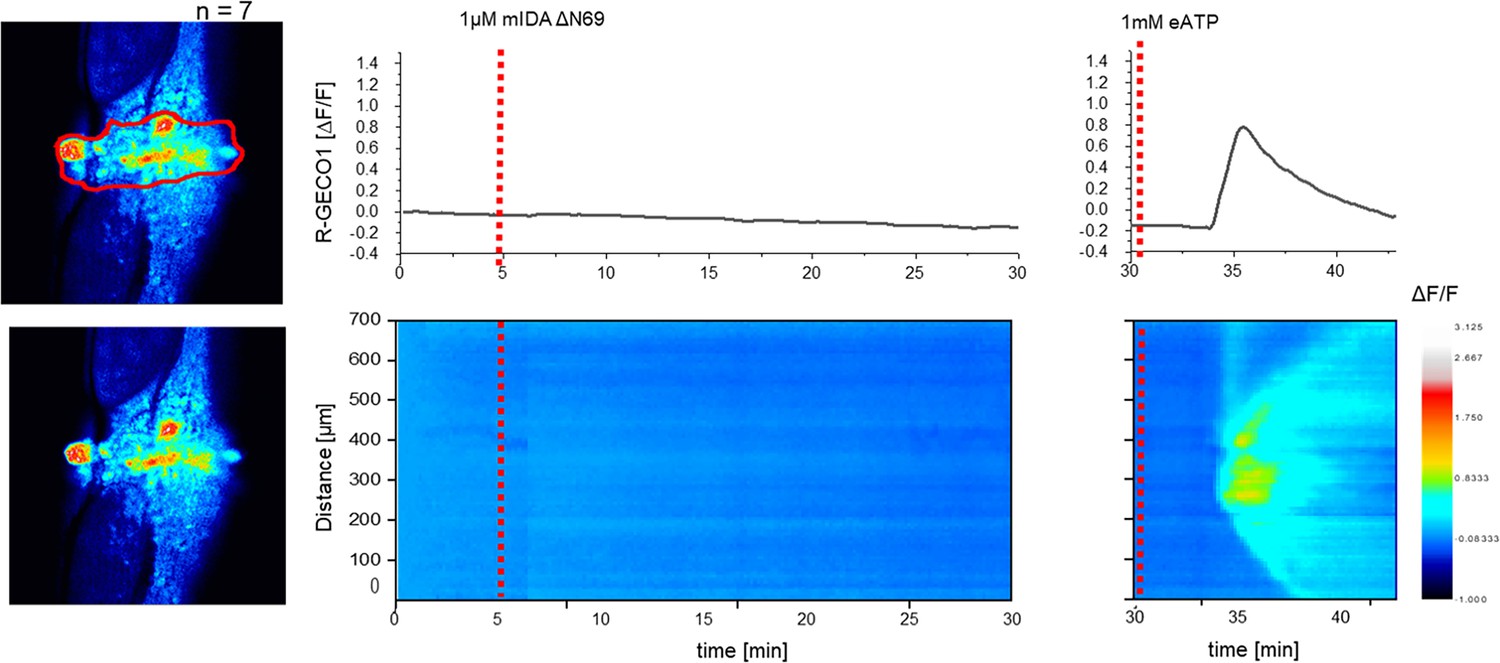
mIDAΔN69 does not induce a [Ca2+]cyt release in Arabidopsis abscission zones (AZ).
Normalized R-GECO1 fluorescence intensities (ΔF/F) were measured from regions of interest (ROI) (outlined in red) in the floral AZs. Shown are cytosolic calcium concentration ([Ca2+]cyt) dynamics in the ROI in response to application of 1 μM mIDAΔN69 or eATP over time. Red lines at 5 min indicates application of mIDAΔN69 peptide or application of eATP at 30 min (see also Figure 2—video 2). Representative response from 10 flowers. The increase in [Ca2+]cyt response to eATP propagates through the AZ as a single wave seen as normalized R-GECO1 fluorescence intensities (ΔF/F) shown as a heat map.
Figure 2—figure supplement 4
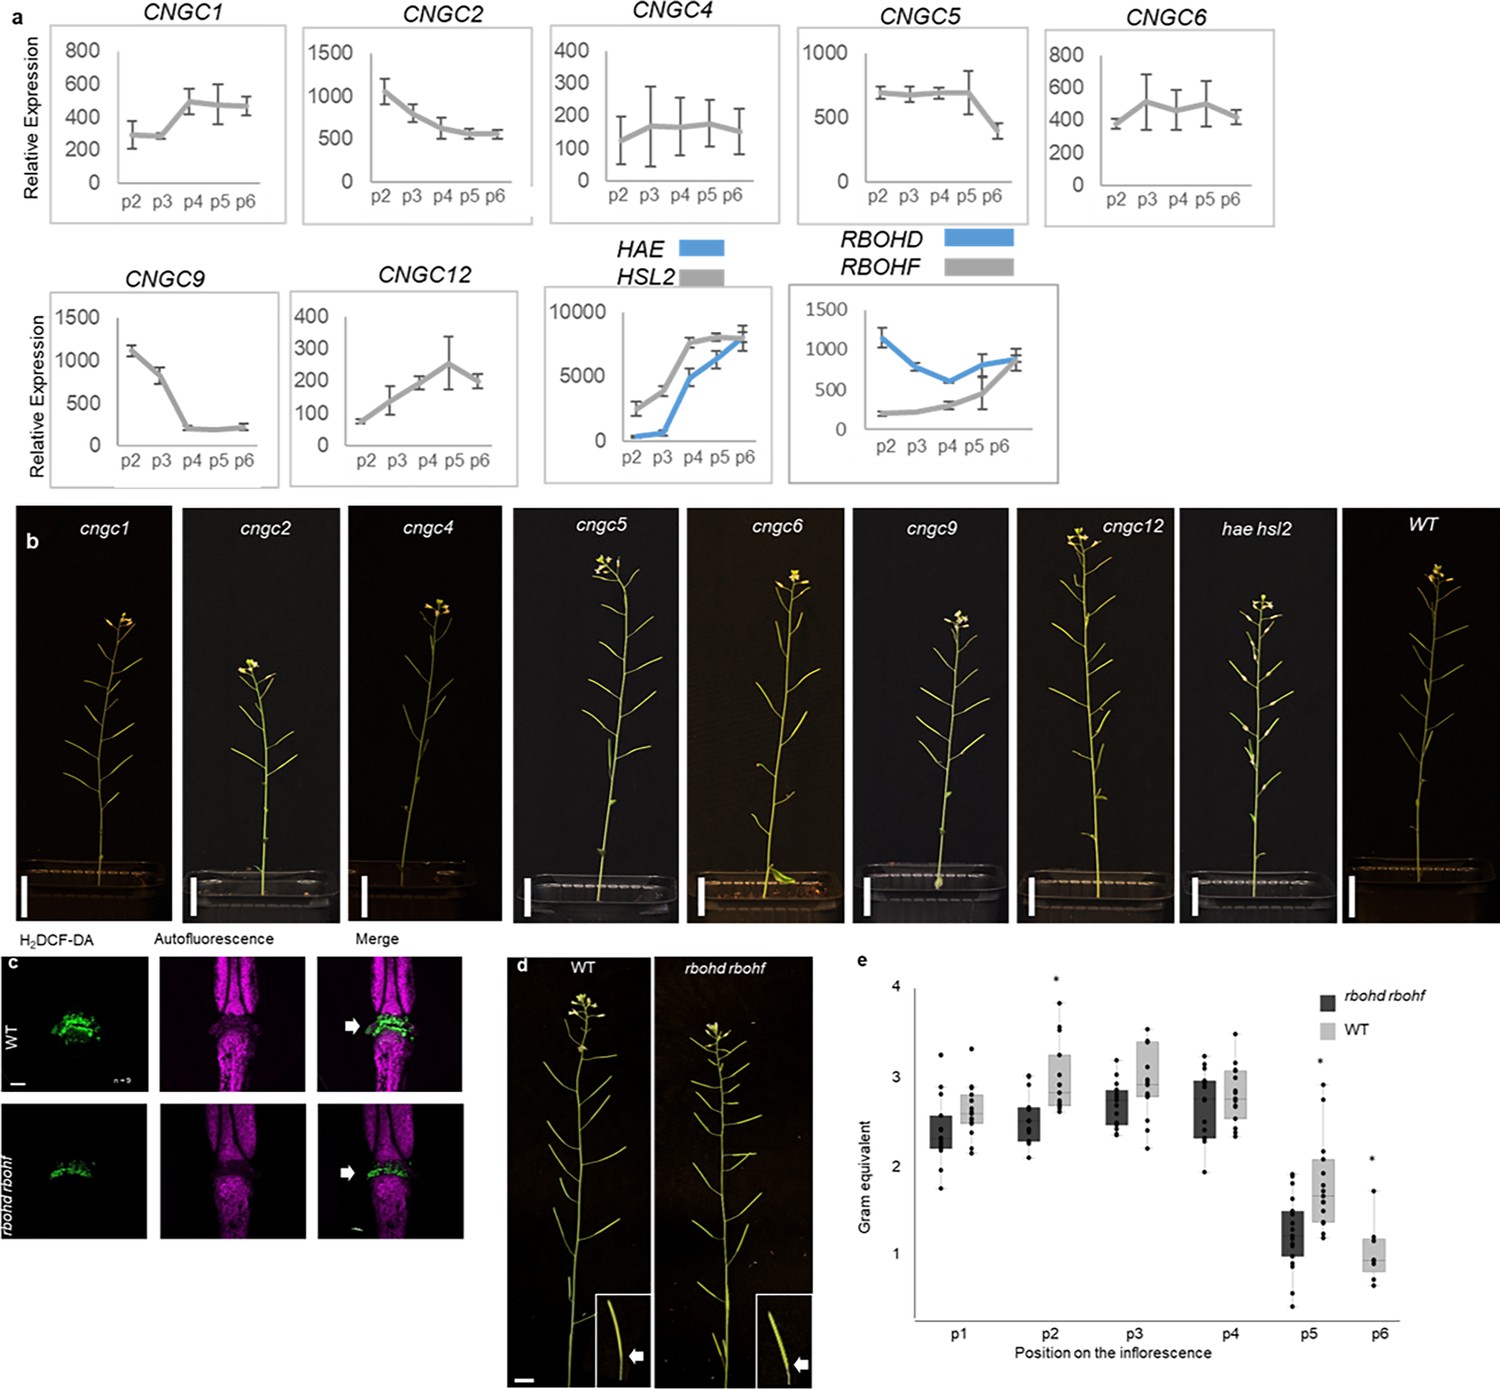
Investigation of CNGCs and RBOHs in the abscission process.
(a) Relative expression of CNGC1, CNGC2, CNGC4, CNGC5, CNGC6, CNGC9, CNGC12, RBOHD, and RBOHF in the floral organs during the onset of abscission (Cai and Lashbrook, 2008). X-axis represents the developmental stages of abscission where position 12 represent flowers where the stamen and petals are of the same length, position 13 represent flowers at anthesis, position 15 represent flowers with stigma extended above the anthers. Floral organ abscission occurs at position 15. Relative expression of HAE and HSL2 added for comparison. Nomenclature for the abscission process and relative expression values taken from Cai and Lashbrook, 2008. (b) No floral organ abscission phenotype is observed in the single cngc mutant plants compared to the hae hsl2 mutant which retains the floral organ indefinitely. Scale bar = 2 cm, 5 weeks old plants. (c) ROS production in the AZ (white arrow head) detected by using the fluorescent dye H2DCF-DA in WT and rbohd rbohf flowers at position 6 (See Figure 2—figure supplement 1a for positions). Scale bar = 100 µm, maximum intensity projections of z-stacks. Representative pictures from nine flowers. (d) Representative pictures of WT and rbohd rbohf inflorescences, scale bar for inflorescences = 1 cm. (e) Petal break strength (pBS) measurements of WT and the rbohd rbohf mutant at position 1–6 along the inflorescence. Force required to remove petals from the receptacle represented in gram equivalent. *=significantly different from WT at the given position (p<0.05, student t-test, two tailed).
Figure 2—video 1
[Ca2+]cyt dynamics in R-GECO1 expressing AZ in response to 1 µM mIDA.
Flowers at position 6 were treated with 1 µM mIDA and changes in [Ca2+]cyt was recorded over time. Response shown as normalized fluorescence intensities (∆F/F). Images were recorded with a frame rate of 5 s. Video corresponds to measurements shown in Figure 2a. Representative response from 8 flowers. Time shown as, hh:mm:ss.
Figure 2—video 2
[Ca2+]cyt dynamics in R-GECO1 expressing AZ in response to to 1 µM of the inactive IDA peptide, IDAΔN69.
Flowers at position 6 were treated with 1 µM IDAΔN69 and changes in [Ca2+]cyt was recorded over time. Response shown as normalized fluorescence intensities (∆F/F). Images were recorded with a frame rate of 5 s. Video corresponds to measurements shown in Figure 2—figure supplement 2. Representative response from 7 flowers. Time shown as, hh:mm:ss.
Figure 3
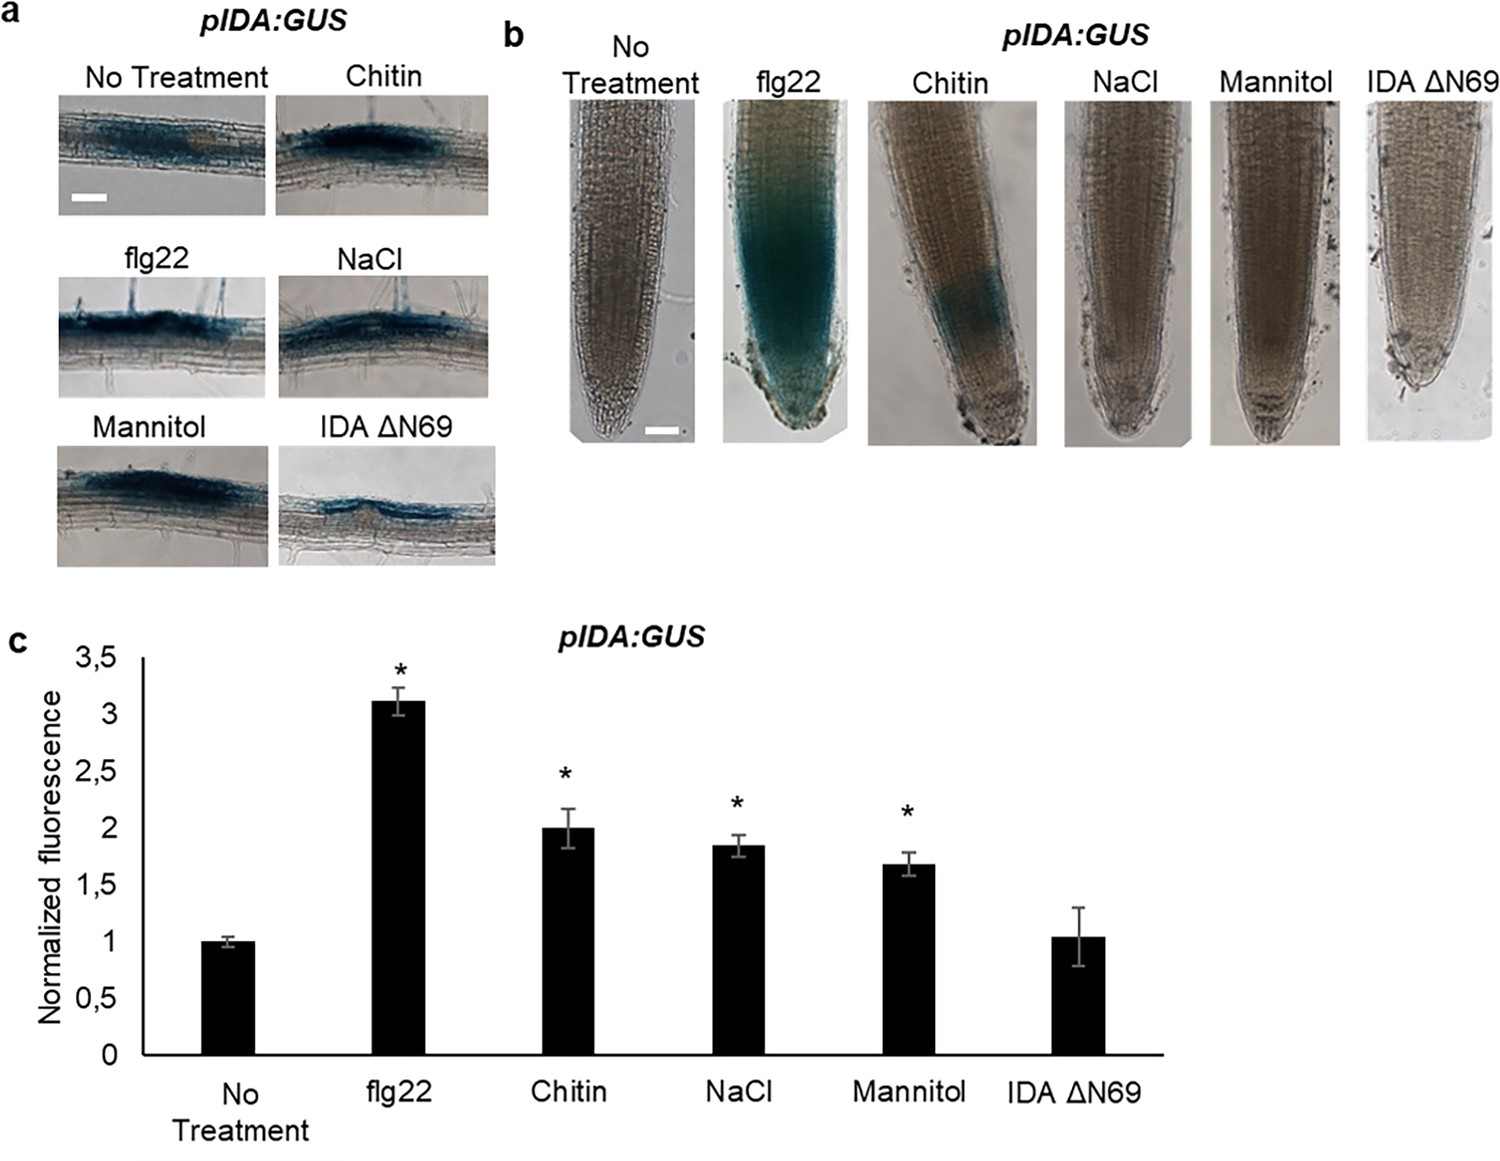
IDA is induced by biotic and abiotic stress.
Representative pictures of pIDA:GUS expression after 12 hr treatment with 1 µM flg22, chitin, NaCl, Mannitol and 1 µM IDAΔN69 in (a) cells surrounding emerging lateral roots, and (b) in the main root. (c) Normalized emitted fluorescence of fluorochrome 4-methyl umbelliferone (4-MU) in 7 days-old seedlings after 12 hr treatment with 1 µM flg22, chitin, NaCl, Mannitol and 1 µM of the inactive IDA peptide, IDAΔN69. Normalized to 1 on No Treatment sample. Controls were not subjected to any stimuli (No treatment). n=6, experiment repeated three times. *=significantly different from the non-treated (No treatment) sample (p<0.05, student t-test, two tailed). Controls were not subjected to any stimuli (No treatment). (a, b) Representative picture of n=10, experiment repeated three times, scale bar = 50 μm.
Figure 4
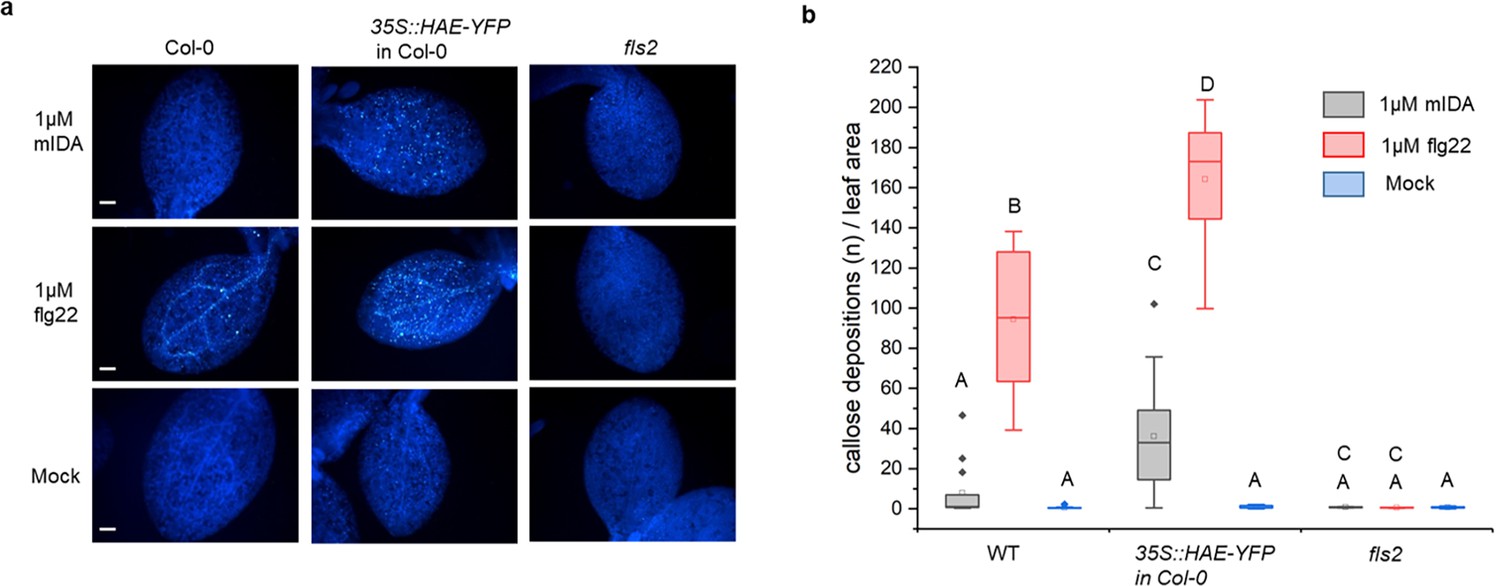
mIDA induce callose deposition in Arabidopsis cotelydons expressing 35 S::HAE-YFP.
Callose deposition in Col-0 WT, 35 S:HAE in Col-0 and fls2 treated with water (mock treatment), 1 μM mIDA or 1 uM flg22. (a) Callose deposition could be observed in cotyledons of eight day old Col-0 WT and 35 S:HAE in seedlings treated with 1 μM flg22, and to a smaller extend in 35 S:HAE treated with 1 µM mIDA. No callose deposition could be detected in the fls2 mutant. Representative images of 9–12 seedlings per genotype. Scale bar = 500 μm. (b) Total callose depositions for the different genotypes treated with water (mock treatment), 1 µM mIDA or 1 µM flg22. Statistically significant difference at (p<0.05). N=9–12.
Figure 5 with 2 supplements
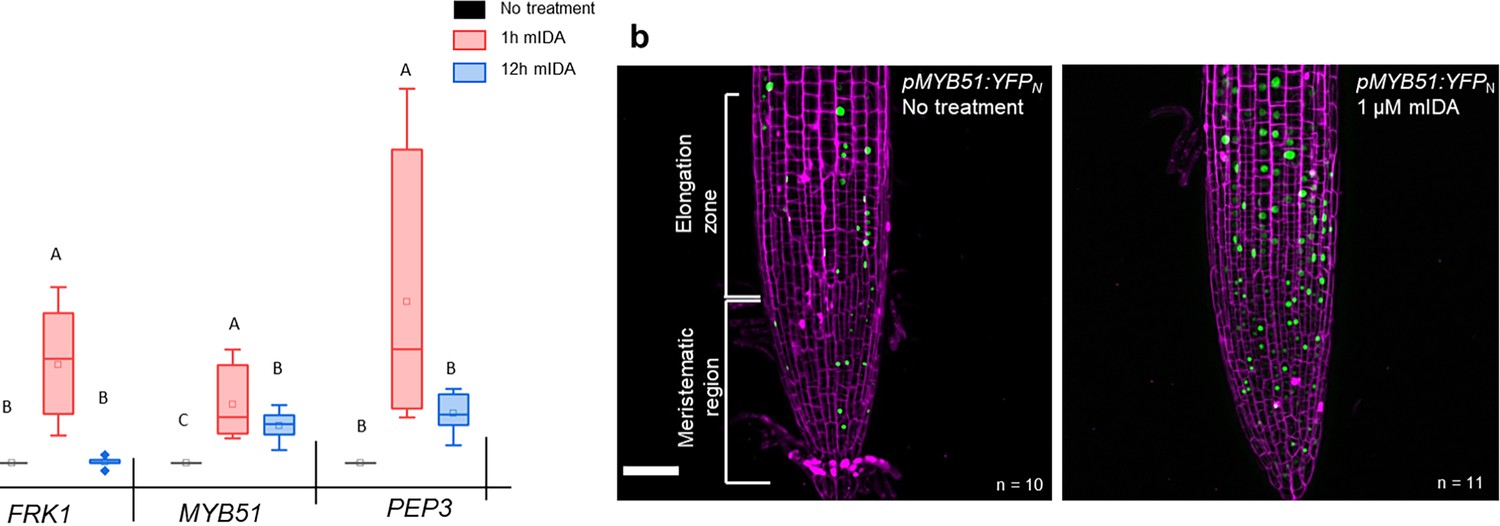
mIDA induced transcription of defense-associated marker genes.
(a) Transcripts of FRK1, MYB51, and PEP3 in WT Col-0 seedlings exposed to 1 µM mIDA for 1 hr (red) and to 1 µM mIDA for 12 hr (blue) compared to untreated tissue (black). RNA levels were measured by RT-qPCR analysis. ACTIN was used to normalize mRNA levels. The figure represents three biological replicates with four technical replicates. Statistical analyses was performed comparing induction times of individual genes using one-way ANOVA and post-hoc Tukey’s test (p<0.05). (b) pMYB51:YFPN expression is enhanced in roots after 7 hr exposure to 1 μM mIDA peptide compared to untreated roots (control), scale bar = 50 μm, maximum intensity projections of z-stacks, magenta = propidium iodide stain.
Figure 5—figure supplement 1
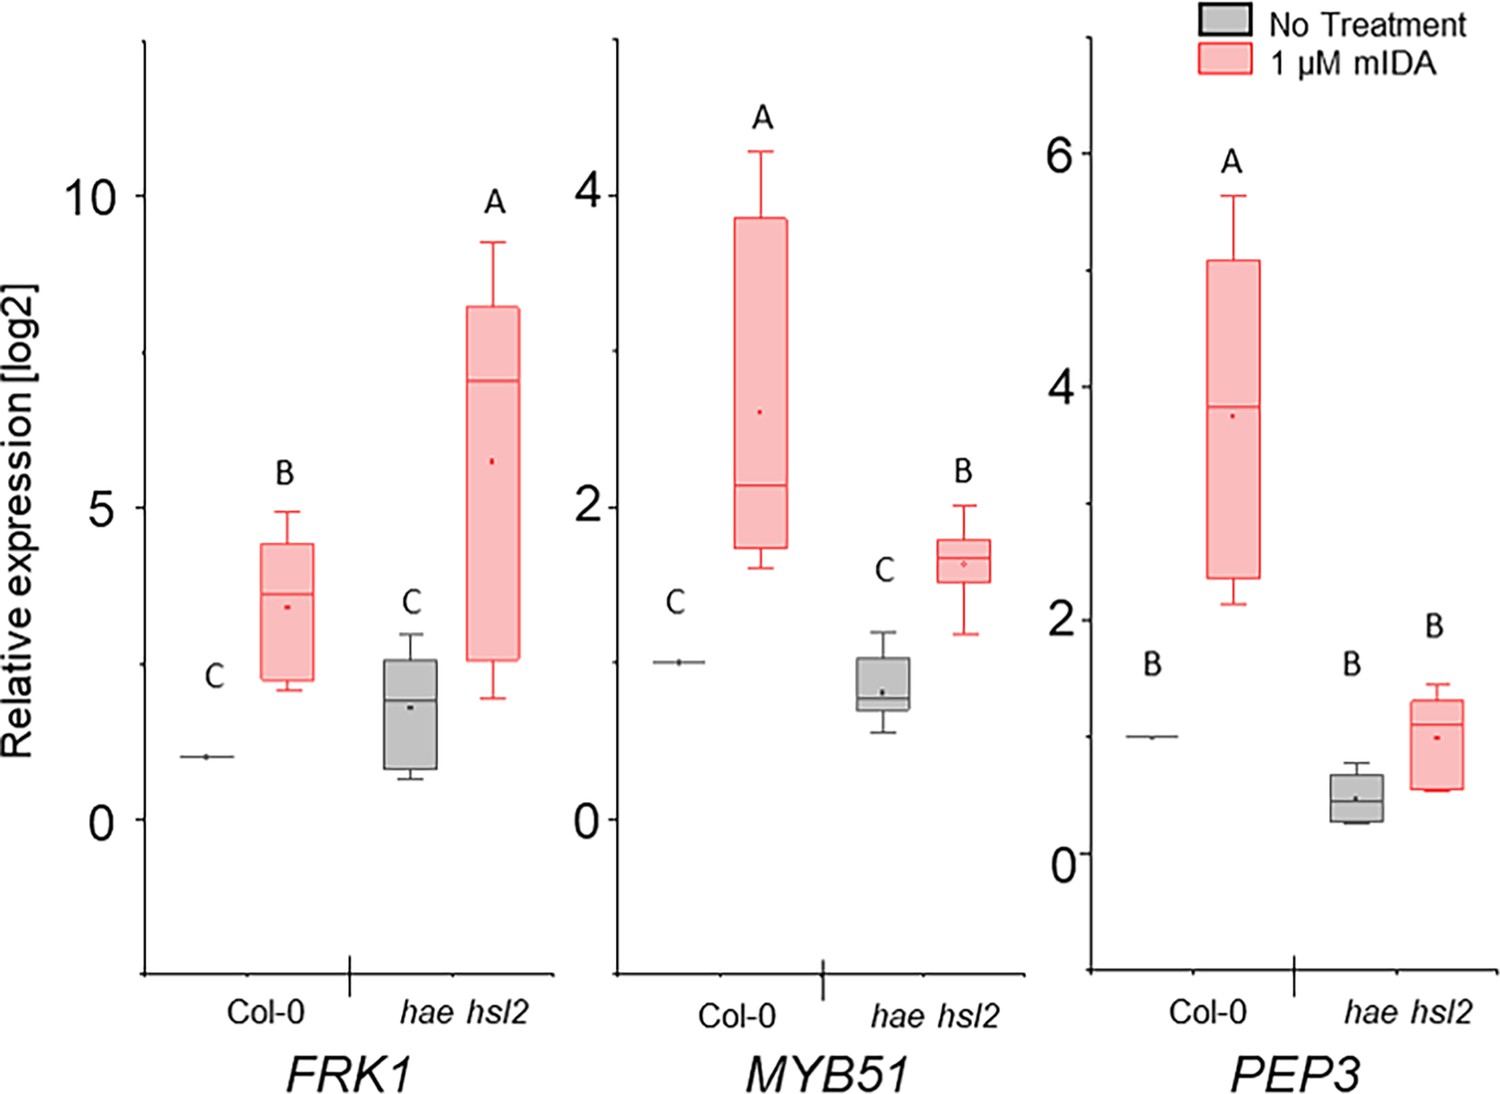
mIDA induced enhanced transcription of defense-associated marker genes is only partially dependent on the HAE and HSL2 receptors.
RT-qPCR data showing transcription of FRK1, MYB51, and PEP3 in Col-0 WT and hae hsl2 seedlings exposed to 1 µM mIDA for 1 hr compared to untreated seedlings (No treatment). ACTIN was used to normalize mRNA levels. Figure represents three biological replicates with four technical replicates. Statistical analyses was performed comparing samples within same gene, using two-way ANOVA and post-hoc Tukey’s test (p<0.05).
Figure 5—figure supplement 2
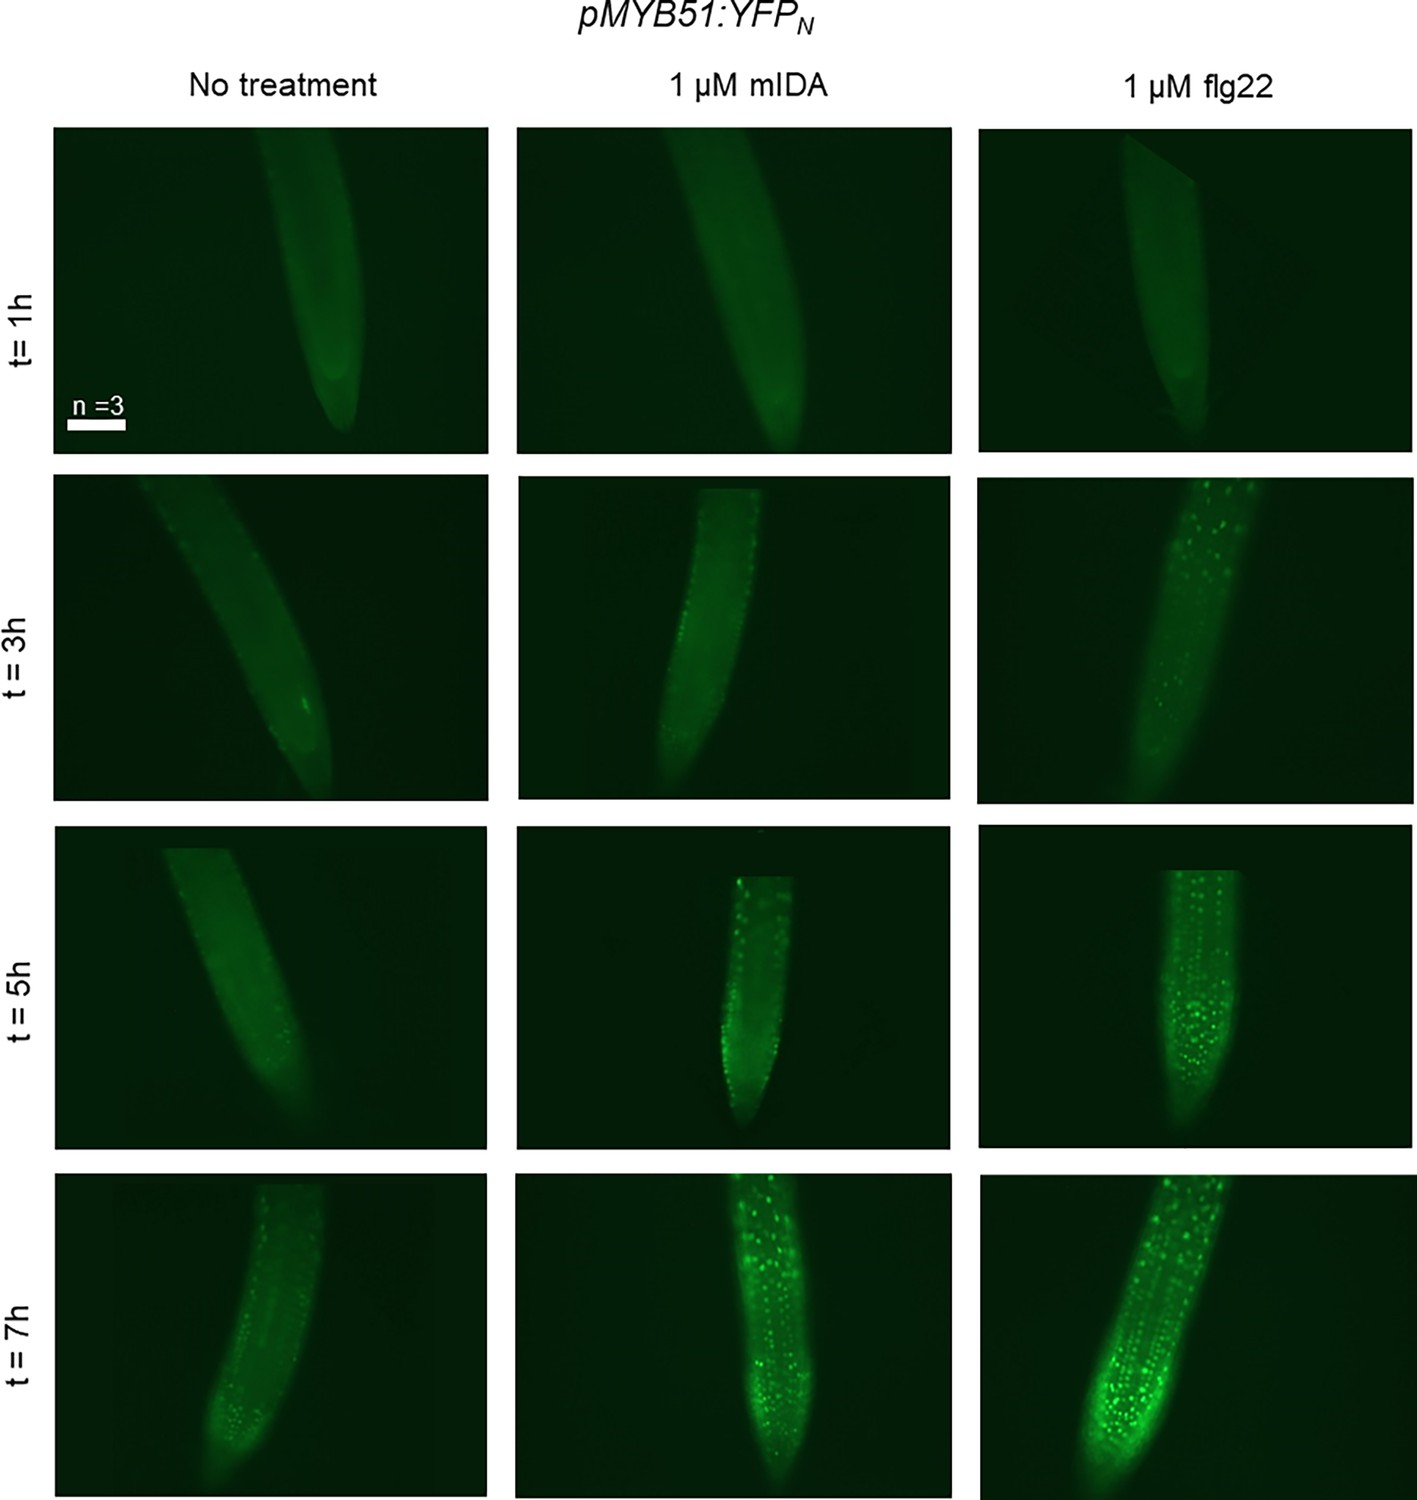
mIDA and flg22 induced expression of pMYB51:YFP.
Representative microscopic pictures of 7-days-old pMYB51:YFPN roots from seedlings transferred to liquid medium with 1 μM flg22 or 1 μM mIDA for 1, 3, 5, and 7 hr using a fluorescent microscope. Control seedlings were transferred to medium with no peptide and imaged in the same time frame. Fluorescent nuclei could be observed in a similar temporal pattern in roots subjected to mIDA and flg22. Scale bar = 100 μm, single plane images using a Zeiss Axioplan2 microscope with an AxioCam HRc, 20 x air objective and a YFP filter (Excitation: 500/20, Beamsplitter: FT515, Emission: 535/50), no imaging processing was performed, t=time in h. n=3, experiment repeated three times.
Figure 6 with 1 supplement
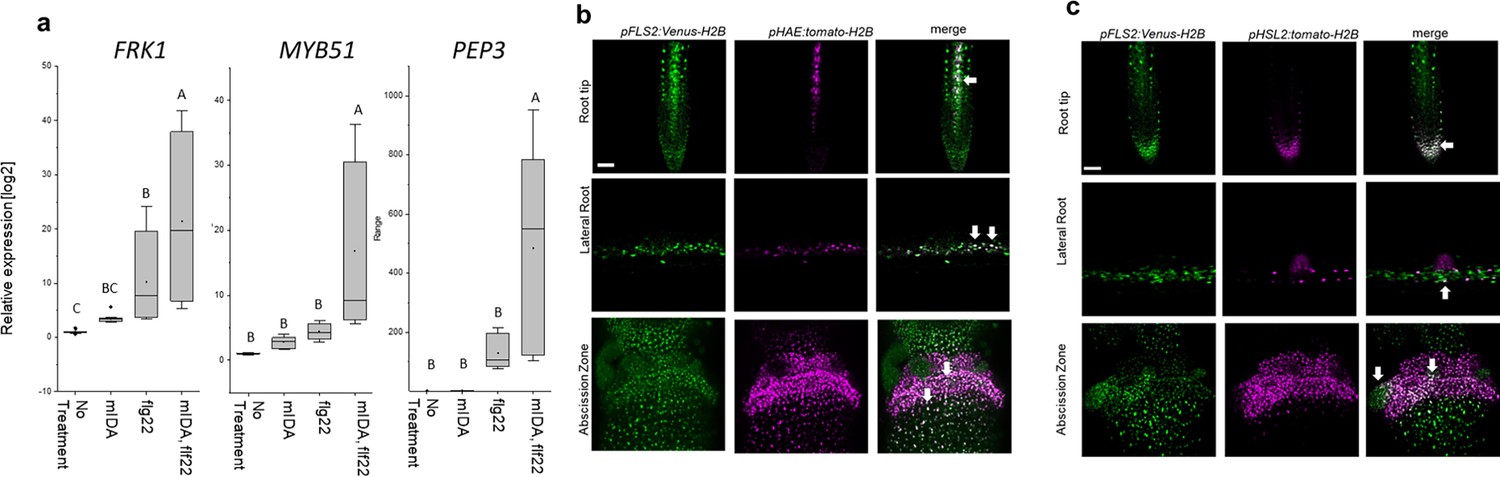
mIDA and flg22 co-treatment enhances the transcription of defense-associated marker genes.
(a) RT-qPCR data showing transcription of FRK1, MYB51, and PEP3 in Col-0 WT seedlings exposed to 1 µM mIDA, 1 µM flg22 or a combination of 1 µM mIDA and 1 µM flg22 for 1 hr compared to untreated seedlings (No treatment control). ACTIN was used to normalize mRNA levels. Figure represents three biological replicates with four technical replicates. Statistical analyses comparing No Treatment to peptide-treated samples was performed using one-way ANOVA and post-hoc Tukey’s test (p<0.05). (b) Microscopic analysis of 7-day-old pFLS2:Venus-H2B pHAE:Tomato-H2B expressing plants of root tip (upper panel) and lateral root (middle panel) of 7 days old plants, and flowers at position 6 (lower panel). Fluorescent nuclei representing co-expression of the Venus and Tomato marker could be observed in cells surrounding emerging LRs, in the stele of the root, as well as in the abscission zone. (c) Microscopic analysis of 7-days-old pFLS2:Venus-H2B pHSL2:Tomato-H2B expressing plants of root tip (upper panel) and lateral root (middle panel) of 7 days old plants, and flowers at position 6 (lower panel). Fluorescent nuclei representing co-expression of the Venus and Tomato marker could be observed in the root tip, in cells surrounding emerging LRs, as well as in the abscission zone. Root pictures scale bar = 50 μm, single plane image. Abscission zone images = maximum intensity projections of z-stacks. Scale bar = 50 μm.
Figure 6—figure supplement 1
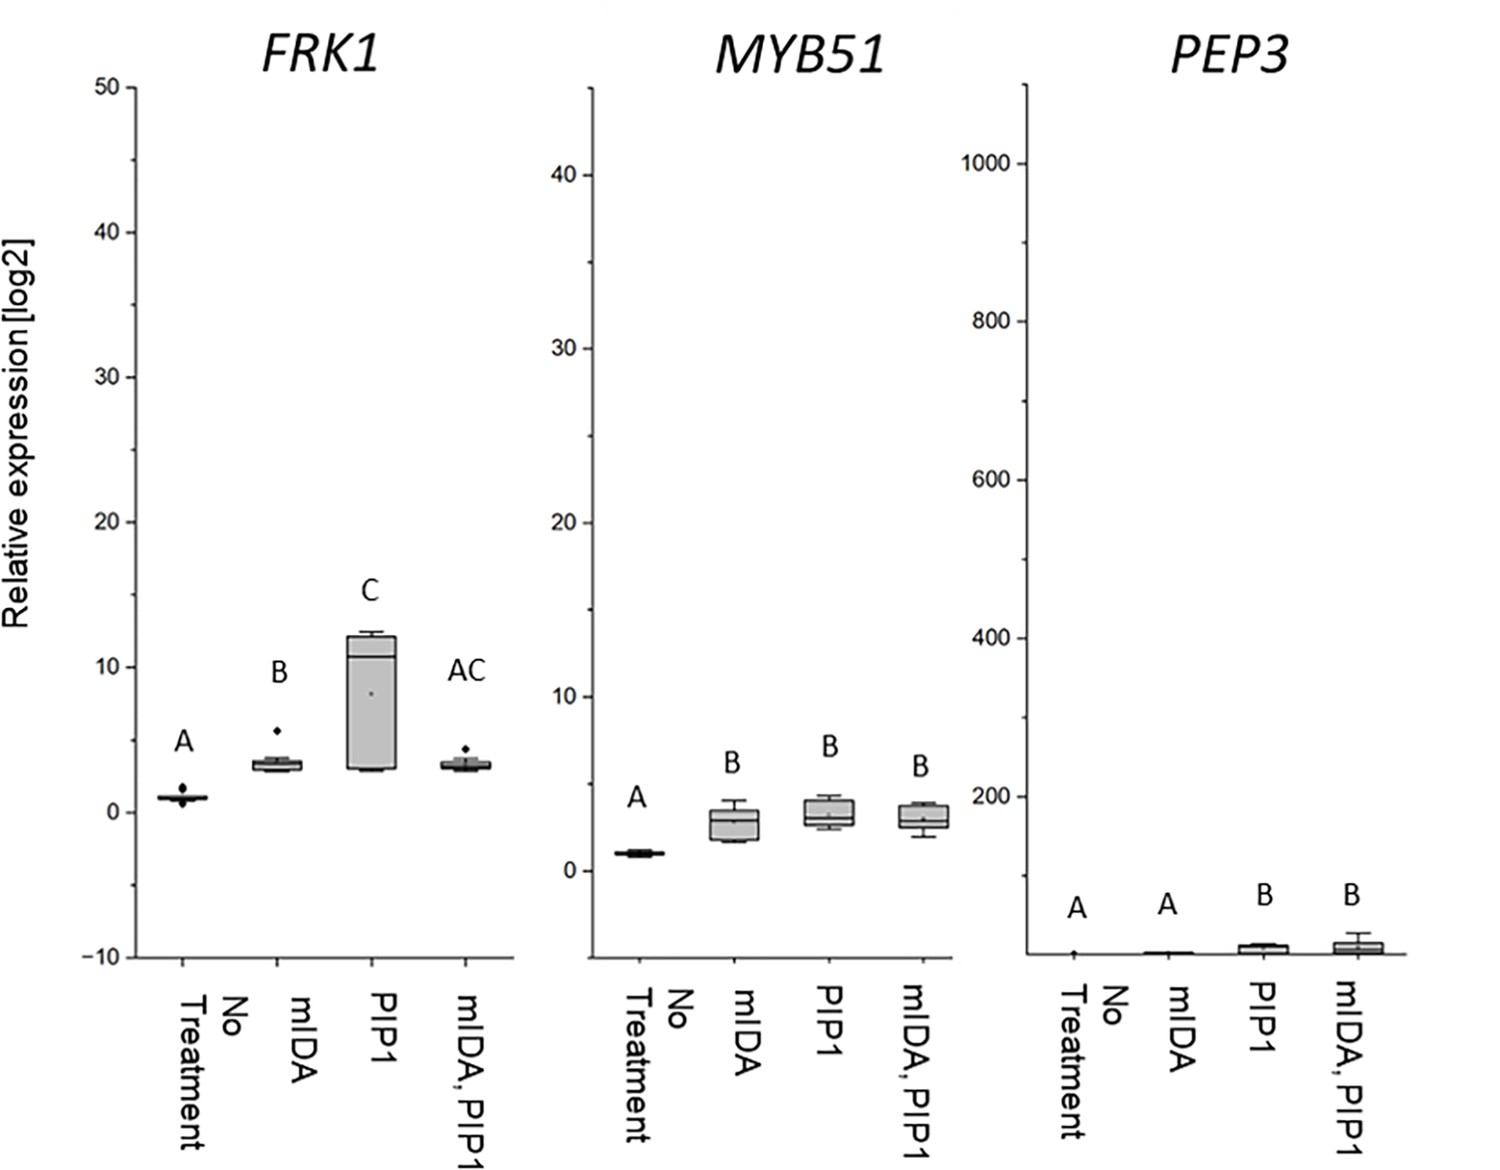
mIDA and PIP1 co-treatment do not enhances transcription of defense-associated marker genes.
RT-qPCR data showing transcription of FRK1, MYB51, and PEP3 in Col-0 WT seedlings exposed to 1 μM mIDA, 1 μM PIP1 or a combination of 1 μM mIDA and 1 μM PIP1 for 1 hr compared to untreated seedlings (No treatment control). ACTIN was used to normalize mRNA levels. Figure showing extended results from experiment shown in Figure 6. For comparison, No treatment and mIDA-treated samples were included in the figure (same results presented in Figure 6). Scale on y axis was kept as in Figure 6. Figure represents two to three biological replicates with four technical replicates. Statistical analyses comparing the samples was performed using one-way ANOVA and post-hoc Tukey’s test (p<0.05).
Figure 7 with 1 supplement
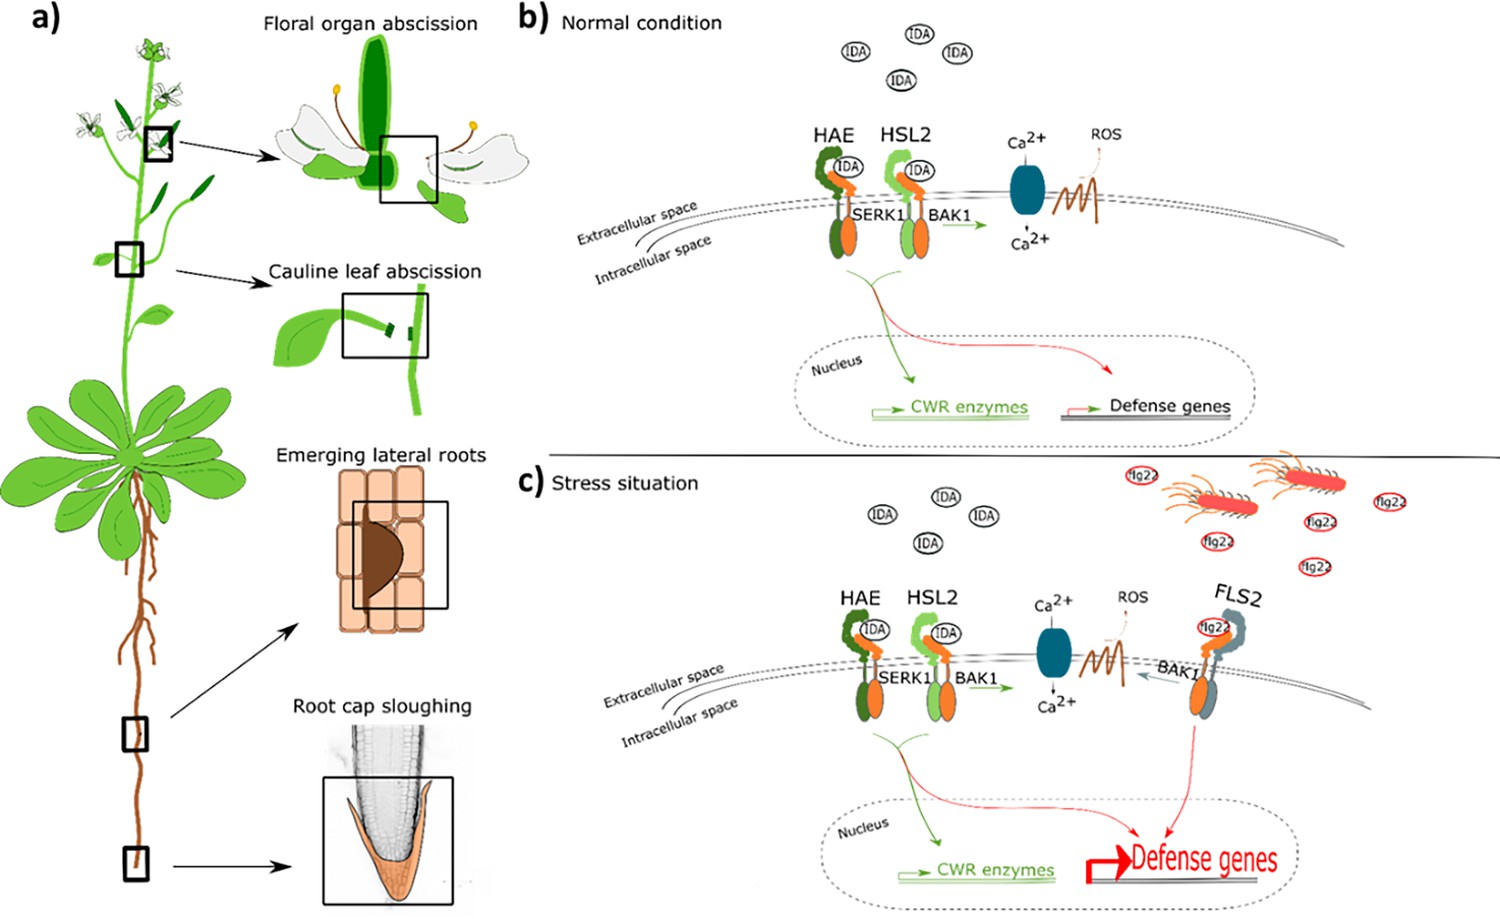
IDA regulates cell separation processes, but is also involved in major transcription of defense genes upon pathogen attack.
(a) IDA and the IDL peptides control cell separation processes during plant development and in response to abiotic and biotic stress (Butenko et al., 2003; Patharkar and Walker, 2016; Patharkar et al., 2017; Shi et al., 2018). Tissue undergoing cell separation includes floral organ abscission, cauline leaf abscission, emerging of lateral roots and root cap sloughing. (b) During normal conditions, IDA control floral organ abscission and emergence of lateral roots by relaying a signal through receptor complexes including HAE, HSL2, SERK1 and BAK1 to modulate the expression of cell wall remodeling (CWR) genes as well as moderately expression of defense genes. IDA activates a receptor dependent production of ROS and an increase in [Ca2+]cyt. (b) Upon stress, such as pathogen attack, the activation of HAE and HSL2 acts in addition to activation of defense related receptors, such as FLS2, to enhance the expression of defense related genes significantly. This ensure optimal protection of cells undergoing cell separation, which may be major entry routes during a pathogen attack.
Figure 7—figure supplement 1
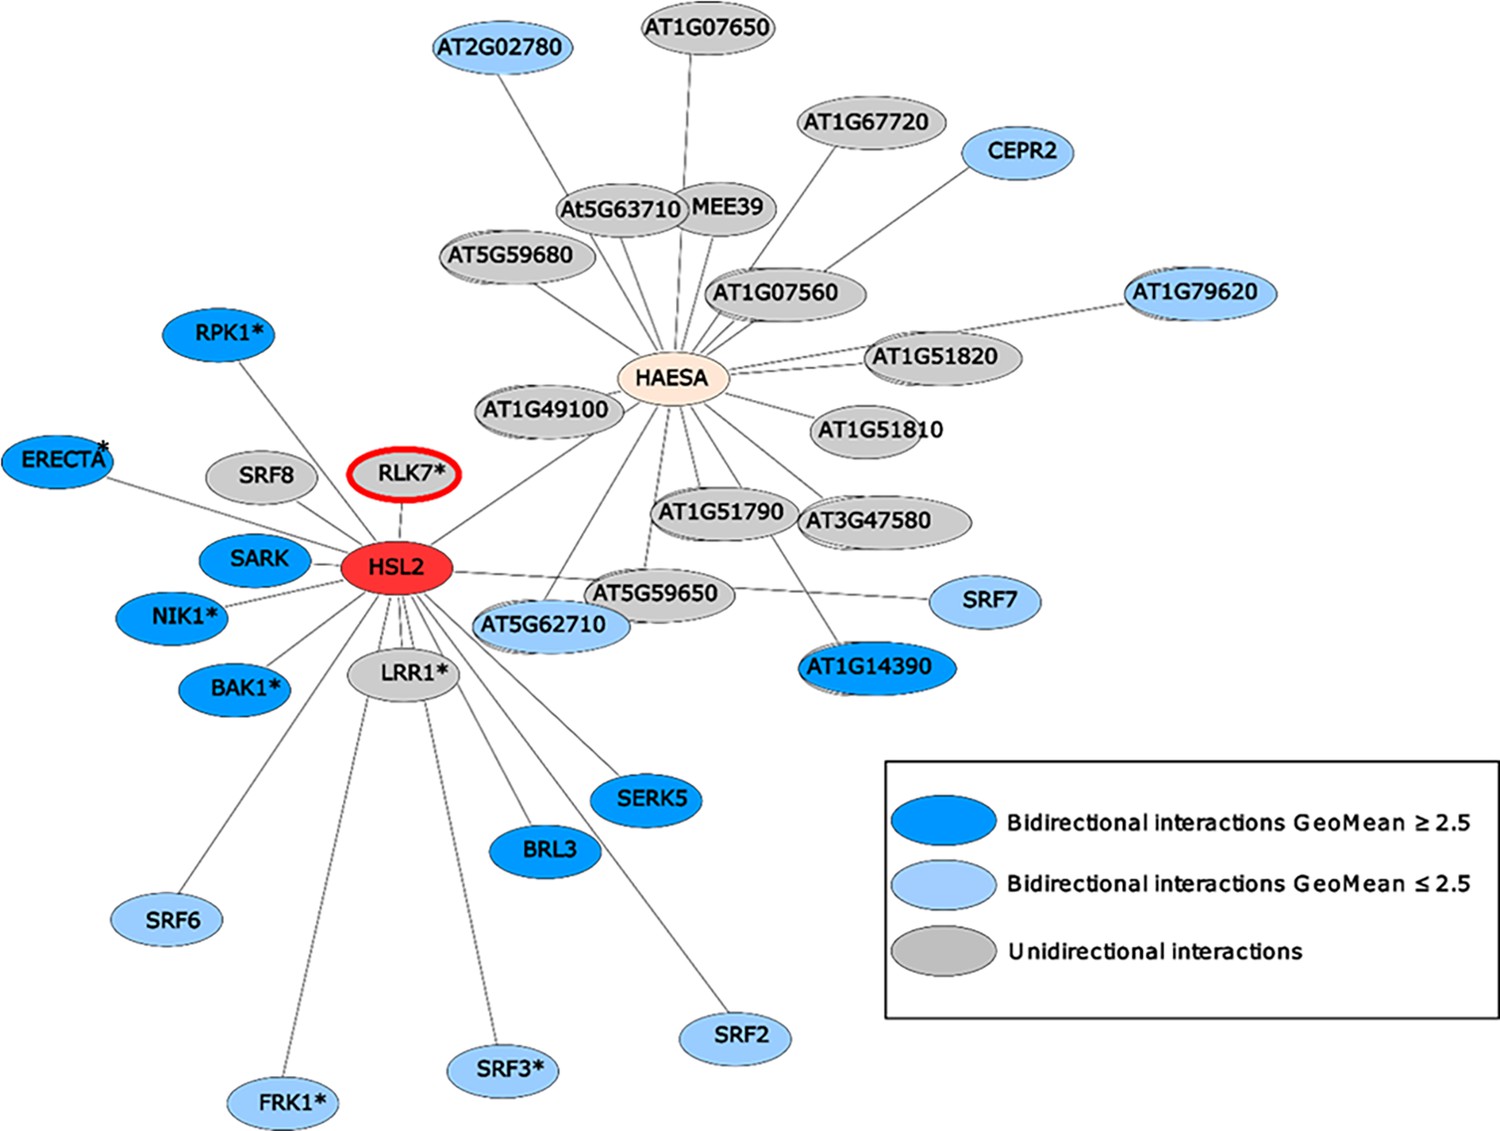
HAE (yellow) and HSL2 (red) display very distinct repertoire of immune and growth-related interacting LRR-RKs.
HEA and HSL2 specific interacting partners determined using a sensitized high-throughput extracellular domain interaction assay (Smakowska-Luzan et al., 2018). HSL2 and HAE show distinct interacting LRR-RKs where only HSL2 was found to interact with RLK7 (red halo). * indicates receptors known to play a function in biotic and/or abiotic responses in planta based on previous published work, dark blue nodes refer to bidirectional interactions with GeoMean ≥ 2.5, light blue nodes- refer to bidirectional interactions with GeoMean ≤ 2.5, and grey nodes refer to unidirectional interactions.
Additional files
-
Supplementary file 1
Peptide sequences.
- https://cdn.elifesciences.org/articles/87912/elife-87912-supp1-v1.docx
-
Supplementary file 2
Primers sequences and function.
- https://cdn.elifesciences.org/articles/87912/elife-87912-supp2-v1.docx
-
Supplementary file 3
Relative expression of genes of the CNGC and RBOH gene families during the onset of abscission (data from Cai and Lashbrook, 2008).
See Figure 2—figure supplement 1a for flower developmental stages (p2-p6). CNGC = CYCLIC NUCLEOTIDE GATED CHANNEL, RBOH = RESPIRATORY BURST OXIDASE PROTEIN, IDA = INFLORESCENCE DEFICIENT IN ABSCISSION, HSL2 = HAESA LIKE 2.
- https://cdn.elifesciences.org/articles/87912/elife-87912-supp3-v1.docx
-
MDAR checklist
- https://cdn.elifesciences.org/articles/87912/elife-87912-mdarchecklist1-v1.docx
Download links
A two-part list of links to download the article, or parts of the article, in various formats.
Downloads (link to download the article as PDF)
Open citations (links to open the citations from this article in various online reference manager services)
Cite this article (links to download the citations from this article in formats compatible with various reference manager tools)
A dual function of the IDA peptide in regulating cell separation and modulating plant immunity at the molecular level
eLife 12:RP87912.
https://doi.org/10.7554/eLife.87912.3


