Whole genomes from the extinct Xerces Blue butterfly can help identify declining insect species
- Institute of Evolutionary Biology, Spain
- Institute of Genomics, University of Tartu, Estonia
- Section for Evolutionary Genomics, The Globe Institute, Faculty of Health and Medical Sciences, University of Copenhagen, Denmark
- Centre for Biodiversity Genomics, University of Copenhagen, Denmark
- Wellcome Sanger Institute, United Kingdom
- Departament of Genetics, Microbiology and Statistics-Institut de Recerca de la Biodiversitat (IRBio), Universitat de Barcelona, Spain
- Institut Català de Paleontologia Miquel Crusafont, Universitat Autònoma de Barcelona, Spain
- Museu de Ciències Naturals de Barcelona, Spain
- Catalan Institution of Research and Advanced Studies (ICREA), Spain
- Department of Entomology, National Museum of Natural History, Smithsonian Institution, United States
- CNAG-CRG, Centre for Genomic Regulation, Barcelona Institute of Science and Technology (BIST), Spain
Figures
Figure 1
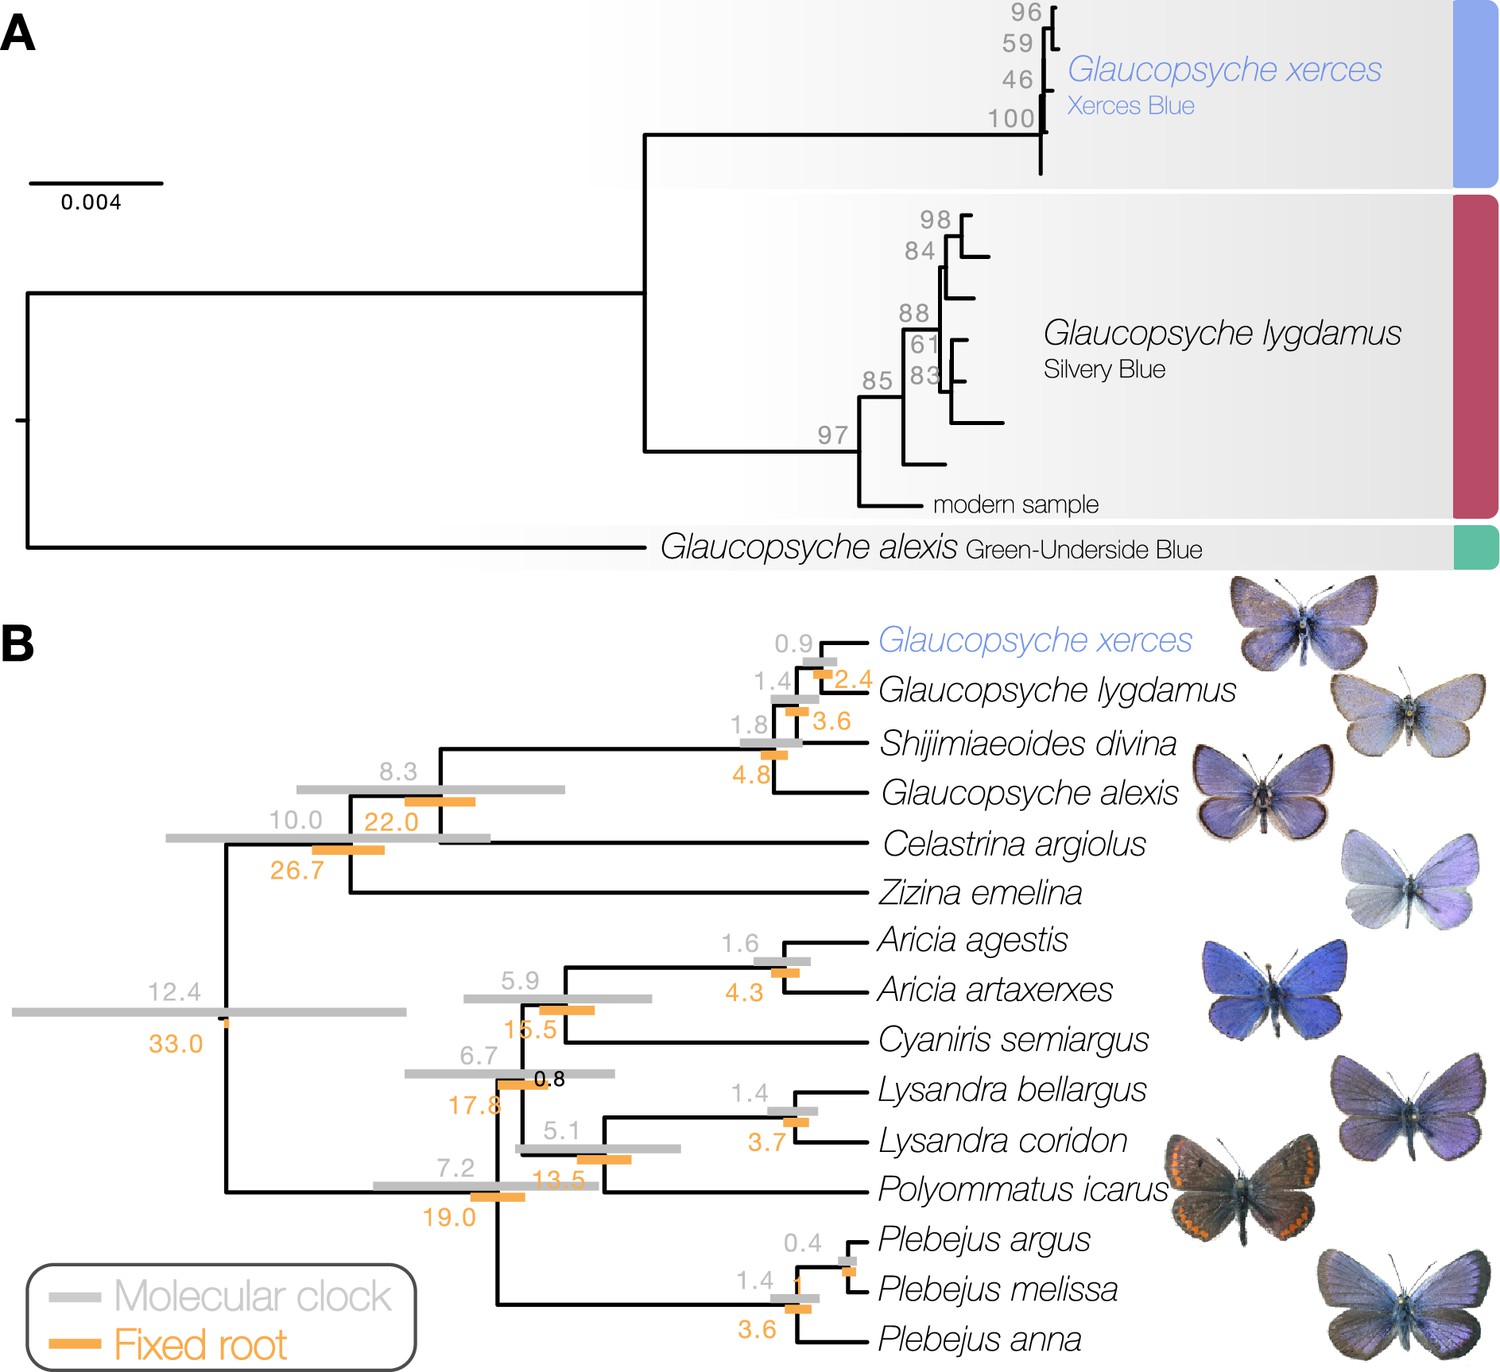
Phylogenetic placement of the Xerces Blue.
(a) Maximum likelihood tree from whole mitochondrial genomes of Xerces Blue, Silvery Blue, and Green-Underside Blue. Node labels are bootstrap support values. (b) Time-calibrated phylogeny from Bayesian inference using mitochondrial protein-coding genes of Xerces Blue and related butterflies. Node values show median age estimates from dating analysis with a molecular clock (above nodes) or from fixing the age of the root (below nodes). Bars are 95% HPD intervals for node ages. All posterior probabilities were 1, except for one node annotated in black.
Figure 2
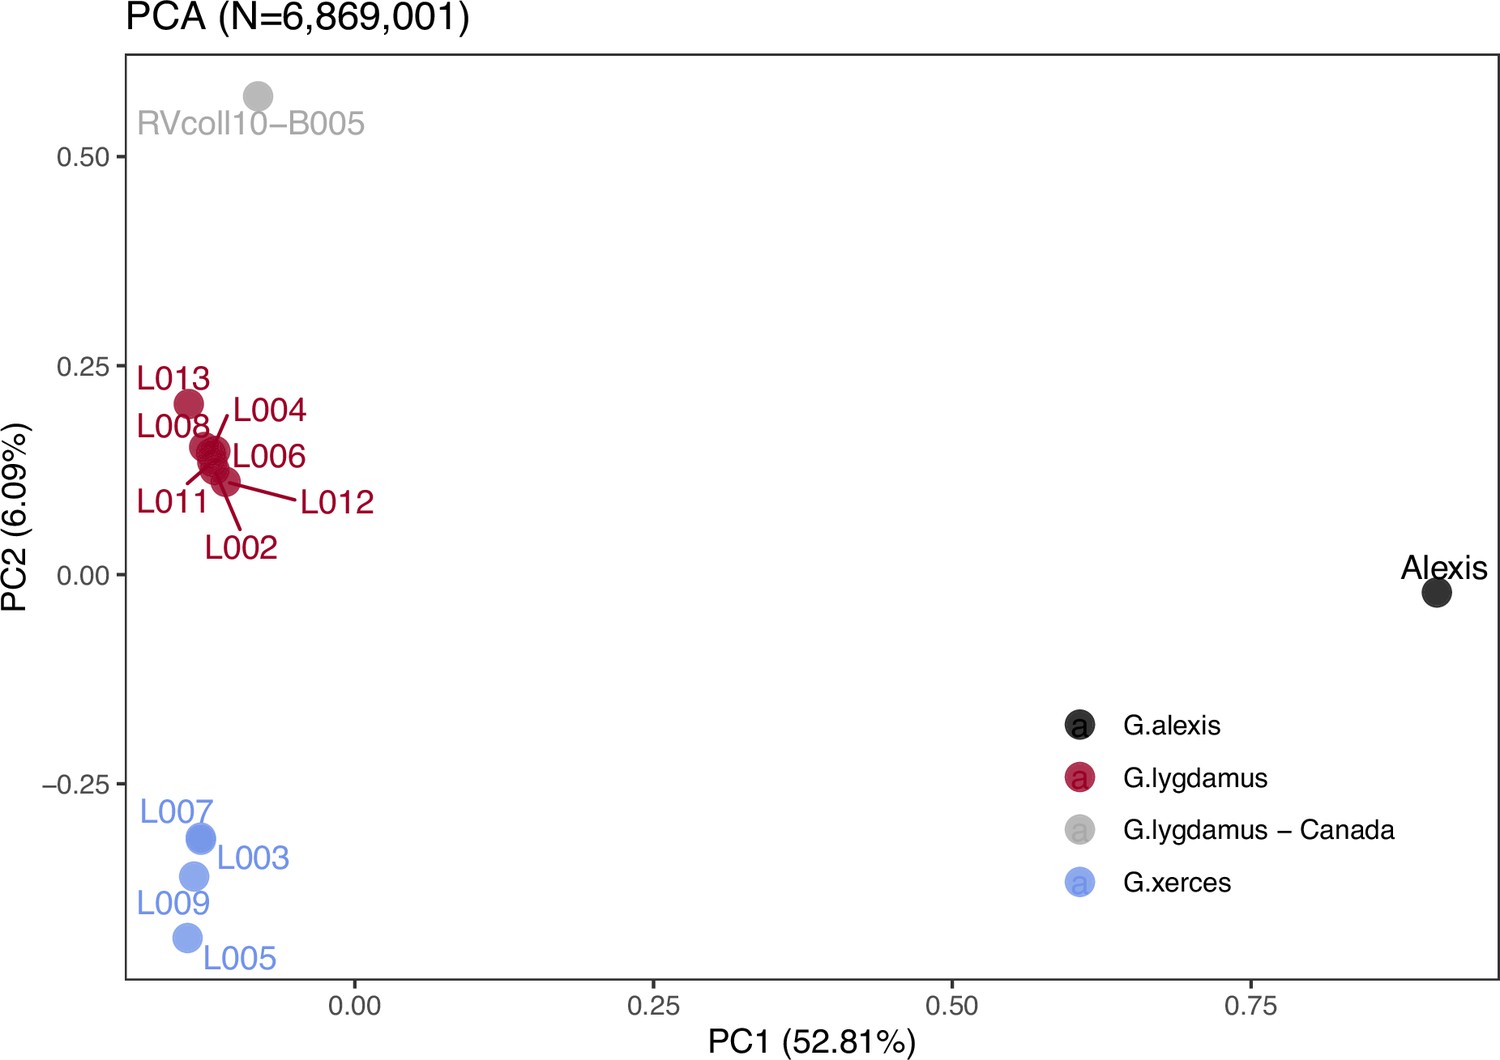
Plotting of PC1 and PC2 of the principal component analysis (PCA).
The PCA was generated with nuclear DNA data (N = 6,682,591 SNPs (single nucleotide polymorphisms)) from 11 historical butterfly specimens (4 G. xerces and 7 G. lygdamus), a modern G. lygdamus from Canada (RVcoll10-B005) and a modern G. alexis reference genome. The PCA shows a clear separation of both historical species and the reference in the first PC (explaining 52.81% of the variance), and separation of G. xerces and G. lygdamus by the second PC (explaining 6.09% of the variance), supporting they are separated lineages.
Figure 3 with 1 supplement
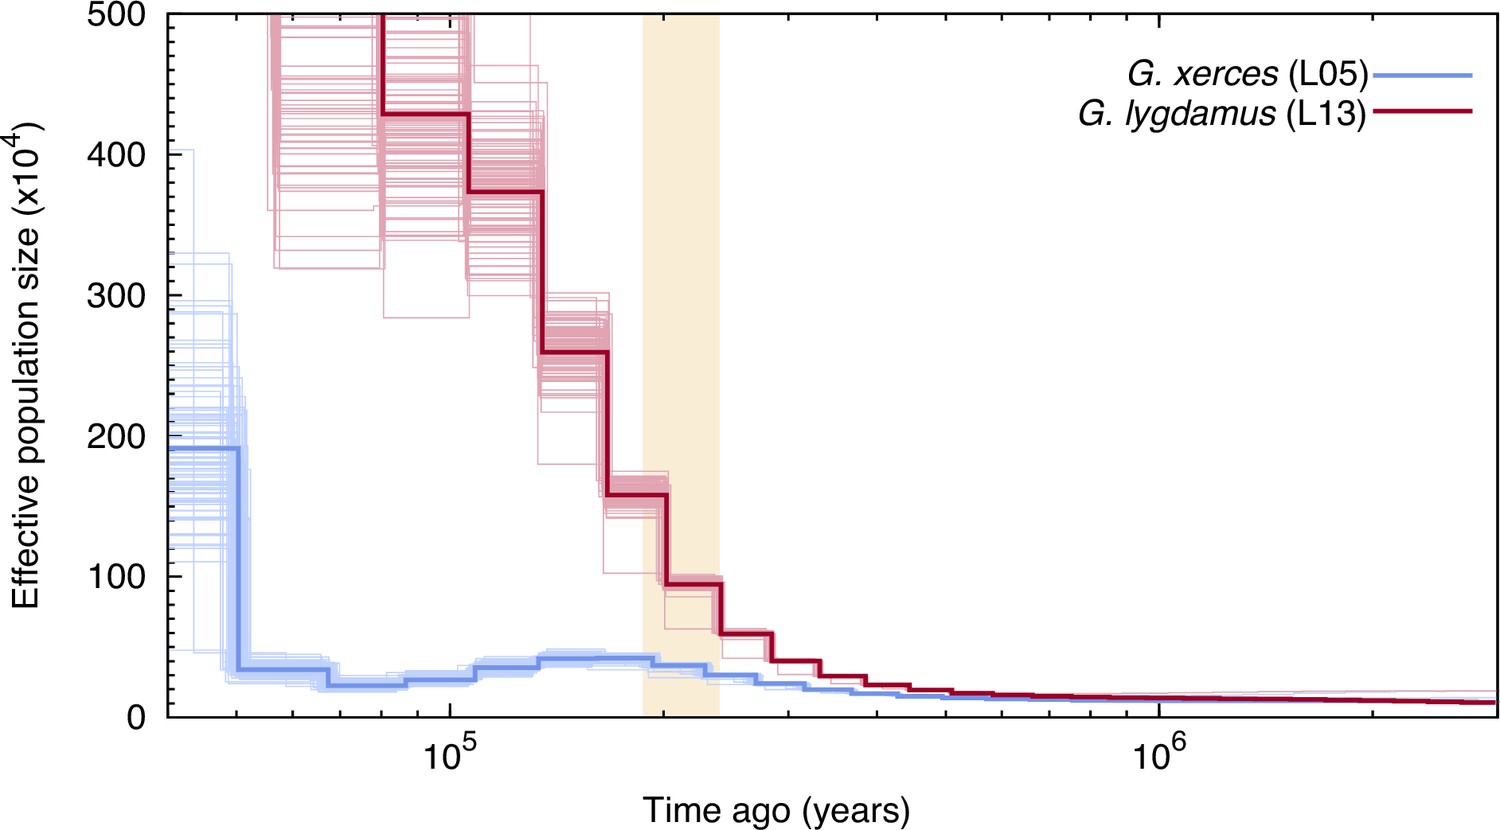
Pairwise sequentially Markovian coalescent (PSMC) plot of one Xerces Blue (Glaucopsyche xerces) (L05) specimen and one Silvery Blue specimen (Glaucopsyche lygdamus).
The two historical samples are those with higher average coverage. Individual PSMC plots were bootstrapped 100 times each (lighter lines). One year of generation time and a mutation rate of µ = 1.9 × 10⁻⁹ were used. The peak of the Marine Isotopic Stage 7 interglacial is marked in yellow.
Figure 3—figure supplement 1
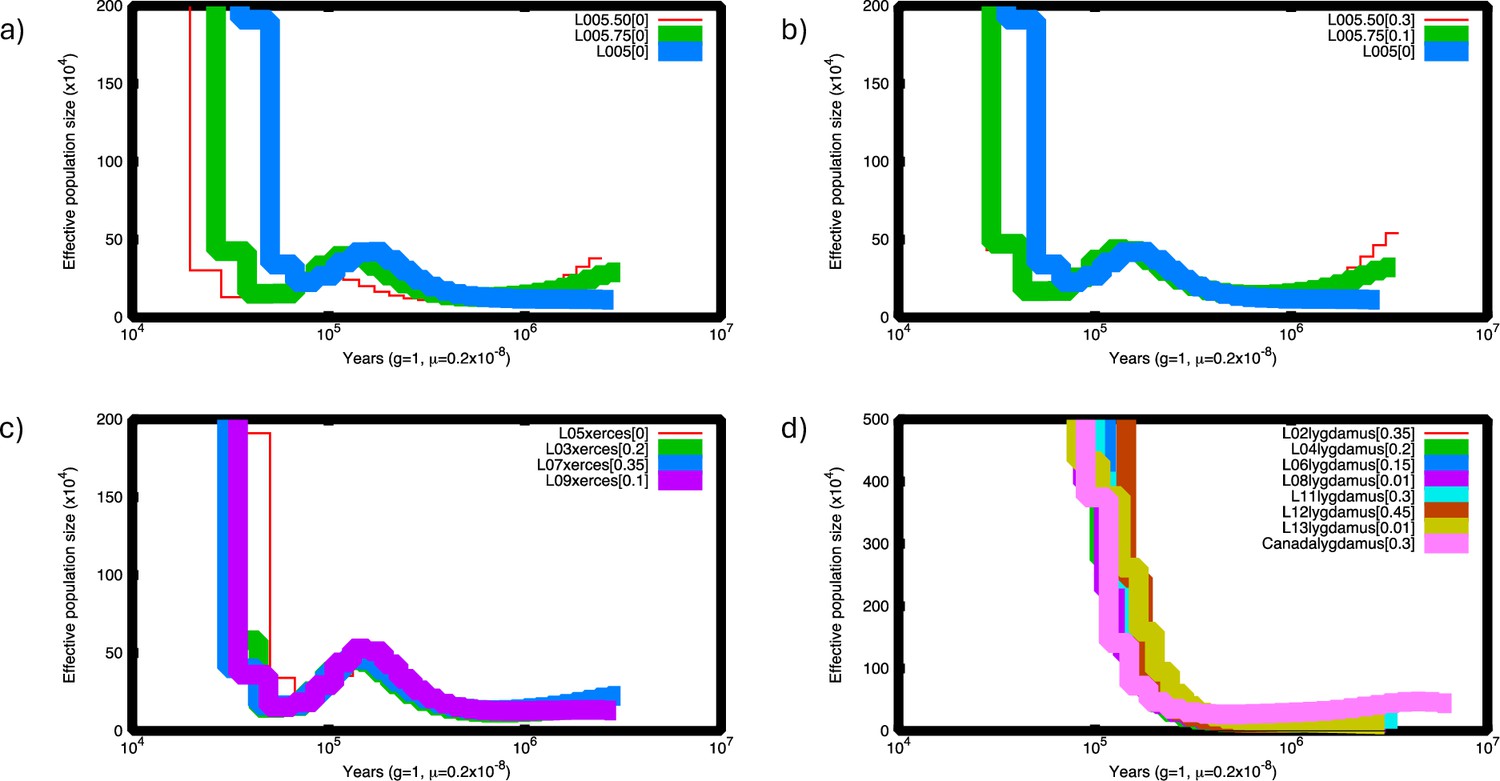
Pairwise sequentially Makovian coalescent (PSMC) plots of Xerces Blue and Silvery Blue.
(a) PSMC of Xerces Blue L05 down-sampled to half (red) and 75% of coverage (green). (b) PSMC of down-sampled Xerces Blue L05 corrected. Lower-coverage results in underestimation of heterozygote site and thus lower historical effective population sizes. This situation can be corrected assuming a false negative rate (FNR) by visually adjusting the curves using the psmc_plot.py program from the PSMC package. (c) PSMC of Xerces Blue L03, L05, L07, and L09 corrected assuming FNR. (d) PSMC of historical Silvery Blue L02, L04, L006, L08, L11, L12, and L13 and modern Silvery Blue from Canada (RVcoll10-B005) corrected assuming FNR. Despite current differences in coverage, individuals from each species follow the same trajectory.
Figure 4 with 1 supplement
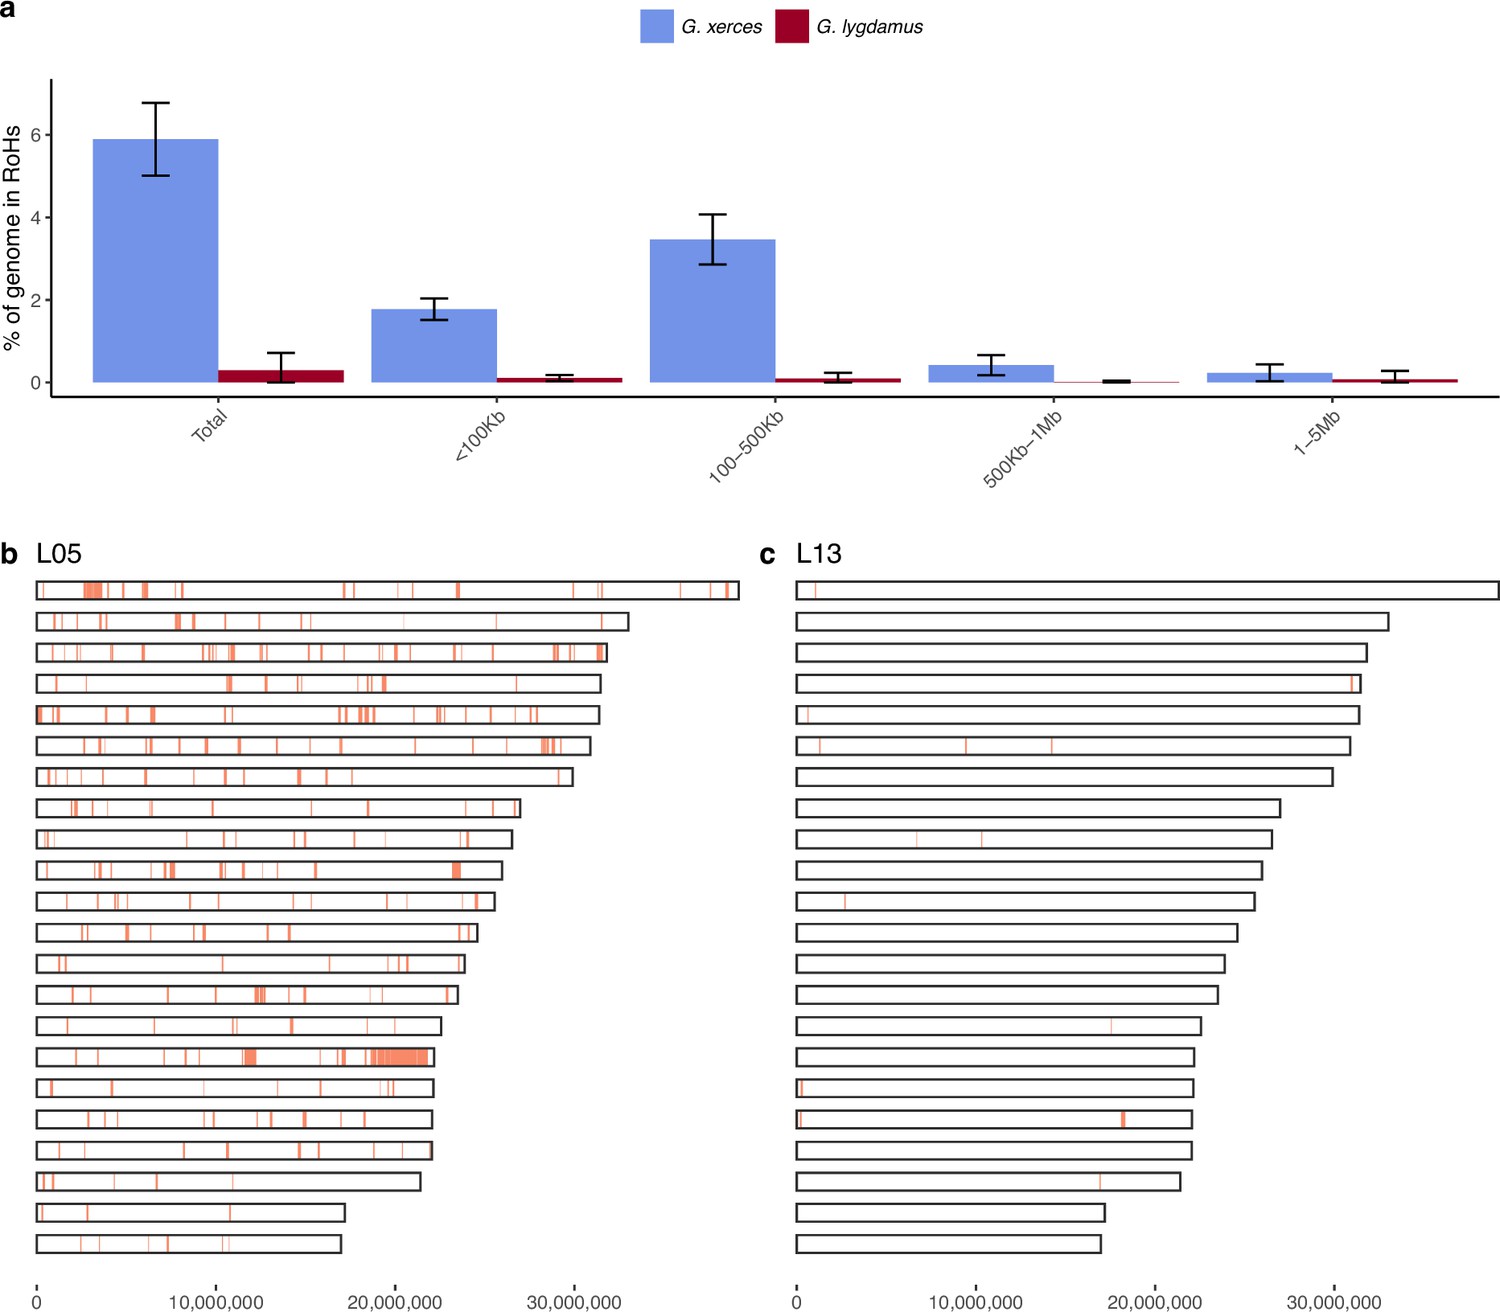
Runs of homozygosity (RoH) in the genomes of Xerces Blue and Silvery Blue (modern and historical).
(a) Percentage of the autosomal genome in RoH by size bins: very short RoH (<100 kb), short RoH (100–500 kb), intermediate RoH (500 kb to 1 Mb), and long (1–5 Mb). Short RoH reflect LD patterns, intermediate size RoH describe background inbreeding due to genetic drift, and long RoH appear in the case of very recent inbreeding due to consanguinity. Error bars show the standard deviation. (b) Distribution of RoH in the autosomal genome of a Xerces specimen, L05. (c) Distribution of RoH in the autosomal genome of a Silvery specimen L13.
Figure 4—figure supplement 1
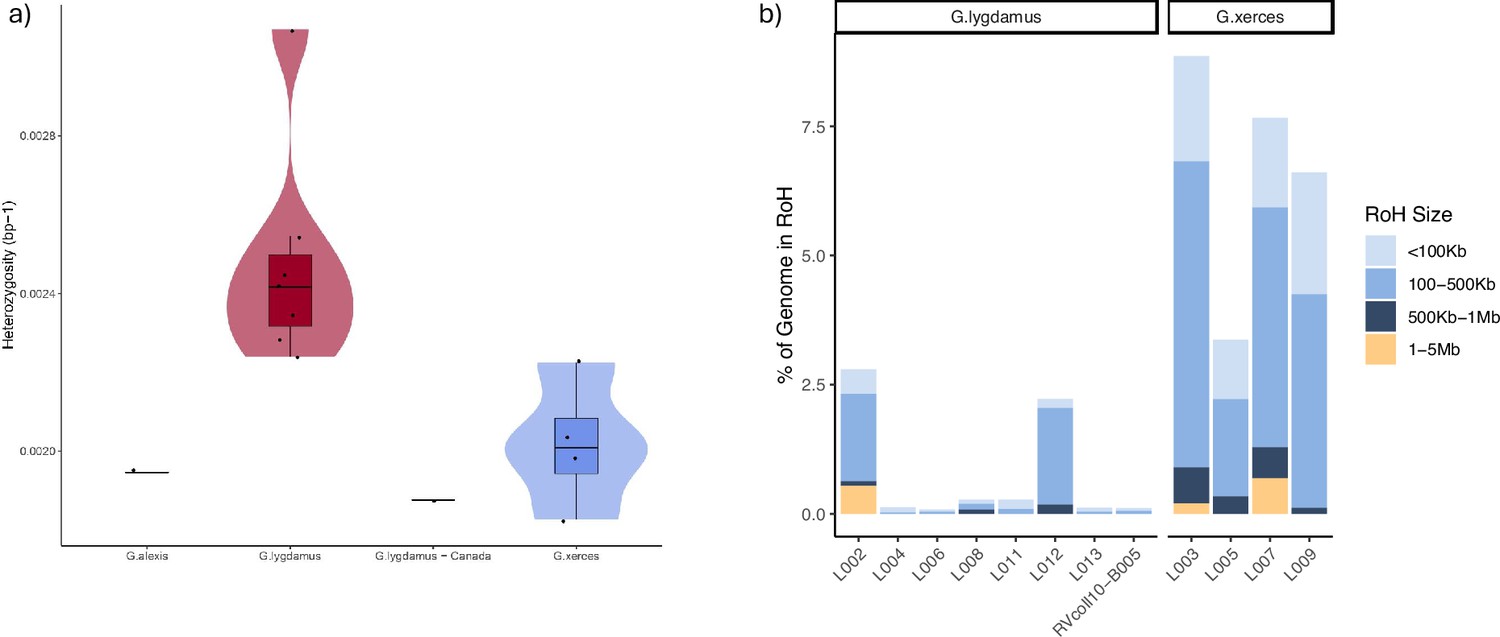
Runs of homozygosity (RoH) in the genomes of Xerces Blue, Silvery Blue, and Green-Underside Blue (modern and historical).
(a) Heterozygosity estimates for low-coverage data from both Silvery Blue (historical and modern), Xerces Blue butterflies, and Green-Underside Blue (modern). (b) RoH for each individual classified by length.
Figure 5
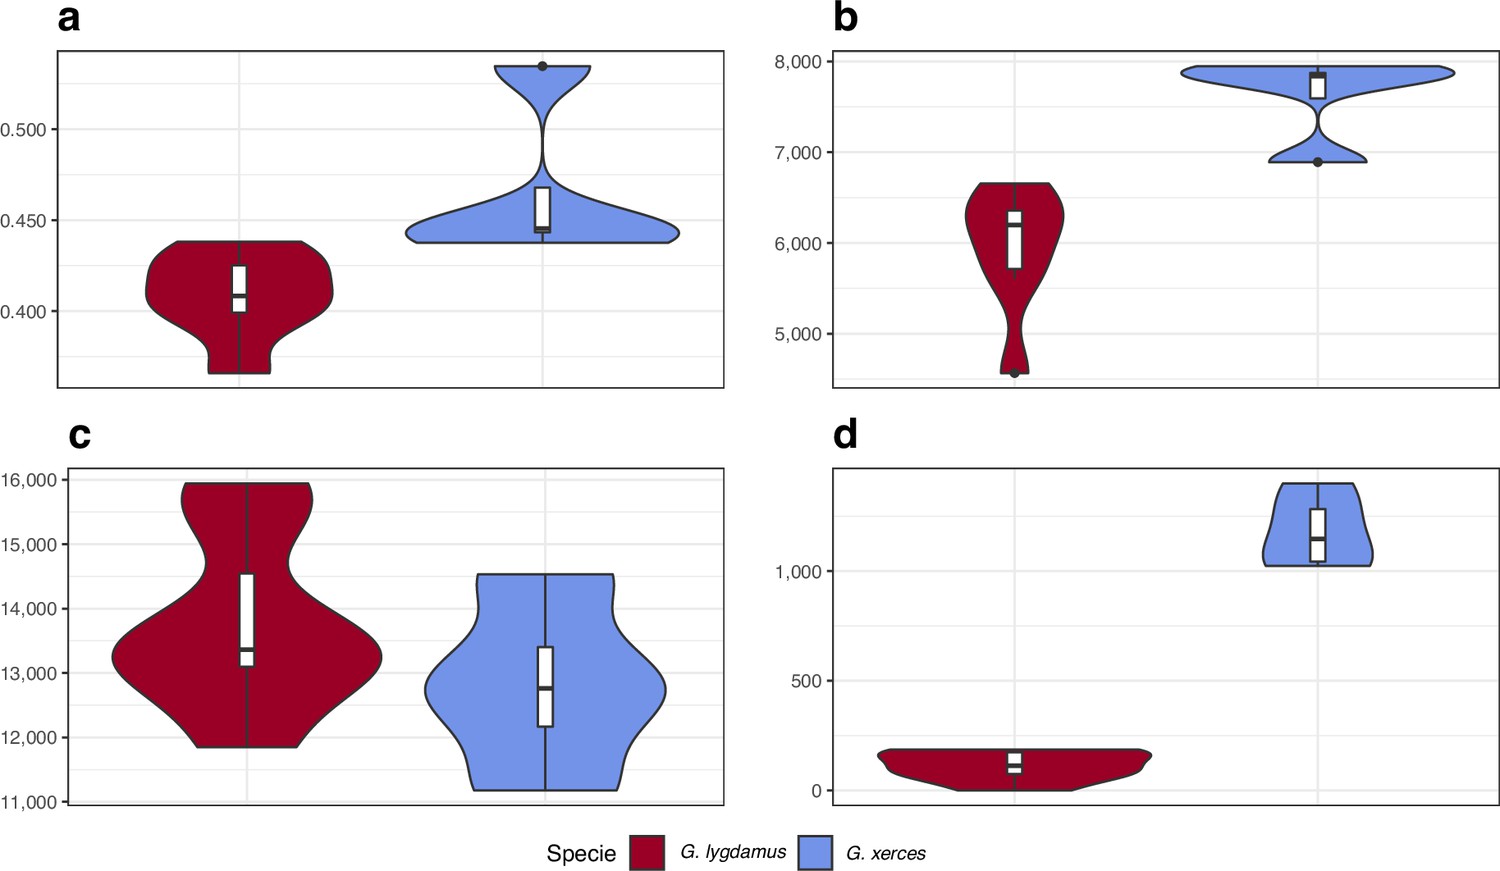
Functional effect prediction on the fixed amino acid-changing alleles observed in Xerces Blue and Silvery Blue.
(a) Wide genome Ka/Ks ratio comparison. (b) High-to-moderate effect variant comparison in homozygous sites. (c) High-to-moderate effect variant comparison in heterozygous sites. (d) Presence of high-to-moderate variants in regions of the genome in runs of homozygosity (RoH). Error bars show the standard deviation.
Tables
Table 1
List of historical specimens analysed in this study.
| Genome # | Species | Subspp. | State | Locality | Date | Collection |
|---|---|---|---|---|---|---|
| USNMENT101413 | G. xerces | California | San Francisco | NA | Barnes | |
| USNMENT101402 | G. xerces | California | San Francisco | 16/4/1923 | Barnes | |
| USNMENT101441 | G. xerces | California | San Francisco | NA | Barnes | |
| USNMENT101406 | G. xerces | California | San Francisco | NA | Barnes | |
| USNMENT101434 | G. xerces | California | San Francisco | 16/4/1923 | Barnes | |
| USNMENT00181297 | G. lygdamus | incognitus | California | Marin Country | NA | Barnes |
| USNMENT00181298 | G. lygdamus | incognitus | California | Fairfax | 27/5/1932 | WMD Field |
| USNMENT00181299 | G. lygdamus | incognitus | California | Oakland | 14/4/1948 | Graham Heid |
| USNMENT00181300 | G. lygdamus | incognitus | California | San Jose | 27/3/1964 | Opler |
| USNMENT00181301 | G. lygdamus | incognitus | California | Haywood City | 1/5/1931 | WMD Field |
| USNMENT00181302 | G. lygdamus | incognitus | California | Santa Cruz | 1/4/1932 | JW Tilden/Field |
| USNMENT00181303 | G. lygdamus | incognitus | California | Santa Cruz | 8/4/1927 | GW Rawson |
Table 2
Mapping statistics of the analysed historical specimens.
Mapping statistics of the four historical G. xerces (L003, L005, L007, and L009) and the seven historical G. lydagmus (L002, L004, L006, L008, L011, L012, and L013) specimens mapped against the G. alexis reference genome. Average depth is displayed for the covered regions of each individual.
| Sample identifier | Generated reads | Q25 unique mapped reads | Breadth of coverage (%) | Average depth covered regions |
|---|---|---|---|---|
| L002 | 300,294,248 | 23,337,751 | 37.27 | 5.105 |
| L003 | 405,198,060 | 32,547,820 | 36.86 | 6.78 |
| L004 | 357,165,438 | 28,722,185 | 38.77 | 6.55 |
| L005 | 776,312,378 | 56,459,037 | 45.7 | 12.42 |
| L006 | 359,520,168 | 28,498,720 | 40.07 | 6.18 |
| L007 | 348,916,870 | 26,758,356 | 34.79 | 6.21 |
| L008 | 508,120,156 | 32,107,192 | 42.08 | 7.422 |
| L009 | 322,955,384 | 39,312,617 | 40.6 | 8.02 |
| L011 | 236,886,534 | 24,165,282 | 38.6 | 5.40 |
| L012 | 328,359,669 | 18,683,738 | 33.37 | 4.29 |
| L013 | 385,635,644 | 52,612,937 | 47.2 | 12.3 |
Table 3
Coordinates of the analysed colouration genes.
Genomic coordinates in G. alexis reference genomes of different wing colouration genes described in other butterfly species.
| Chromosome | Start | End | Gene |
|---|---|---|---|
| FR990043.1 | 5,387,706 | 5,403,599 | Wnt1 |
| FR990043.1 | 5,417,902 | 5,423,677 | Wnt6 |
| FR990043.1 | 5,519,353 | 5,539,737 | Wnt10b |
| FR990043.1 | 5,553,666 | 5,554,753 | Wnt10a |
| FR990043.1 | 26,972,856 | 26,974,487 | WntA |
| FR990046.1 | 2,343,467 | 2,357,667 | Wnt7b |
| FR990046.1 | 6,255,275 | 6,271,623 | Wnt5b |
| FR990046.1 | 19,475,636 | 19,486,554 | Wnt9 |
| FR990050.1 | 16,200,978 | 16,212,495 | Wnt11 |
| FR990054.1 | 20,633,400 | 20,655,261 | Cortex |
| FR990059.1 | 20,254,460 | 20,255,275 | Optix |
Key resources table
| Reagent type (species) or resource | Designation | Source or reference | Identifiers | Additional information |
|---|---|---|---|---|
| Biological sample (Glaucopsyche xerces; female) | L003 | This paper | SAMEA114094142 | See Materials and methods |
| Biological sample (G. xerces; male) | L005 | This paper | SAMEA114094143 | See Materials and methods |
| Biological sample (G. xerces; male) | L007 | This paper | SAMEA114094144 | See Materials and methods |
| Biological sample (G. xerces; female) | L009 | This paper | SAMEA114094145 | See Materials and methods |
| Biological sample (Glaucopsyche lygdamus; male) | L002 | This paper | SAMEA114094134 | See Materials and methods |
| Biological sample (G. lygdamus; male) | L004 | This paper | SAMEA114094135 | See Materials and methods |
| Biological sample (G. lygdamus; male) | L006 | This paper | SAMEA114094136 | See Materials and methods |
| Biological sample (G. lygdamus; male) | L008 | This paper | SAMEA114094137 | See Materials and methods |
| Biological sample (G. lygdamus; male) | L011 | This paper | SAMEA114094138 | See Materials and methods |
| Biological sample (G. lygdamus; female) | L012 | This paper | SAMEA114094139 | See Materials and methods |
| Biological sample (G. lygdamus; male) | L013 | This paper | SAMEA114094140 | See Materials and methods |
| Biological sample (G. lygdamus; male) | RVcoll10-B005 | This paper | SAMEA114094141 | See Materials and methods |
| Biological sample (Glaucopsyche alexis; male) | G. alexis | Hinojosa Galisteo et al., 2021 | ilGlaAlex1.1; GCA_905404095.1 | |
| Biological sample (Aricia agestis) | A. agestis | Hayward et al., 2023 | LR990279.1 | |
| Biological sample (Aricia artaxerxes) | A. artaxerxes | Ebdon et al., 2022 | OW569311.1 | |
| Biological sample (Celastrina argiolus) | C. argiolus | Hayward et al., 2021 | LR994603.1 | |
| Biological sample (Cyaniris semiargus; male) | C. semiargus | Lohse et al., 2023 | LR994570.1 | |
| Biological sample (G. alexis; male) | G. alexis | Hinojosa Galisteo et al., 2021 | FR990065.1 | |
| Biological sample (G. xerces) | G. xerces | Grewe et al., 2021 | MW677564.1 | |
| Biological sample (Lysandra bellargus; female) | L. bellargus | Lohse et al., 2022 | HG995365.1 | |
| Biological sample (Lysandra coridon; male) | L. coridon | Vila et al., 2023 | HG992145.1 | |
| Biological sample (Plebejus argus) | P. argus | Zhou et al., 2020 | MN974526.1 | |
| Biological sample (Plebejus melissa) | P. melissa | Ellis et al., 2021 | DWQ001000057.1 | |
| Biological sample (Plebejus anna) | P. anna | Ellis et al., 2021 | DWTA01000073.1 | |
| Biological sample (Polyommatus icarus; male) | P. icarus | https://www.darwintreeoflife.org/ | OW569343.1 | |
| Biological sample (Shijimiaeoides divina) | S. divina | Jeong et al., 2017 | NC_029763.1 | |
| Biological sample (Zizina emelina) | Z. emelina | Liu et al., 2020 | MN013031.1 | |
| Software, algorithm | BUSCO | Manni et al., 2021 | v.5.1.2 | |
| Software, algorithm | AdapterRemoval | Schubert et al., 2016 | v.2.2.2 | |
| Software, algorithm | BWA – backtrack | Li and Durbin, 2009 | v.0.7.1 | |
| Software, algorithm | BWA – mem | Li, 2013 | v.0.7.1 | |
| Software, algorithm | Qualimap2 | Okonechnikov et al., 2016 | v.2.2.2 | |
| Software, algorithm | pmdtools | Skoglund et al., 2014 | v.0.50 | |
| Software, algorithm | MapDamage2 | Jónsson et al., 2013 | v.2.7.12 | |
| Software, algorithm | Bedtools | Quinlan and Hall, 2010 | v.2.27.1 | |
| Software, algorithm | snpAD | Prüfer, 2018 | v.0.3.2 | |
| Software, algorithm | GATK | McKenna et al., 2010 | v.3.5–3.7 | |
| Software, algorithm | vcftools | Danecek et al., 2011 | v.0.1.12b–0.1.14b | |
| Software, algorithm | angsd | Korneliussen et al., 2014 | v.0.916 | |
| Software, algorithm | bcftools | Danecek et al., 2021 | v.1.9 | |
| Software, algorithm | Mitofinder | Allio et al., 2020 | v.1.4 | |
| Software, algorithm | MACSE | Ranwez et al., 2018 | v.2.05 | |
| Software, algorithm | MAFFT | Katoh and Standley, 2013 | v.7.490 | |
| Software, algorithm | IQ-TREE2 | Minh et al., 2020 | v.2.1.3 | |
| Software, algorithm | ModelFinder | Kalyaanamoorthy et al., 2017 | Available in IQ-TREE2 | |
| Software, algorithm | UFBoot2 | Hoang et al., 2018 | Available in IQ-TREE2 | |
| Software, algorithm | BEAST2 | Bouckaert et al., 2019 | v.2.6.3 | |
| Software, algorithm | bModelTest | Bouckaert and Drummond, 2017 | v.1.2.1 | |
| Software, algorithm | Tracer | Rambaut et al., 2018 | v.1.7.2 | |
| Software, algorithm | PSMC | Li and Durbin, 2011 | v.0.6.5 | |
| Software, algorithm | PCAngsd | Meisner and Albrechtsen, 2018 | v.20180209 | |
| Software, algorithm | Bcftools-roh | Narasimhan et al., 2016 | v.1.9 | |
| Software, algorithm | SNPeff | Cingolani et al., 2012 | v.4.3 | |
| Software, algorithm | Picard | Broad Institute, 2015 | v.2.0.1 | |
| Software, algorithm | Samtools | Li et al., 2009 | v.1.6 | |
| Software, algorithm | BamUtil | Jun et al., 2015 | v.1.0.13 | |
| Software, algorithm | Bedtools | Quinlan and Hall, 2010 | v.2.27.1 | |
| Software, algorithm | BLAST | Altschul et al., 1990 | v.2.2.2 | |
| Software, algorithm | BBMap | Bushnell, 2014 | v.38.18 | |
| Software, algorithm | Prinseq | Schmieder and Edwards, 2011 | v.0.20.4 | |
| Software, algorithm | Kraken2 | Wood et al., 2019 | v.2.1.1 | |
| Software, algorithm | R | R Core Team, 2019 | v.3.6.3–4.1.0 | |
| Software, algorithm | Ggplot2 | Wickham, 2016 | v.3.0.0 |
Table 4
Wolbachia DNA reads assigned using Kraken2.
| Specimen | Wolbachia genus reads | Wolbachia spp. reads |
|---|---|---|
| L002 | 190 | 5 |
| L003 | 131 | 3 |
| L004 | 213 | 5 |
| L005 | 311 | 8 |
| L006 | 242 | 9 |
| L007 | 152 | 2 |
| L008 | 414 | 21 |
| L009 | 236 | 6 |
| L011 | 184 | 9 |
| L012 | 168 | 9 |
| L013 | 523 | 24 |
Additional files
-
Supplementary file 1
Additional information on the genomics analyses.
(a) DNA metric. (b) Mappability of the reference genomes. (c) Mitochondrial DNA genomes used in the phylogenetic analysis. (d) Heterozygosity, homozygosity, and runs of homozygosity (RoH). (e) Genes in uncovered genomic regions in Xerces Blue.
- https://cdn.elifesciences.org/articles/87928/elife-87928-supp1-v2.xlsx
-
MDAR checklist
- https://cdn.elifesciences.org/articles/87928/elife-87928-mdarchecklist1-v2.docx
Download links
A two-part list of links to download the article, or parts of the article, in various formats.
Downloads (link to download the article as PDF)
Open citations (links to open the citations from this article in various online reference manager services)
Cite this article (links to download the citations from this article in formats compatible with various reference manager tools)
Whole genomes from the extinct Xerces Blue butterfly can help identify declining insect species
eLife 12:RP87928.
https://doi.org/10.7554/eLife.87928.3


