Inhibitory CCK+ basket synapse defects in mouse models of dystroglycanopathy
- Neuroscience Graduate Program, Oregon Health & Science University, United States
- Operative Care Division, Portland VA Health Care System, United States
- Anesthesiology and Perioperative Medicine, Oregon Health & Science University, United States
- Vollum Institute, Oregon Health & Science University, United States
Figures
Figure 1 with 2 supplements
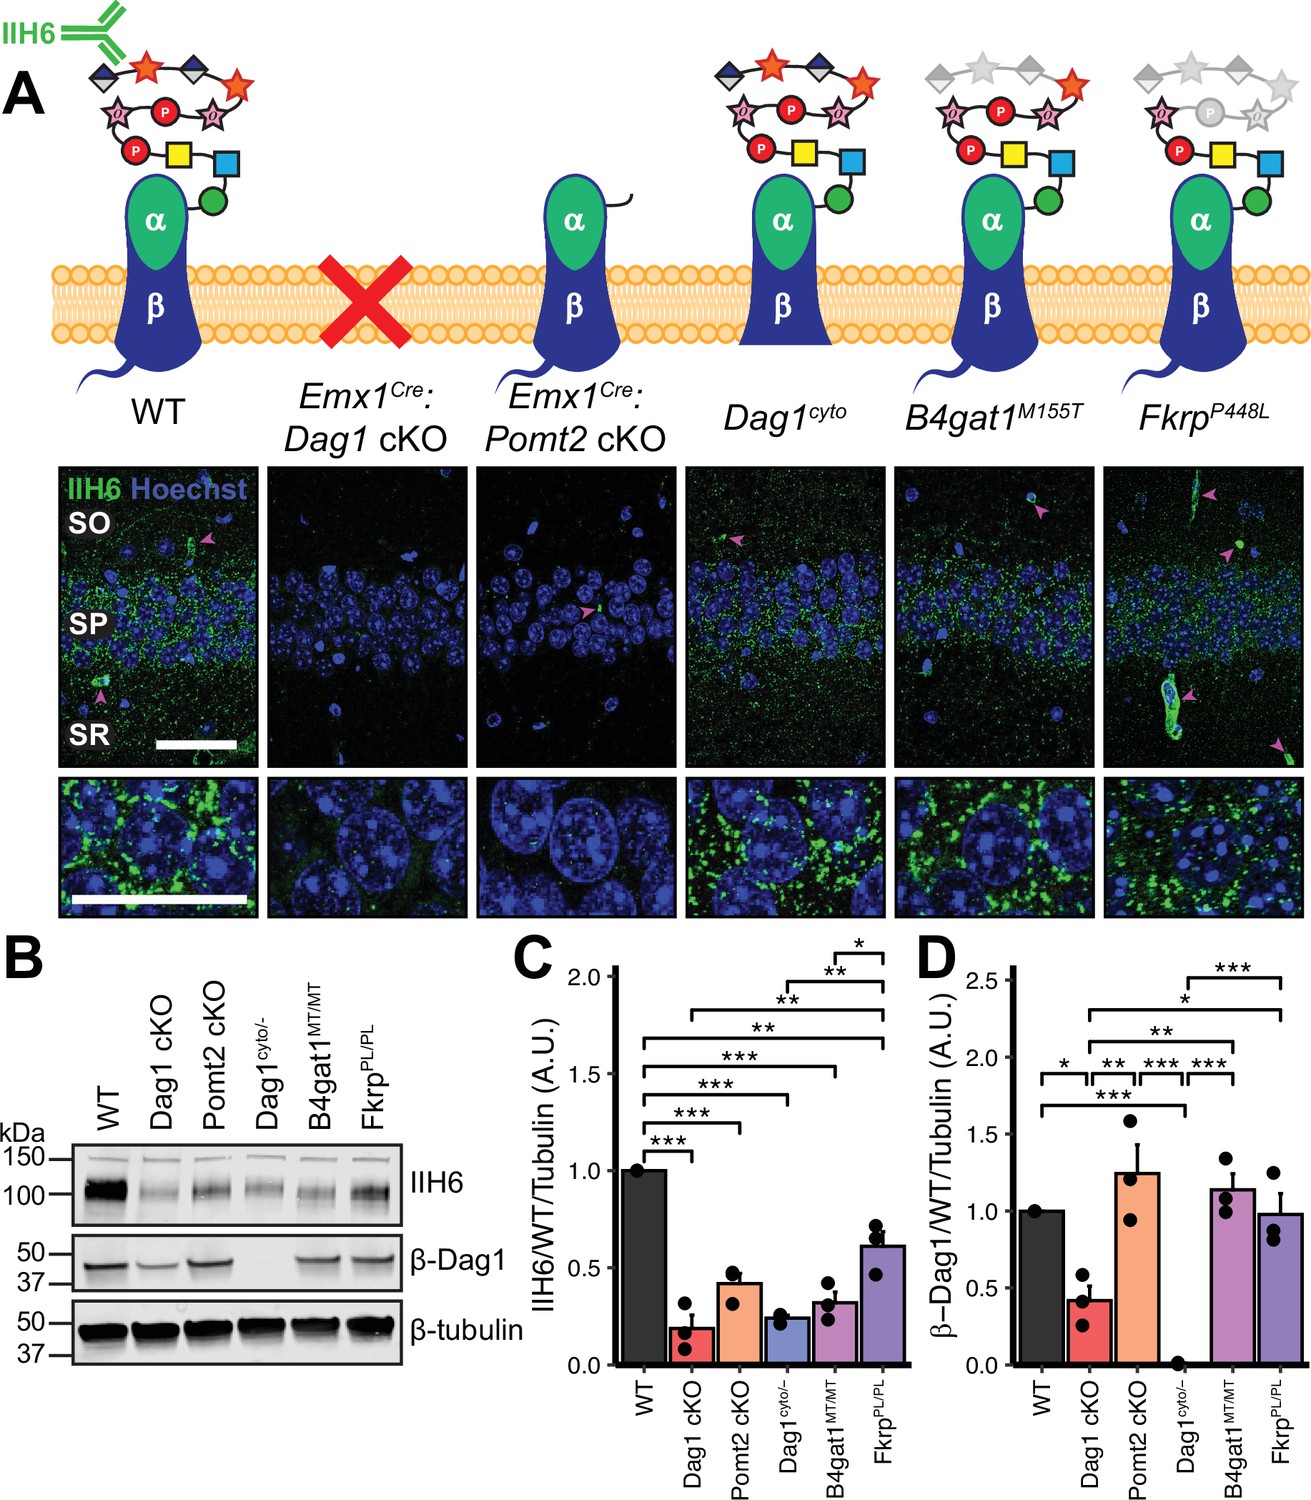
Dystroglycan synaptic localization and glycosylation in mouse models of dystroglycanopathy.
(A) Schematic depiction of Dystroglycan in different mouse models. The IIH6 antibody recognizes the matriglycan repeats on extracellular αDag1. Hippocampal CA1 of P30 mice immunostained for Dystroglycan glycosylation (IIH6, green) and nuclear marker Hoechst (blue) show puncta of glycosylated Dystroglycan localized to the perisomatic region of pyramidal cells and to blood vessels (magenta arrowheads); scale bar = 50 μm. Lower panels show cell bodies in SP; scale bar = 25 μm. CA1 layers: SO, stratum oriens; SP, stratum pyramidale; SR, stratum radiatum. (B) WGA-enriched lysates from P0 forebrain were immunoblotted for IIH6, β-Dag1, and β-tubulin. (C–D) Quantification of immunoblot in (B). Error bars show mean + SEM. See Supplementary file 1 for Ns.
-
Figure 1—source data 1
Raw data for quantification in Figure 1C, D.
- https://cdn.elifesciences.org/articles/87965/elife-87965-fig1-data1-v1.csv
Figure 1—figure supplement 1
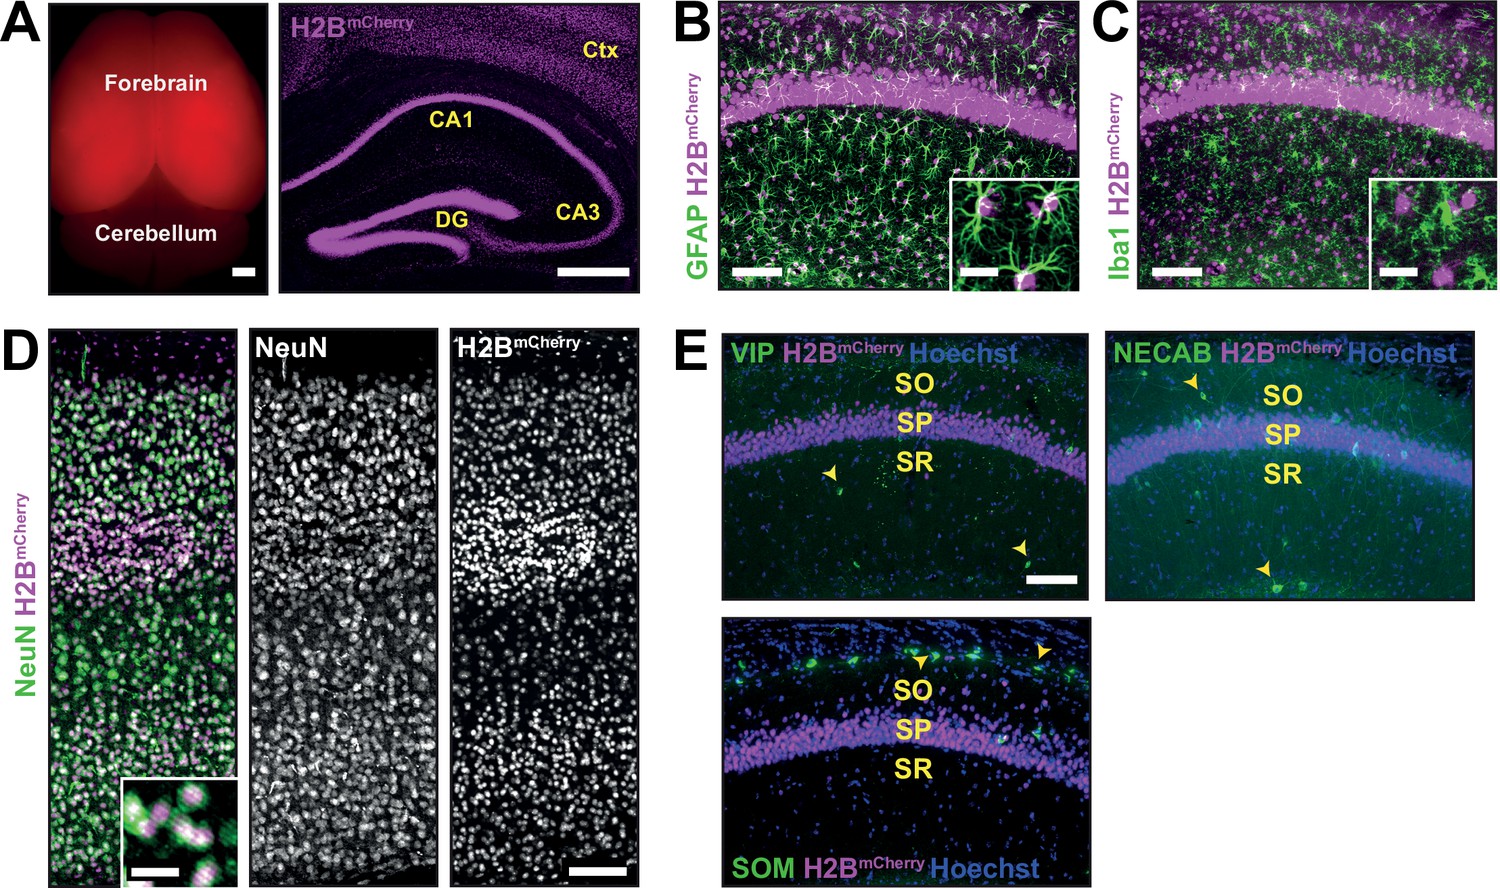
Emx1Cre drives recombination in forebrain excitatory neurons and astrocytes, but not interneurons or microglia.
(A) Left; endogenous red fluorescence in the forebrain of P60 Emx1Cre:R26LSL-H2B-mCherry reporter mice (scale bar = 1 mm). Right; coronal section of the forebrain from Emx1Cre:R26LSL-H2B-mCherry mice showing robust nuclear mCherry signal (magenta) in the cortex and hippocampus (scale bar = 500 μm). (B–E) mCherry+ nuclei shown with markers of multiple cell types in the brain including astrocytes (GFAP, green) (B), microglia (Iba1, green) (C), and neurons (NeuN, green) (D) (scale bar = 100 μm). Insets show enlarged images of mCherry+ nuclei with cell type markers (scale bar = 20 μm). (E) mCherry+ nuclei with markers for different interneuron subtype markers (yellow arrowheads) (scale bar = 100 μm) (VIP = Vasoactive intestinal peptide, NECAB = Neuronal calcium-binding protein 1, SOM = Somatostatin). CA1 layers: SO, stratum oriens; SP, stratum pyramidale; SR, stratum radiatum.
Figure 1—figure supplement 2
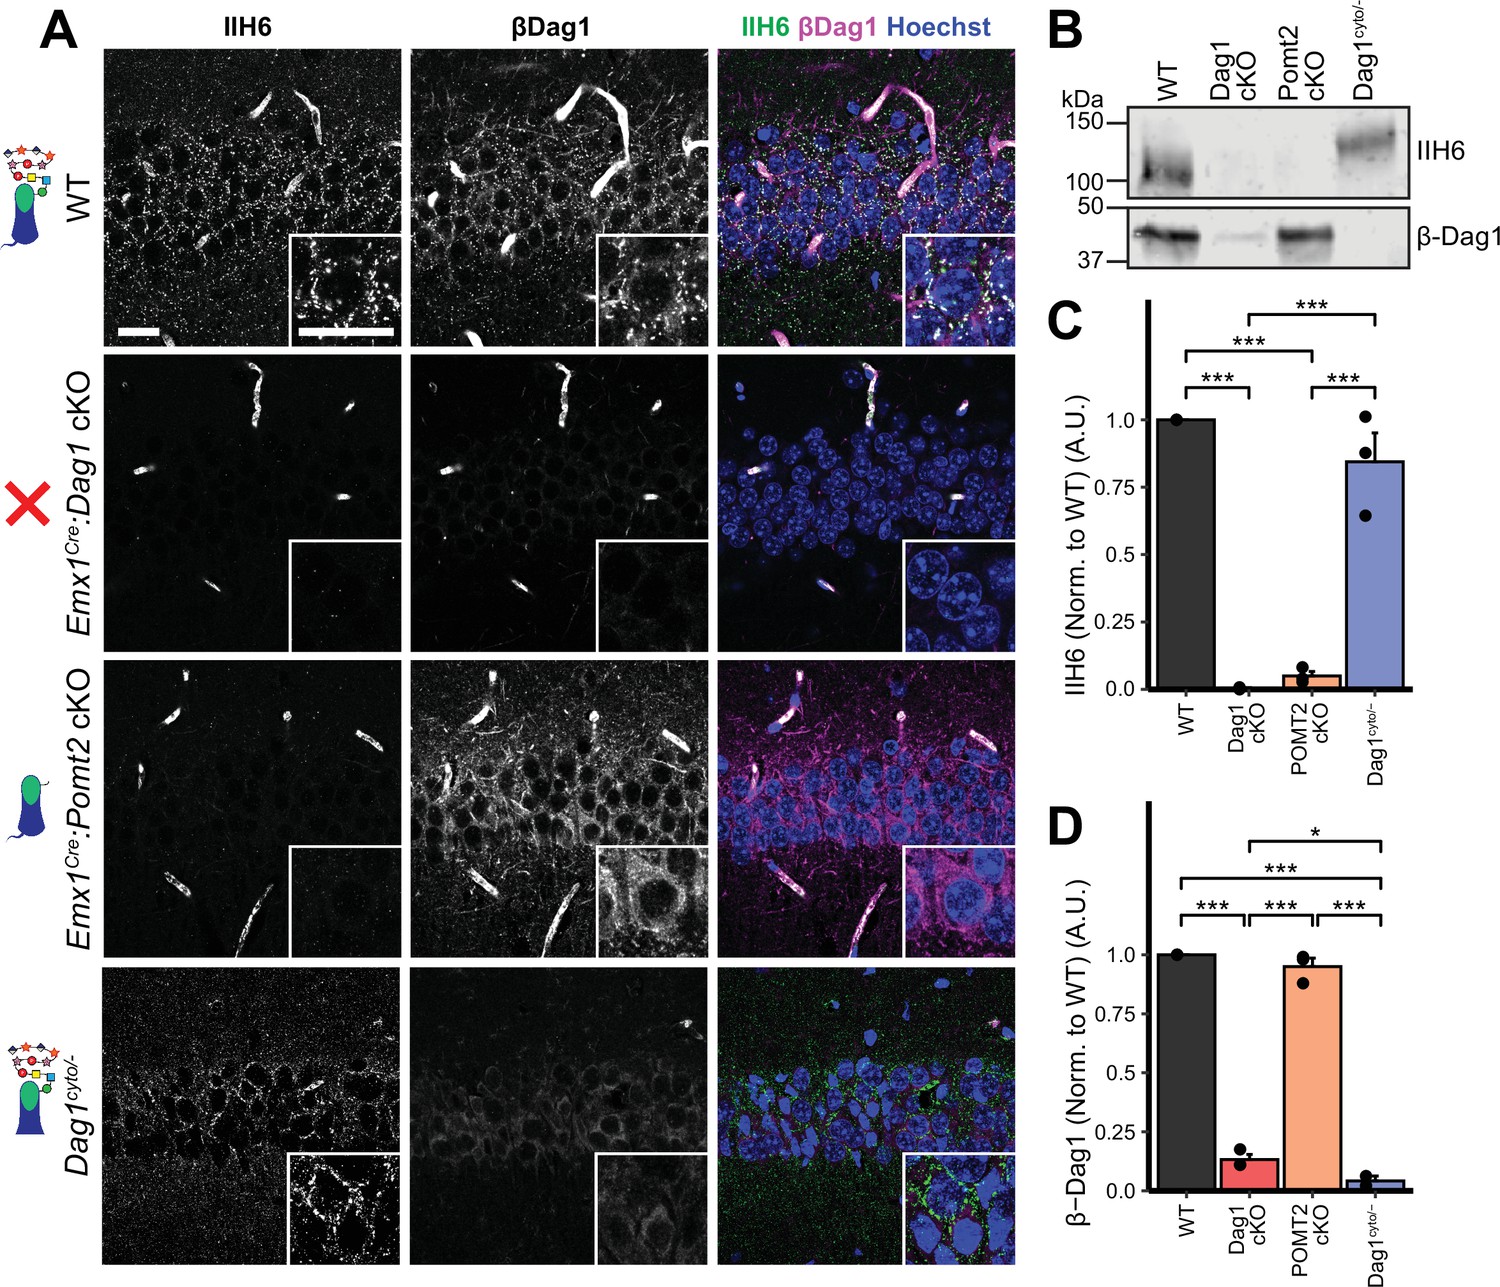
Dystroglycan glycosylation is required for synaptic localization.
(A) Immunostaining for matriglycan (IIH6, green) and β-Dag1 (magenta) in CA1 pyramidal cells of WT controls, Emx1Cre:Dag1 cKOs, Emx1Cre:Pomt2 cKOs, and Dag1cyto/- mutants. Scale bars = 25 μm. (B) WGA-enriched lysates from P21 to P30 hippocampus were immunoblotted for IIH6 and β-Dag1. (C–D) Quantification of immunoblot in (B). Error bars show mean + SEM. See Supplementary file 1 for Ns.
-
Figure 1—figure supplement 2—source data 1
Raw data for quantification in Figure 1—figure supplement 2C, D.
- https://cdn.elifesciences.org/articles/87965/elife-87965-fig1-figsupp2-data1-v1.csv
Figure 2 with 2 supplements
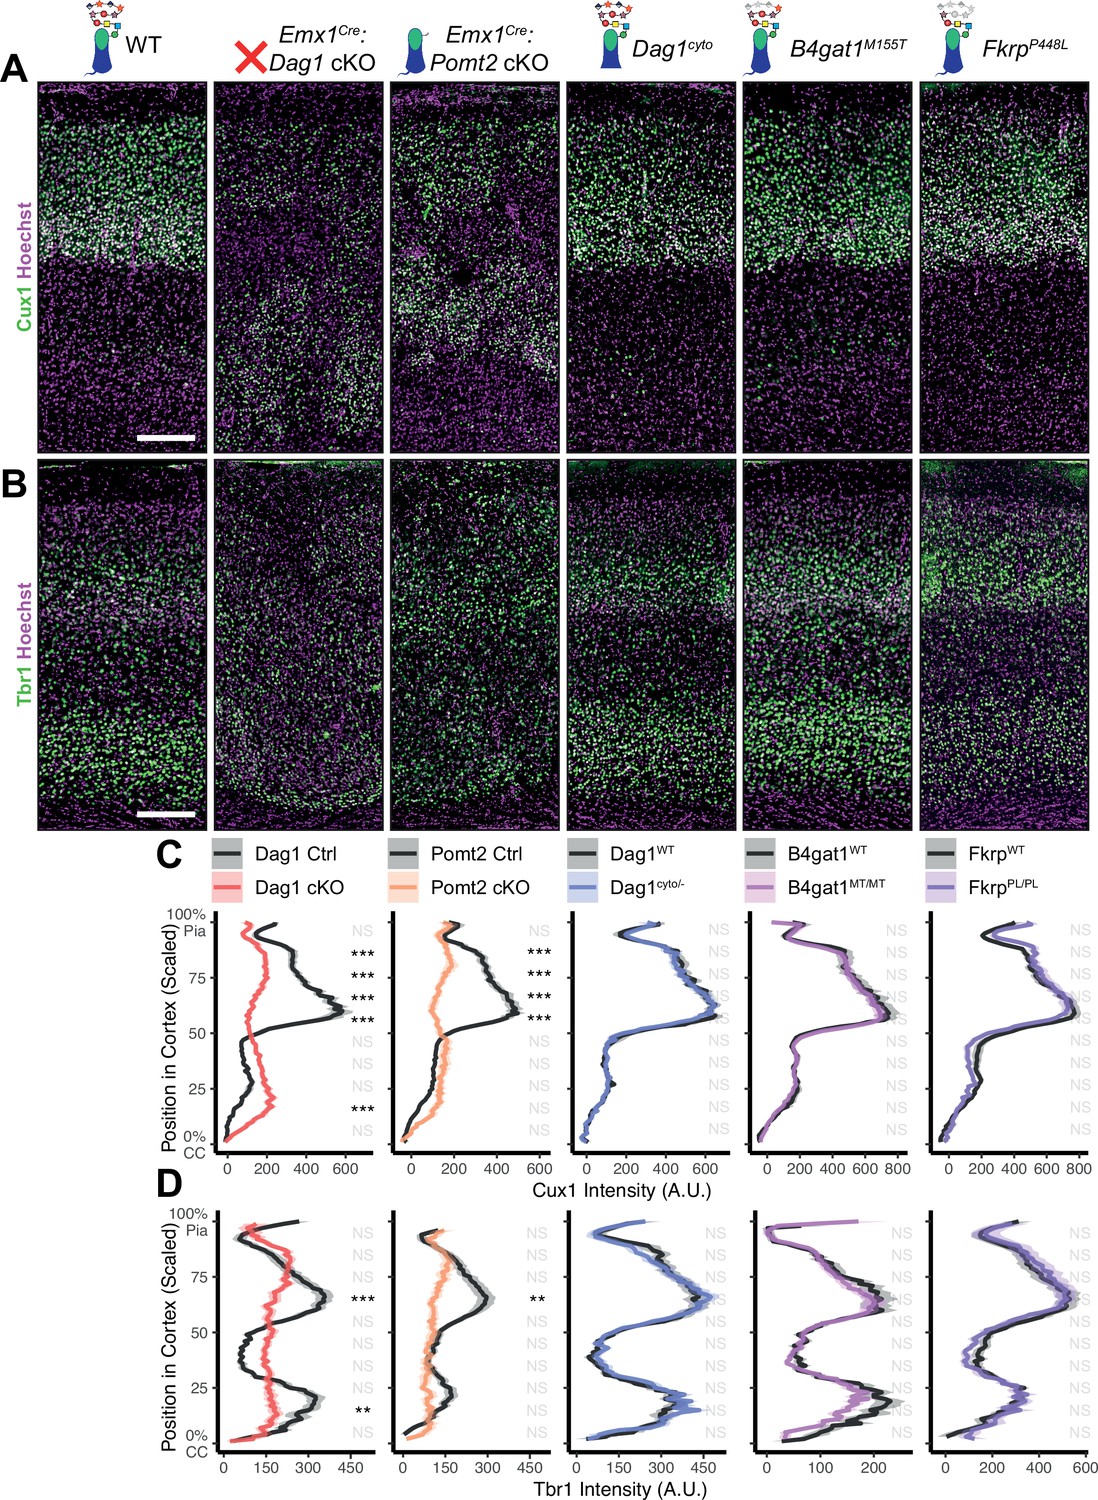
Dystroglycan is required for cortical neuron migration in a glycosylation-dependent manner and independent of intracellular interactions.
Immunostaining for cortical layer markers (A) Cux1 (layers 2–4) and (B) Tbr1 (layers 3 and 6) in P30 somatosensory cortex (scale bar = 200 μm). Layer markers are shown in green. Nuclear marker Hoechst is shown in magenta. Quantification of fluorescence intensity of layer markers shown for (C) Cux1 and (D) Tbr1. Shaded regions of intensity profile illustrate ± SEM. See Supplementary file 1 for Ns. Significance: *=p < 0.05, **=p < 0.01, ***=p < 0.001, NS = p ≥ 0.05. CC, corpus callosum; A.U., arbitrary units.
-
Figure 2—source data 1
Raw data for quantification in Figure 2C.
- https://cdn.elifesciences.org/articles/87965/elife-87965-fig2-data1-v1.csv
-
Figure 2—source data 2
Raw data for quantification in Figure 2D.
- https://cdn.elifesciences.org/articles/87965/elife-87965-fig2-data2-v1.csv
Figure 2—figure supplement 1
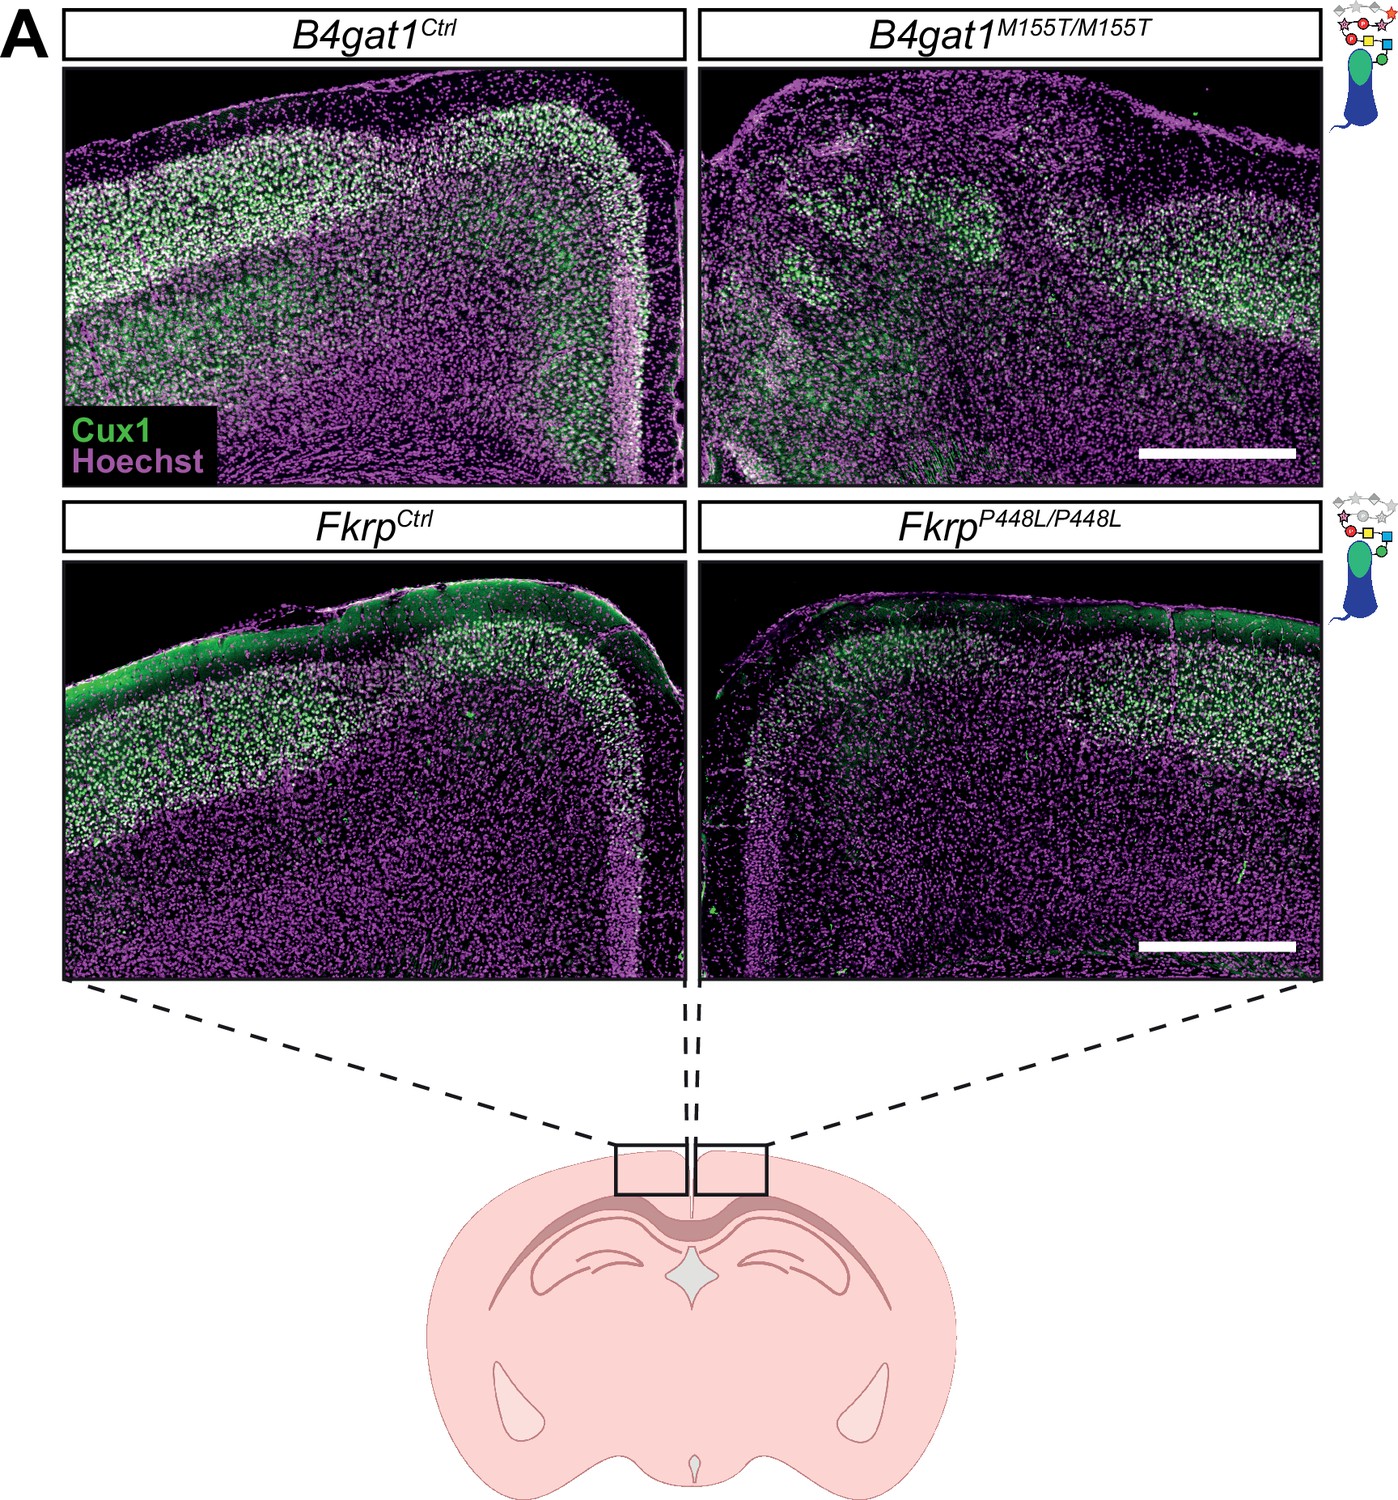
Cortical migration is disrupted at midline of B4gat1M155T/M155T but not FkrpP448L/P448L mutants.
(A) Immunostaining for cortical layer marker Cux1 (layers 2–4) in P30 somatosensory cortex (scale bar = 500 μm). Cux1 is shown in green. Nuclear marker Hoechst is shown in magenta. Cortical migration is normal in both B4gat1 and Fkrp point mutants except at midline, where the B4gat1 mutants show a migration phenotype not seen in the Fkrp point mutants. This phenotype was observed with 100% penetrance in the B4gat1 mutants and 0% in the Fkrp mutants.
Figure 2—figure supplement 2
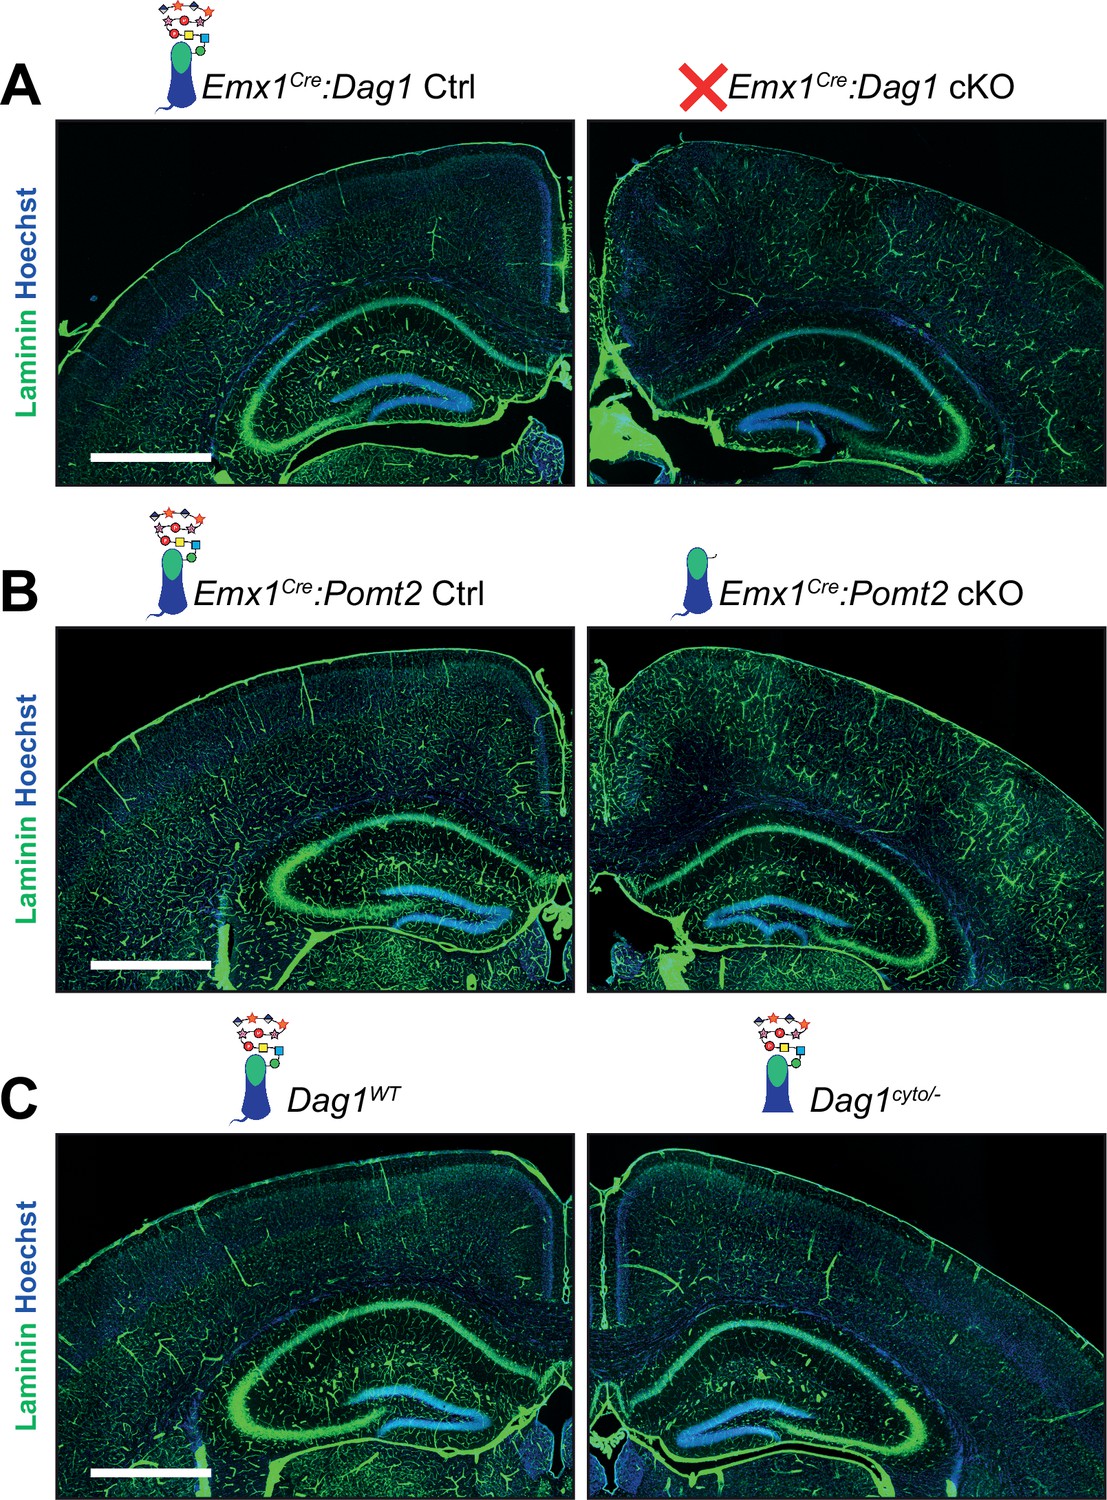
Laminin immunoreactivity in adult neocortex appears discontinuous in Dag1 mutants.
(A–C) Immunostaining for ECM protein Laminin (green). Nuclear marker Hoechst is shown in blue. Scale bar = 1000 μm.
Figure 3 with 4 supplements
Dag1 is required for CCK+/CB1R+ basket IN perisomatic axon targeting in stratum pyramidale of hippocampal CA1-3.
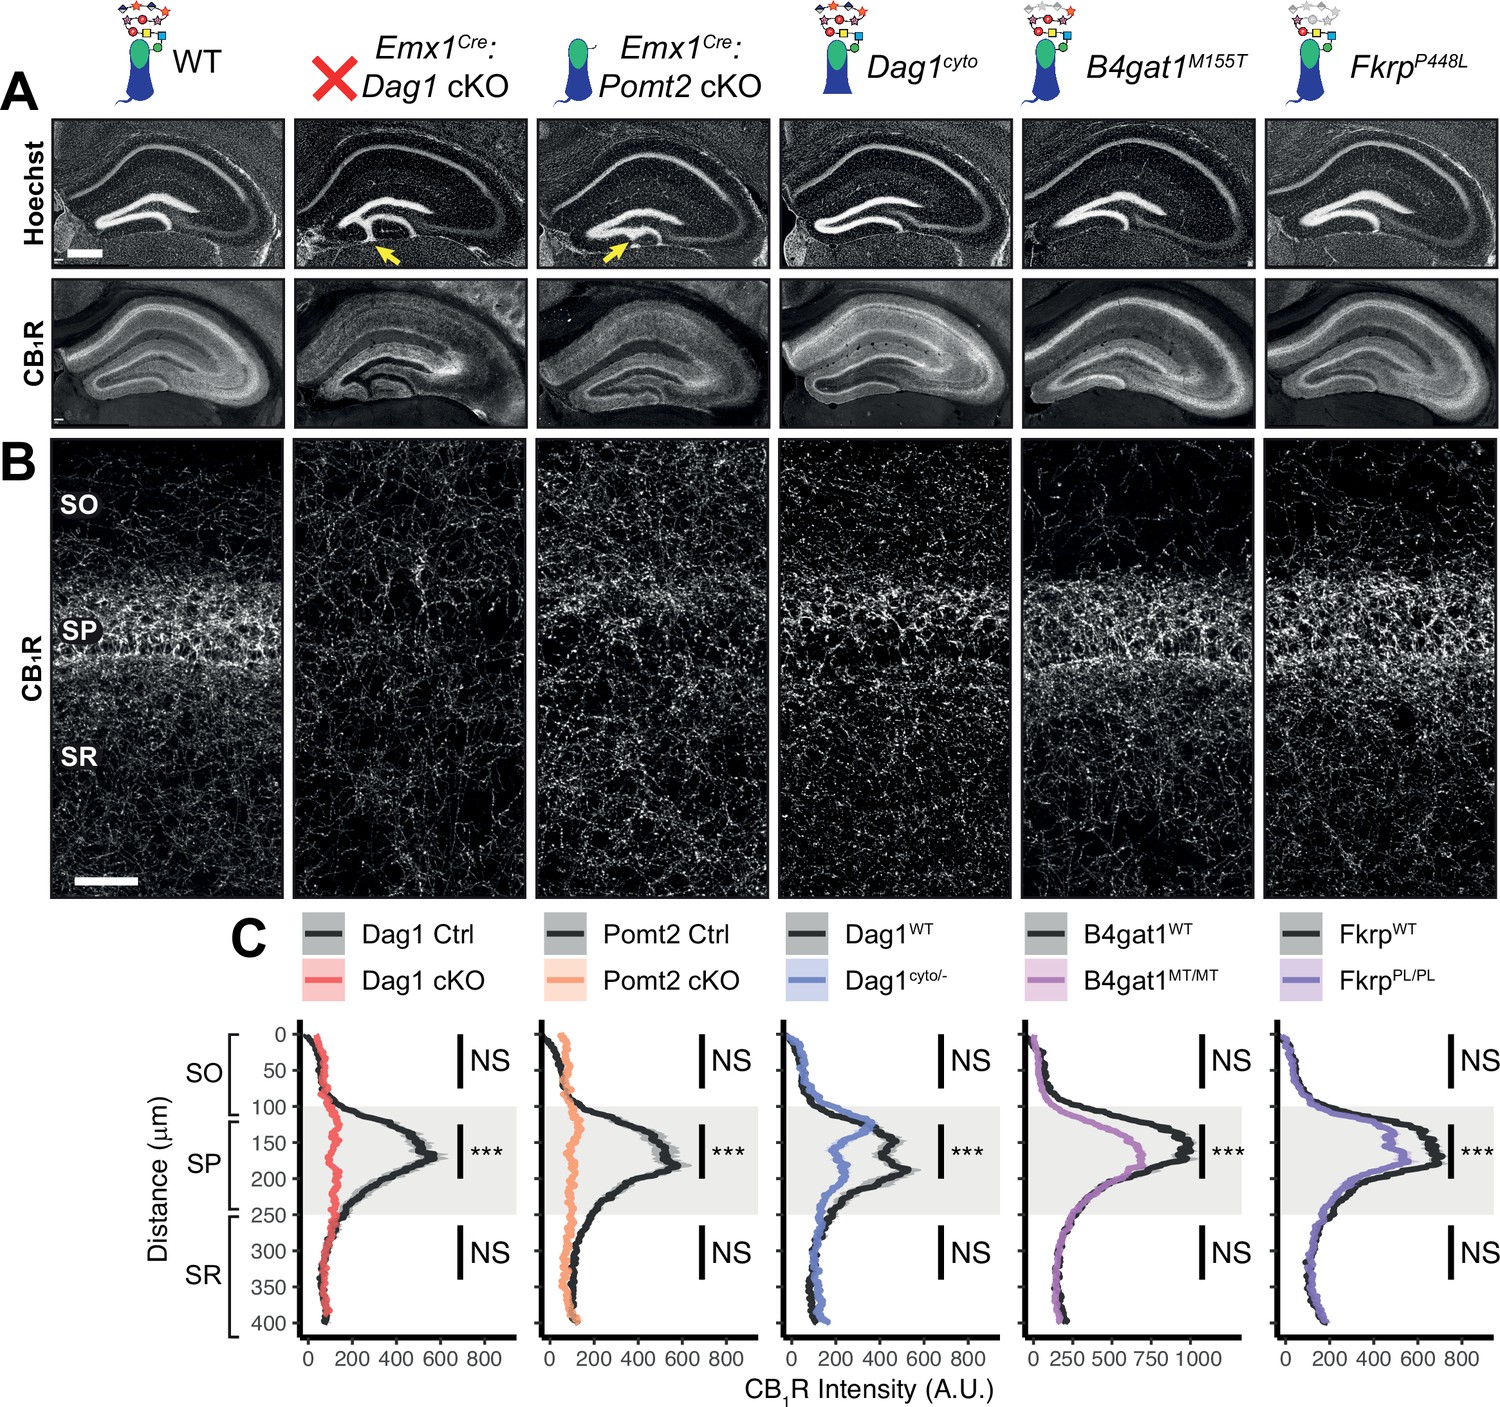
(A) Nuclear marker Hoechst (upper panels) shows hippocampal morphology. Granule cell migration is disrupted in dentate gyrus of Emx1Cre:Dag1 cKOs and Emx1Cre:Pomt2 cKOs (yellow arrows). CA1-3 gross morphology is normal in all models. CB1R immunostaining (lower panels) shows abnormal CCK+/CB1R+ basket interneuron targeting in CA1-3 to varying degrees across models (scale bar = 400 μm). (B) Higher magnification view of CB1R immunostaining in CA1 (scale bar = 50 μm). (C) Quantification of CA1 CB1R fluorescence intensity profile. Shaded regions of intensity profile illustrate ± SEM. Gray region highlights SP. See Supplementary file 1 for Ns. Significance: *=p < 0.05, **=p < 0.01, ***=p < 0.001, NS = p ≥ 0.05. A.U., arbitrary units; SO, stratum oriens; SP, stratum pyramidale; SR, stratum radiatum.
-
Figure 3—source data 1
Raw data for quantification in Figure 3C.
- https://cdn.elifesciences.org/articles/87965/elife-87965-fig3-data1-v1.csv
Figure 3—figure supplement 1
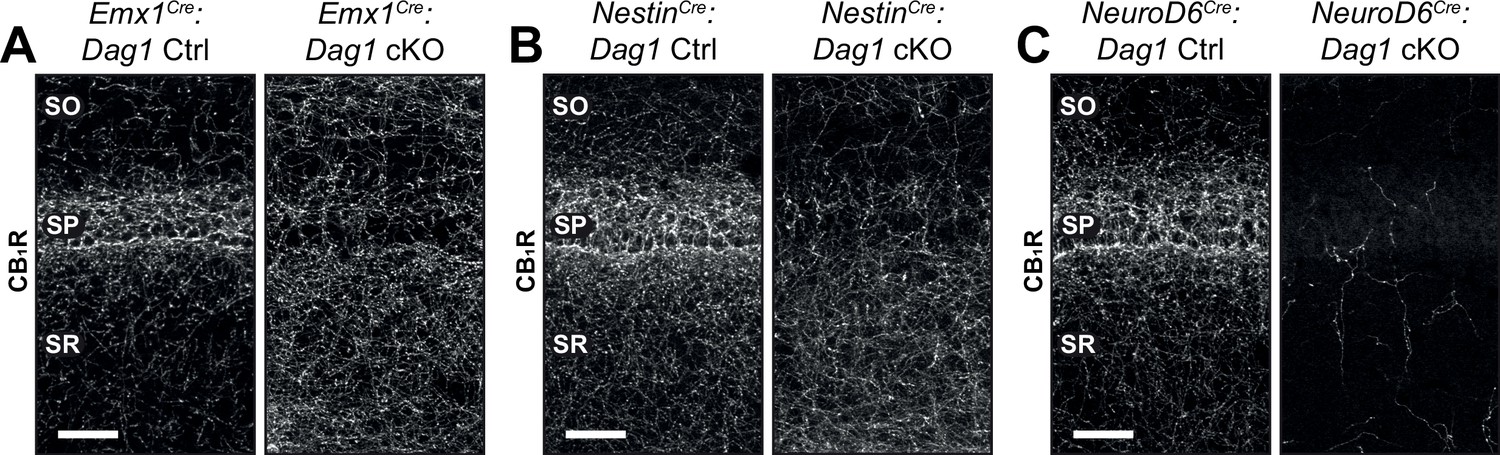
CCK+/CB1R+ IN axon targeting phenotypes in hippocampal CA1 of various Dag1 cKOs.
CB1R immunostaining in hippocampal CA1 of control mice (left panels) and Dag1 cKOs (right panels) generated using Emx1Cre (forebrain progenitors, E10.5) (A), NestinCre (neural stem cells in the central and peripheral nervous systems, E11.5) (B), and NeuroD6Cre (forebrain postmitotic excitatory neurons, E12.5) (C). Scale bar = 50 μm. SO, stratum oriens; SP, stratum pyramidale; SR, stratum radiatum.
Figure 3—figure supplement 2
CCK+/CB1R+ IN cell numbers are unchanged in Emx1Cre:Dag1 cKOs.
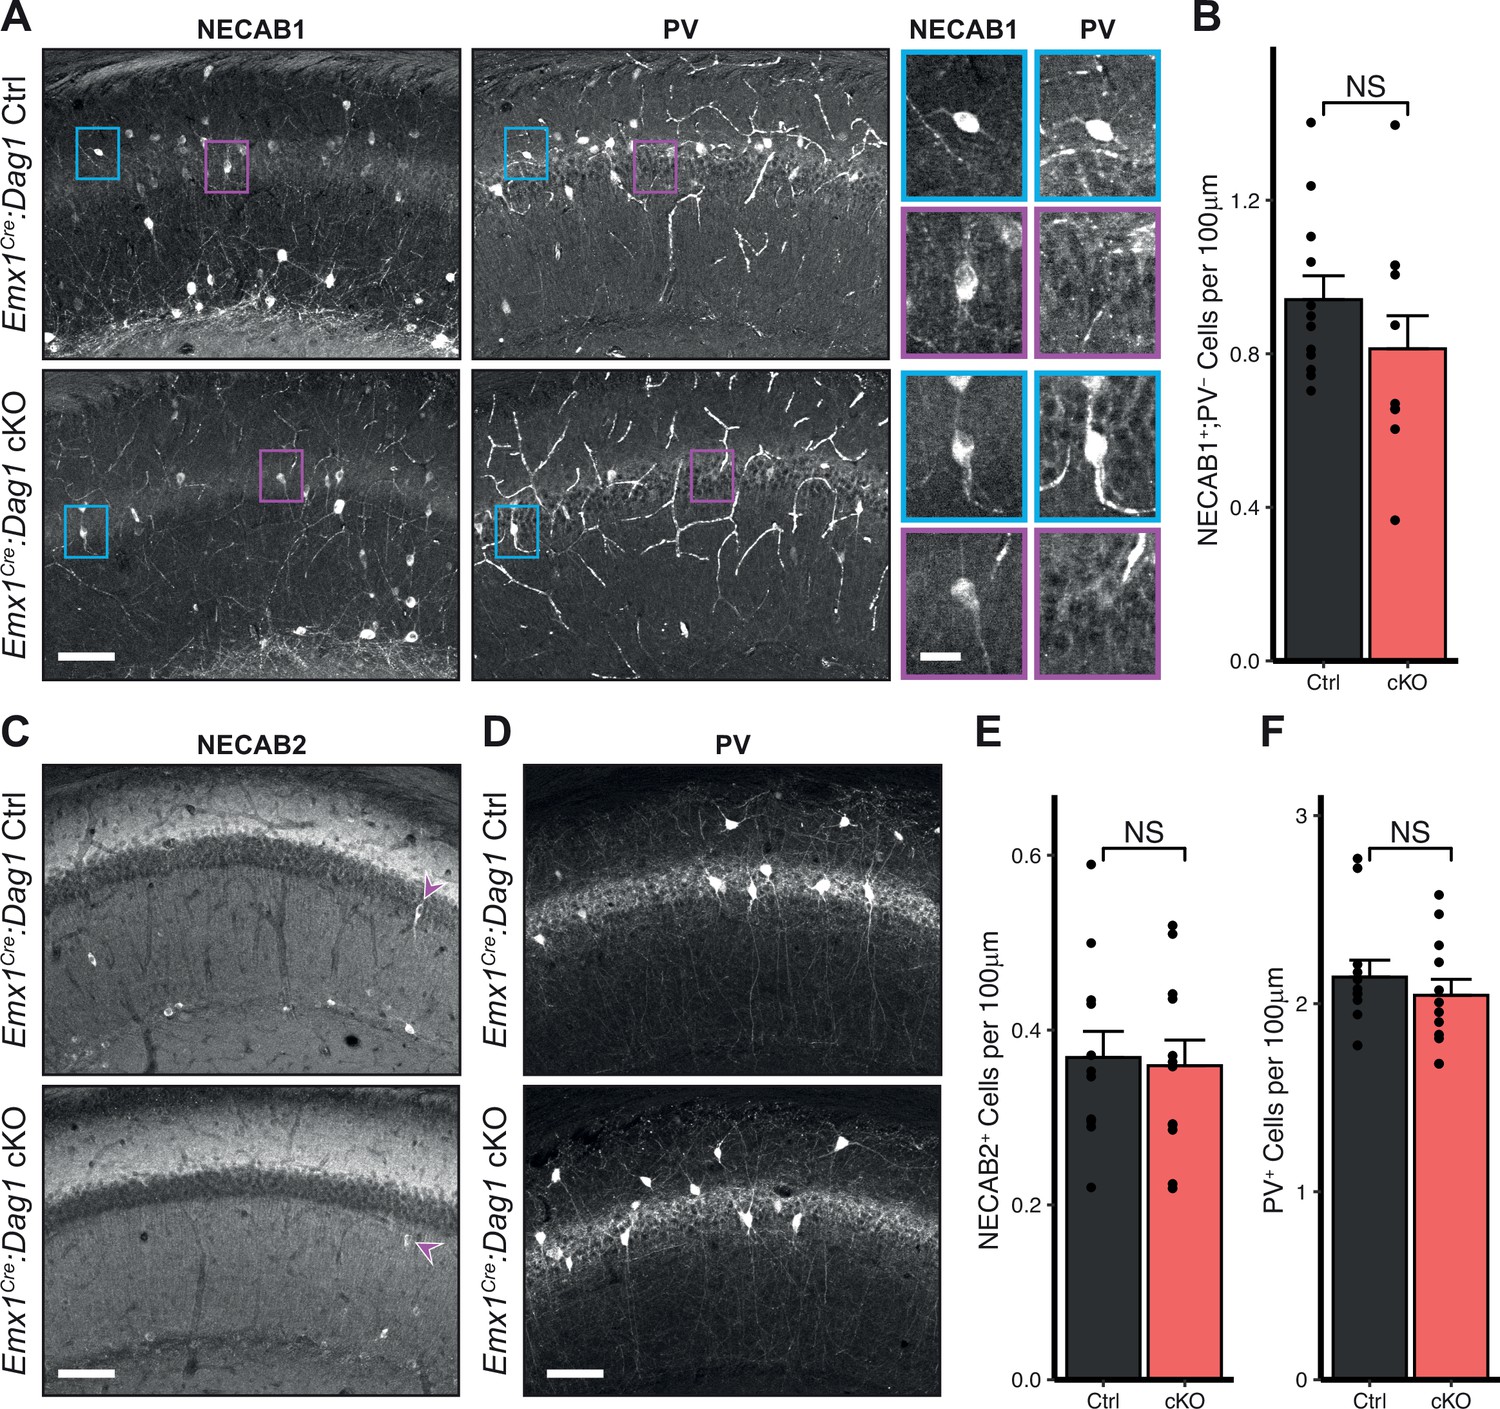
(A) Immunostaining in hippocampal CA1 for NECAB1 (left) and PV (right) in Emx1Cre:Dag1 control and Emx1Cre:Dag1 cKO mice. NECAB1 labeling is evident in PV+ cells (example shown in blue inset) and in an additional PV- population that contains the CCK+/CB1R+ population (example shown in magenta inset). The average number of NECAB1+;PV- cells per 100 μm of SP is quantified in (B). Immunostaining for NECAB2 (C) and PV (D) with cell number quantification in (E) and (F). Scale bar = 100 μm. Error bars show mean + SEM. See Supplementary file 1 for Ns. Significance: *=p < 0.05, **=p < 0.01, ***=p < 0.001, NS = p ≥ 0.05. SP, stratum pyramidale; PV, parvalbumin.
-
Figure 3—figure supplement 2—source data 1
Raw data for quantification in Figure 3—figure supplement 2B, E, and F.
- https://cdn.elifesciences.org/articles/87965/elife-87965-fig3-figsupp2-data1-v1.csv
Figure 3—figure supplement 3
Parvalbumin+ basket INs do not require Dag1 for proper axon targeting in hippocampal CA1.
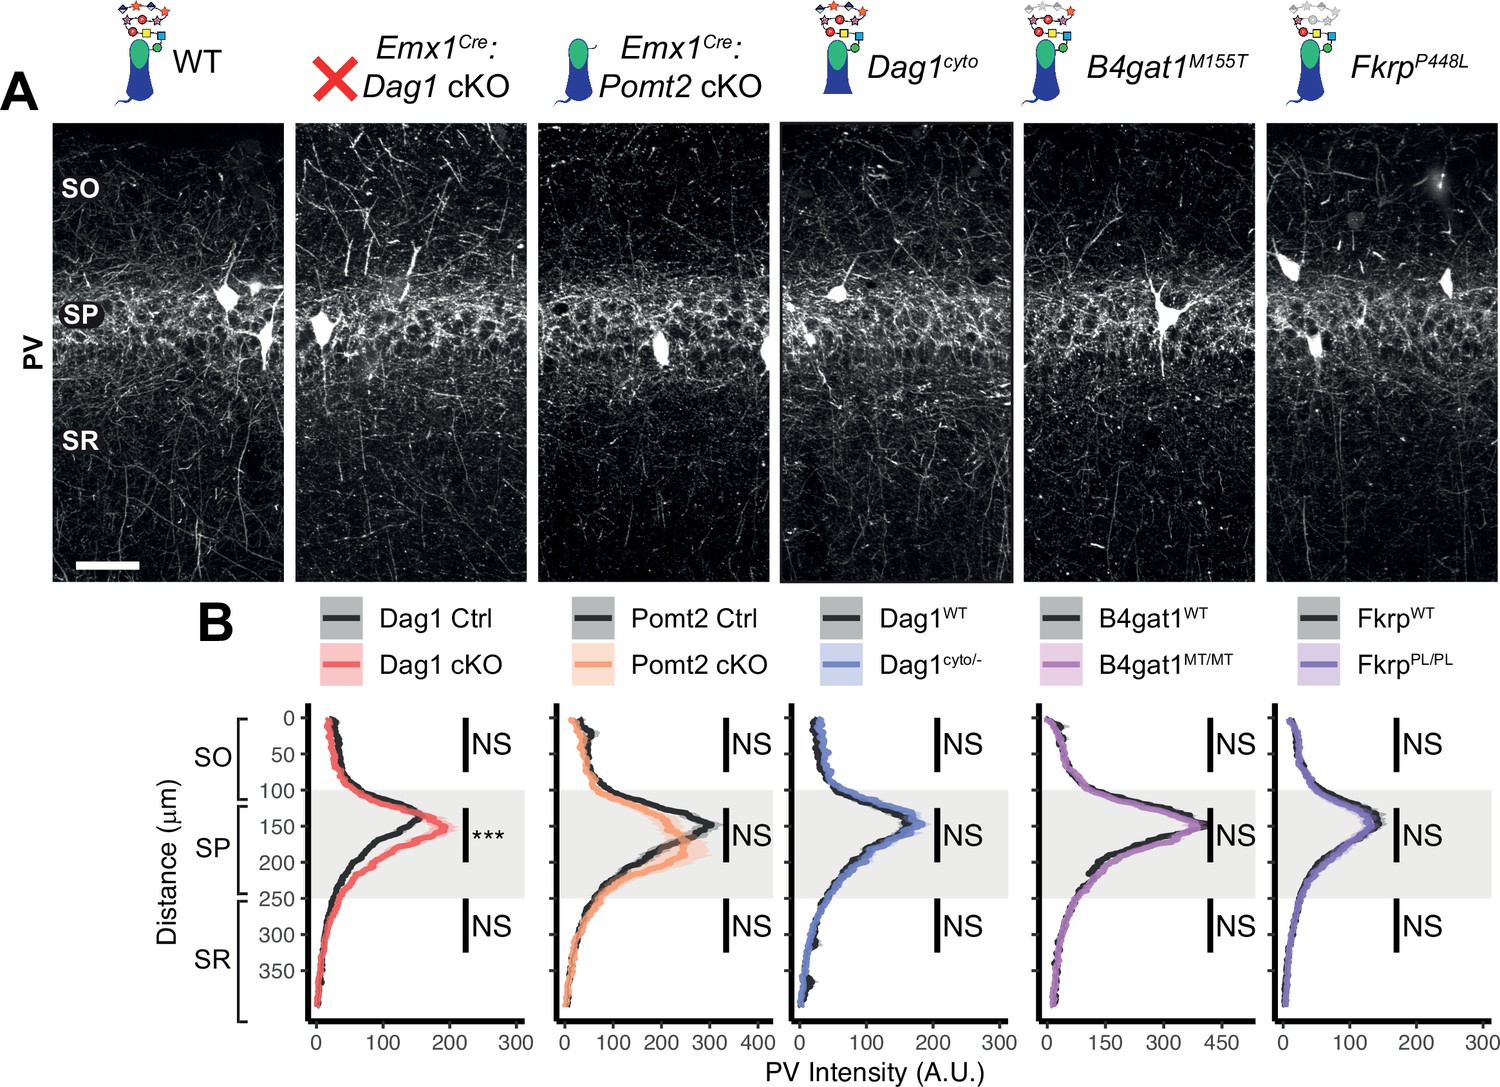
(A) Parvalbumin (PV) immunostaining in P30 hippocampal CA1 shows that PV+ basket interneurons exhibit normal distribution in CA1 for all genetic models except for an increase in PV intensity within stratum pyramidale of Emx1Cre:Dag1 cKOs (scale bar = 50 μm). (B) Quantification of CA1 PV fluorescence intensity profile. Shaded regions of intensity profile illustrate ± SEM. Gray region highlights SP. See Supplementary file 1 for Ns. Significance: *=p < 0.05, **=p < 0.01, ***=p < 0.001, NS = p ≥ 0.05. A.U., arbitrary units; SO, stratum oriens.
-
Figure 3—figure supplement 3—source data 1
Raw data for quantification in Figure 3—figure supplement 3B.
- https://cdn.elifesciences.org/articles/87965/elife-87965-fig3-figsupp3-data1-v1.csv
Figure 3—figure supplement 4
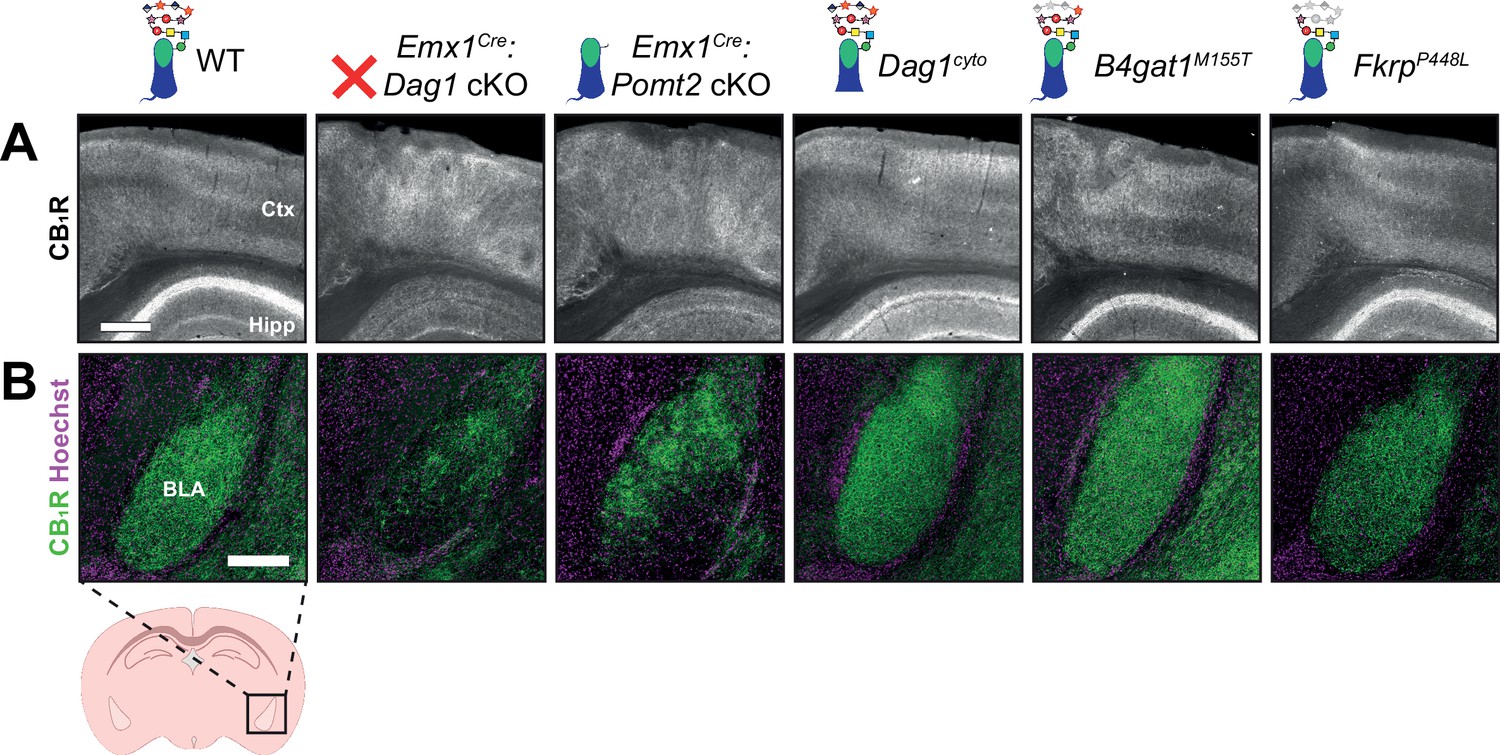
Altered CB1R expression in cortex and basolateral amygdala of Dag1 and POMT2 mutants.
(A) CB1R immunostaining in P30 coronal sections showing somatosensory cortex (Ctx) and CA1 of hippocampus (Hipp) (scale bar = 400 μm). (B) CB1R immunostaining (green) shown with nuclear marker Hoechst (magenta) in basolateral amygdala (BLA) (scale bar = 250 μm).
Figure 4
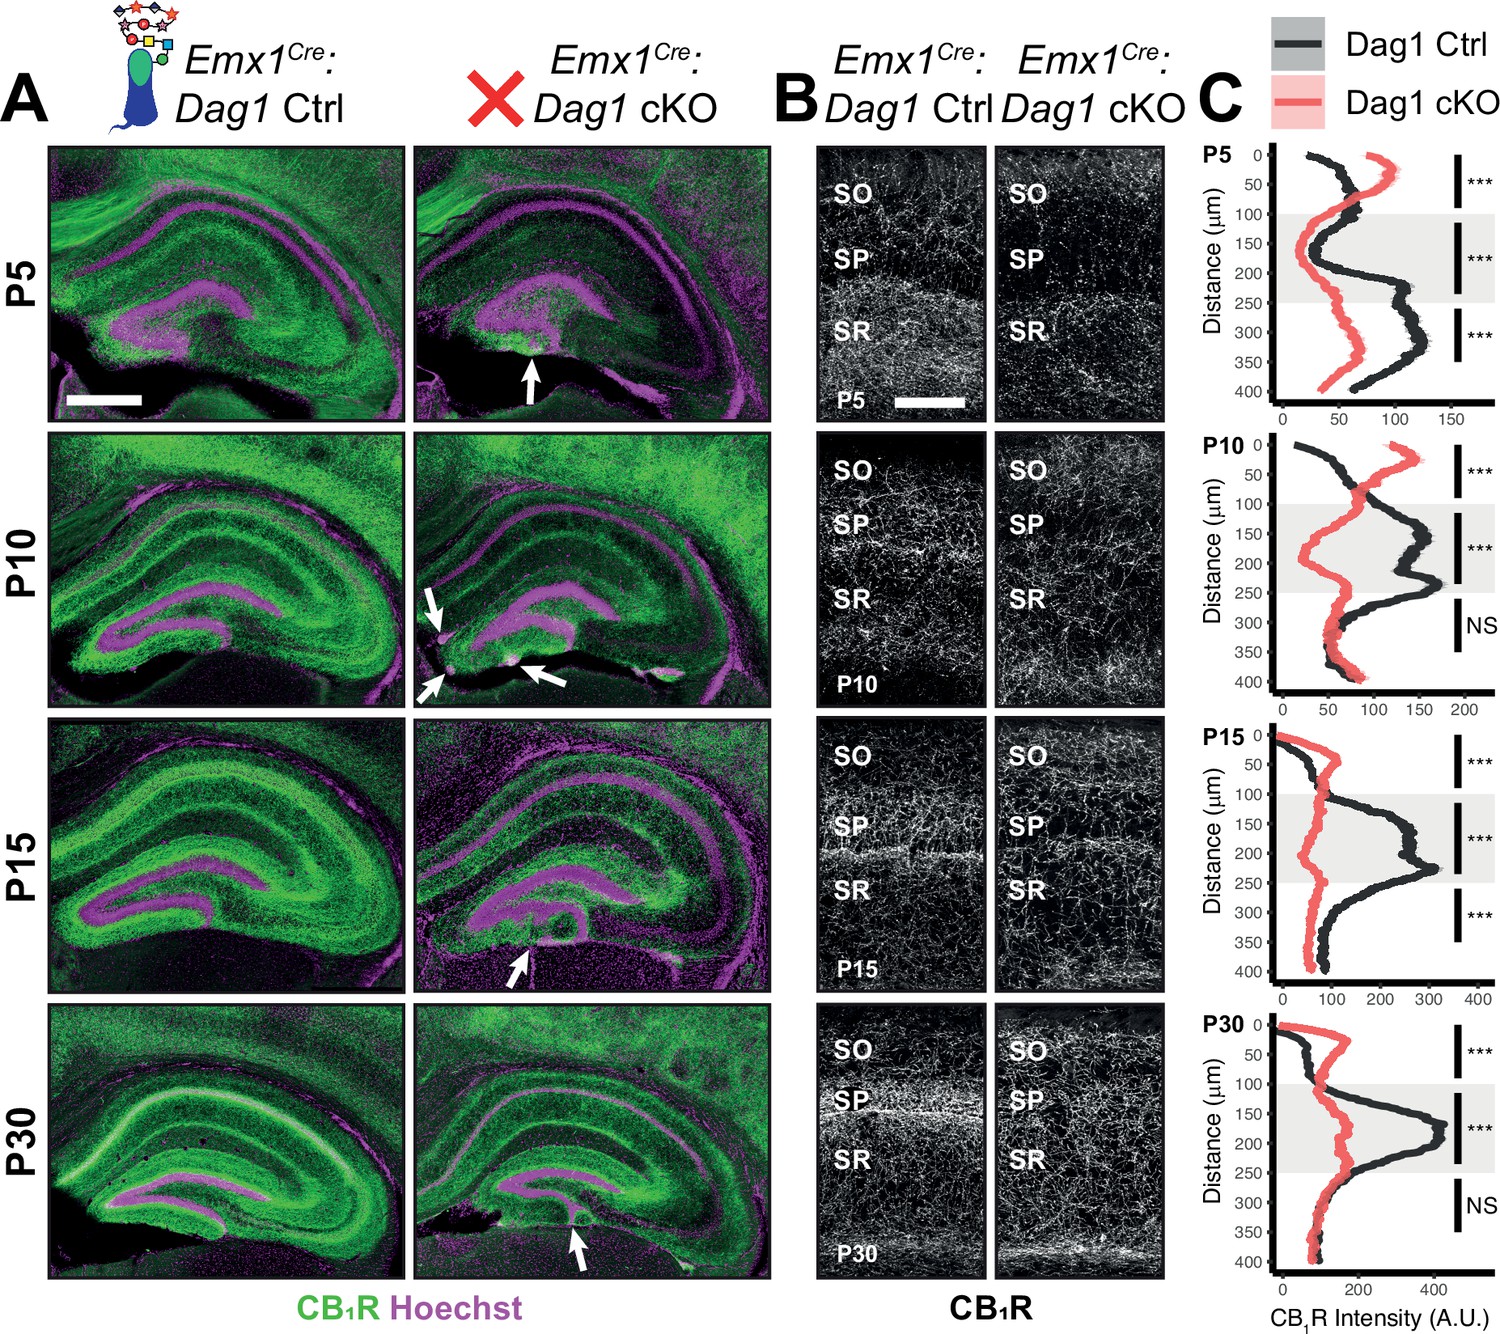
Dag1 is required for CCK+/CB1R+ IN axon targeting during early postnatal development.
(A) Immunostaining for CB1R+ axon terminals (green) in the hippocampus of Emx1Cre:Dag1 controls (left) and cKOs (right) at ages P5-P30. Nuclear marker Hoechst is shown in magenta. White arrowheads indicate migration errors in dentate granule cells Emx1Cre:Dag1 cKO mice. Scale bar = 500 μm. (B) Higher magnification images of CB1R+ axon terminals in CA1 of Emx1Cre:Dag1 controls (left) and cKOs (right) at ages P5-P30. Scale bar = 100 μm. (C) Quantification of CB1R fluorescence intensity profile in CA1. Shaded regions of intensity profile illustrate ± SEM. Gray region highlights SP. See Supplementary file 1 for Ns. Significance: *=p < 0.05, **=p < 0.01, ***=p < 0.001, NS = p ≥ 0.05. A.U., arbitrary units; SO, stratum oriens; SP, stratum pyramidale; SR, stratum radiatum.
-
Figure 4—source data 1
Raw data for quantification in Figure 4C.
- https://cdn.elifesciences.org/articles/87965/elife-87965-fig4-data1-v1.csv
Figure 5 with 3 supplements
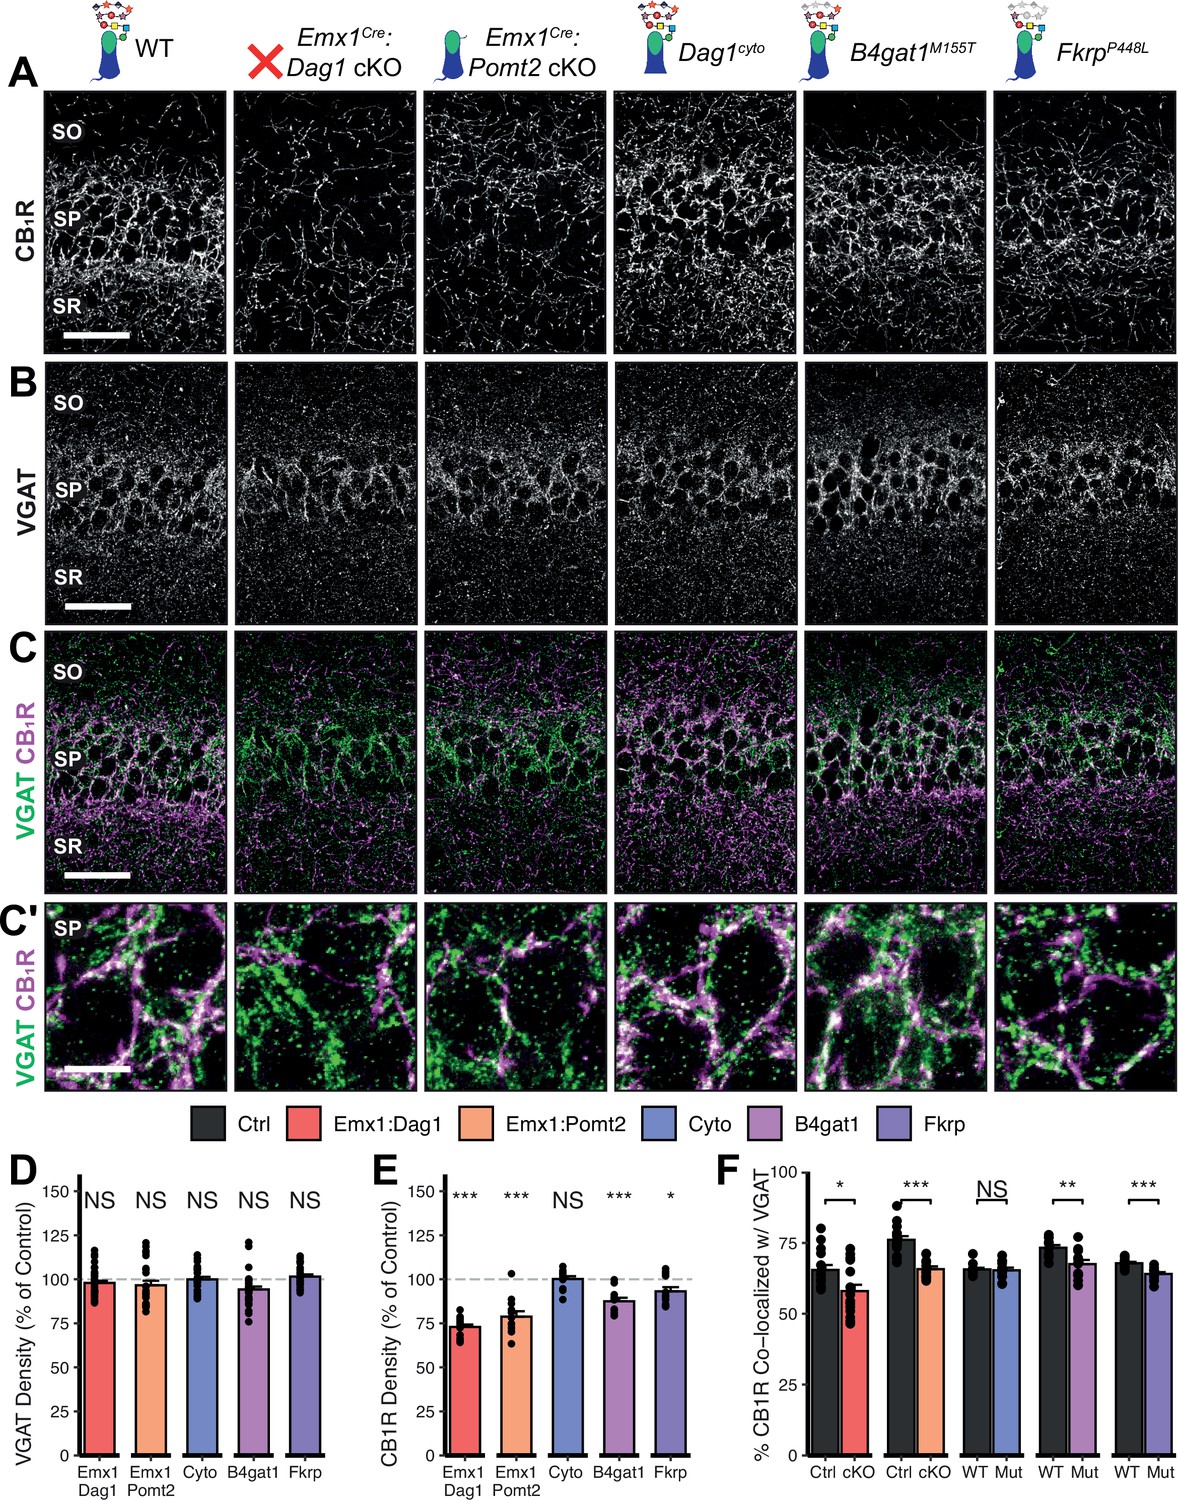
Dag1 and Pomt2 cKOs exhibit impaired CB1R+ basket synapse formation in stratum pyramidale of hippocampal CA1.
P30 coronal sections immunostained for (A) CB1R and (B) VGAT in hippocampal CA1; merged image in (C) shows CB1R in magenta and VGAT in green. (A–C) Scale bar = 50 μm. (Higher magnification view of SP in (C’); scale bar = 10 μm.) (D) Quantification of VGAT puncta density in SP expressed as a percent of control. (E) Quantification of CB1R puncta density in SP expressed as a percent of control. (F) Quantification of co-localization between VGAT and CB1R in SP to estimate putative CB1R+ basket cell synapse formation. Error bars show mean + SEM. (For quantification of puncta densities and co-localization in SO and SR see Figure 5—figure supplement 1.) See Supplementary file 1 for Ns. Significance: *=p < 0.05, **=p < 0.01, ***=p < 0.001, NS = p ≥ 0.05. SO, stratum oriens; SP, stratum pyramidale; SR, stratum radiatum.
-
Figure 5—source data 1
Raw data for quantification in Figure 5D, E.
- https://cdn.elifesciences.org/articles/87965/elife-87965-fig5-data1-v1.csv
-
Figure 5—source data 2
Raw data for quantification in Figure 5F.
- https://cdn.elifesciences.org/articles/87965/elife-87965-fig5-data2-v1.csv
Figure 5—figure supplement 1
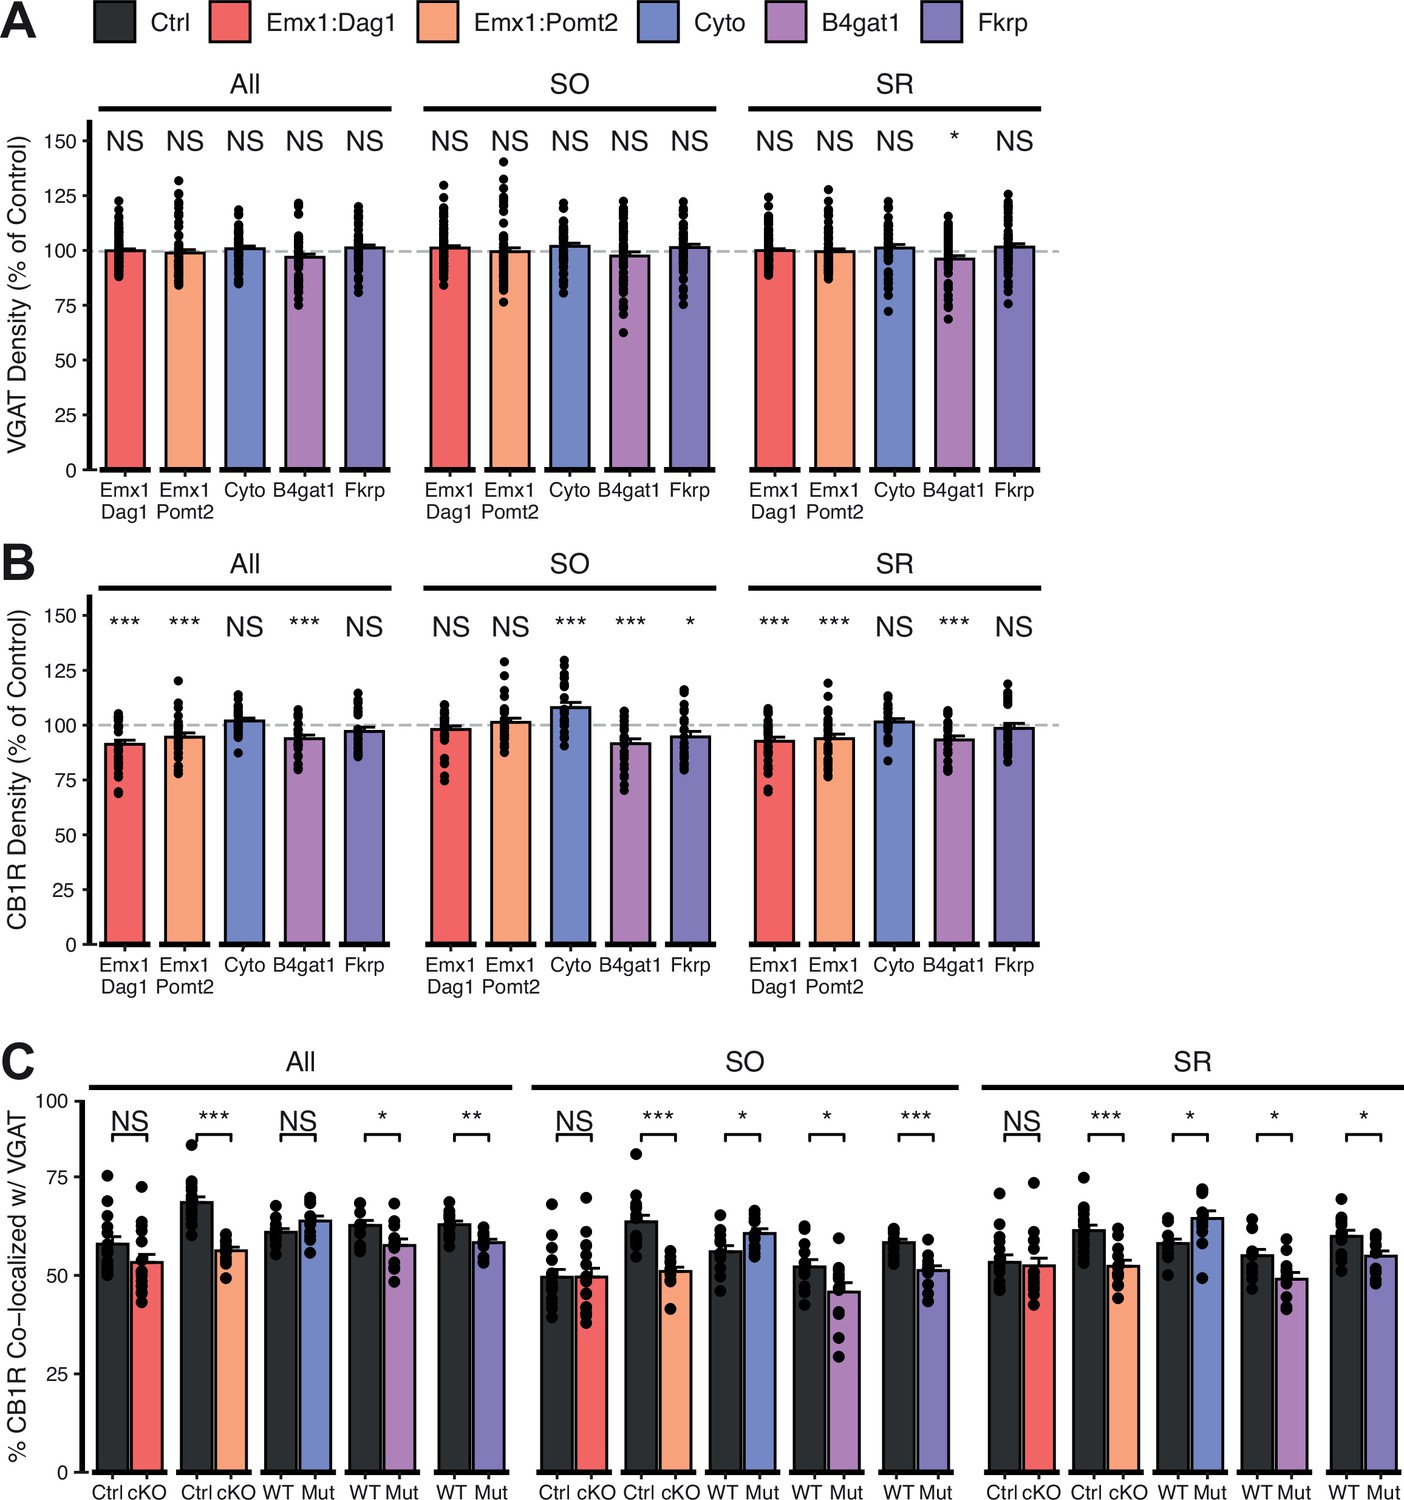
Extended quantification of images in Figure 5A–C.
Quantification within hippocampal CA1 SO and SR regions and all regions pooled together. (A) Quantification of VGAT puncta density expressed as a percent of control. (B) Quantification of CB1R puncta density expressed as a percent of control. (C) Quantification of co-localization between VGAT and CB1R to estimate putative CB1R+ basket cell synapse formation. Error bars show mean + SEM. (To see quantification of puncta densities and co-localization in SP see Figure 5D–F.) See Supplementary file 1 for Ns. Significance: *=p < 0.05, **=p < 0.01, ***=p < 0.001, NS = p ≥ 0.05.
Figure 5—figure supplement 2
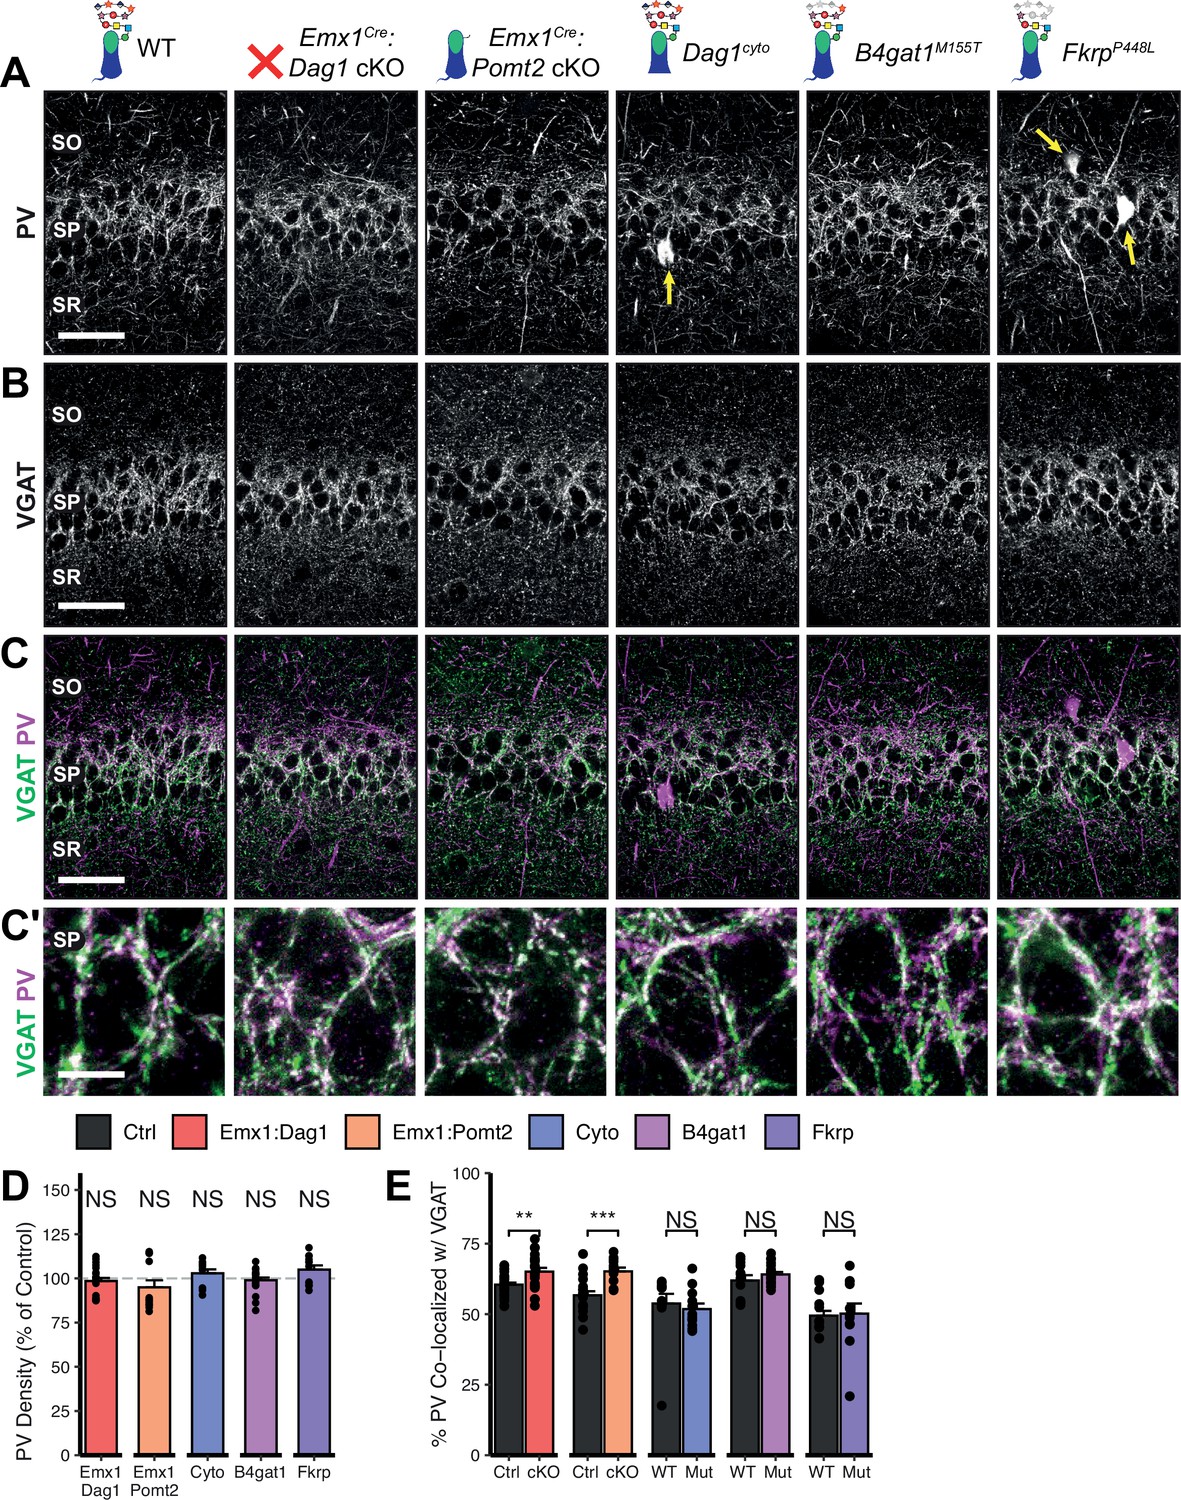
Dag1 and Pomt2 cKOs exhibit increased PV+ basket synapse formation in stratum pyramidale of hippocampal CA1.
P30 coronal sections immunostained for (A) PV and (B) VGAT in hippocampal CA1; merged image in (C) shows PV in magenta and VGAT in green. Yellow arrows indicate PV+ interneuron cell bodies. (A–C) Scale bar = 50 μm. (Higher magnification view of SP in (C’); scale bar = 10 μm.) (D) Quantification of PV puncta density in SP expressed as a percent of control. (E) Quantification of co-localization between VGAT and PV in SP to estimate putative PV+ basket synapse formation. Error bars show mean + SEM. (To see quantification of puncta densities and co-localization in SO and SR see Figure 5—figure supplement 3.) See Supplementary file 1 for Ns. Significance: *=p < 0.05, **=p < 0.01, ***=p < 0.001, NS = p ≥ 0.05. PV, parvalbumin; SO, stratum oriens; SP, stratum pyramidale; SR, stratum radiatum.
-
Figure 5—figure supplement 2—source data 1
Raw data for quantification in Figure 5—figure supplement 2D.
- https://cdn.elifesciences.org/articles/87965/elife-87965-fig5-figsupp2-data1-v1.csv
-
Figure 5—figure supplement 2—source data 2
Raw data for quantification in Figure 5—figure supplement 2E.
- https://cdn.elifesciences.org/articles/87965/elife-87965-fig5-figsupp2-data2-v1.csv
Figure 5—figure supplement 3
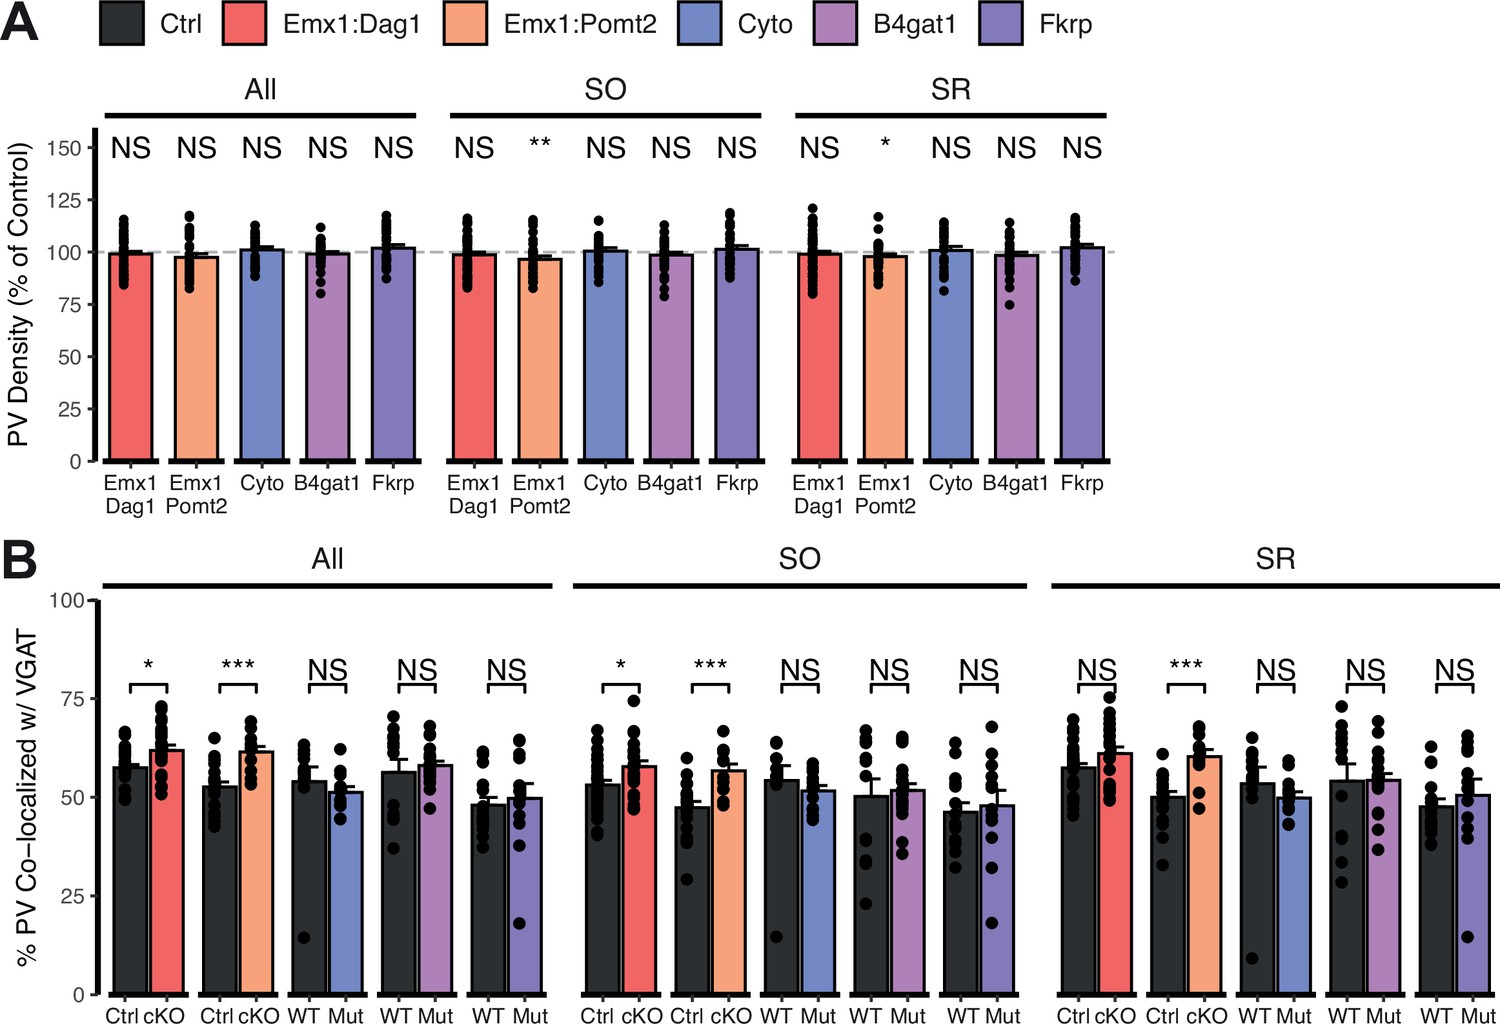
Extended quantification of images in Figure 5—figure supplement 2A–C.
Quantification within hippocampal CA1 SO and SR regions and all regions pooled together. (A) Quantification of PV puncta density expressed as a percent of control. (B) Quantification of co-localization between VGAT and PV to estimate putative PV+ basket cell synapse formation. Error bars show mean + SEM. (To see quantification of puncta densities and co-localization in SP see Figure 5—figure supplement 2D, E). See Supplementary file 1 for Ns. Significance: *=p < 0.05, **=p < 0.01, ***=p < 0.001, NS = p ≥ 0.05. PV, parvalbumin; SO, stratum oriens; SP, stratum pyramidale; SR, stratum radiatum.
Figure 6 with 1 supplement
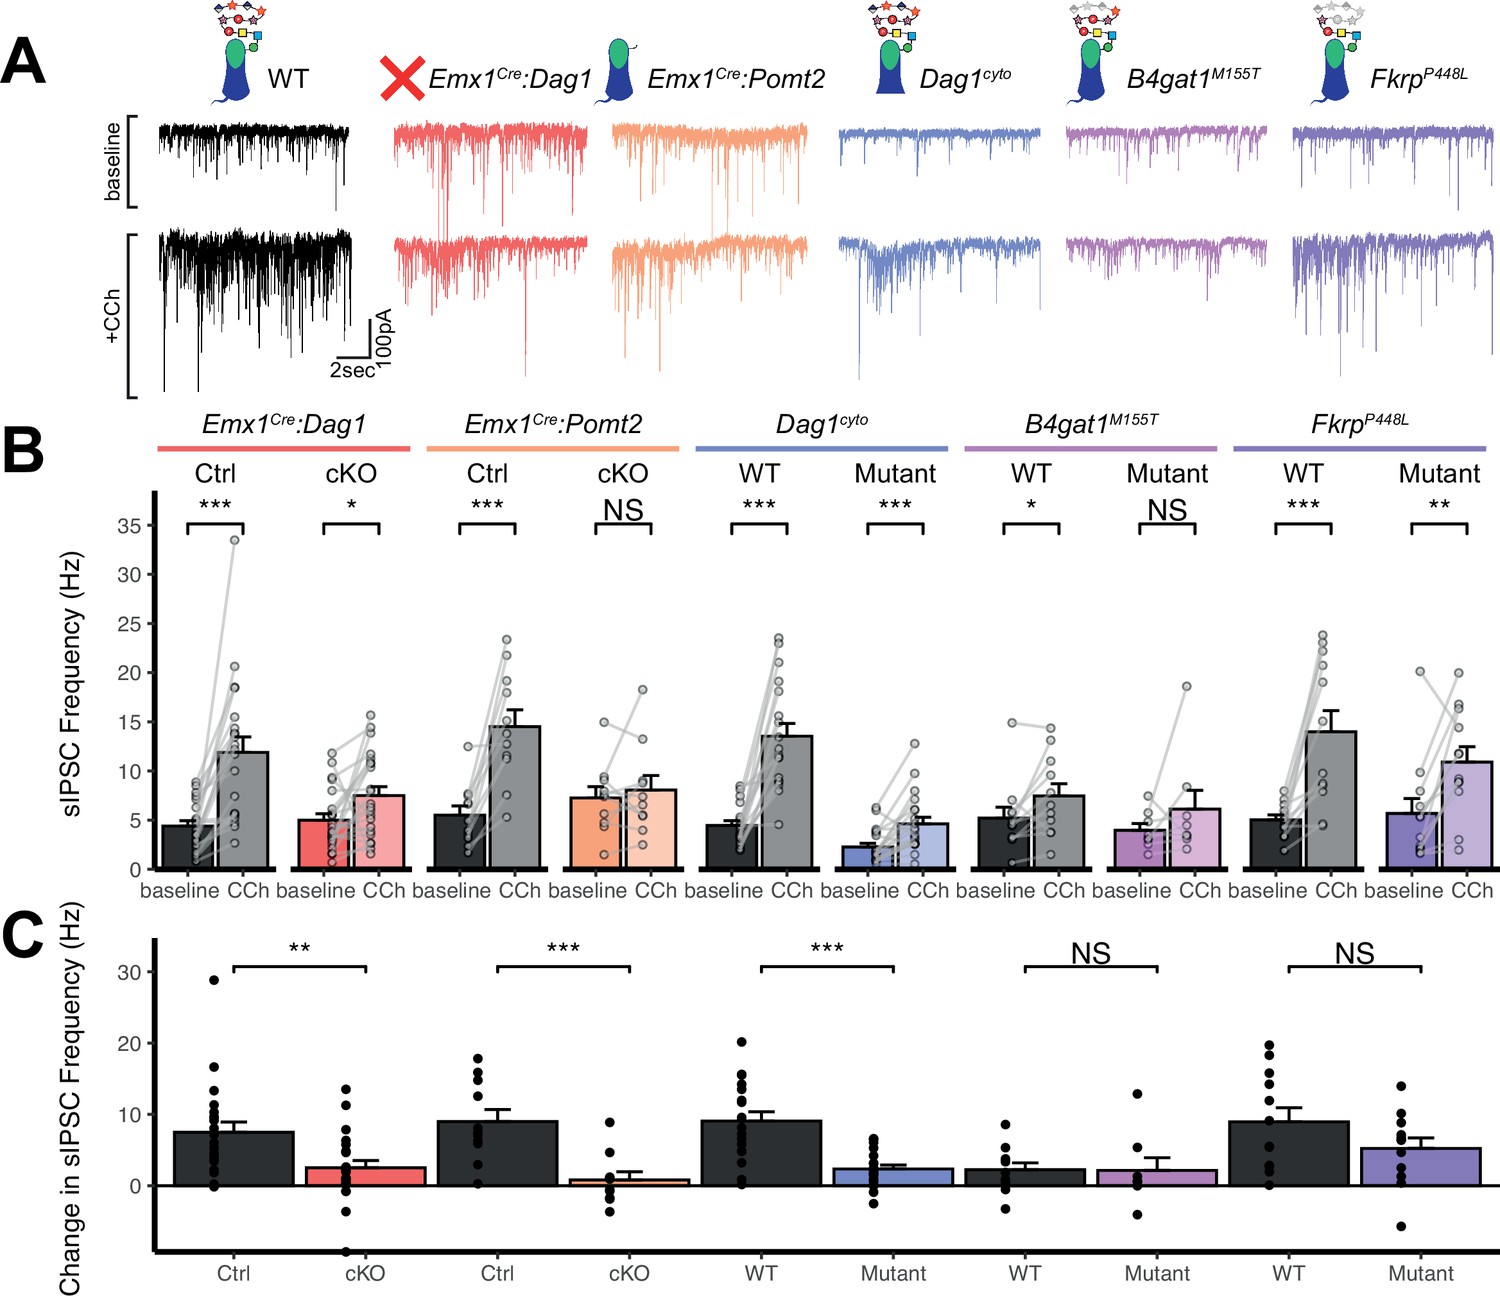
Dag1 is required for CCK+/CB1R+ IN synapse function in hippocampal CA1 in a manner dependent on both glycosylation and intracellular interactions.
(A) Representative traces showing + seconds of sIPSC recordings at baseline (top) and after the addition of carbachol (bottom). (B) Quantification of average sIPSC frequency at baseline and after the addition of carbachol. (C) Quantification of the change in sIPSC frequency with the addition of carbachol. Error bars show mean + SEM. See Supplementary file 1 for Ns. Significance: *=p < 0.05, **=p < 0.01, ***=p < 0.001, NS = p ≥ 0.05. Abbreviations: sIPSC, spontaneous inhibitory postsynaptic current; CCh, carbachol.
-
Figure 6—source data 1
Raw data for quantification in Figure 6B-C and Figure 6—figure supplement 1A, B.
- https://cdn.elifesciences.org/articles/87965/elife-87965-fig6-data1-v1.csv
Figure 6—figure supplement 1
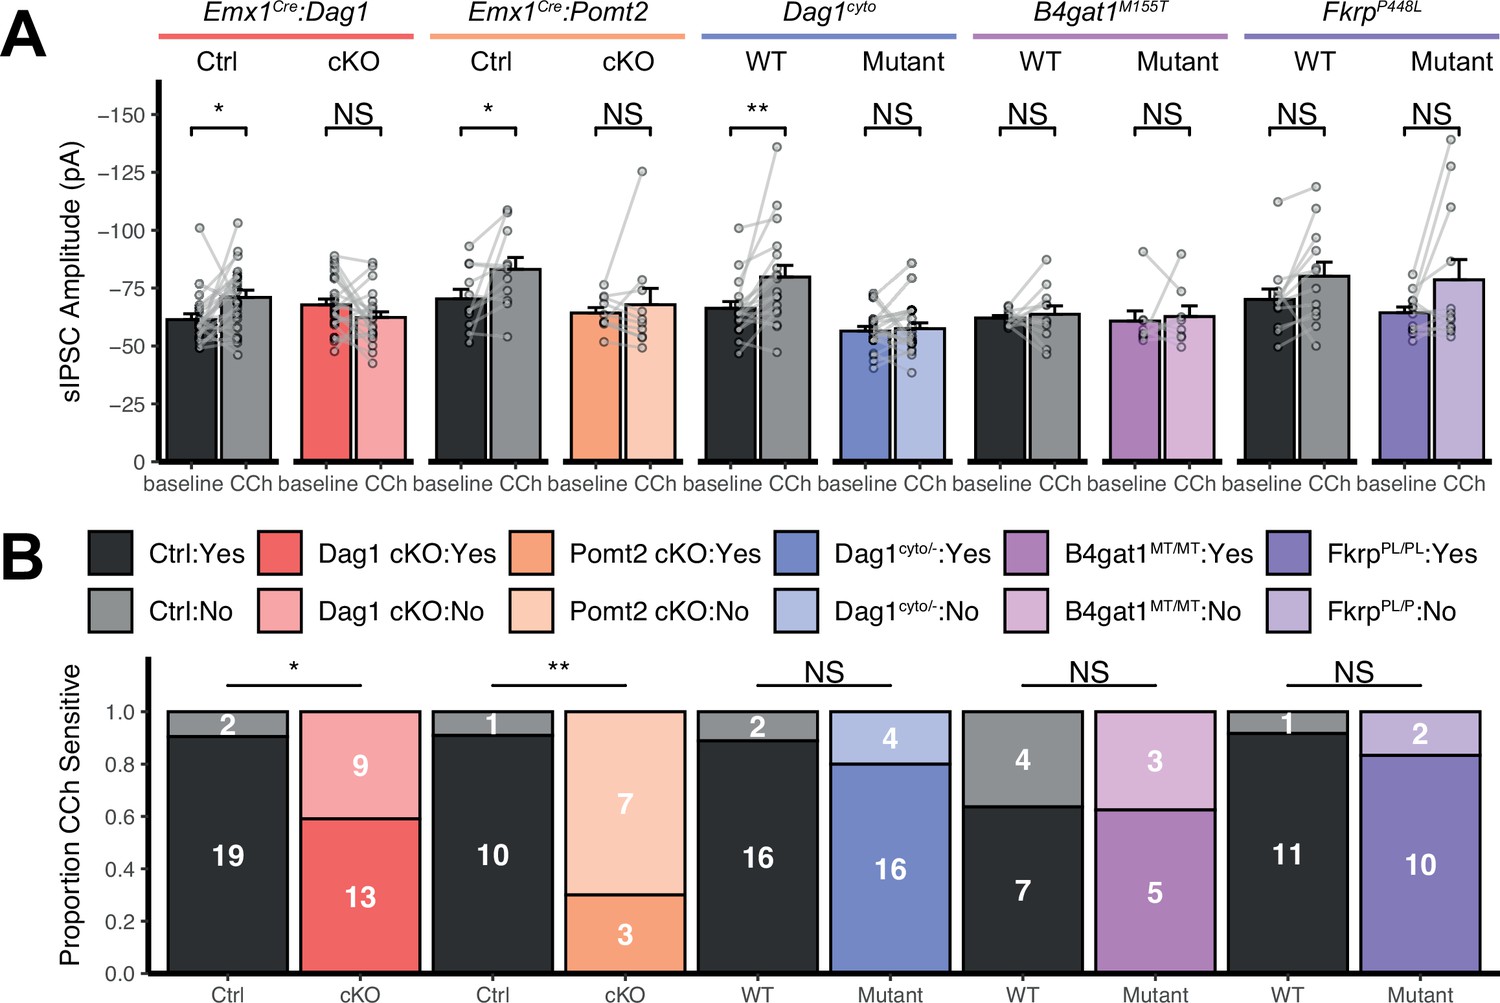
Additional quantification of sIPSC recordings.
(A) Quantification of average sIPSC amplitude at baseline and after the addition of carbachol. Error bars show mean + SEM. (B) Quantification of the proportion of carbachol-sensitive cells within each genotype. Non-responsive cells are shown in lighter color, responsive cells are shown in darker color. See Supplementary file 1 for Ns. Significance: *=p < 0.05, **=p < 0.01, ***=p < 0.001, NS = p ≥ 0.05. Abbreviations: sIPSC, spontaneous inhibitory postsynaptic current; CCh, carbachol.
Figure 7 with 1 supplement
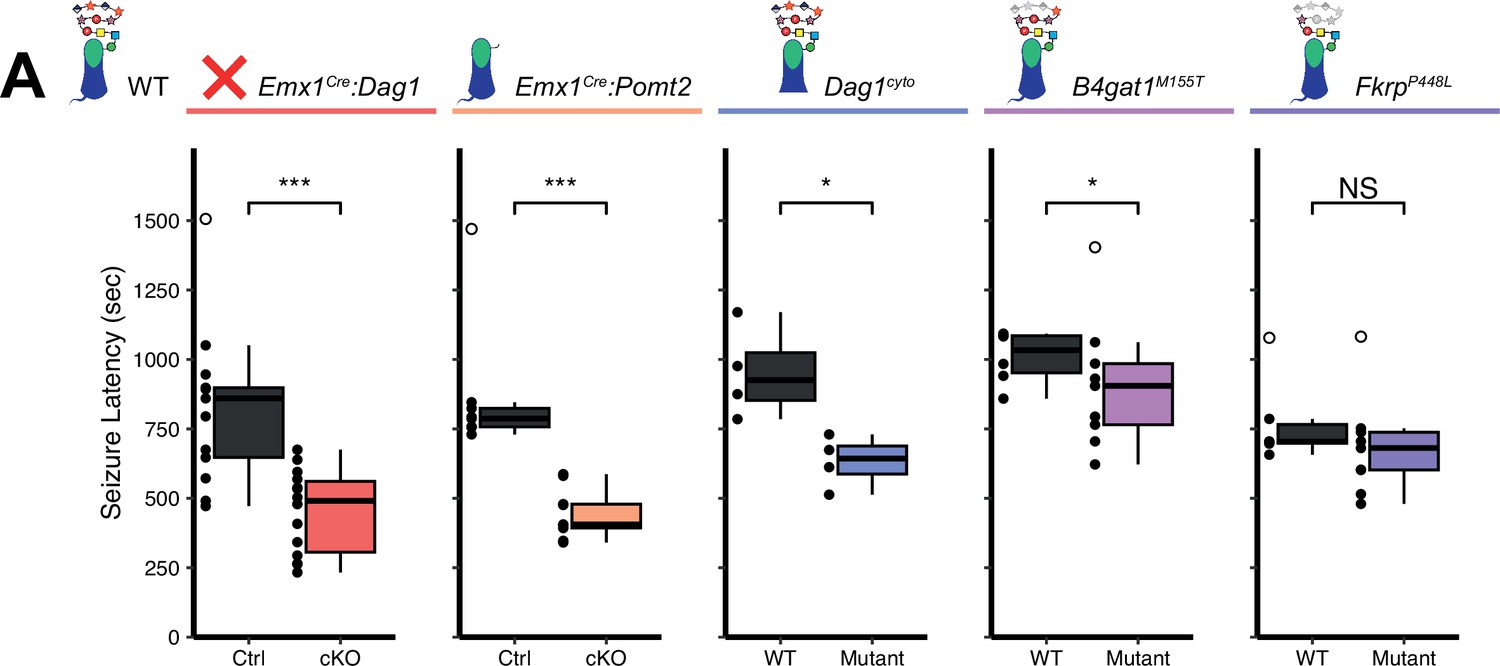
Reduced seizure induction threshold in models of dystroglycanopathy.
(A) Quantification of latency (in seconds) to generalized tonic clonic seizure upon exposure to 10% flurothyl delivered at a constant rate. Open points denote statistical outliers. See Supplementary file 1 for Ns. Significance: *=p < 0.05, **=p < 0.01, ***=p < 0.001, NS = p ≥ 0.05.
-
Figure 7—source data 1
Raw data for quantification in Figure 7A and Figure 7—figure supplement 1A–C.
- https://cdn.elifesciences.org/articles/87965/elife-87965-fig7-data1-v1.csv
Figure 7—figure supplement 1
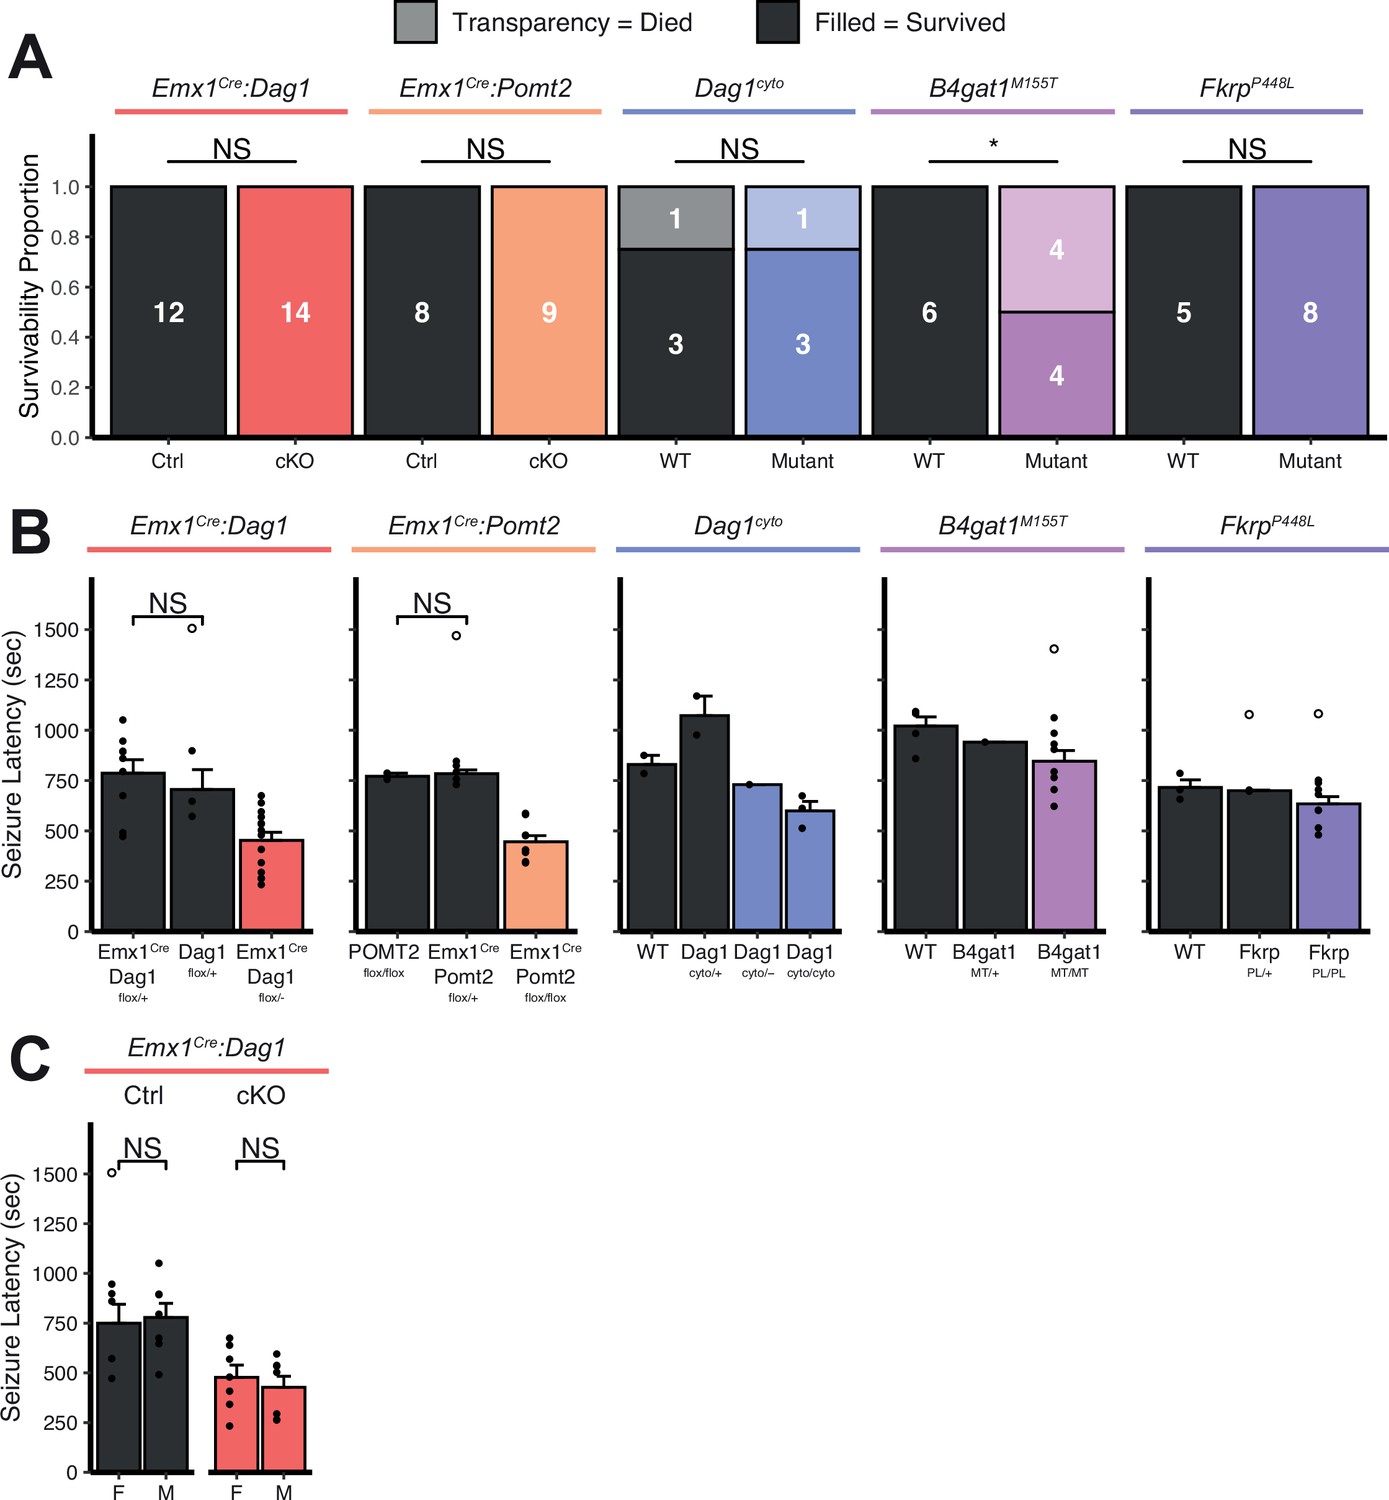
Extended seizure induction threshold data.
(A) Proportion of mice that died as a direct result of a flurothyl-induced seizure. Survivors are depicted in darker colors, fatalities in lighter colors. (B) To minimize the number of animals needed for this experiment, certain genotypes were pooled together. Here we show that pooled genotypes are not different. Statistical tests were run where Ns were sufficient to provide meaningful comparison. (C) Seizure latencies split by sex. Note: only the Emx1Cre:Dag1 group is powered sufficiently to statistically compare sexes. Open points denote statistical outliers. Error bars show mean + SEM.
Tables
Table 1
Mouse strains.
| Common name | Strain name | Reference | Stock # |
|---|---|---|---|
| Dag1Flox | B6.129(Cg)-Dag1tm2.1Kcam/J | Cohn et al., 2002 | 009652 |
| Dag1cyto | N/A | Satz et al., 2009 | N/A |
| Pomt2Flox | POMT2tm1.1Hhu/J | Hu et al., 2011 | 017880 |
| B4gat1M155T | B6(C3)-B4GAT1m1Ddg/J | Wright et al., 2012 | 022018 |
| FkrpP448L | C57BL/6NJ-Fkrpem1Lgmd/J | Chan et al., 2010 | 034659 |
| R26LSL-H2B-mCherry | B6.Gt(ROSA)26Sortm1.1Ksvo | Peron et al., 2015 | 023139 |
| Emx1Cre | B6.129S2-Emx1tm1(cre)Krj/J | Gorski et al., 2002 | 005628 |
| NestinCre | B6.Cg-Tg(Nes-cre)1Kln/J | Tronche et al., 1999 | 003771 |
| NEXCre | NeuroD6tm1(cre)Kan | Goebbels et al., 2006 | MGI:4429523 |
| Sox2Cre | B6N.Cg-Edil3Tg(Sox2-cre)1Amc/J | Hayashi et al., 2002 | 014094 |
Table 2
Breeding schemes.
| Breeding Scheme | Control Genotype | Mutant Genotype |
|---|---|---|
| Emx1Cre/+;Dag1+/- x Dag1Flox/Flox | Emx1Cre/+;Dag1Flox/+ | Emx1Cre/+;Dag1Flox/- |
| NestinCre/+;Dag1+/- x Dag1Flox/Flox | NestinCre/+;Dag1Flox/+ | NestinCre/+;Dag1Flox/- |
| NEXCre/+;Dag1+/- x Dag1Flox/Flox | NEXCre/+;Dag1Flox/+ | NEXCre/+;Dag1Flox/- |
| Emx1Cre/+;Pomt2Flox/+ x Pomt2Flox/Flox | Emx1Cre/+;Pomt2Flox/+ | Emx1Cre/+;Pomt2Flox/Flox |
| Dag1cyto/+ x Dag1+/- | WT | Dag1cyto/- |
| B4gat1M155T/+ x B4gat1M155T/+ | WT | B4gat1M155T/M155T |
| FkrpP448L/+ x FkrpP448L/+ | WT | FkrpP448L/P448L |
Table 3
Primary antibodies used for immunohistochemistry.
| Target | Host species | Dilution | Source | Catalog # | RRID |
|---|---|---|---|---|---|
| α-Dystroglycan (IIH6C4) | Mouse | 1:250 | Millipore | 05–593 | AB_309828 |
| β-Dystroglycan | Mouse | 1:50 | Leica Biosystems | NCL-b-DG | AB_442043 |
| CB1R | Guinea pig | 1:1000 | Synaptic Systems | 258–104 | AB_2661870 |
| Cux1 | Rabbit | 1:500 | Santa Cruz Biotech | sc-13024 | AB_2261231 |
| Laminin | Rabbit | 1:1000 | Sigma-Aldrich | L9393 | AB_477163 |
| NECAB1 | Rabbit | 1:500 | Sigma-Aldrich | HPA023629 | AB1848014 |
| NECAB2 | Rabbit | 1:500 | Proteintech | 12257–1-AP | AB_2877841 |
| NeuN | Mouse | 1:250 | Millipore | MAB377 | AB_2298772 |
| Parvalbumin | Rabbit | 1:1000 | Swant | PV27 | AB_2631173 |
| Parvalbumin | Mouse | 1:50 | Swant | 235 | AB_10000343 |
| Somatostatin | Rabbit | 1:2000 | Peninsula Labs | T-4103 | AB_518614 |
| Tbr1 | Rabbit | 1:500 | Millipore | AB10554 | AB_10806888 |
| VGAT | Rabbit | 1:500 | Synaptic Systems | 131–003 | AB_887869 |
| VGAT | Guinea Pig | 1:500 | Synaptic Systems | 131–005 | AB_1106810 |
| VGlut3 | Rabbit | 1:1000 | Synaptic Systems | 135–203 | AB_887886 |
| VIP | Rabbit | 1:1000 | ImmunoStar | 20077 | AB_572270 |
Additional files
-
Supplementary file 1
Experimental N, technical replicates, and sex for experiments.
- https://cdn.elifesciences.org/articles/87965/elife-87965-supp1-v1.xlsx
-
Supplementary file 2
Statistical tests and analysis for all data.
- https://cdn.elifesciences.org/articles/87965/elife-87965-supp2-v1.xlsx
-
MDAR checklist
- https://cdn.elifesciences.org/articles/87965/elife-87965-mdarchecklist1-v1.pdf
Download links
A two-part list of links to download the article, or parts of the article, in various formats.
Downloads (link to download the article as PDF)
Open citations (links to open the citations from this article in various online reference manager services)
Cite this article (links to download the citations from this article in formats compatible with various reference manager tools)
Inhibitory CCK+ basket synapse defects in mouse models of dystroglycanopathy
eLife 12:RP87965.
https://doi.org/10.7554/eLife.87965.3


