Multimodal neural correlates of childhood psychopathology
- McConnell Brain Imaging Centre, Montreal Neurological Institute, McGill University, Canada
- Centre for Sleep and Cognition & Centre for Translational MR Research, Yong Loo Lin School of Medicine, National University of Singapore, Singapore
- Department of Electrical and Computer Engineering, National University of Singapore, Singapore
- N.1 Institute for Health & Institute for Digital Medicine, National University of Singapore, Singapore
- Young Adult Unit, Psychiatric Specialities Division, Geneva University Hospitals and Department of Psychiatry, Faculty of Medicine, University of Geneva, Switzerland
- Adolescent Unit, Division of General Paediatric, Department of Paediatrics, Gynaecology and Obstetrics, Geneva University Hospitals, Switzerland
- Division of Adult Psychiatry, Department of Psychiatry, Geneva University Hospitals, Switzerland
- Division of Development and Growth, Department of Paediatrics, Gynaecology and Obstetrics, Geneva University Hospitals and University of Geneva, Switzerland
- Neuro-X Institute, Ecole Polytechnique Fédérale de Lausanne, Switzerland
- Department of Radiology and Medical Informatics, Faculty of Medicine, University of Geneva, Switzerland
- Integrative Sciences and Engineering Programme, National University Singapore, Singapore
- Martinos Center for Biomedical Imaging, Massachusetts General Hospital, United States
Figures
Figure 1 with 3 supplements
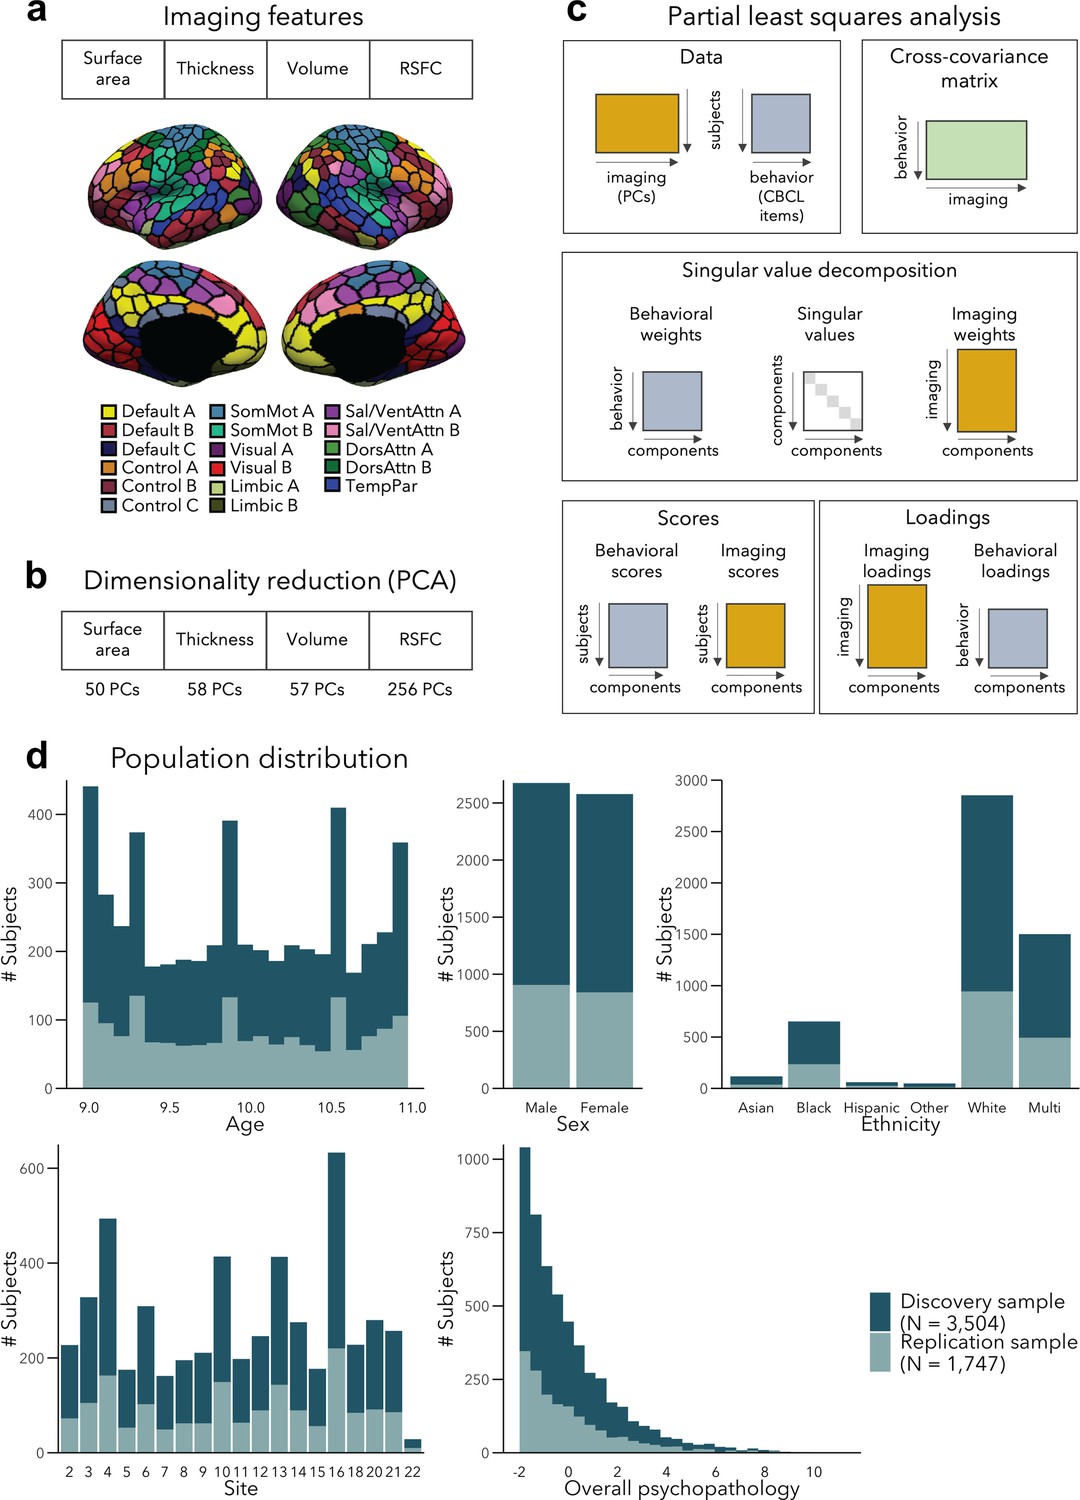
Analysis workflow.
(a) Imaging features. (b) The imaging data underwent dimensionality reduction using principal components analysis (PCA), keeping the components explaining 50% of the variance within each imaging modality, resulting in 421 components in total. (c) Partial least squares analysis between the multimodal imaging data (421 principal components [PCs]) and the behavioral data (118 Child Behavior Checklist [CBCL] items). (d) Distribution of age, sex, ethnicity, acquisition site, and overall psychopathology were matched between the discovery and replication samples. Overall psychopathology represents the first principal component derived from all the CBCL items used in the main analysis.
Figure 1—figure supplement 1
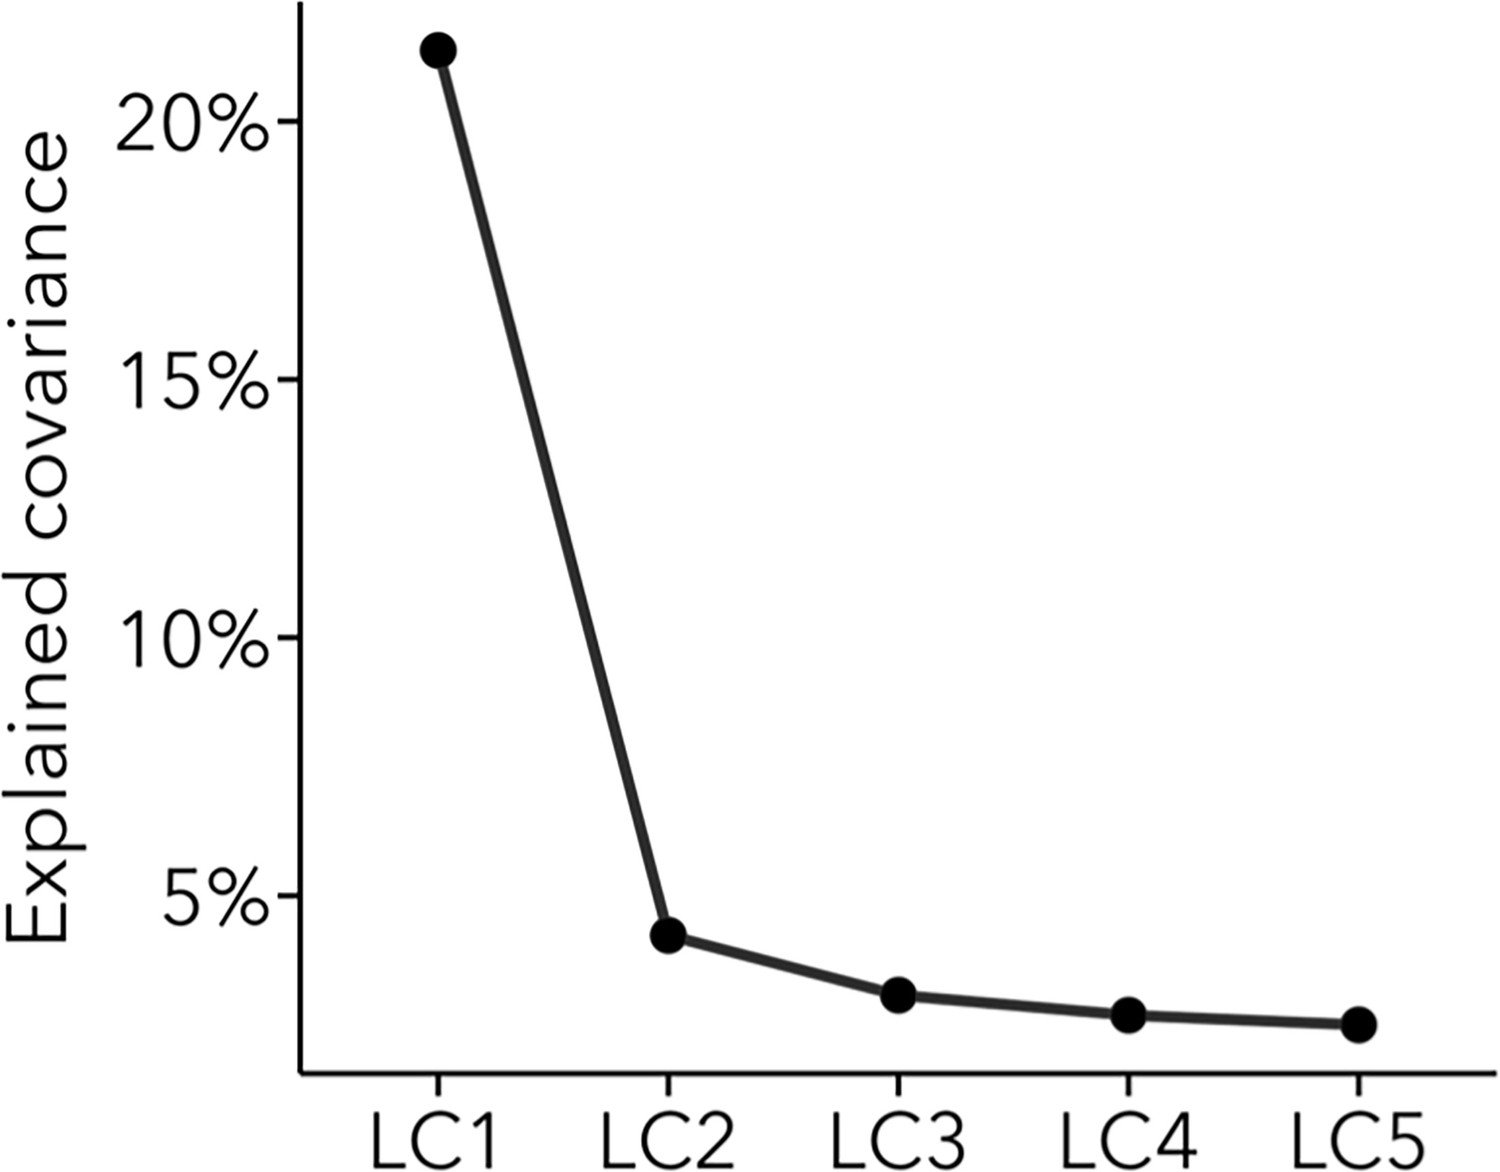
Explained covariance by LCs 1–5.
They explained 21%, 4%, 3%, 3%, and 2% of the covariance between the multimodal imaging and behavioral data, respectively.
Figure 1—figure supplement 2

Post hoc analyses testing for sex differences in the composite scores between male and female participants.
Male participants had higher imaging and behavior composite scores in LC1 (p factor) and LC3 (neurodevelopmental symptoms), while female participants had higher imaging and behavior composite scores in LC2 (internalizing symptoms).
Figure 1—figure supplement 3
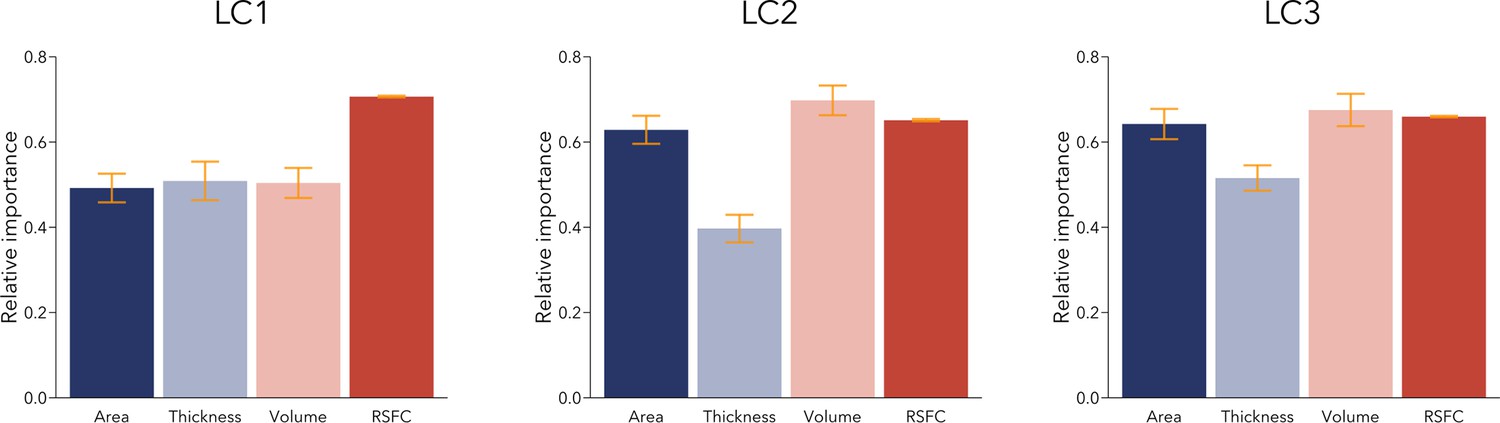
Relative importance of imaging modalities in LCs 1–3.
The error bars show the standard deviation across bootstrap samples in analysis of the Discovery cohort (n=3,504). Resting-state functional connectivity (RSFC) yields higher importance in LC1 compared to structural loadings, while thickness yields lower importance compared to all other modalities in LCs 2–3.
Figure 2 with 3 supplements
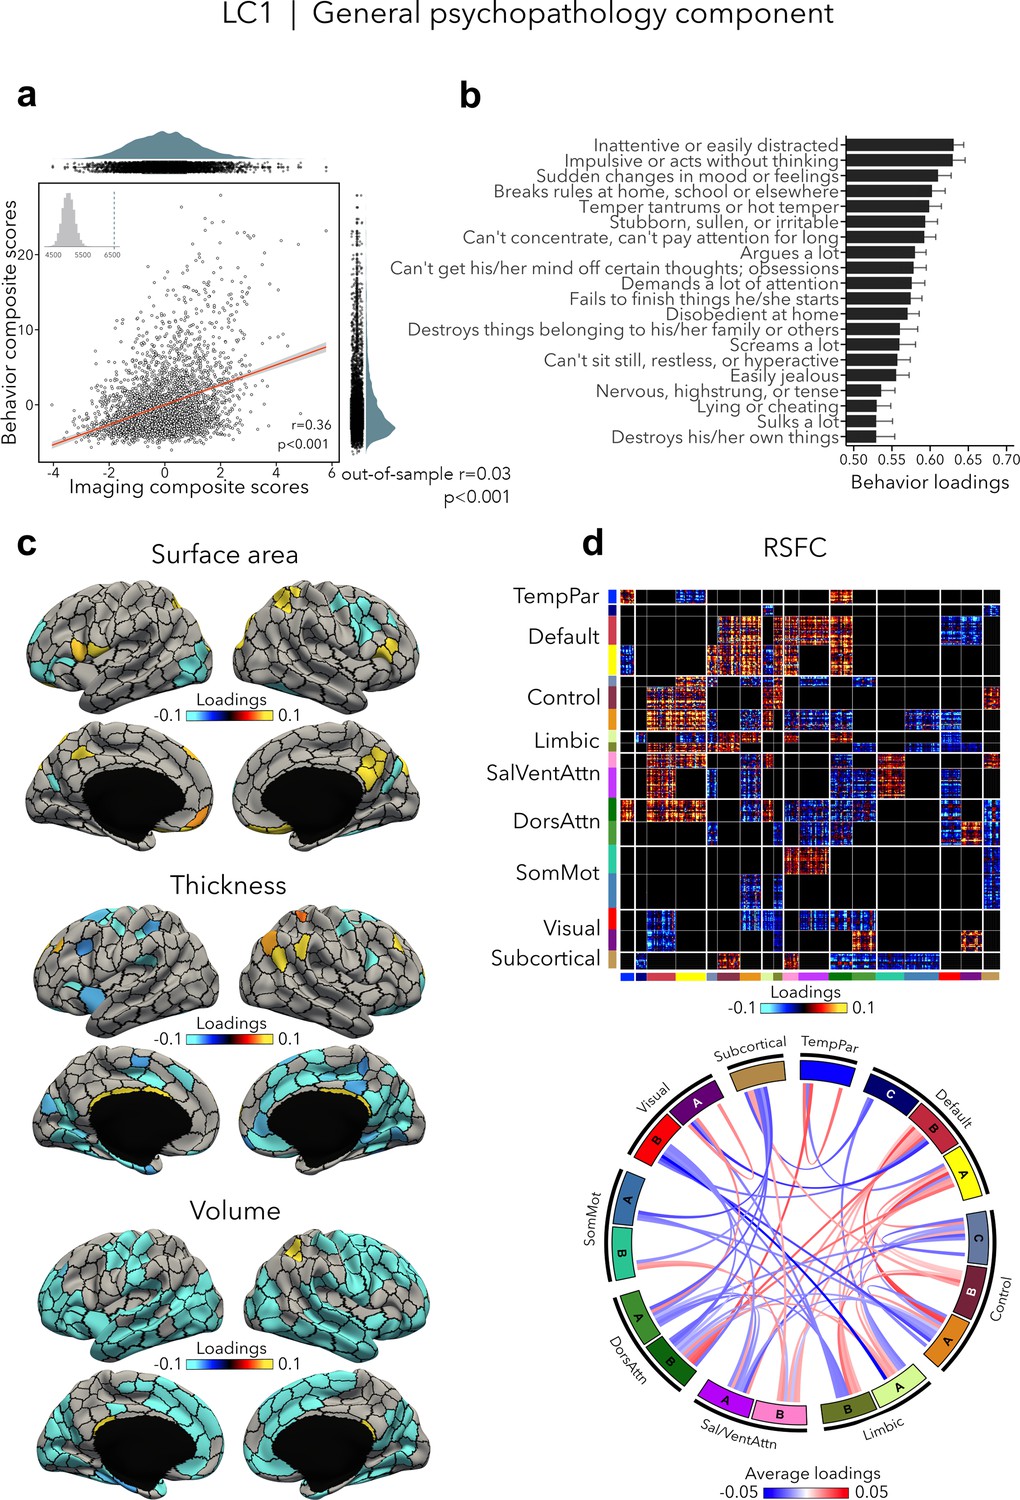
LC1 represents the general psychopathology (p) factor.
(a) Correlation between imaging and behavior composite scores (r = 0.36, permuted p < 0.001; out-of-sample generalizability of model statistics: r = 0.03, permuted p < 0.001). Each dot represents a different participant from the discovery sample (n=3,504). The inset on the top left shows the null distribution of (permuted) singular values from the permutation test, while the dotted line shows the original singular value. (b) Top behavior loadings characterizing this component. Higher scores represent higher (i.e., worse) symptom severity. Error bars indicate bootstrap-estimated confidence intervals. (c) Significant surface area, thickness, and volume loadings (after bootstrap resampling and FDR correction q < 0.05) associated with LC1. (d) Significant RSFC loadings (after bootstrap resampling and FDR correction q < 0.05) associated with LC1. RSFC loadings were thresholded, whereby only within- or between-network blocks with significant bootstrapped Z-scores are shown. Network blocks follow the colors associated with the 17 Yeo networks (Schaefer et al., 2018; Yeo et al., 2011) and subcortical regions (Fischl et al., 2002). Chord diagram summarizing significant within- and between-network RSFC loadings. See also Figure 1a for more detailed network visualization. DorsAttn, dorsal attention; RSFC, resting-state functional connectivity; SalVentAttn, salience/ventral attention; SomMot, somatosensory-motor; TempPar, temporoparietal.
Figure 2—figure supplement 1
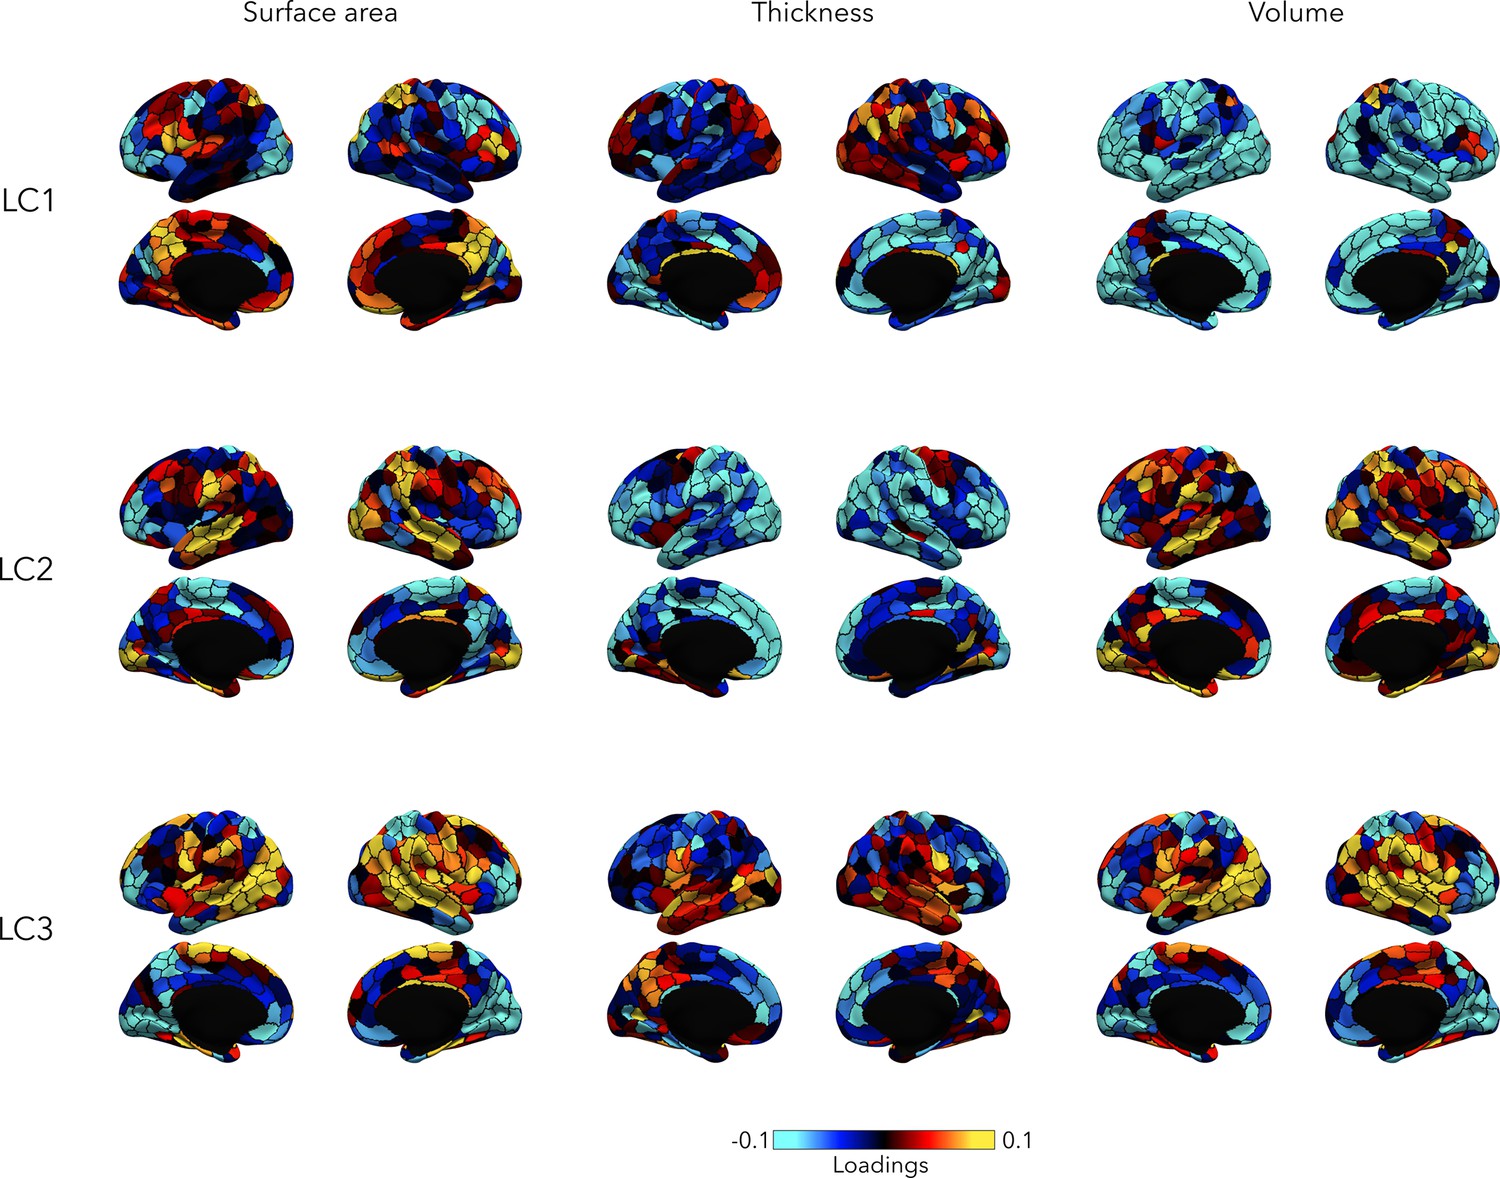
Structural loadings associated with LCs 1–3, before FDR correction.
Figure 2—figure supplement 2
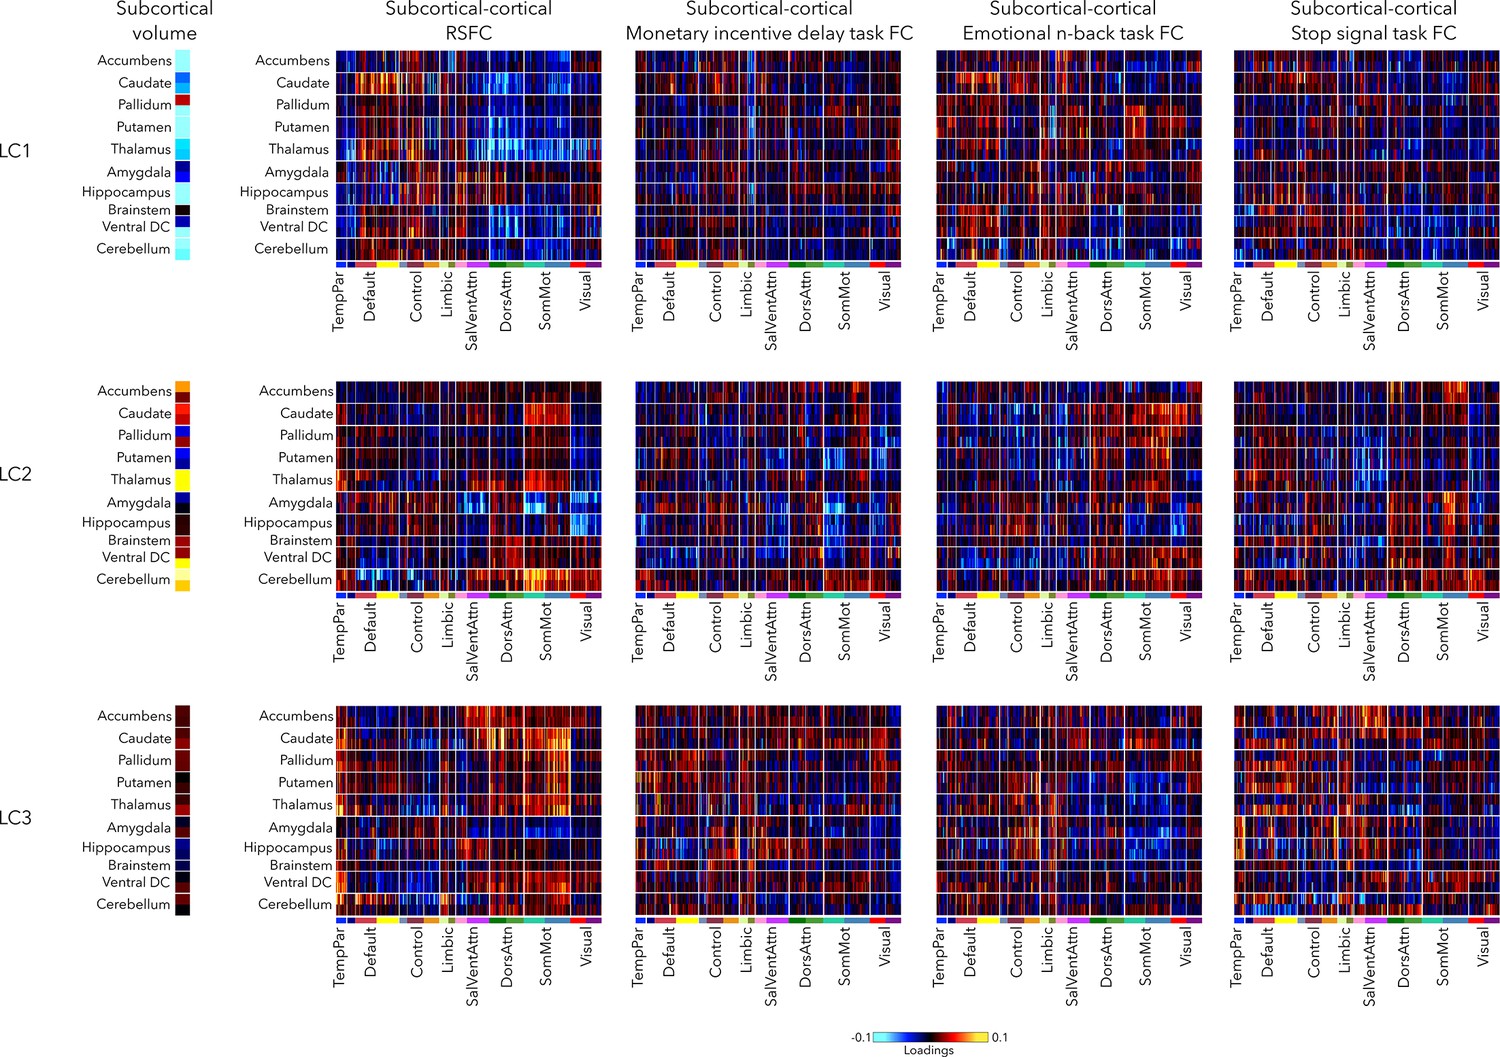
Subcortical volume loadings, and subcortical–cortical functional connectivity (FC) loadings during resting-state and the three functional magnetic resonance imaging (fMRI) tasks (Monetary Incentive Delay, Emotional n-back, and Stop Signal Task).
Figure 2—figure supplement 3
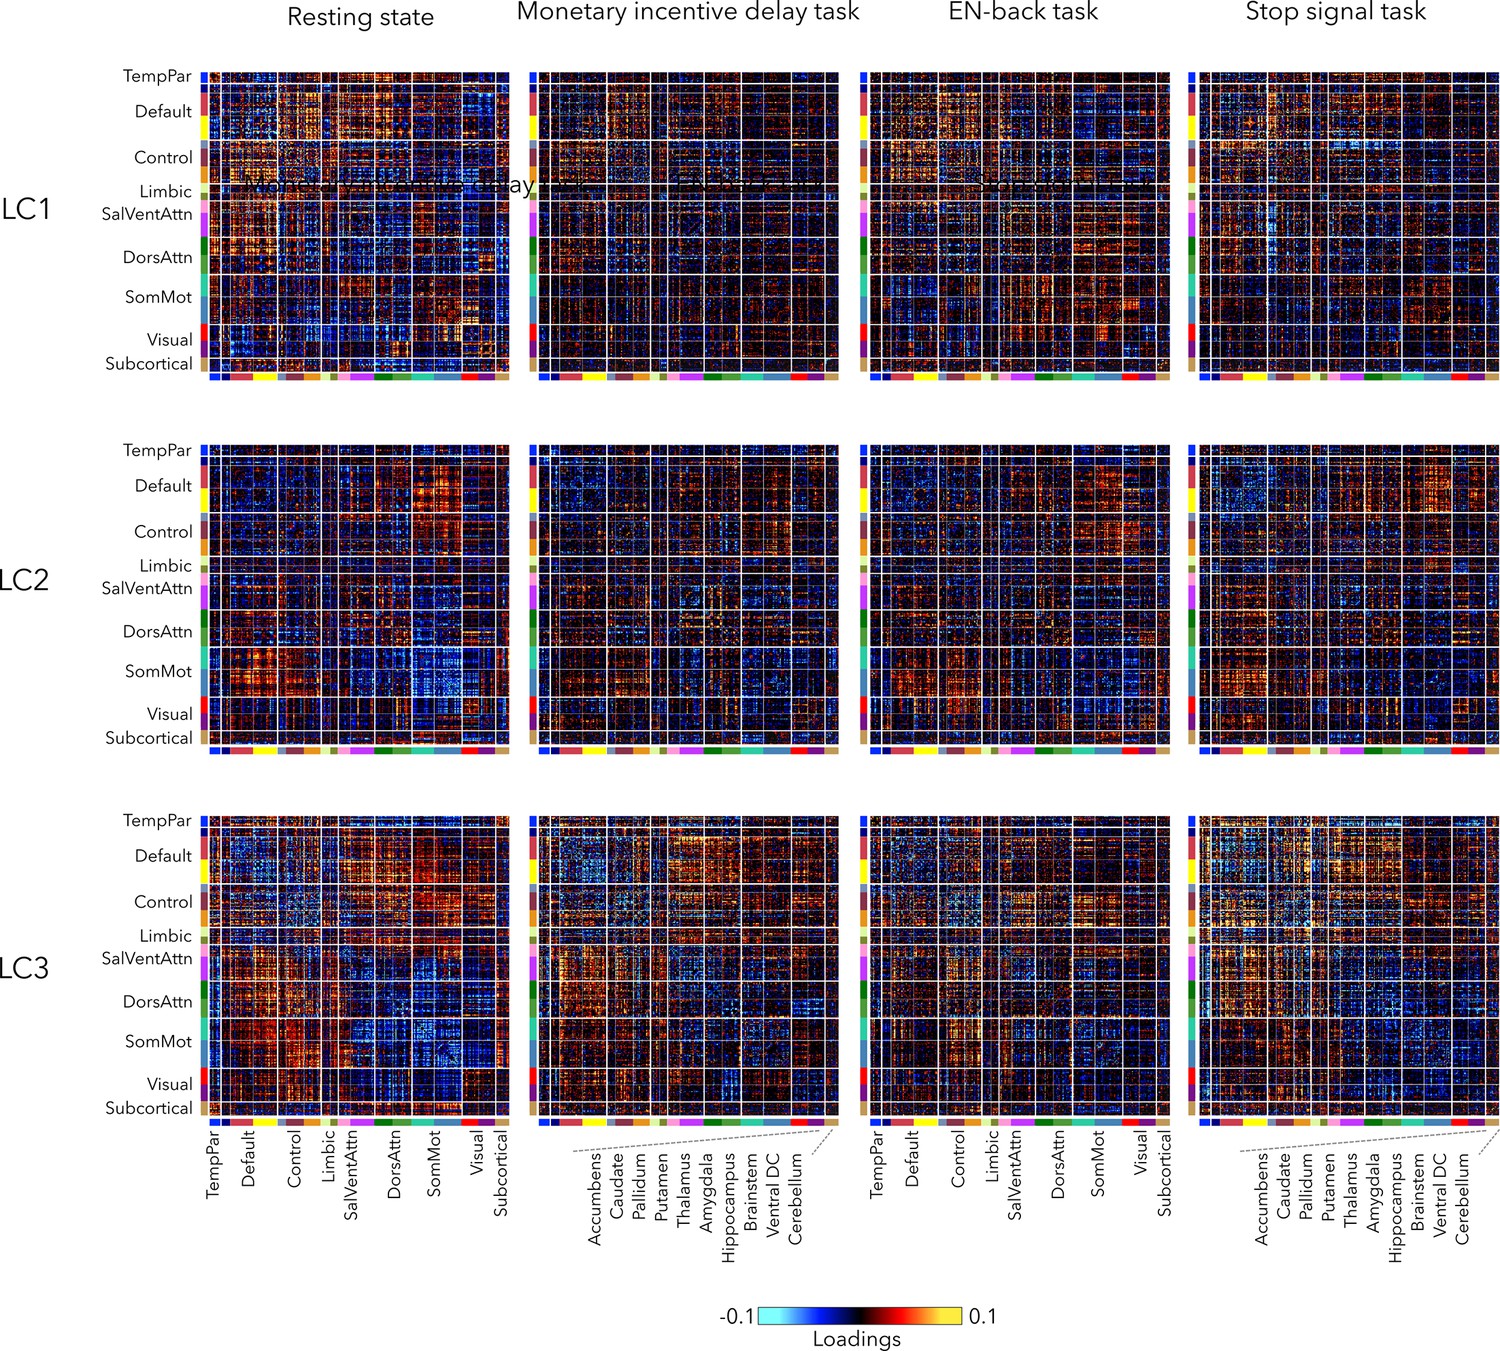
FC patterns during rest and three functional magnetic resonance imaging (fMRI) tasks associated with LCs 1–3, before FDR correction.
Figure 3
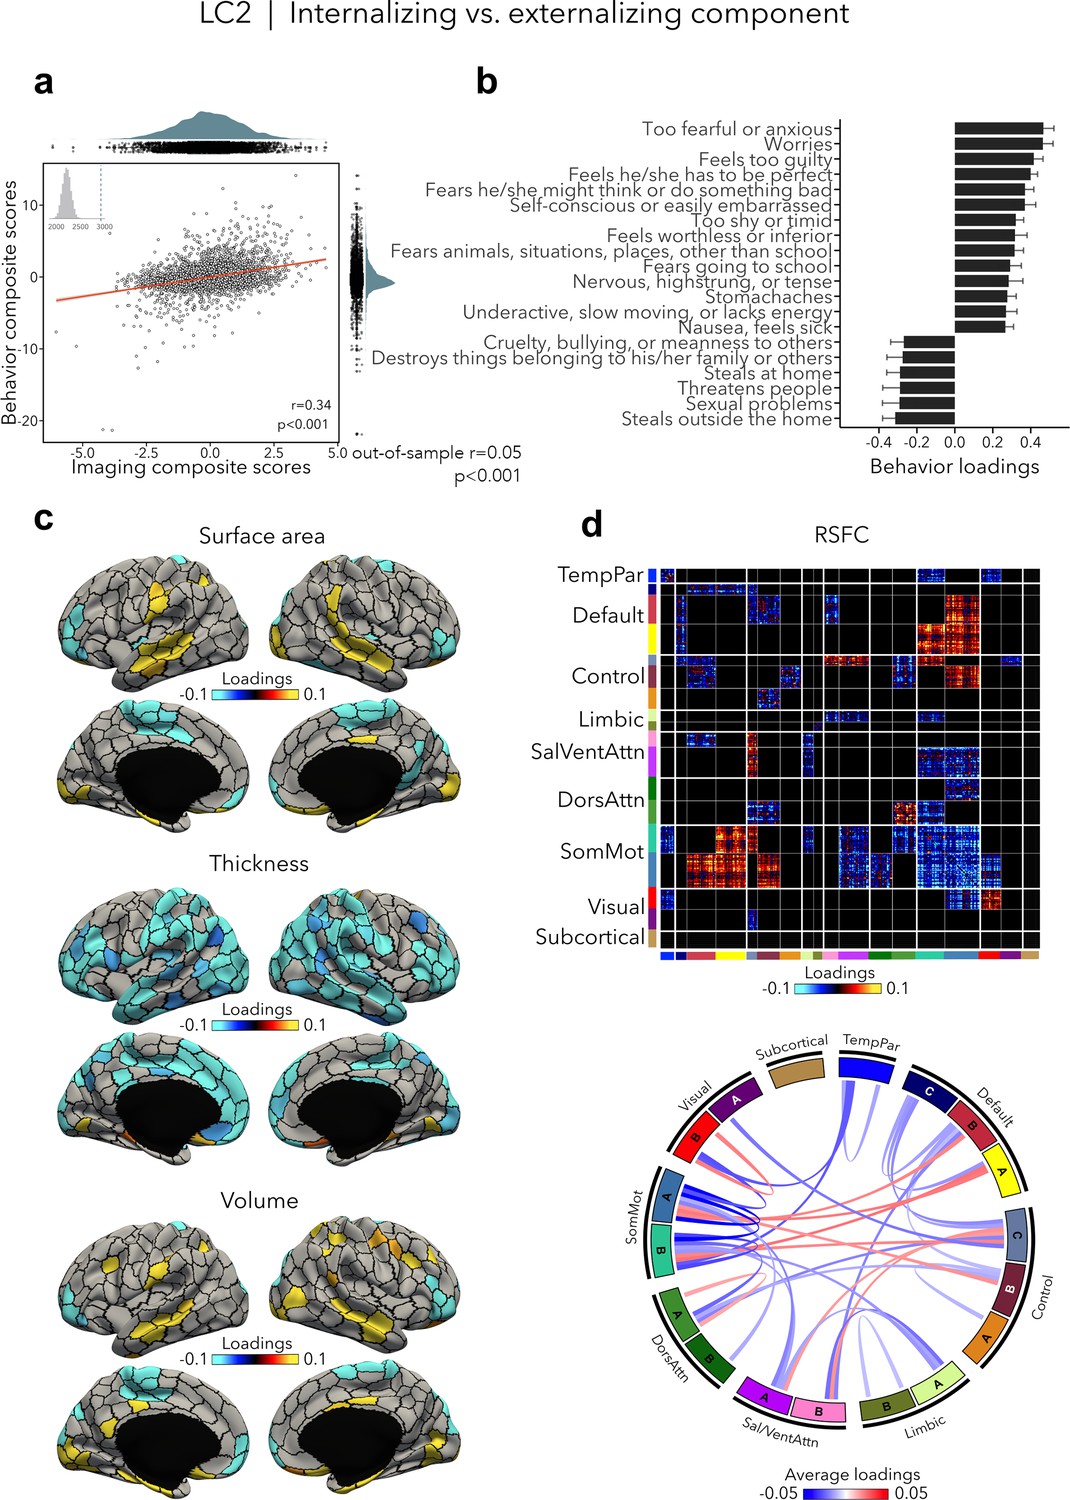
Internalizing vs. externalizing component (LC2).
(a) Correlation between imaging and behavior composite scores (r = 0.34, permuted p < 0.001; out-of-sample generalizability of model statistics: r = 0.05, permuted p < 0.001). Each dot represents a different participant from the discovery sample (n=3,504). The inset on the top left shows the null distribution of (permuted) singular values from the permutation test, while the dotted line shows the original singular value. (b) Top absolute behavior loadings characterizing this component. Higher (positive) loadings represent increased (i.e., worse) internalizing symptoms, while lower (negative) loadings represent worse externalizing symptoms. Error bars indicate bootstrap-estimated confidence intervals. (c) Significant surface area, thickness, and volume loadings (after bootstrap resampling and FDR correction q < 0.05) associated with LC2. (d) Significant RSFC loadings were thresholded, whereby only within- or between-network blocks with significant bootstrapped Z-scores are shown. Network blocks following the colors associated with the 17 Yeo networks (Schaefer et al., 2018; Yeo et al., 2011) and subcortical regions (Fischl et al., 2002). Chord diagram summarizing significant within- and between-network RSFC loadings. See also Figure 1a for more detailed network visualization. DorsAttn, dorsal attention; RSFC, resting-state functional connectivity; SalVentAttn, salience/ventral attention; SomMot, somatosensory-motor; TempPar, temporoparietal.
Figure 4
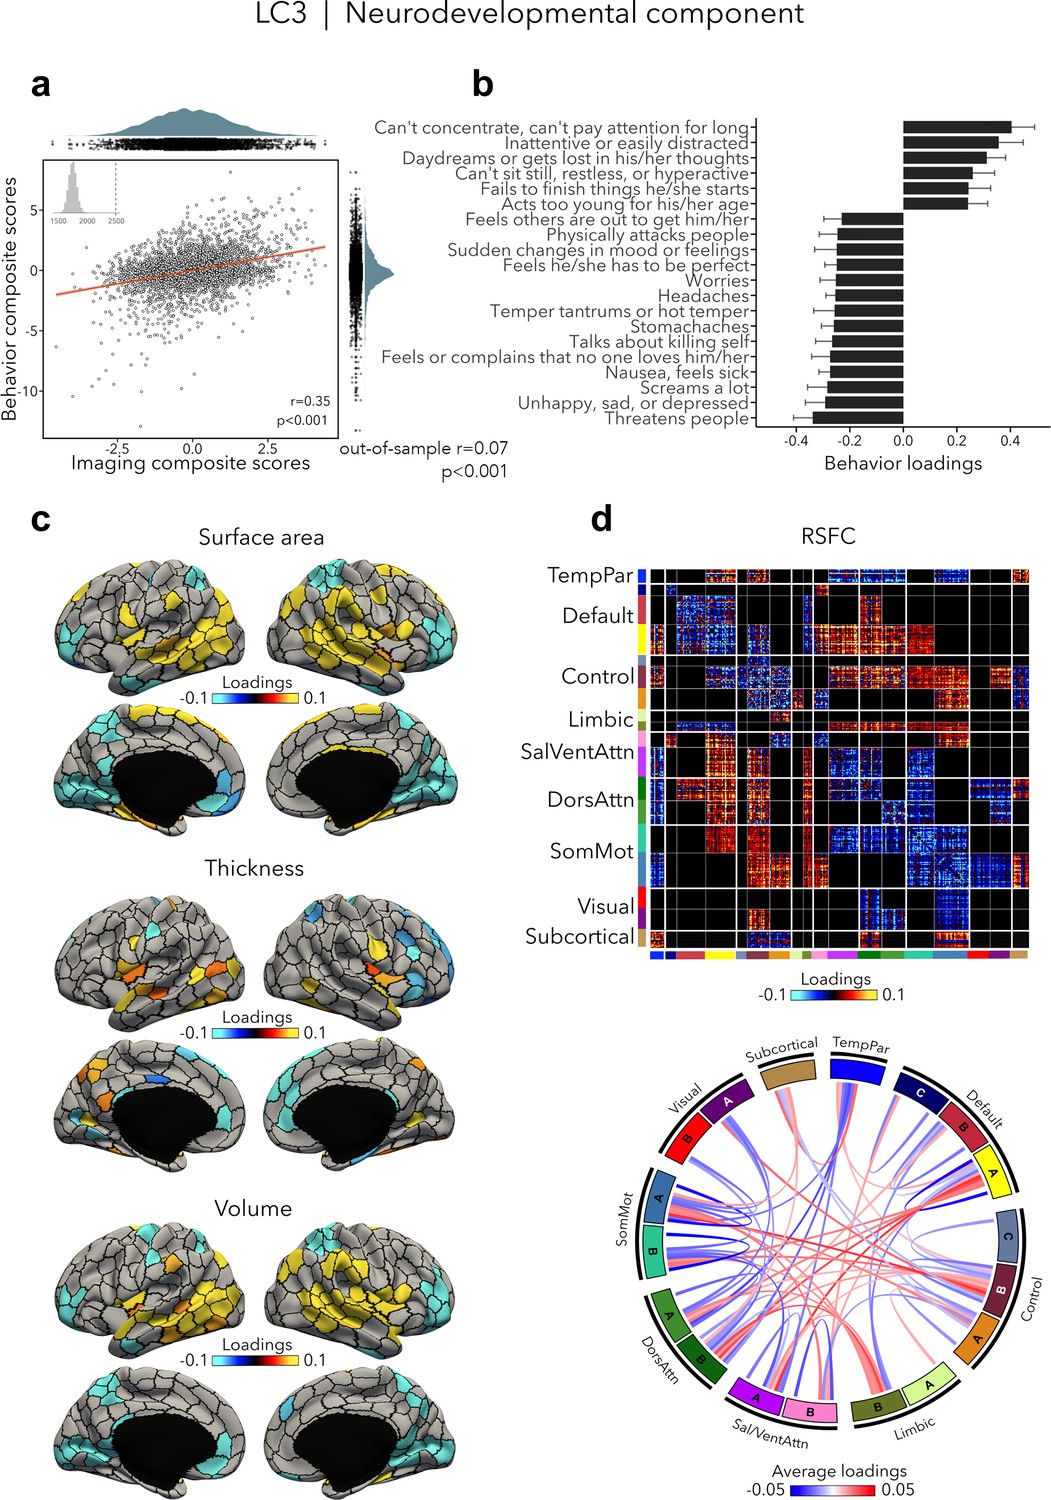
Neurodevelopmental component (LC3).
(a) Correlation between imaging and behavior composite scores (r = 0.35, permuted p = 0.001; out-of-sample generalizability of model statistics: r = 0.07, permuted p = 0.001). Each dot represents a different participant from the discovery sample (n=3,504). The inset on the top left shows the null distribution of (permuted) singular values from the permutation test, while the dotted line shows the original singular value. (b) Top absolute behavior loadings characterizing this component. Higher loadings represent increased (i.e., worse) neurodevelopmental symptoms, while lower loadings represent a mix of externalizing and internalizing symptoms linked to emotion dysregulation. Error bars indicate bootstrap-estimated confidence intervals. (c) Significant surface area, thickness, and volume loadings (after bootstrap resampling and FDR correction q < 0.05) associated with LC3. (d) Significant RSFC loadings were thresholded, whereby only within- or between-network blocks with significant bootstrapped Z-scores are shown. Network blocks following the colors associated with the 17 Yeo networks (Schaefer et al., 2018; Yeo et al., 2011) and subcortical regions (Fischl et al., 2002). Chord diagram summarizing significant within- and between-network RSFC loadings. See also Figure 1a for more detailed network visualization. DorsAttn, dorsal attention; RSFC, resting-state functional connectivity; SalVentAttn, salience/ventral attention; SomMot, somatosensory-motor; TempPar, temporoparietal.
Figure 5 with 1 supplement
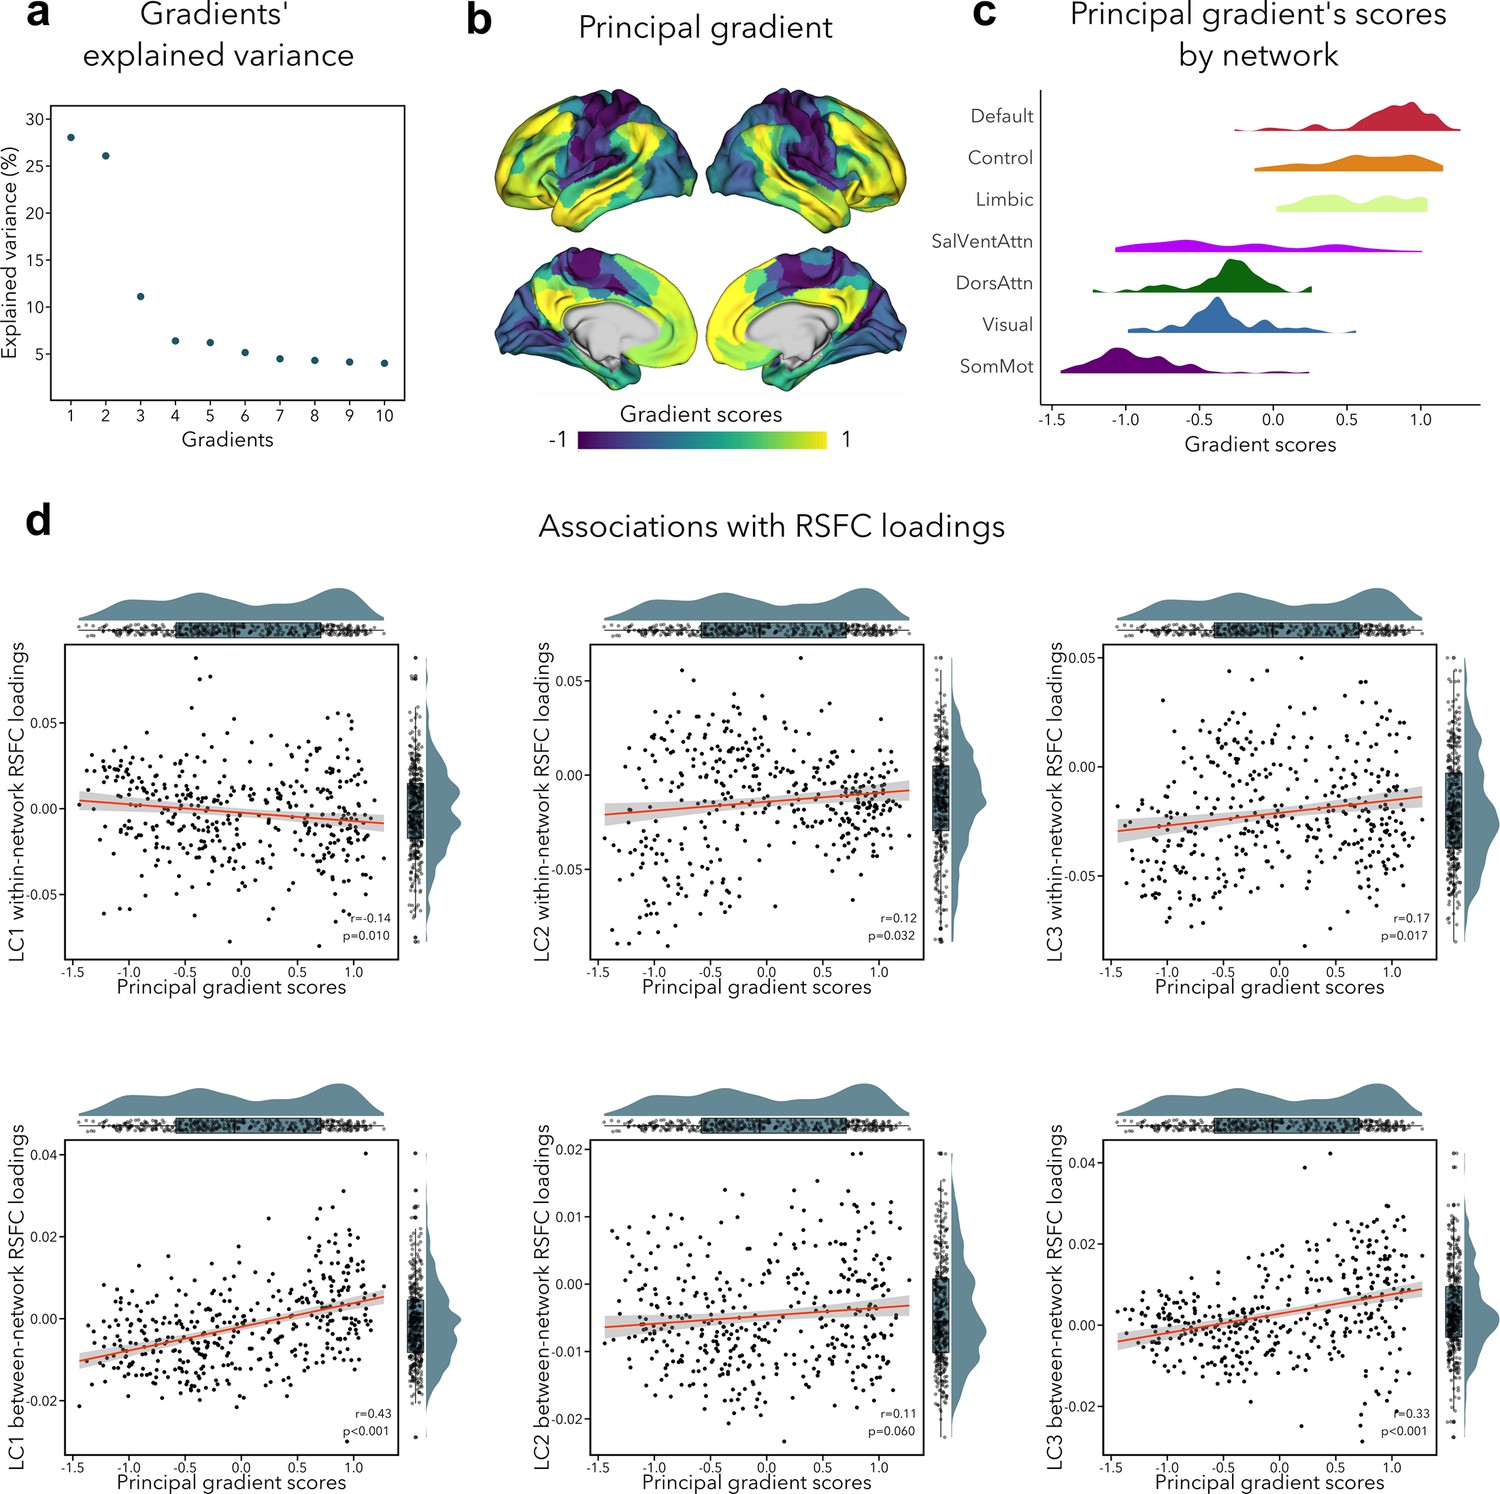
Association of functional connectivity loadings with principal functional gradient.
(a) Percentage of RSFC variance explained by each gradient. (b) Principal functional gradient, anchored by transmodal association cortices on one end and by sensory regions on the other end. (c) Distribution of principal gradient’s scores by cortical network (Yeo et al., 2011). (d) Associations between principal gradient scores and both within- and between-network RSFC loadings. For all spatial correlations, statistical significance was determined using an autocorrelation-preserving spin permutation procedure (see text, threshold for statistical significance was p < 0.05).
Figure 5—figure supplement 1
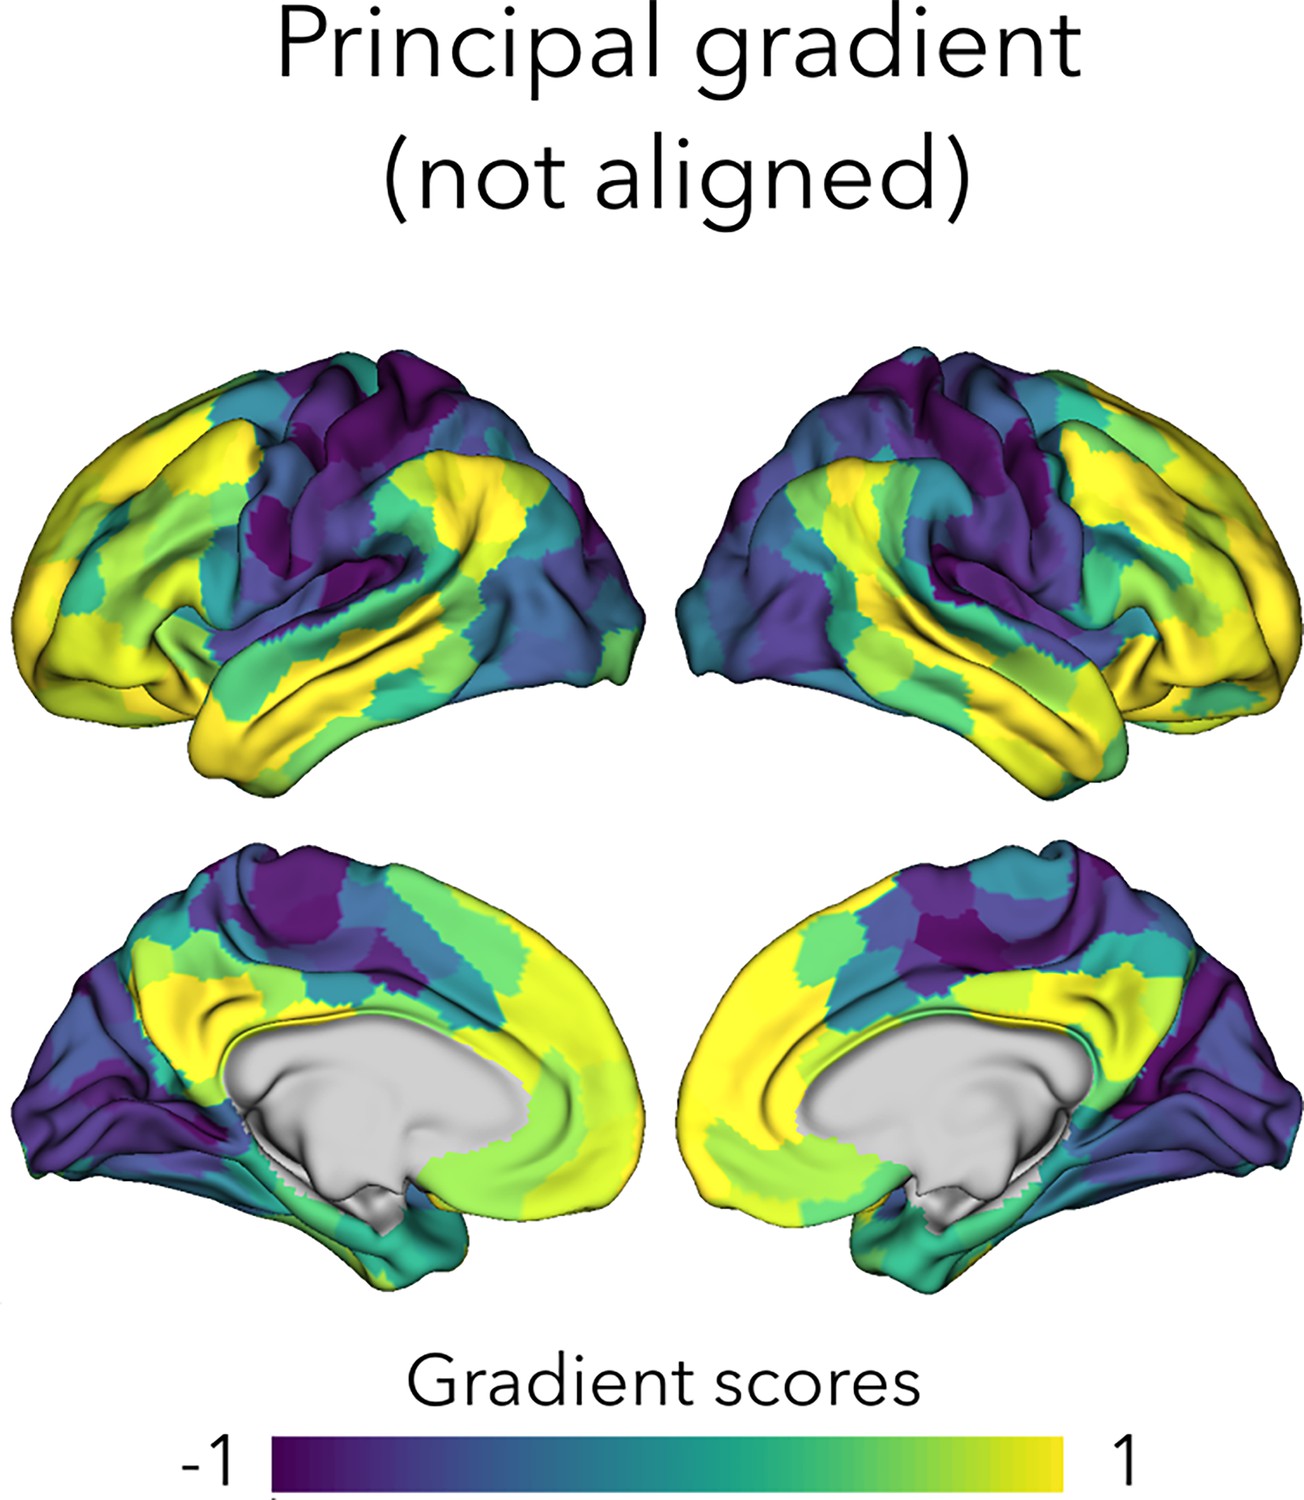
Principal gradient computed without alignment to the gradients derived from the Human Connectome Project (HCP) dataset.
Figure 6
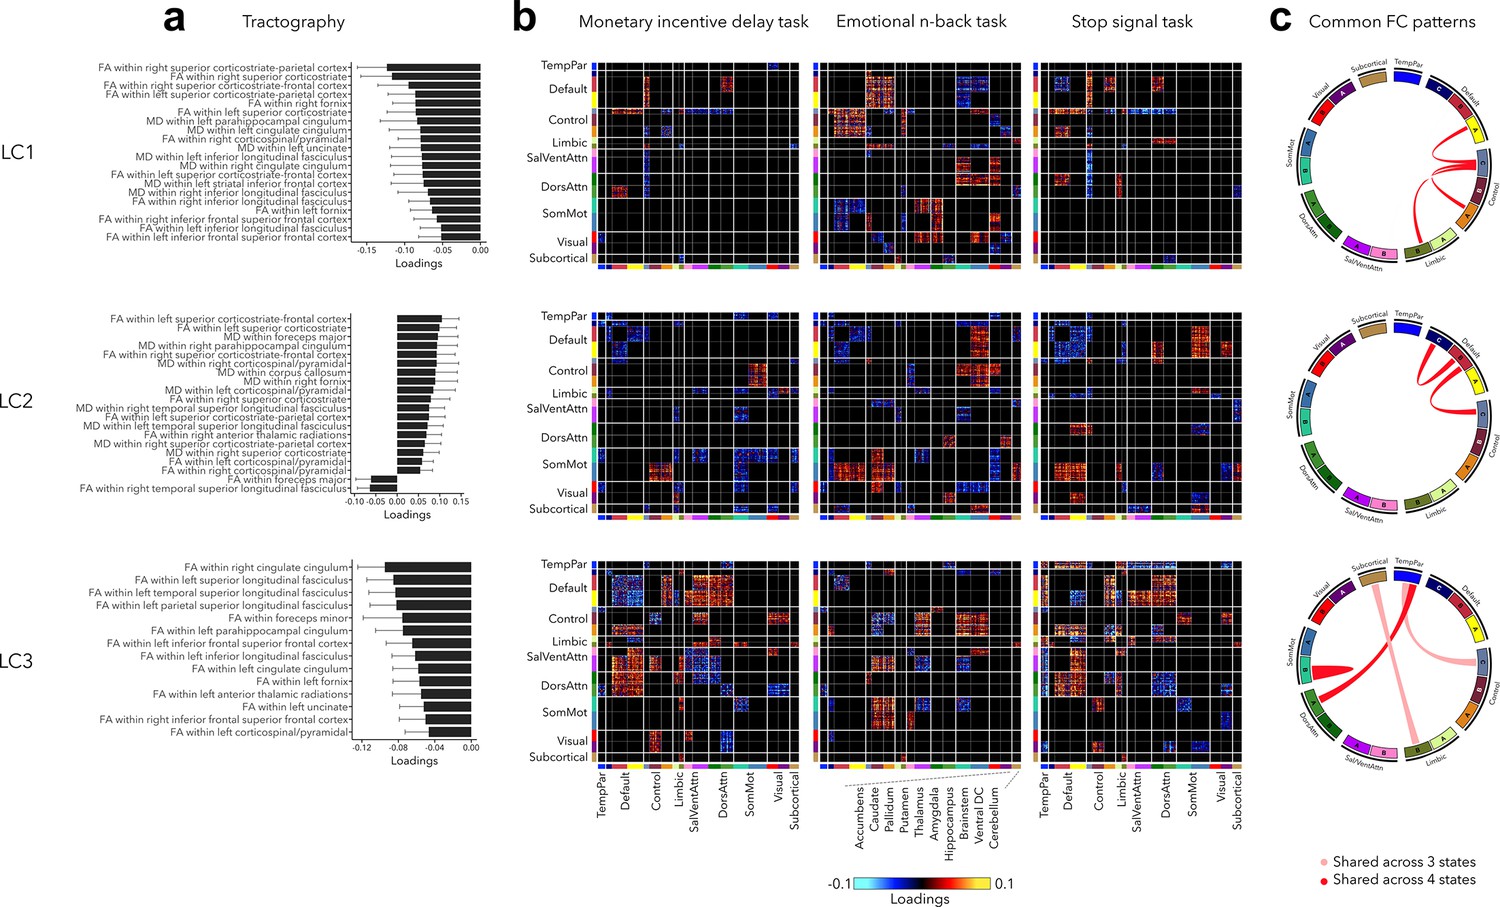
Significant diffusion magnetic resonance imaging (MRI) tractography loadings and task FC loadings associated with LC1–LC3, derived in smaller subsamples (N = 3275 for tractography and N = 1195 for task FC).
(a) Error bars on the bar charts depicting tractography loadings on the right indicate bootstrap-estimated confidence intervals. (b) Task FC loadings were thresholded, whereby only within- or between-network blocks with significant bootstrapped Z-scores are shown. Network blocks follow the colors associated with the 17 Yeo networks (Schaefer et al., 2018; Yeo et al., 2011) and subcortical regions (Fischl et al., 2002). (c) FC patterns shared across either all three task states or all four states including rest. DorsAttn, dorsal attention; RSFC, resting-state functional connectivity; SalVentAttn, salience/ventral attention; SomMot, somatosensory-motor; TempPar, temporoparietal; Ventral FC, ventral diencephalon.
Figure 7
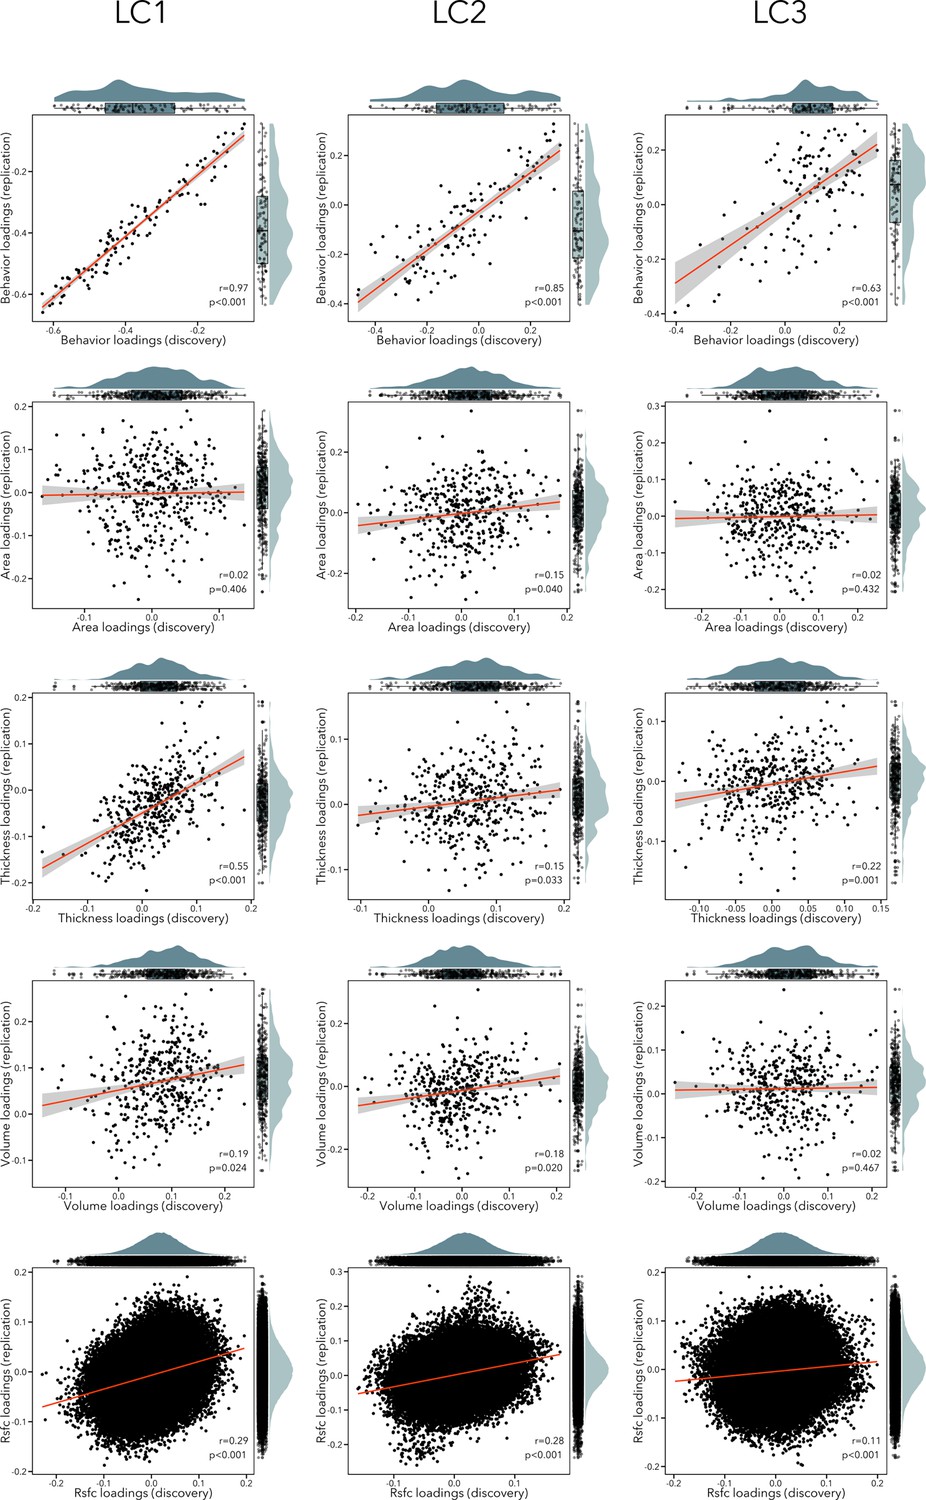
Scatterplots showing correlation between loadings in the discovery and replication sample for each modality (rows) and each LC (columns).
The distribution of the loadings in the discovery sample are shown on the top x-axis, while the distribution of the loadings in the replication sample are depicted on the right y-axis.
Additional files
-
Supplementary file 1
Supplementary tables and information cited in this study.
- https://cdn.elifesciences.org/articles/87992/elife-87992-supp1-v2.docx
-
MDAR checklist
- https://cdn.elifesciences.org/articles/87992/elife-87992-mdarchecklist1-v2.pdf
Download links
A two-part list of links to download the article, or parts of the article, in various formats.
Downloads (link to download the article as PDF)
Open citations (links to open the citations from this article in various online reference manager services)
Cite this article (links to download the citations from this article in formats compatible with various reference manager tools)
Multimodal neural correlates of childhood psychopathology
eLife 13:e87992.
https://doi.org/10.7554/eLife.87992


