Mice lacking triglyceride synthesis enzymes in adipose tissue are resistant to diet-induced obesity
- Department of Molecular Metabolism, Harvard T.H. Chan School of Public Health, United States
- Department of Cell Biology, Harvard Medical School, United States
- Cell Biology Program, Sloan Kettering Institute, Memorial Sloan Kettering Cancer Center, United States
- Broad Institute of Harvard and MIT, United States
- Howard Hughes Medical Institute, United States
Figures
Figure 1 with 3 supplements
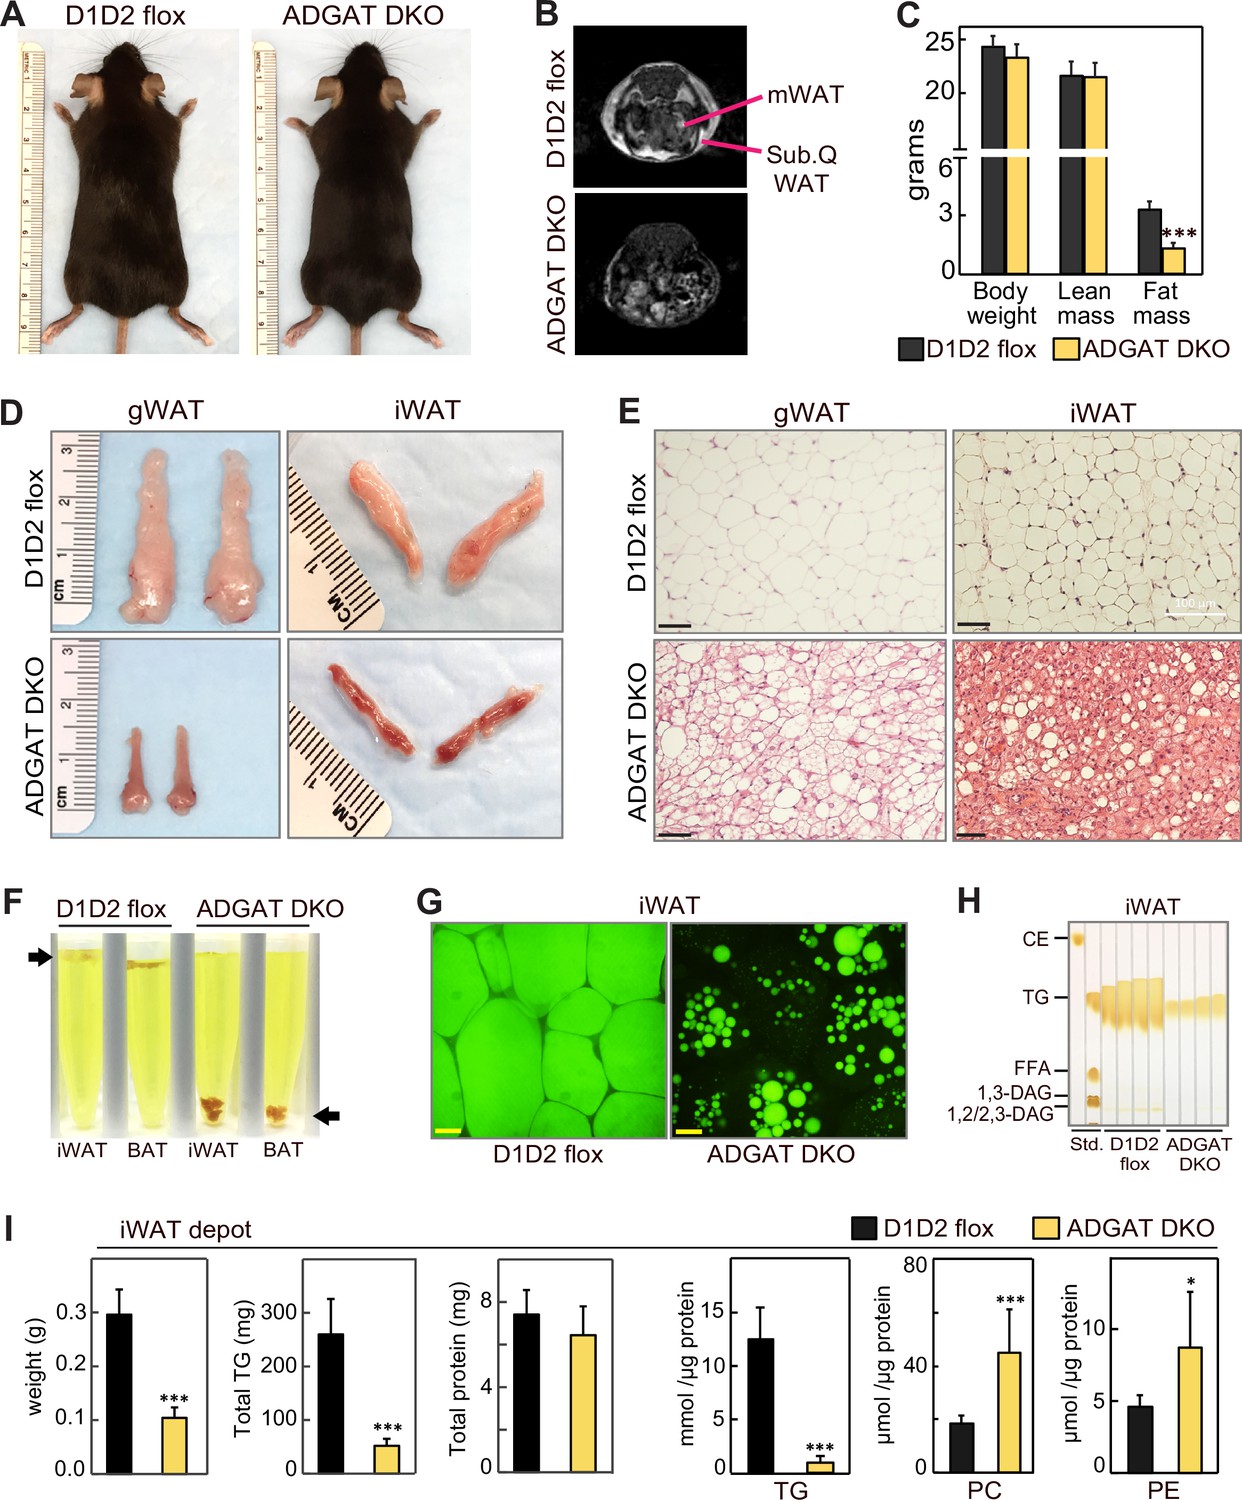
ADGAT DKO mice have reduced fat mass and triglycerides in adipose tissue.
(A) Chow-diet-fed ADGAT DKO mice appear normal. Representative photographs of control and ADGAT DKO female mice fed a chow diet. (B) Fat depots were decreased in ADGAT DKO mice. Nuclear magnetic resonance imaging of chow-diet-fed male mice. mWAT, mesenteric white adipose tissue; Sub.Q WAT, subcutaneous white adipose tissue. (C) ADGAT DKO mice have decreased fat mass. Dual-energy X-ray absorptiometry (DEXA) analysis of lean mass and fat mass of chow-diet-fed male mice (n=8). (D) Fat depots were atrophied in ADGAT DKO mice. Representative photographs of inguinal white adipose tissue (iWAT) and gonadal white adipose tissue (gWAT) from male mice (n=8). (E) gWAT and iWAT of ADGAT DKO mice contain multi-locular lipid droplets in adipocytes. H&E-stained sections of gWAT and iWAT from chow-diet-fed male mice (n=6). Scale bars, 50 µm. (F) WAT and brown adipose tissue (BAT) of ADGAT DKO mice were denser than controls and sink in an aqueous buffer with fixative (1.25% formaldehyde, 2.5% glutaraldehyde, and 0.03% picric acid in 0.1 M sodium cacodylate buffer, pH 7.4, density = 1.01 g/ml) used to fix tissue for electron microscopy. (G) Lipid droplets (LDs) in iWAT of ADGAT DKO mice stain with BODIPY. Confocal fluorescence microscopy images of adipose tissue. LDs were stained by BODIPY 493/503. Scale bar, 25 µm. (H) WAT of ADGAT DKO mice contain triglycerides. Thin layer chromatography analysis of lipids from iWAT of male mice (n=4). TGs, triglycerides; CE, cholesterol esters, FFA, free fatty acids; DAG, diacylglycerol. (I) Increased phospholipid levels in iWAT of ADGAT DKO mice. Lipids in iWAT were extracted and quantified by mass spectrometry (n=8). Data are presented as mean ± SD. *p<0.05, ***p<0.001.
Figure 1—figure supplement 1
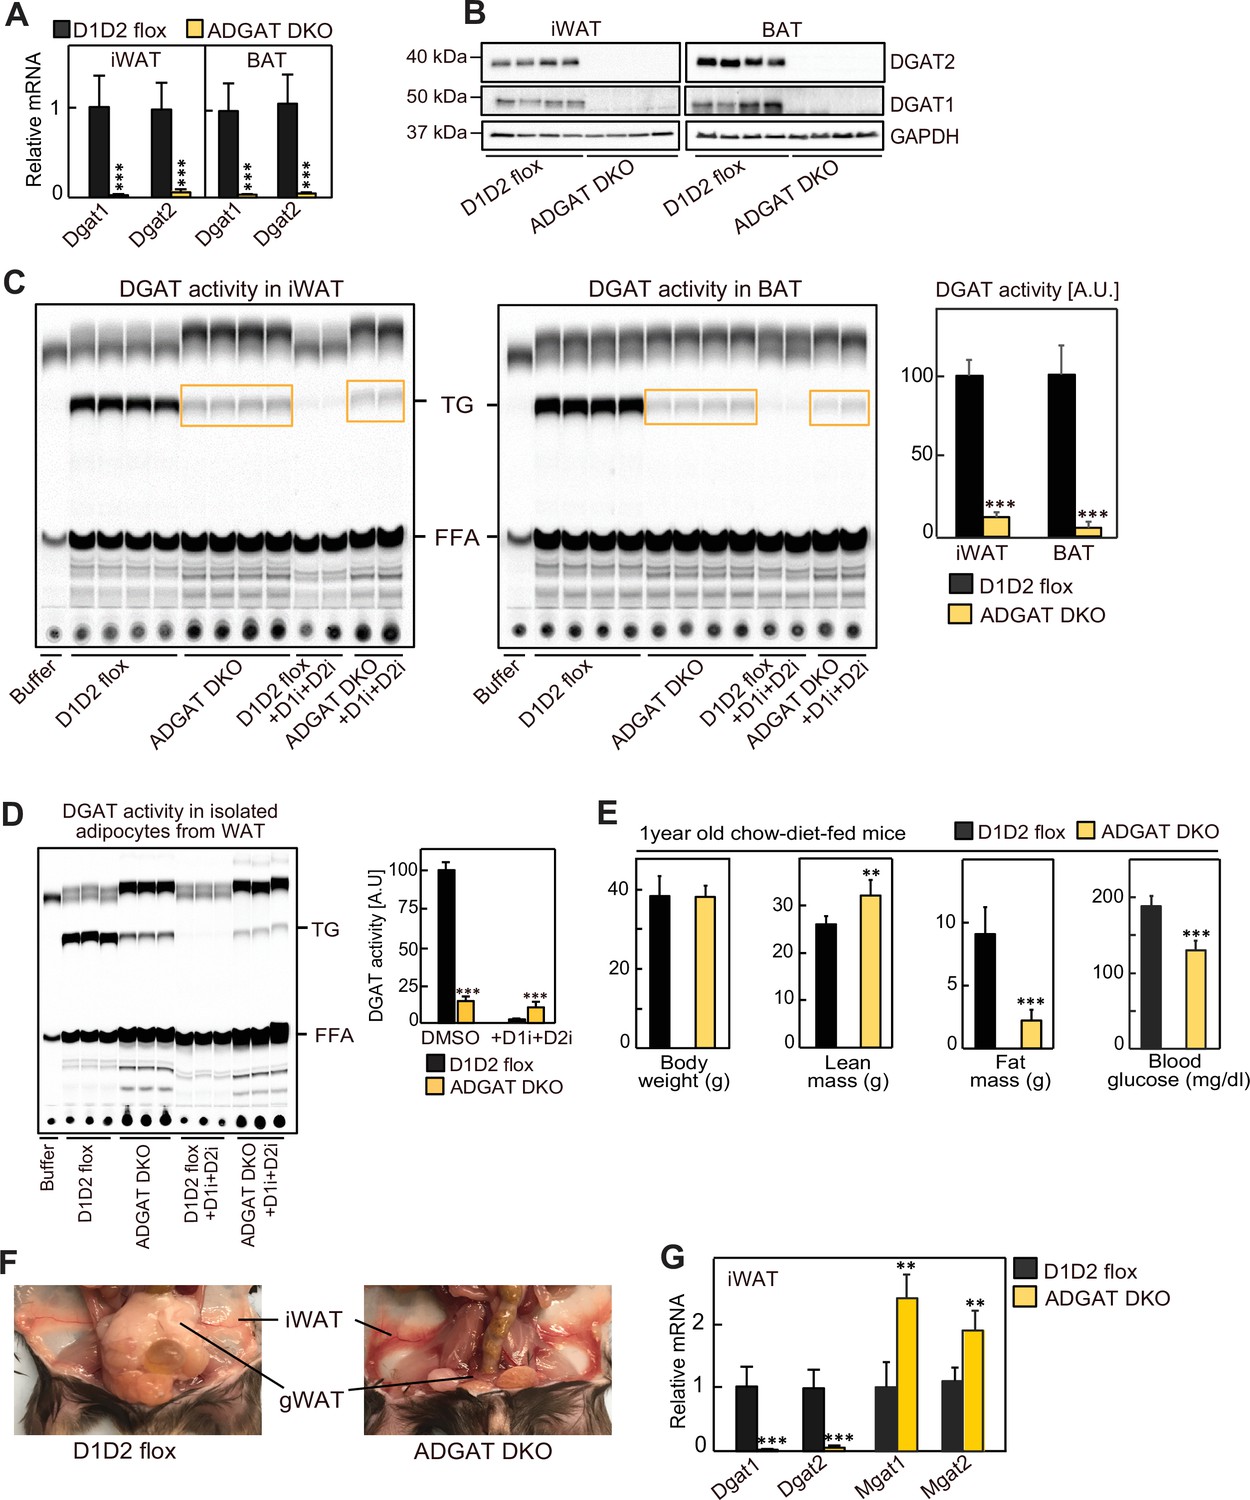
ADGAT DKO mice have reduced DGAT1 and DGAT2 expression in adipose tissue.
(A) Dgat1 and Dgat2 transcripts levels were decreased in inguinal white adipose tissue (iWAT) and brown adipose tissue (BAT) of ADGAT DKO mice. Relative mRNA levels in iWAT and BAT of male mice fed a chow diet (n=6). (B) DGAT1 and DGAT2 proteins were absent in iWAT and BAT of ADGAT DKO mice. Western blot analysis of DGAT1 and DGAT2 in iWAT and BAT of male mice fed a chow diet (n=4). (C) In vitro DGAT activity was decreased in lysates of iWAT and BAT of ADGAT DKO male mice (n=4). (D) In vitro DGAT activity was decreased in isolated adipocytes from iWAT of ADGAT DKO male mice (n=4). (E) Body weights, lean mass, and fat mass analysis of 1-year-old male mice fed a chow diet (n=10). (F) Gross appearance of WAT depots in male mice. **p<0.01, ***p<0.001. (G) Relative mRNA levels of MGAT enzymes in iWAT of male mice fed a chow diet (n=6).
Figure 1—figure supplement 2
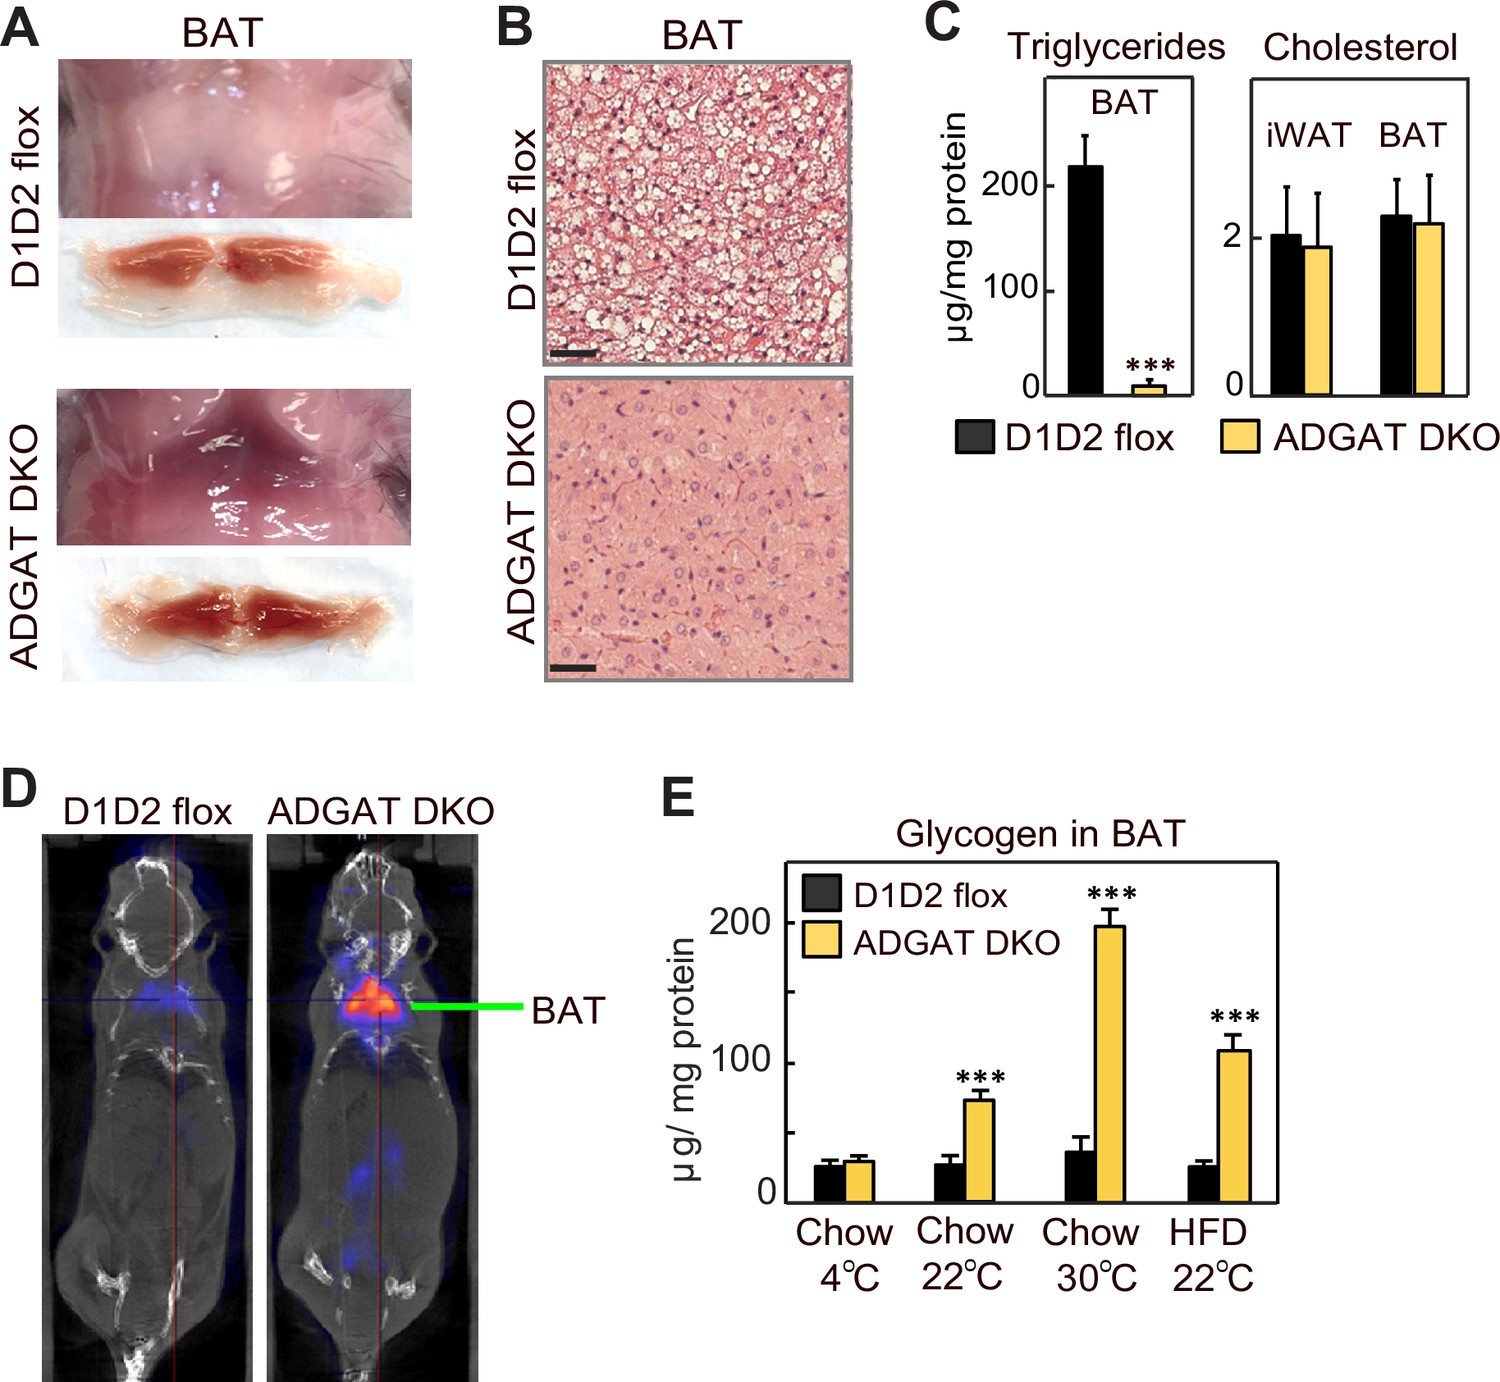
ADGAT DKO mice have reduced triglycerides in brown adipose tissue (BAT).
(A) Gross appearance of brown adipose tissue (BAT). (B) H&E-stained sections of inguinal BAT (iBAT) (n=6). Scale bars, 50 µm. (C) Triglycerides and total cholesterol levels in BAT (n=6). (D) [18F]-FDG-PET/CT scans of male mice administered CL 316,243. (E) Glycogen levels in iBAT of male mice (n=6). Data are presented as mean ± SD. ***p<0.001.
Figure 1—figure supplement 3
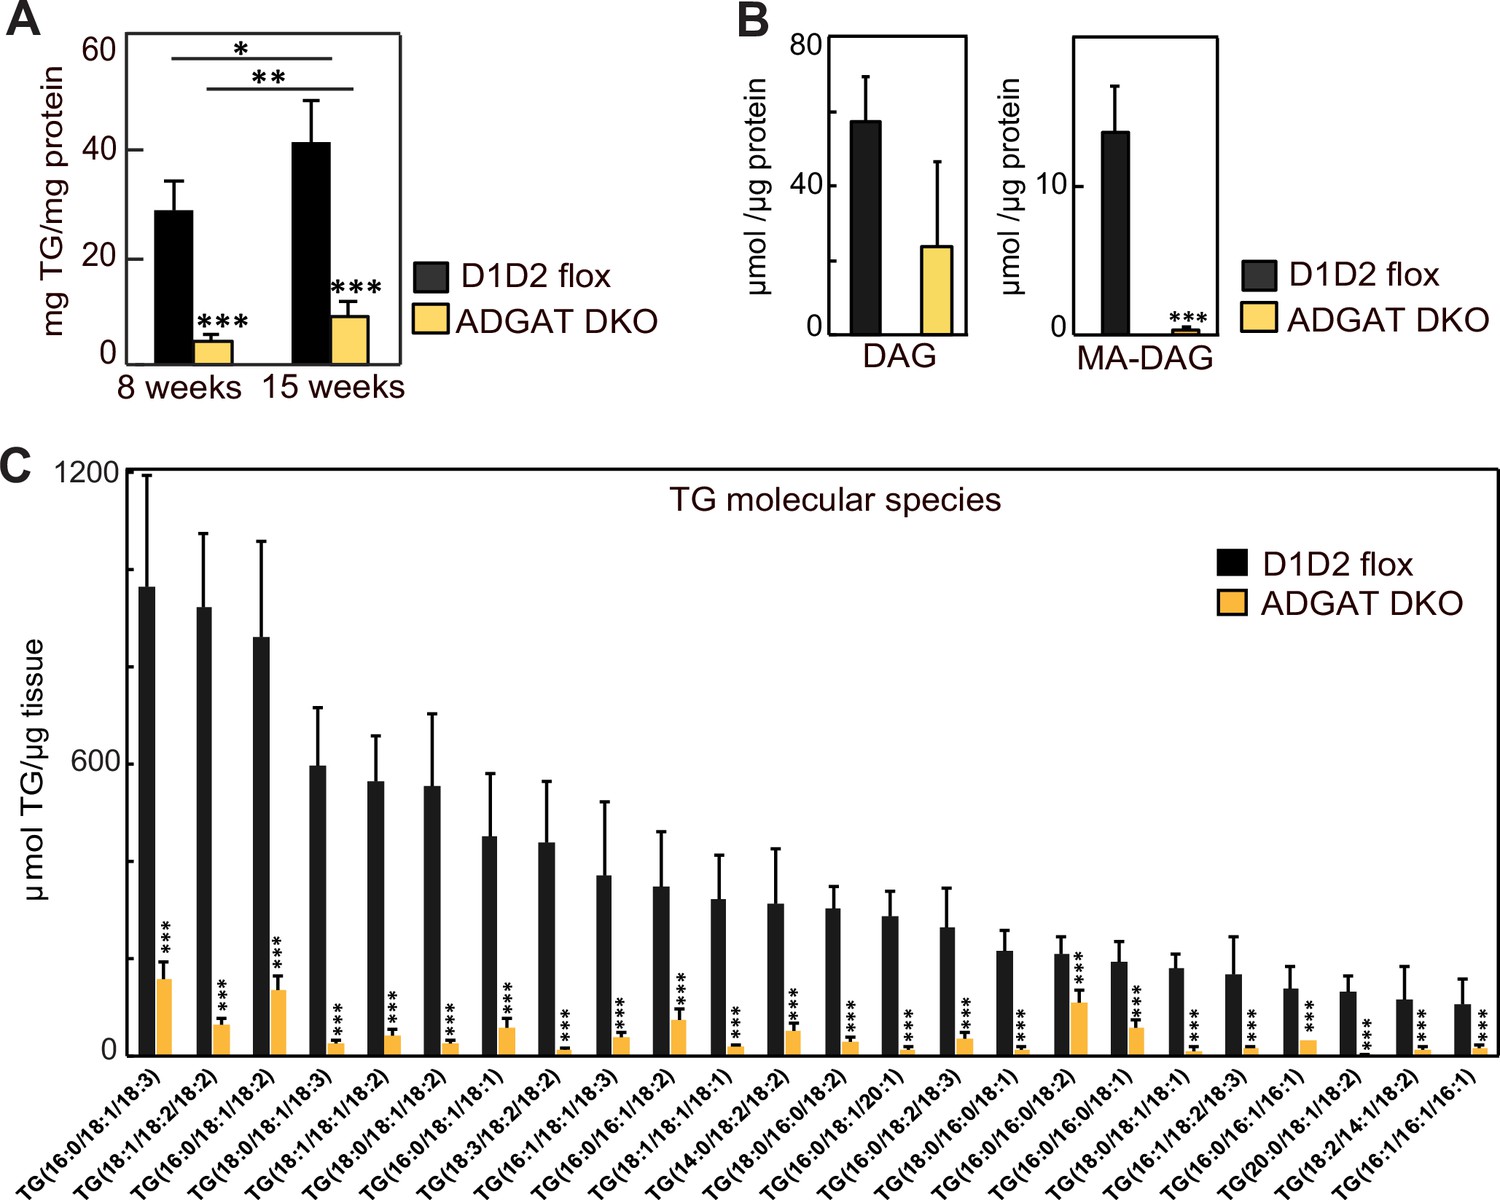
Most of the triglyceride molecular species were decreased in adipose tissue of ADGAT DKO mice.
(A) Triglycerides were decreased in inguinal white adipose tissue (iWAT) of ADGAT DKO male mice (n=6). Triglyceride levels were measured using Infinity Triglyceride Reagent. (B) Diacylglycerol and mono alkyl-diacylglycerol were decreased in iWAT of ADGAT DKO mice (n=6). Lipids were quantified by mass spectrometry. (C) Triglyceride molecular species were decreased in iWAT of ADGAT DKO mice (n=6). Lipids were quantified by mass spectrometry. Data are presented as mean ± SD. *p<0.05, **p<0.01, ***p<0.001.
Figure 2
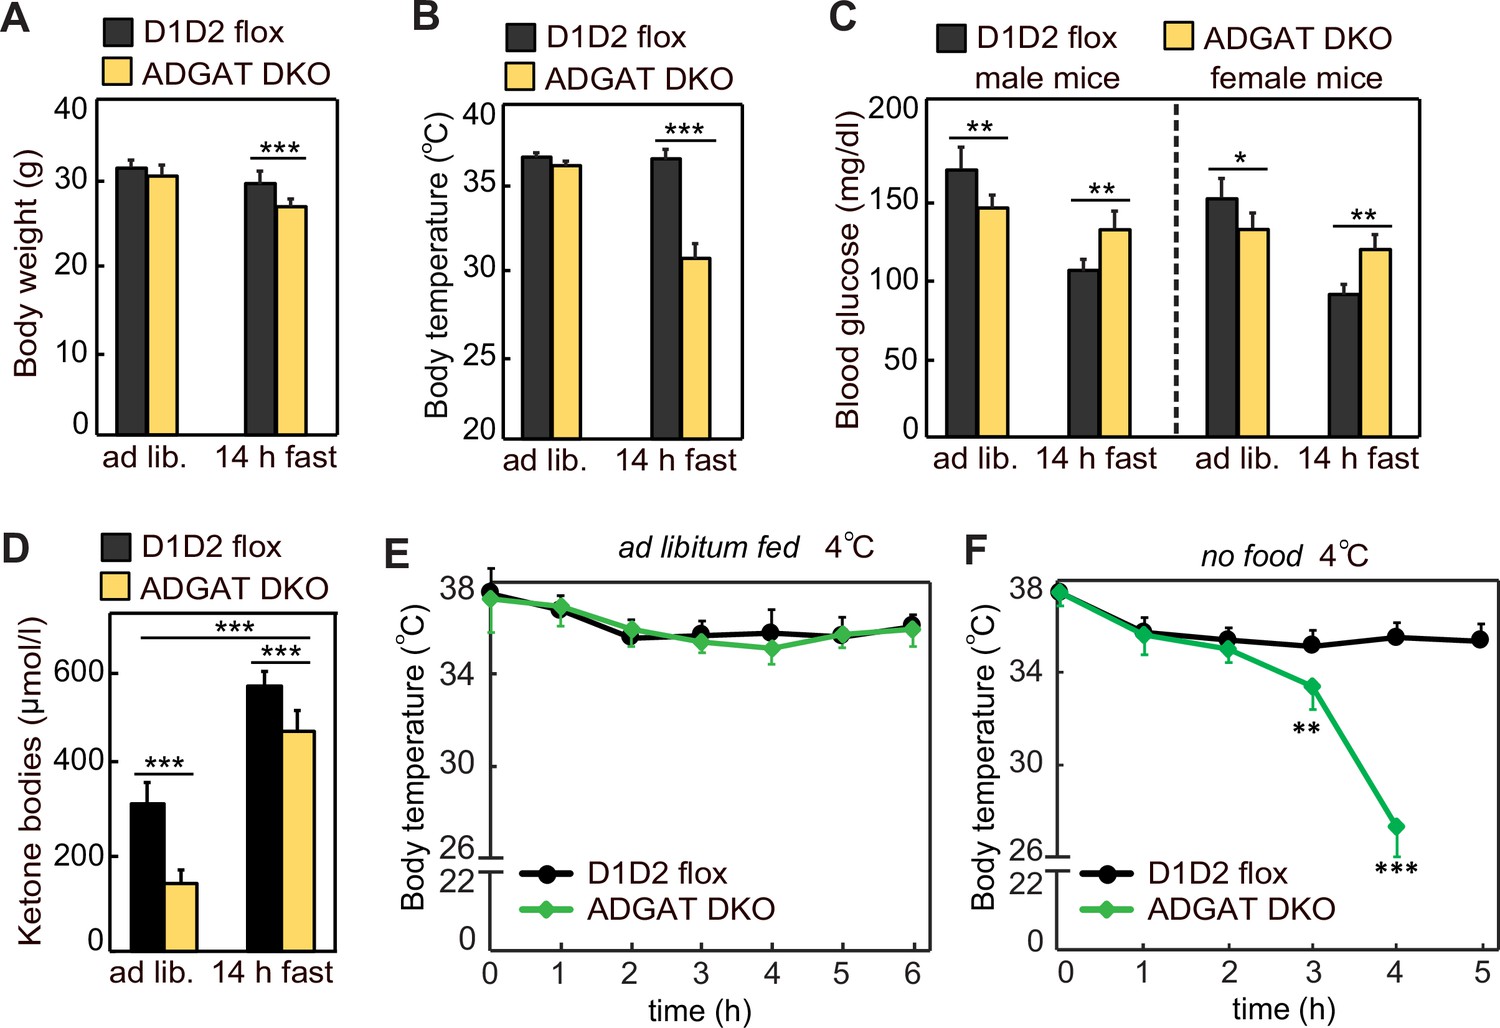
Adipose tissue triglyceride (TG) stores are required to prevent a torpor-like state during fasting.
(A) Body weights of male mice fed ad libitum or fasted 14 hr (n=10). Ad lib., ad libitum fed. (B) Core body temperature of male mice housed at room temperature and fed ad libitum or fasted for 14 hr (n=10). (C) Blood glucose levels in male and female mice fed ad libitum or fasted for 14 hr (n=8). (D) Levels of plasma ketone bodies in male mice fed ad libitum or fasted for 14 hr (n=8). (E and F) Core body temperature of male mice housed in cold (5°C) with or without food (n=10). Data are presented as mean ± SD. *p<0.05, **p<0.01, ***p<0.001.
Figure 3
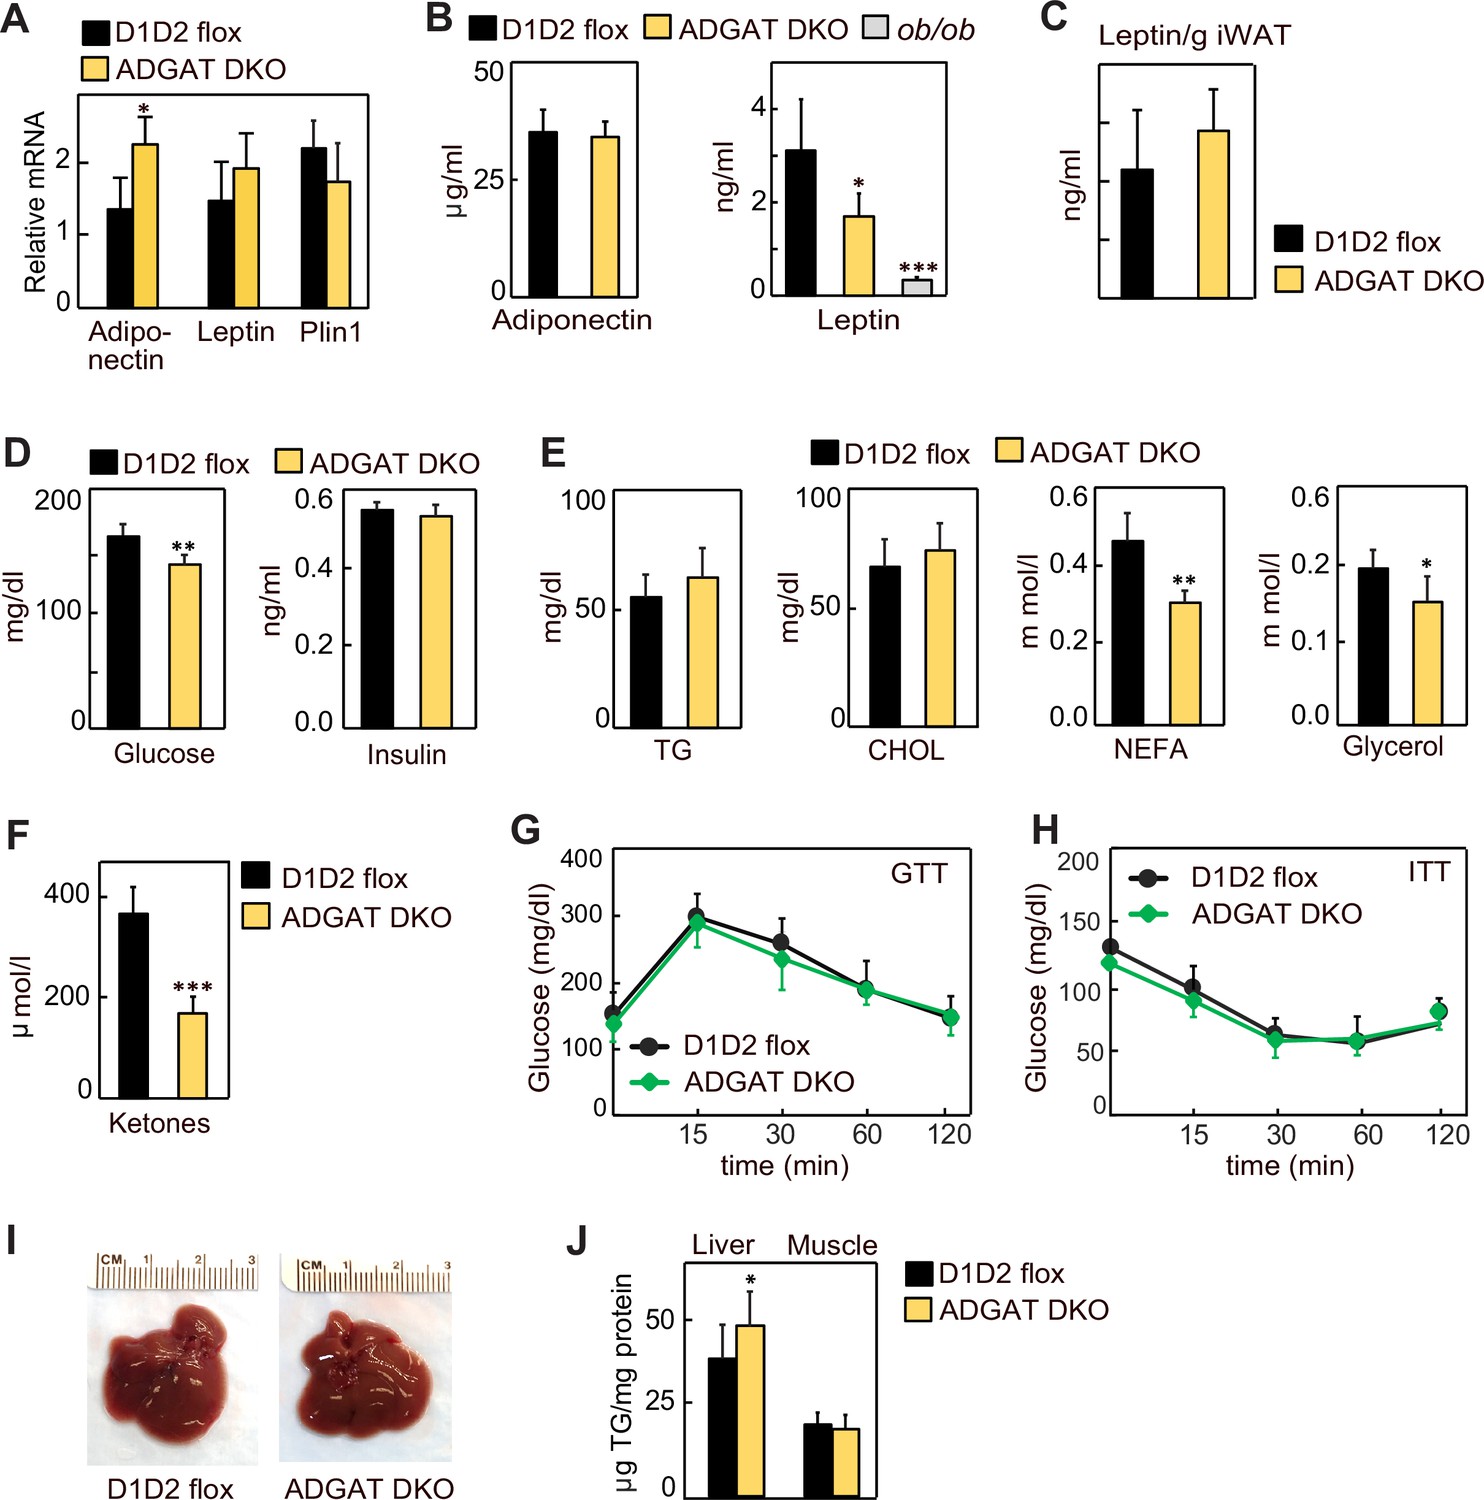
Lipodystrophy is uncoupled from detrimental metabolic effects in ADGAT DKO mice.
(A) Adiponectin and leptin mRNA levels were moderately increased in inguinal white adipose tissue (iWAT) of ADGAT DKO mice. Relative mRNA levels of leptin and adiponectin in iWAT of chow-diet-fed male mice (n=6). (B) Plasma levels of adiponectin were normal, and leptin levels were moderately decreased in ad libitum chow-diet-fed male mice (n=8). (C). Plasma leptin levels normalized per gram of WAT mass (n=8). (D) ADGAT DKO mice had normal glucose and insulin levels. Glucose and insulin levels in ad libitum chow-diet-fed male mice (n=8). (E) Decreased free fatty acids in ADGAT DKO mice. Levels of plasma metabolites in ad libitum chow-diet-fed male mice (n=8). (F) Decreased ketones in ad libitum chow-diet-fed ADGAT DKO male mice (n=8). TG, triglycerides; CHOL, cholesterol; NEFA, non esterified fatty acids (G and H) Glucose and insulin tolerance tests were normal in chow-diet-fed male mice (n=10). (I) ADGAT DKO mice had non-steatotic livers. Representative photographs of livers from chow-diet-fed mice. (J) Triglycerides were moderately increased in livers of ADGAT DKO mice. Triglyceride levels in livers and skeletal muscle of chow-diet-fed male mice (n=6). Data are presented as mean ± SD. *p<0.05, **p<0.01, ***p<0.001.
Figure 4 with 1 supplement
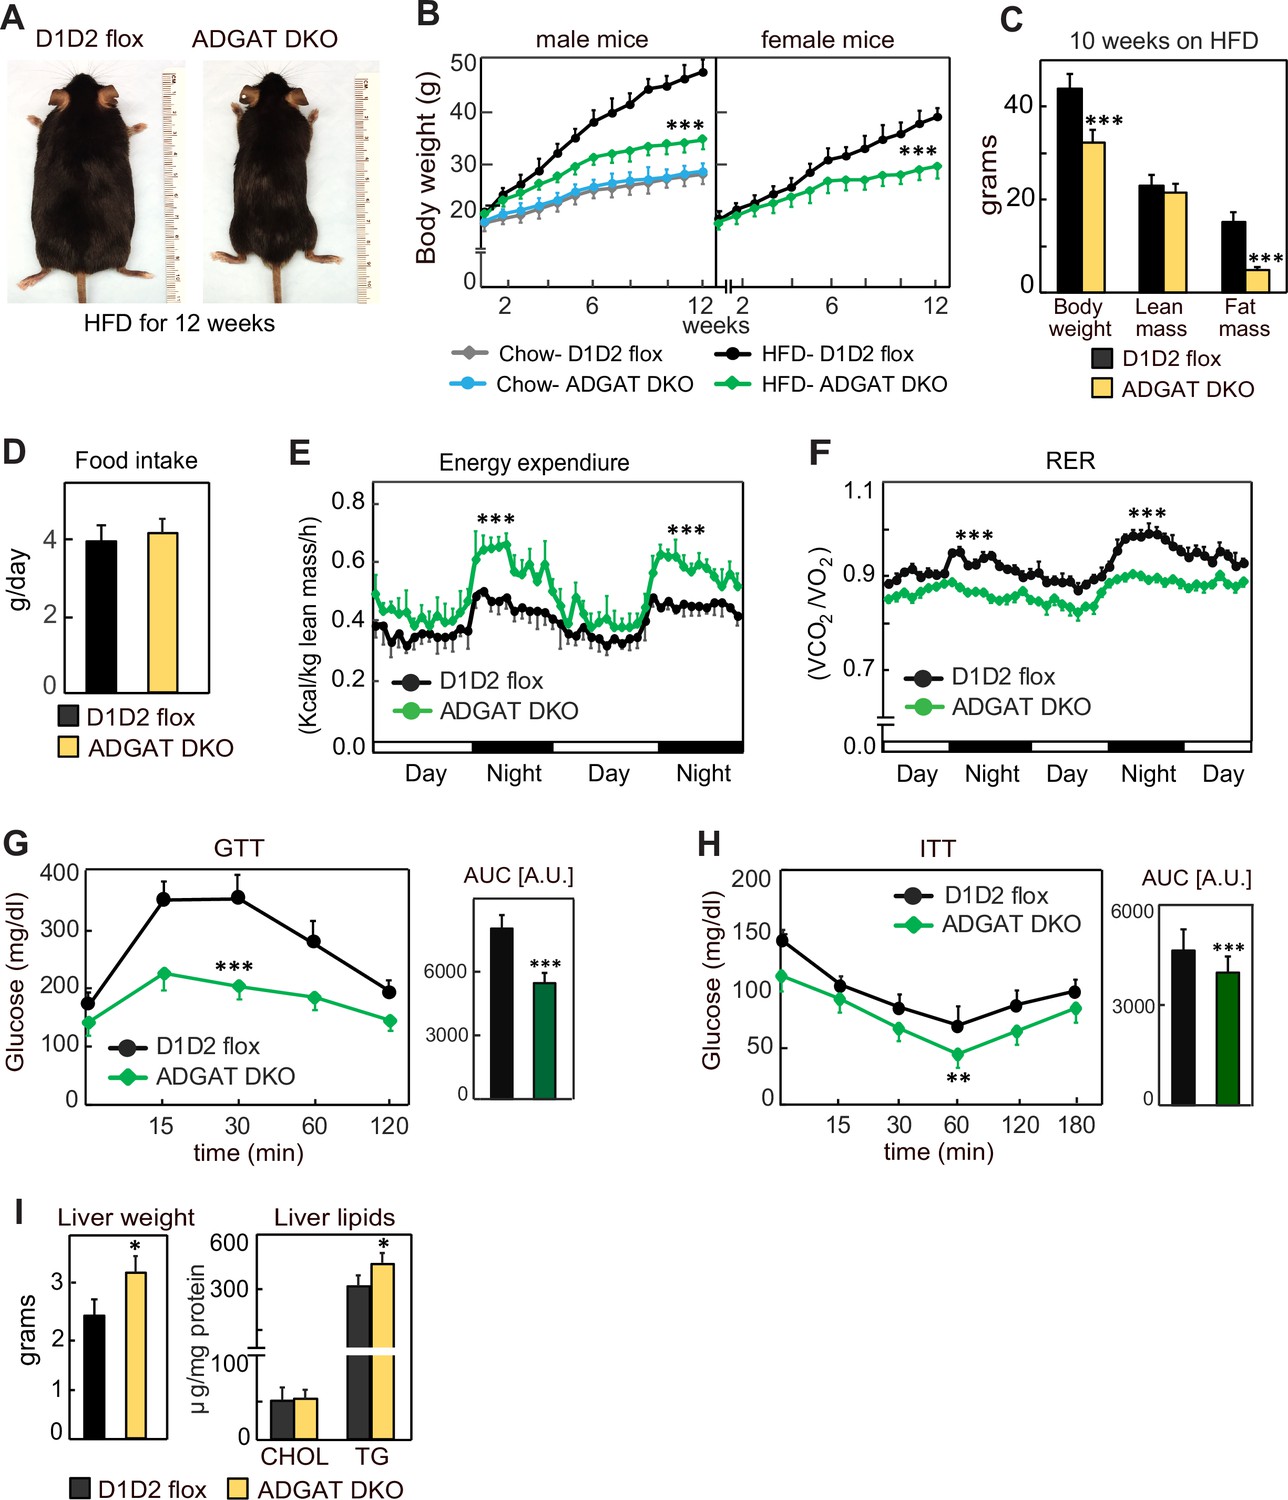
ADGAT DKO mice are resistant to diet-induced obesity and glucose intolerance.
(A) ADGAT DKO mice stay lean on a high-fat diet (HFD). Representative photographs of male mice fed on HFD for 12 weeks. (B) Both male and female ADGAT DKO mice gained ~40% less body weight than control mice. Body weights of mice fed on a chow-diet or HFD (n=15 for males, n=12 for females). (C) ADGAT DKO mice had decreased fat mass on HFD feeding. Dual-energy X-ray absorptiometry (DEXA) analysis of lean mass and fat mass of HFD fed male mice (n=10). (D) ADGAT DKO male mice had normal food intake during HFD feeding (n=5). (E and F) ADGAT DKO mice had increased energy expenditures. Energy expenditure and respiratory quotient on HFD-fed male mice measured by indirect calorimetry. Values were normalized to lean mass (n=4). (G and H) ADGAT DKO mice were protected from HFD-induced glucose intolerance and insulin resistance. Glucose- and insulin-tolerance tests were performed on HFD-fed (for 9 or 10 weeks, respectively) male mice (n=10). AUC, area under the curve. (I) Liver weights and triglyceride levels were moderately increased in HFD-fed ADGAT DKO male mice (n=6). Data are presented as mean ± SD. *p<0.05, **p<0.01, ***p<0.001.
Figure 4—figure supplement 1

ADGAT DKO mice gradually activate an alternative mechanism to synthesize triglycerides.
(A) Lipid droplets (LDs) isolated from inguinal white adipose tissue (iWAT) of mice fed a high-fat diet (HFD). (B) Blood glucose levels in HFD-fed male mice (n=8). (C) Insulin levels in HFD-fed male mice (n=8). (D) Relative mRNA levels in livers of HFD mice (n=6). Data are presented as mean ± SD. *p<0.05, **p<0.01, ***p<0.001.
Figure 5 with 3 supplements
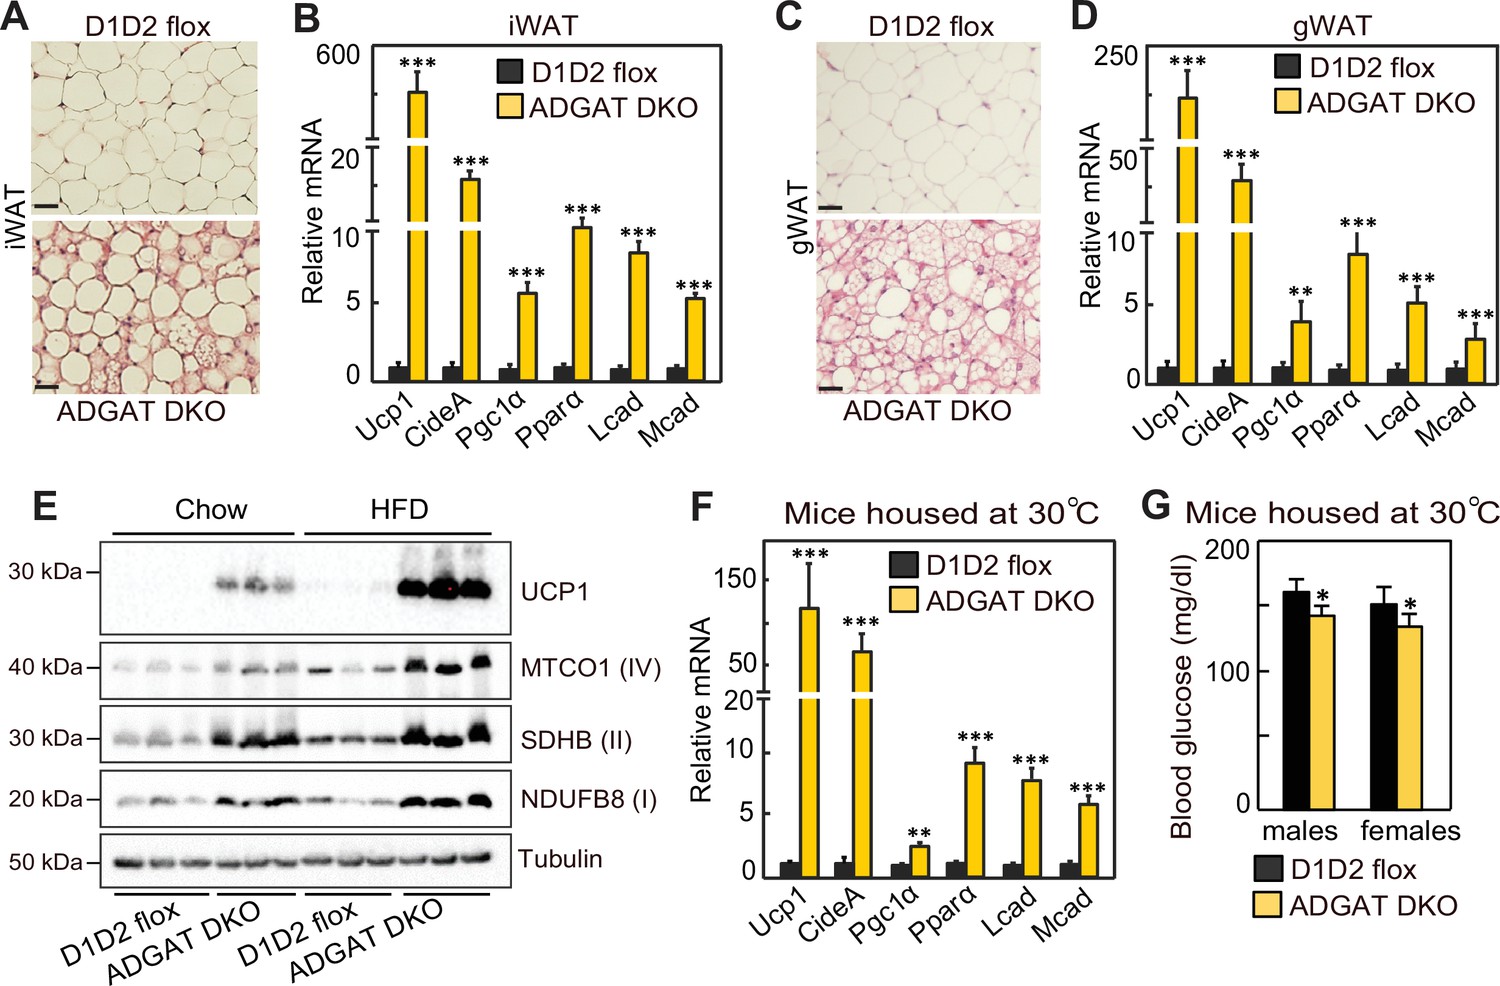
Beiging of white adipose tissue (WAT) in ADGAT DKO mice.
(A) ADGAT DKO mice contain multi-locular lipid droplets (LDs) in adipocytes of inguinal WAT (iWAT). H&E-stained sections of iWAT from male mice fed a chow diet and housed at room temperature (n=6). Scale bars, 50 µm. (B) Increased expression of thermogenic marker genes in iWAT of ADGAT DKO mice. Relative mRNA levels of thermogenic genes in iWAT of male mice fed a chow diet and housed at room temperature (n=6). (C) ADGAT DKO mice contain multi-locular LDs in adipocytes of gonadal white adipose tissue (gWAT). H&E-stained sections of gWAT from male mice fed a chow diet and housed at room temperature (n=6). Scale bars, 50 µm. (D) Increased expression of thermogenic marker genes in gWAT of ADGAT DKO mice. Relative mRNA levels of thermogenic genes in gWAT of male mice fed a chow diet and housed at room temperature (n=6). (E) High-fat diet (HFD) feeding increases levels of UCP1 in iWAT of ADGAT DKO mice. Immunoblot analysis of UCP1 and OXPHOS proteins in iWAT of male mice fed either a chow diet or an HFD (n=3). Mice were housed at room temperature. (F) Beiging was intact in iWAT of thermoneutral-housed ADGAT DKO mice. Relative mRNA levels of thermogenic genes in iWAT of chow-diet-fed male mice housed at thermoneutral temperature for 6 weeks (n=6). (G) Blood glucose levels were normal in thermoneutral-housed ADGAT DKO mice. Glucose levels in male mice fed a chow diet and housed at thermoneutral temperature for 6 weeks (n=8). Data are presented as mean ± SD. *p<0.05, **p<0.01, ***p<0.001.
Figure 5—figure supplement 1
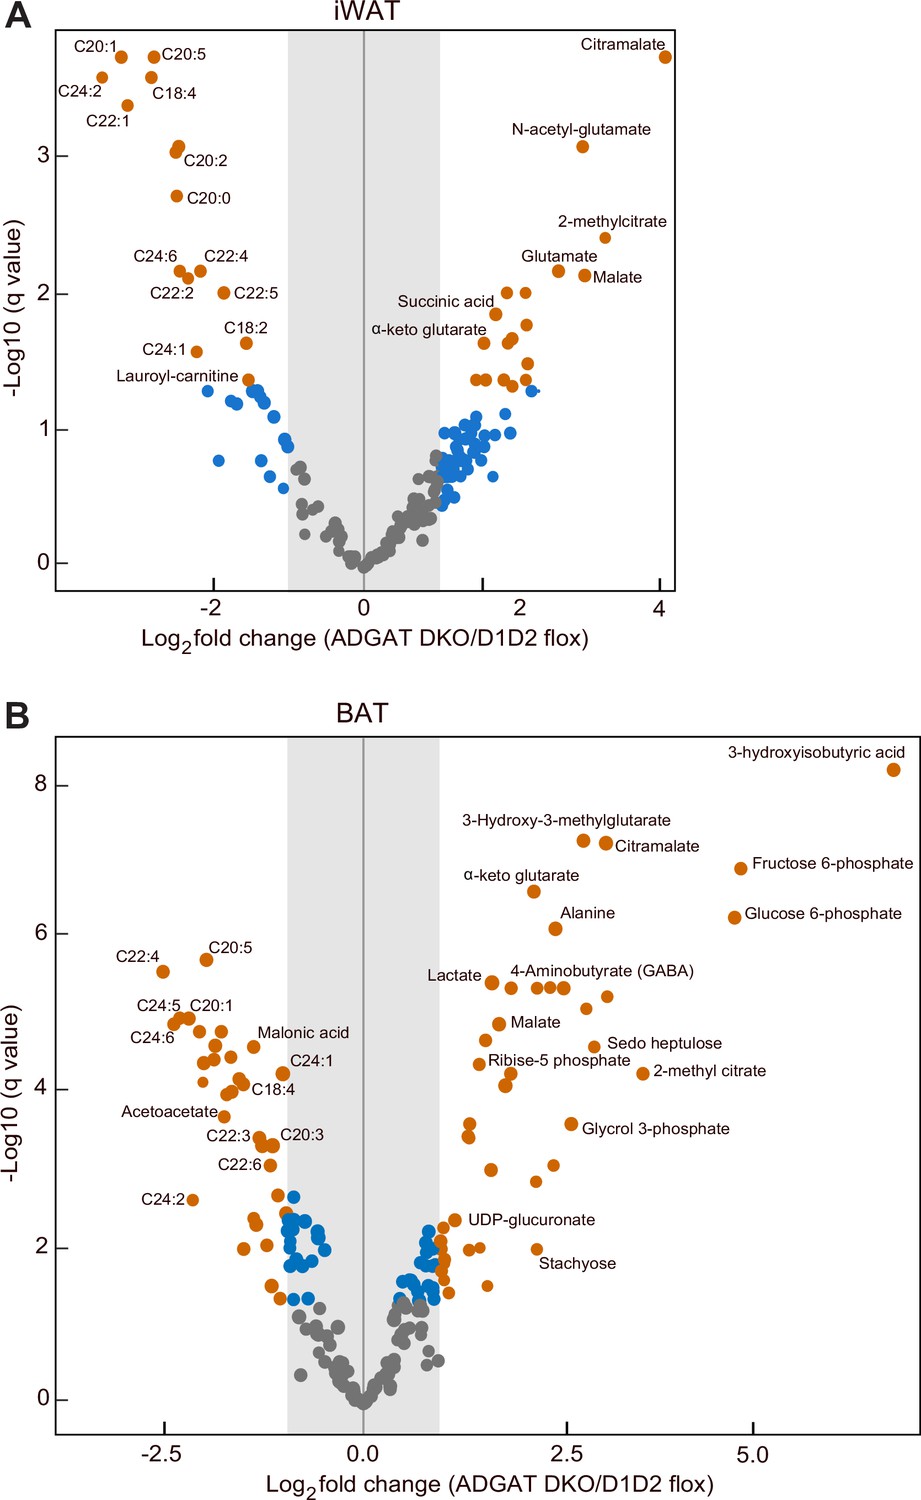
Analysis of metabolites in inguinal white adipose tissue (iWAT) of ADGAT DKO mice.
(A) Volcano plot showing differentially abundant metabolites in inguinal white adipose tissue (iWAT) of chow-diet-fed male mice (n=8). (B) Volcano plot showing differentially abundant metabolites in inguinal brown adipose tissue (iBAT) of chow-diet-fed male mice (n=8). Orange dots represent metabolites with more than twofold change (adjusted p values or q<0.05). Blue dots represent metabolites with more than twofold change but not statistically significant. Gray dots represent metabolites that were unchanged between control and ADGAT DKO mice.
Figure 5—figure supplement 2

Primary adipocytes cultured from inguinal white adipose tissue (iWAT) of ADGAT DKO mice contain lipid droplets.
(A) Primary adipocytes differentiated from stromal vascular fraction of inguinal white adipose tissue (iWAT) from ADGAT DKO male mice contain lipid droplets (LDs). LDs were stained by BODIPY 493/503. (B and C) Western blot analysis of DGATs and UCP1 in primary adipocytes (n=3). (D) Relative mRNA levels in day 8 primary adipocytes loaded with oleic acid for 16 hr (n=3). Data are presented as mean ± SD. *p<0.05, **p<0.01, ***p<0.001.
Figure 5—figure supplement 3
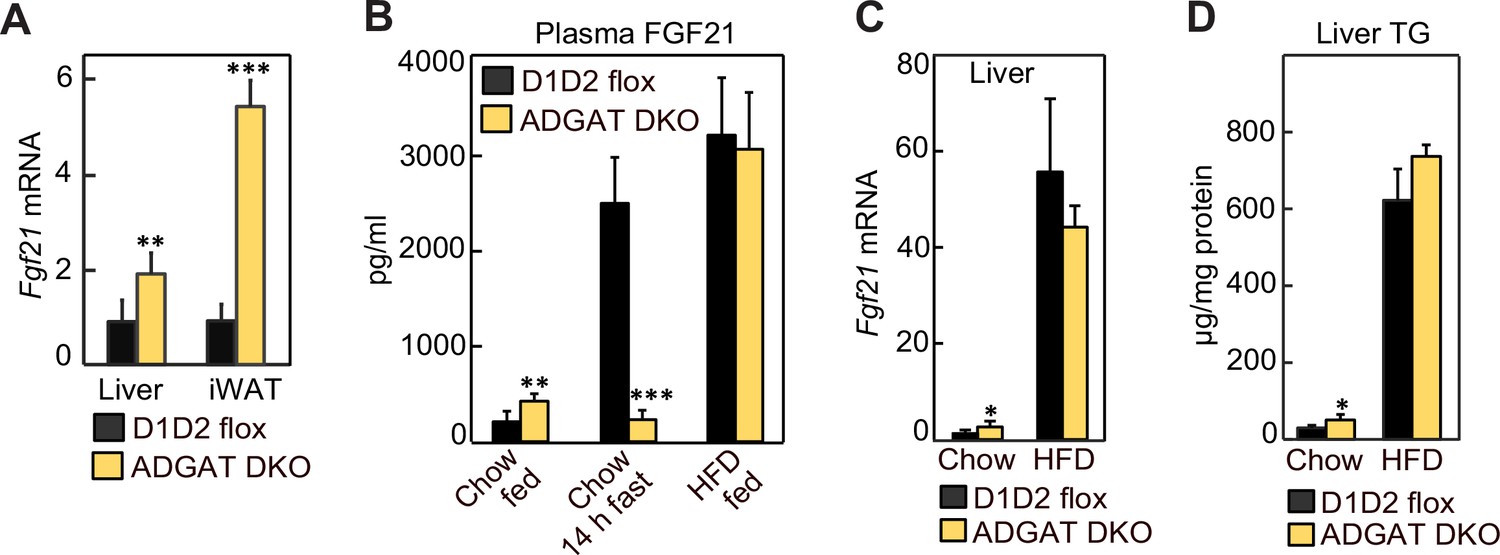
Fibroblast growth factor 21 (FGF21) levels were increased in ADGAT DKO mice.
(A) FGF21 transcript levels were increased in inguinal white adipose tissue (iWAT) and livers of ADGAT DKO mice. Relative mRNA levels of FGF21 in iWAT and livers of chow-diet-fed male mice (n=6). (B) FGF21 levels were increased in ADGAT DKO mice. Plasma levels of FGF21 in chow-diet-fed (ad libitum fed or 14 hr fasted) or high-fat diet (HFD)-fed male mice (n=8). (C) FGF21 transcript levels in livers of chow-diet- or HFD-fed male mice (n=6). (D) Triglyceride levels in livers of chow-diet- or HFD-fed male mice (n=6). Data are presented as mean ± SD. *p<0.05, **p<0.01, ***p<0.001.
Videos
Video 1
ADGAT DKO mice enter torpor during fasting.
After 10 hr of fasting ADGAT DKO mice enter a torpor-like state with decreased physical activity and huddling together. Fasting of ADGAT DKO mice also resulted in hypothermia, with body temperatures dropping to ~30°C.
Tables
Key resources table
| Reagent type (species) or resource | Designation | Source or reference | Identifiers | Additional information |
|---|---|---|---|---|
| Antibody | Rabbit polyclonal anti-DGAT1 | In house (Chitraju et al., 2019) | Request Farese and Walther lab for antibodies | |
| Antibody | Rabbit polyclonal anti-DGAT2 | In house (Chitraju et al., 2019) | Request Farese and Walther lab for antibodies | |
| Antibody | Rabbit polyclonal anti-UCP1 | Abcam | Cat# ab10983 | WB (1:1000) |
| Antibody | Total OXPHOS Rodent WB Antibody Cocktail | Abcam | Cat# ab110413 | WB (1:1000) |
| Antibody | Rabbit monoclonal anti-GAPDH | Cell Signaling Technology | Cat# 5174S | WB (1:5000) |
| Antibody | Mouse monoclonal anti-α-Tubulin | Sigma-Aldrich | Cat# T9026 | WB (1:5000) |
| Commercial assay or kit | Power SYBR Green PCR Master Mix | Life Technologies | Cat# 4368706 | |
| Commercial assay or kit | iScript cDNA Synthesis Kit | Bio-Rad | Cat# 170-8891 | |
| Commercial assay or kit | RNeasy Mini Kit | QIAGEN | Cat# 74106 | |
| Commercial assay or kit | QIAzol Lysis Reagent | QIAGEN | Cat# 79306 | |
| Commercial assay or kit | QIAshredder | QIAGEN | Cat# 79656 | |
| Commercial assay or kit | RNase-Free DNase Set | QIAGEN | Cat# 79254 | |
| Commercial assay or kit | SuperSignal West Pico | Thermo Fisher Scientific | Cat# 34580 | |
| Commercial assay or kit | SuperSignal West Femto | Thermo Fisher Scientific | Cat# 34095 | |
| Commercial assay or kit | Infinity Triglycerides Reagent | Thermo Fisher | Cat# TR22421 | |
| Commercial assay or kit | Infinity Cholesterol Reagent | Thermo Fisher | Cat# TR13421 | |
| Commercial assay or kit | Free Glycerol Reagent | Sigma-Aldrich | Cat# F6428 | |
| Commercial assay or kit | HR Series NEFA-HR(2) Color Reagent A | FUJIFILM Medical Systems | Cat# 999-34691 | |
| Commercial assay or kit | HR Series NEFA-HR(2) Solvent A | FUJIFILM Medical Systems | Cat# 995-34791 | |
| Commercial assay or kit | HR Series NEFA-HR(2) Color Reagent B | FUJIFILM Medical Systems | Cat# 991-34891 | |
| Commercial assay or kit | HR Series NEFA-HR(2) Solvent B | FUJIFILM Medical Systems | Cat# 993-35191 | |
| Chemical compound, drug | 1,2-Dioleoyl-rac-glycerol | Sigma-Aldrich | Cat# D8394 | |
| Chemical compound, drug | Oleoyl coenzyme A lithium salt | Sigma-Aldrich | Cat# O1012 | |
| Chemical compound, drug | Oleoyl [14C] Coenzyme A | American Radiolabeled Chemicals, Inc | Cat# ARC 0527 | |
| Chemical compound, drug | Oleic acid [14C] | American Radiolabeled Chemicals, Inc | Cat# ARC 0297 | |
| Chemical compound, drug | Thin Layer Chromatography Plates | Analtech | Cat# P43911 | |
| Chemical compound, drug | Insulin | Lilly Corporation | Humulin R (U 100) | |
| Chemical compound, drug | CL 316,243 hydrate | Sigma-Aldrich | Cat# C5976 | |
| Chemical compound, drug | Glycogen from bovine liver | Sigma-Aldrich | Cat# G0885 | |
| Chemical compound, drug | Protease inhibitors | Roche | Cat# 11873580001 | |
| Other | ADGAT DKO mice | This paper | Request Farese and Walther lab for mice | |
| Other | Dgat1flox/flox mice | (Shih et al., 2009); The Jackson Laboratory | Cat# 017322 | |
| Other | Dgat2flox/flox mice | (Chitraju et al., 2019); The Jackson Laboratory | Cat# 033518 | |
| Other | Adipoq-Cre (Adiponectin-Cre) mice | (Eguchi et al., 2011); The Jackson Laboratory | Cat# 028020 | |
| Other | Chow diet | PicoLab Rodent Diet 20 | Cat# 5053 | |
| Other | Breeder’s diet | PicoLab Rodent Diet 20 | Cat# 5058 | |
| Other | High-fat diet | Envigo | Cat# TD.88137 |
Additional files
-
MDAR checklist
- https://cdn.elifesciences.org/articles/88049/elife-88049-mdarchecklist1-v1.docx
-
Supplementary file 1
List of primers used for quantitative real-time PCR analysis of mouse genes.
- https://cdn.elifesciences.org/articles/88049/elife-88049-supp1-v1.pdf
-
Source data 1
Source data is provided as zip file.
- https://cdn.elifesciences.org/articles/88049/elife-88049-data1-v1.zip
Download links
A two-part list of links to download the article, or parts of the article, in various formats.
Downloads (link to download the article as PDF)
Open citations (links to open the citations from this article in various online reference manager services)
Cite this article (links to download the citations from this article in formats compatible with various reference manager tools)
Mice lacking triglyceride synthesis enzymes in adipose tissue are resistant to diet-induced obesity
eLife 12:RP88049.
https://doi.org/10.7554/eLife.88049.3


