An allocentric human odometer for perceiving distances on the ground plane
- Department of Psychological and Brain Sciences, University of Louisville, United States
- College of Optometry, The Ohio State University, United States
Figures
Figure 1
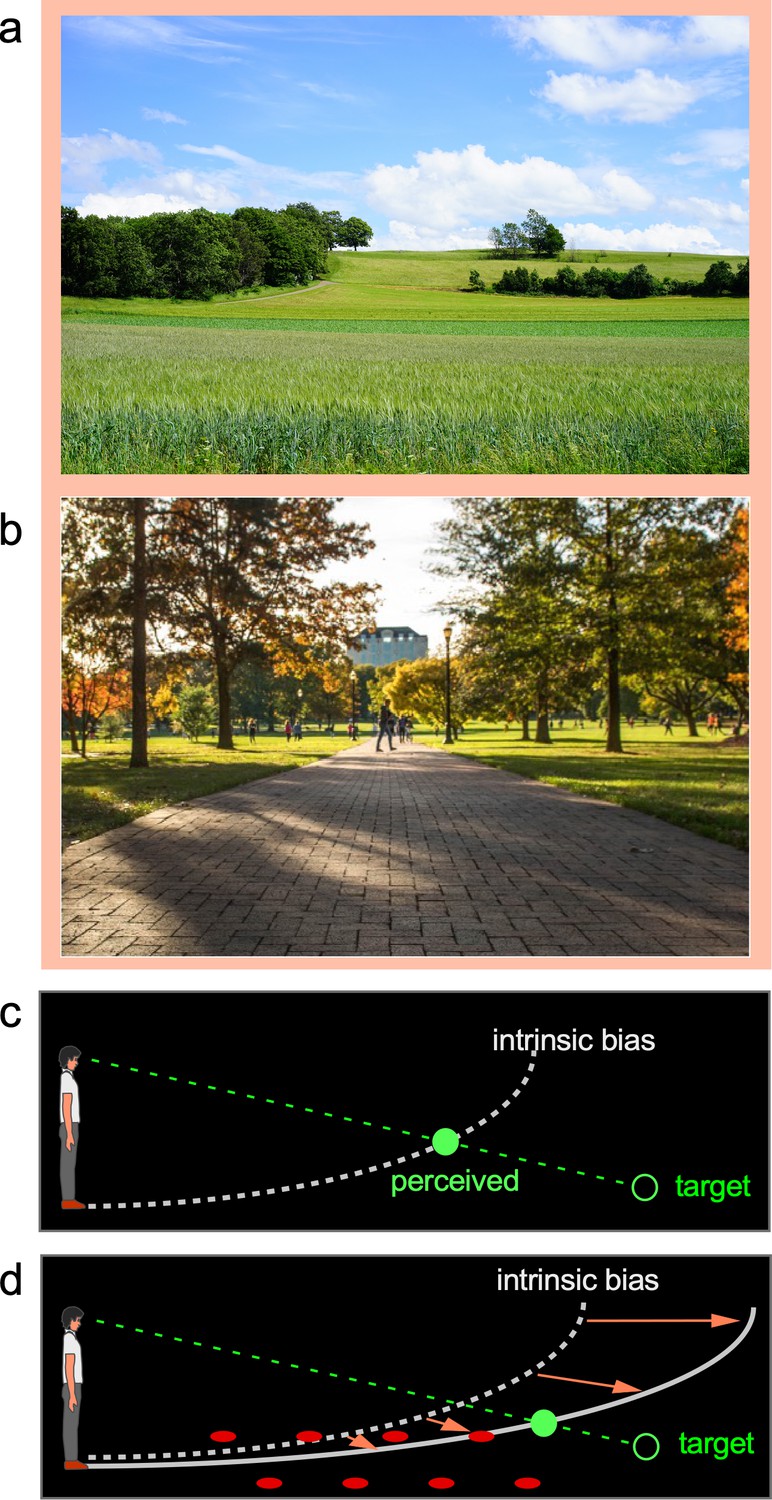
The ground-based spatial coding scheme.
(a) and (b) Natural scenes are largely enveloped by the prevalent sky above us and the ground on which we stand. Evidence suggests target locations are judged with respect to the ground surface, which is our terrestrial niche. (c) The visual system uses the intrinsic bias, an implicit semi-elliptical surface representation in the dark (illustrated as dashed white curve), to locate a dimly lit target (illustrated as unfilled green disc). The target is perceived (filled green disc) at the intersection between the projection line from the eye to the target and the intrinsic bias. Essentially, the intrinsic bias acts like the visual system’s internal model of the ground surface. (d) When the ground becomes visible, the intrinsic bias integrates with the visible depth cues to form a ground surface representation, which serves as a reference frame to code target location. For example, the parallel rows of texture elements on the ground (illustrated as filled red circles) provide the depth cue for the visual system to construct a ground surface representation (solid white curve) that is less slanted than the intrinsic bias. This leads to a more accurate target localization than in the dark (c).
Figure 2
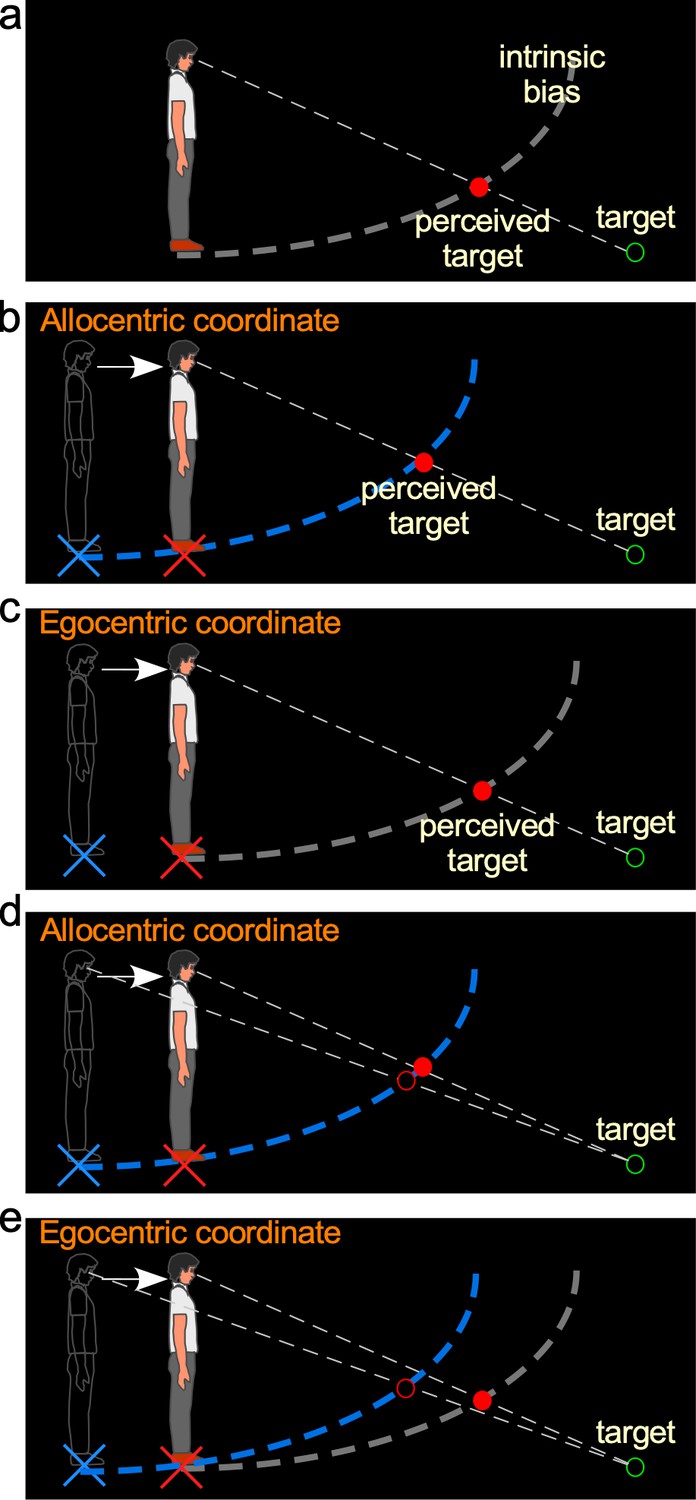
Hypotheses and predictions of Experiment 1.
(a) Baseline-stationary condition. A non-moving, static observer perceives the dimly lit target (illustrated as unfilled green disc) at the intersection (illustrated as filled red disc) between the projection line from the eye to the target and the intrinsic bias (dashed white curve). (b) The allocentric hypothesis predicts when the observer walks forward from the home base (illustrated as blue cross) to a new location (illustrated as red cross), the visual system relies on the path-integration mechanism to keep the intrinsic bias (illustrated as dashed blue curve) at the home base while monitoring the homing error vector (illustrated as white arrow). From the new location, he/she perceives the target (illustrated as unfilled green circle) at the intersection (illustrated as red disk) between the intrinsic bias anchored at the home base and the projection line from the eye to the target. (c) The egocentric hypothesis predicts the intrinsic bias tags along with the observer’s body (illustrated as gray intrinsic bias) when he/she walks to the new location (illustrated as red cross). From the new location, the target (illustrated as unfilled green circle) is perceived (illustrated as red disk) at the same location as in the baseline-stationary condition (in a). (c) Comparison of judged location of a target (unfilled green circle) before and after walking based (filled vs. unfilled red circles) on the allocentric hypothesis. (c and d) Comparison of predicted locations of a target (unfilled green circle) before and after walking (filled vs. unfilled red circles) based on the allocentric and egocentric hypotheses. Note the smaller separation between the filled vs. unfilled red circles in (c), suggesting better perceived positional stability with allocentric spatial coding.
Figure 3
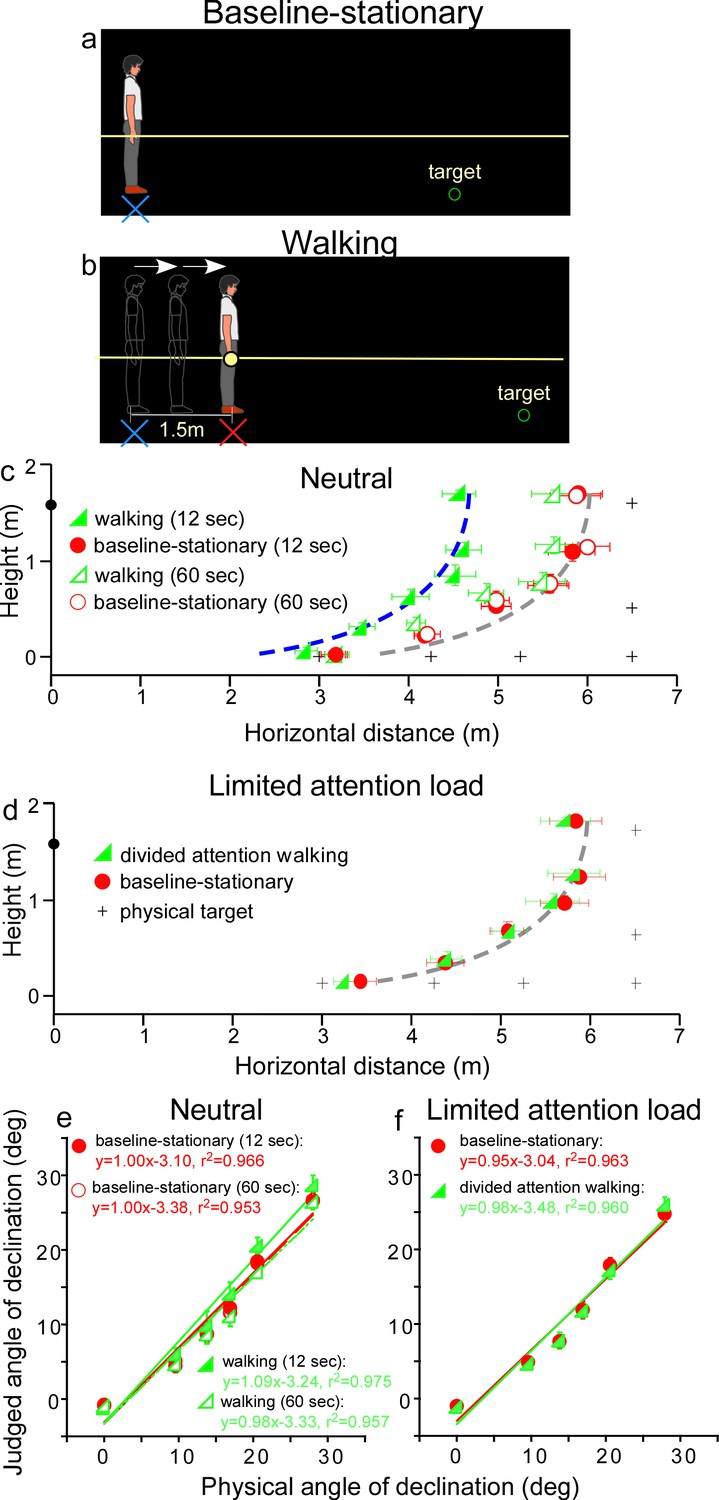
Experiment 1.
(a) Baseline-stationary condition: The observer stood at the home base (illustrated as blue cross) and judged the location of a briefly presented dimly lit target. (b) Walking condition: The observer walked blindly from the home base (illustrated as blue cross) for 1.5 m to the new location (illustrated as red cross). After a short delay (12 or 60 s), the dimly lit target was presented for him/her to judge the location. (c) Graph plotting the average (n = 8) judged target locations from Experiment 1. The black plus symbols, here and in other graphs, represent the physical target locations. The filled and open green triangle symbols represent the results for the 12 and 60 s waiting periods, respectively, in the walking condition. The red circle symbols represent the baseline-stationary condition. With the 12-s waiting period, judged locations (filled green triangles) in the walking condition were significantly nearer than in the baseline-stationary (filled red circles) condition. With the 60-s waiting period, judged locations (open triangles) had a much smaller separation from the baseline-stationary condition. The blue and gray curves with the same shape are the intrinsic bias fitted to the data by eye. Their horizontal shift is about 1.35 m. The black circle on the vertical axis represents the average eye height of the observers. (d) Graph plotting the average (n = 8) judged target locations from Experiment 2. The green triangle and red circle symbols represent results from the divided-attention-walking and baseline-stationary conditions, respectively. Judged locations from both conditions were similar and are fitted by the same intrinsic bias curve. Error bars represent the standard errors of the mean. (e and f) Average judged angular declination as a function of the physical angular declination. The error bars represent the standard errors of the means among observers (n = 8).
-
Figure 3—source data 1
Judged target locations of Experiment 1.
- https://cdn.elifesciences.org/articles/88095/elife-88095-fig3-data1-v1.xlsx
Figure 4
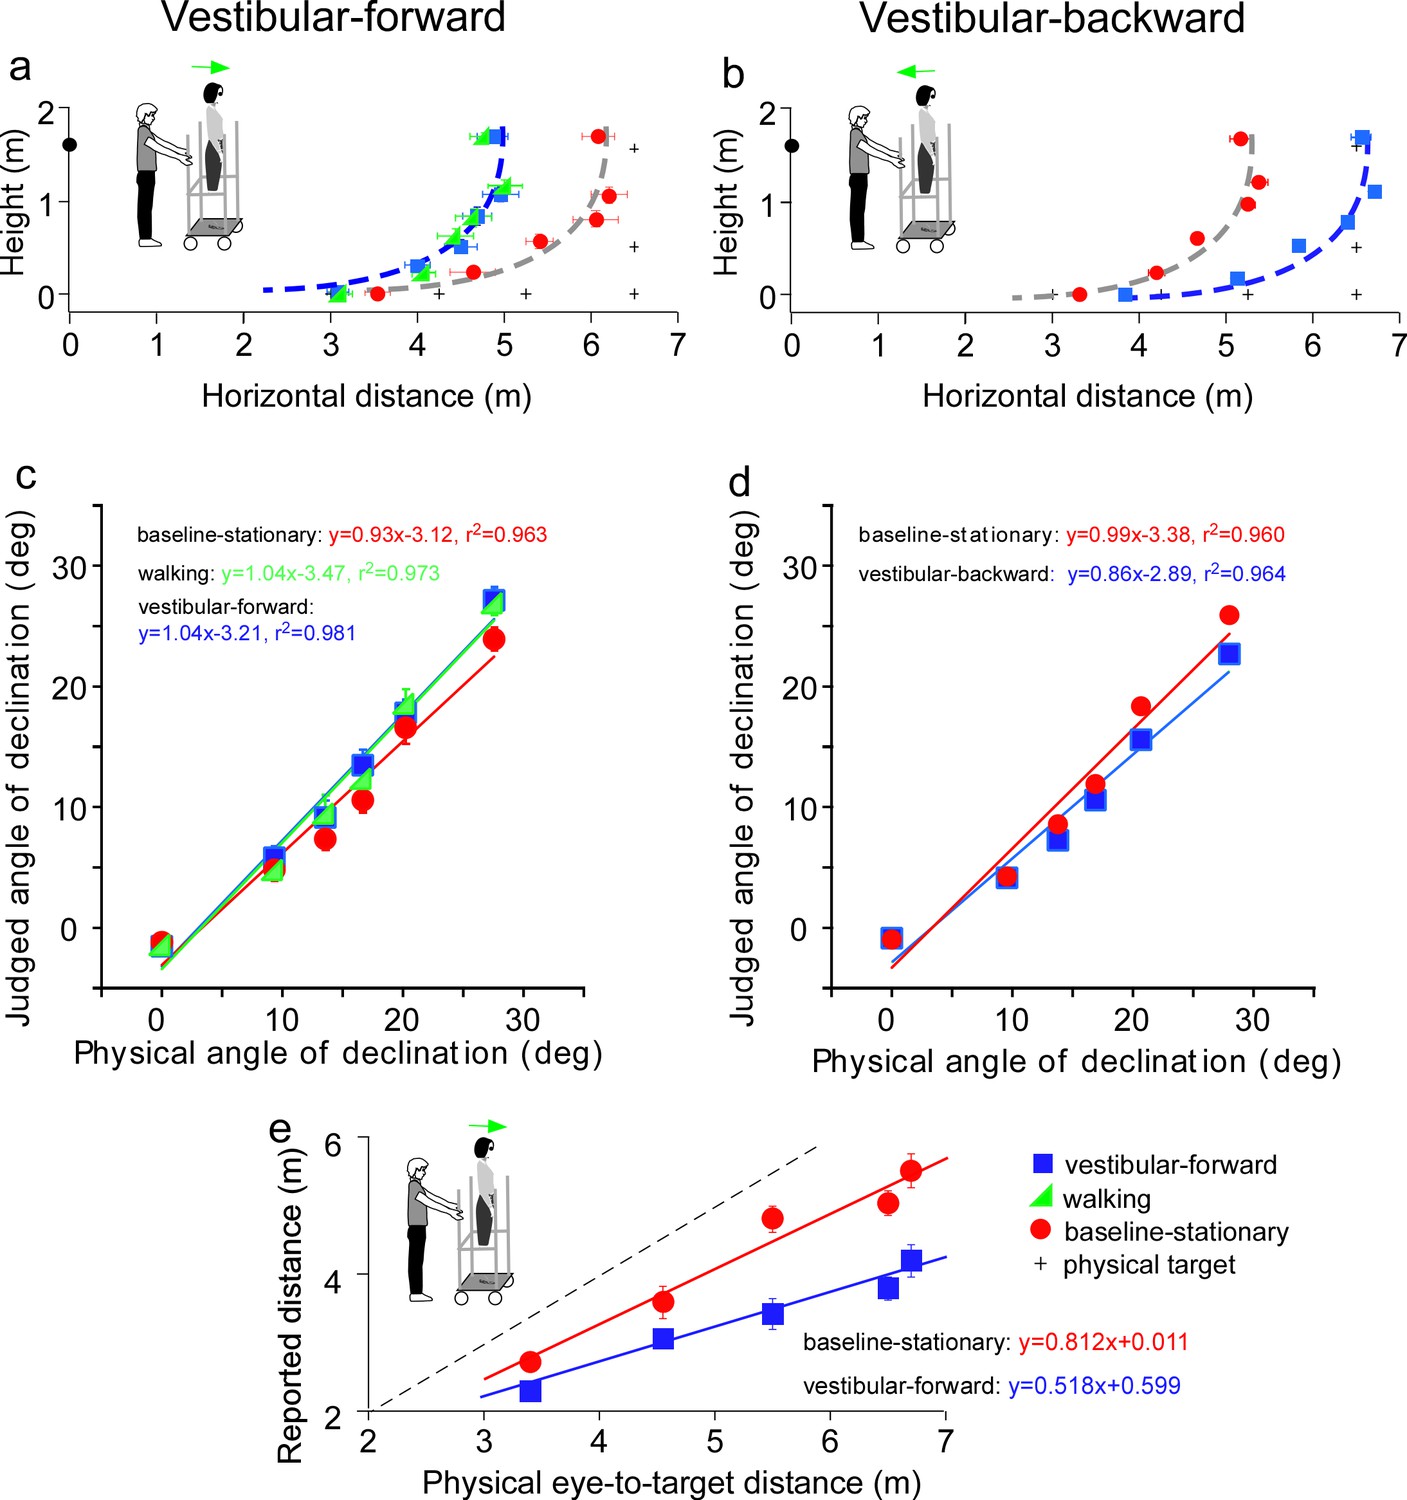
Results of Experiment 3 (a, b) and Experiment 4 (e).
(a) Vestibular-forward condition: The blue square and green triangle symbols represent the vestibular-forward and walking conditions, respectively, and they show that judged target locations were similar (n = 8). These judged target locations were nearer than those from the baseline-stationary condition (red circles). (b) Vestibular-backward condition: Backward translation caused judged target locations (blue squares) to be farther than those from the baseline-stationary condition (red circles) (n = 8). (c and d) Average judged angular declination as a function of the physical angular declination. (e) Experiment 4. Verbally reported results of vestibular-forward condition show shorter reported eye-to-target distances (blue squares) than in the baseline-stationary (red disc) condition (n = 8). Error bars represent standard errors of the mean (n=8).
-
Figure 4—source data 1
Judged target loactions of Experiment 3 and distances of Experiment 4.
- https://cdn.elifesciences.org/articles/88095/elife-88095-fig4-data1-v1.xlsx
Figure 5
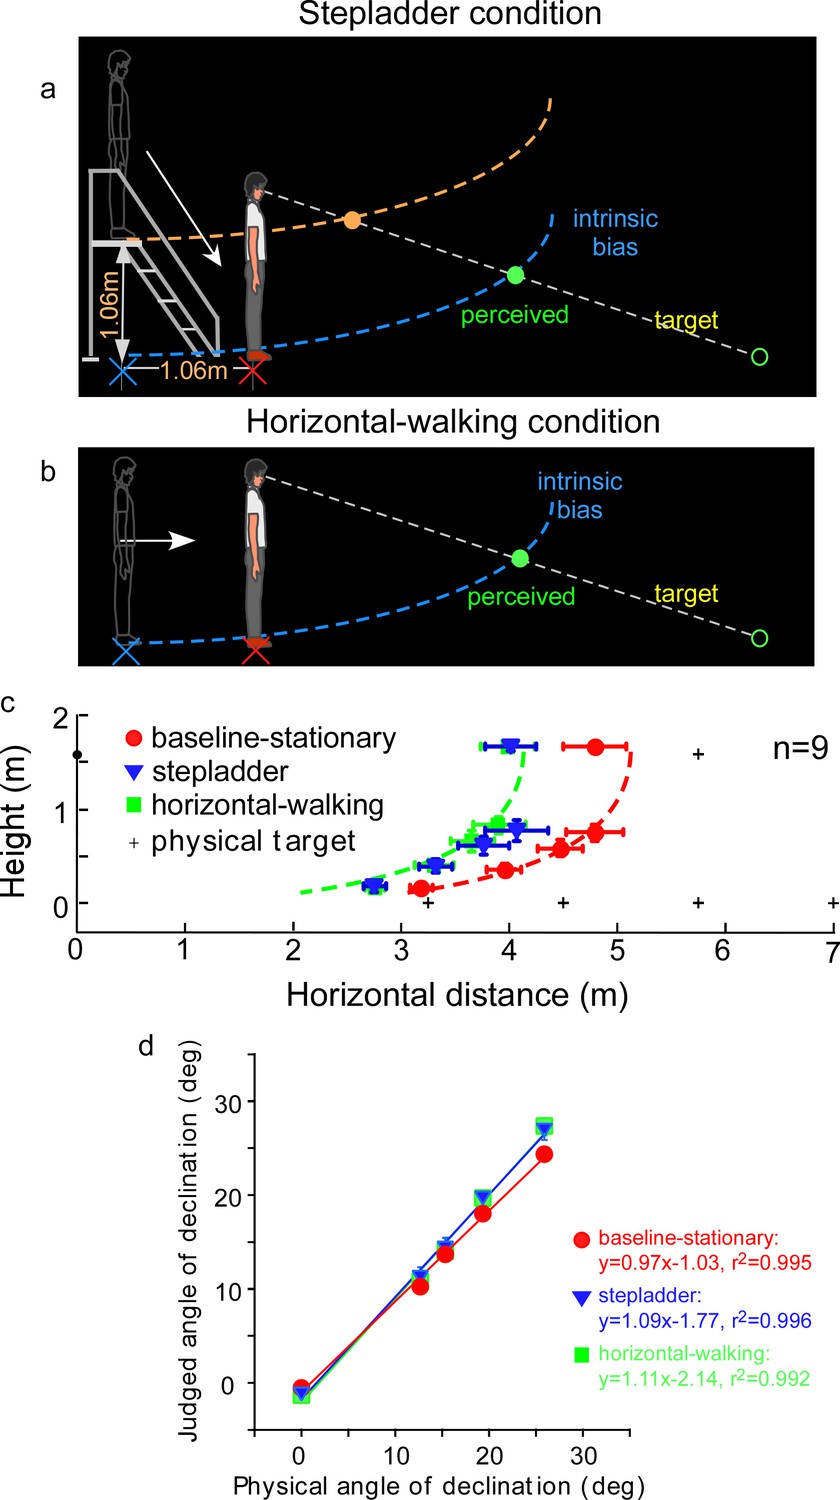
Experiment 5: predictions and average results.
(a) Stepladder condition where the observer descends from the stepladder in the dark. If the path-integration process only gauges the horizontally traveled distance, the intrinsic bias would be path integrated in the horizontal but not vertical direction. As such, the horizontal coordinate of the intrinsic bias (blue curve) is kept at the home base location on the floor while the vertical coordinate travels along with the observer. Thus, upon stepping down from the stepladder and standing on the floor, the observer underestimates the horizontal distance of the target. The target underestimation would be similar to that of the horizontal-walking condition depicted in b. In contrast, if the path-integration process integrates distance in both the horizontal and vertical directions, the intrinsic bias will remain at the top of the staircase (orange curve). The perceived target location will then be dramatically different from that in the horizontal-walking condition. (b) Horizontal-walking condition. (c) The average results of the baseline-stationary, horizontal-walking, and stepladder conditions, respectively, represented by the red circle, green square, and blue triangle symbols (n = 9). The judged horizontal distances are significantly shorter in the horizontal-walking condition than in the baseline-stationary conditions. The two sets of data points are fitted by the same intrinsic bias profile with a horizontal separation of 1.0 m, which is close to the walked distance (1.06 m) from the home base to the new location in the horizontal-walking condition. Of significance, the judged locations in the stepladder condition (blue triangles) are similar to that in the horizontal-walking condition (green squares). This confirms that the path-integration process mainly gauges the horizontal (ground) distance traveled. (d) Average judged angular declination as a function of the physical angular declination. Error bars represent standard errors of the mean (n=9).
-
Figure 5—source data 1
Judegd locations of Experiment 5.
- https://cdn.elifesciences.org/articles/88095/elife-88095-fig5-data1-v1.xlsx
Additional files
Download links
A two-part list of links to download the article, or parts of the article, in various formats.
Downloads (link to download the article as PDF)
Open citations (links to open the citations from this article in various online reference manager services)
Cite this article (links to download the citations from this article in formats compatible with various reference manager tools)
An allocentric human odometer for perceiving distances on the ground plane
eLife 12:RP88095.
https://doi.org/10.7554/eLife.88095.3


