RBP-J regulates homeostasis and function of circulating Ly6Clo monocytes
- Institute for Immunology and School of Medicine, Tsinghua University, China
- Tsinghua-Peking Center for Life Sciences, Tsinghua University, China
- Beijing Key Laboratory for Immunological Research on Chronic Diseases, China
- Arthritis and Tissue Degeneration Program and the David Z. Rosensweig Genomics Research Center, Hospital for Special Surgery, United States
- Department of Medicine, Weill Cornell Medical College, United States
Figures
Figure 1 with 1 supplement
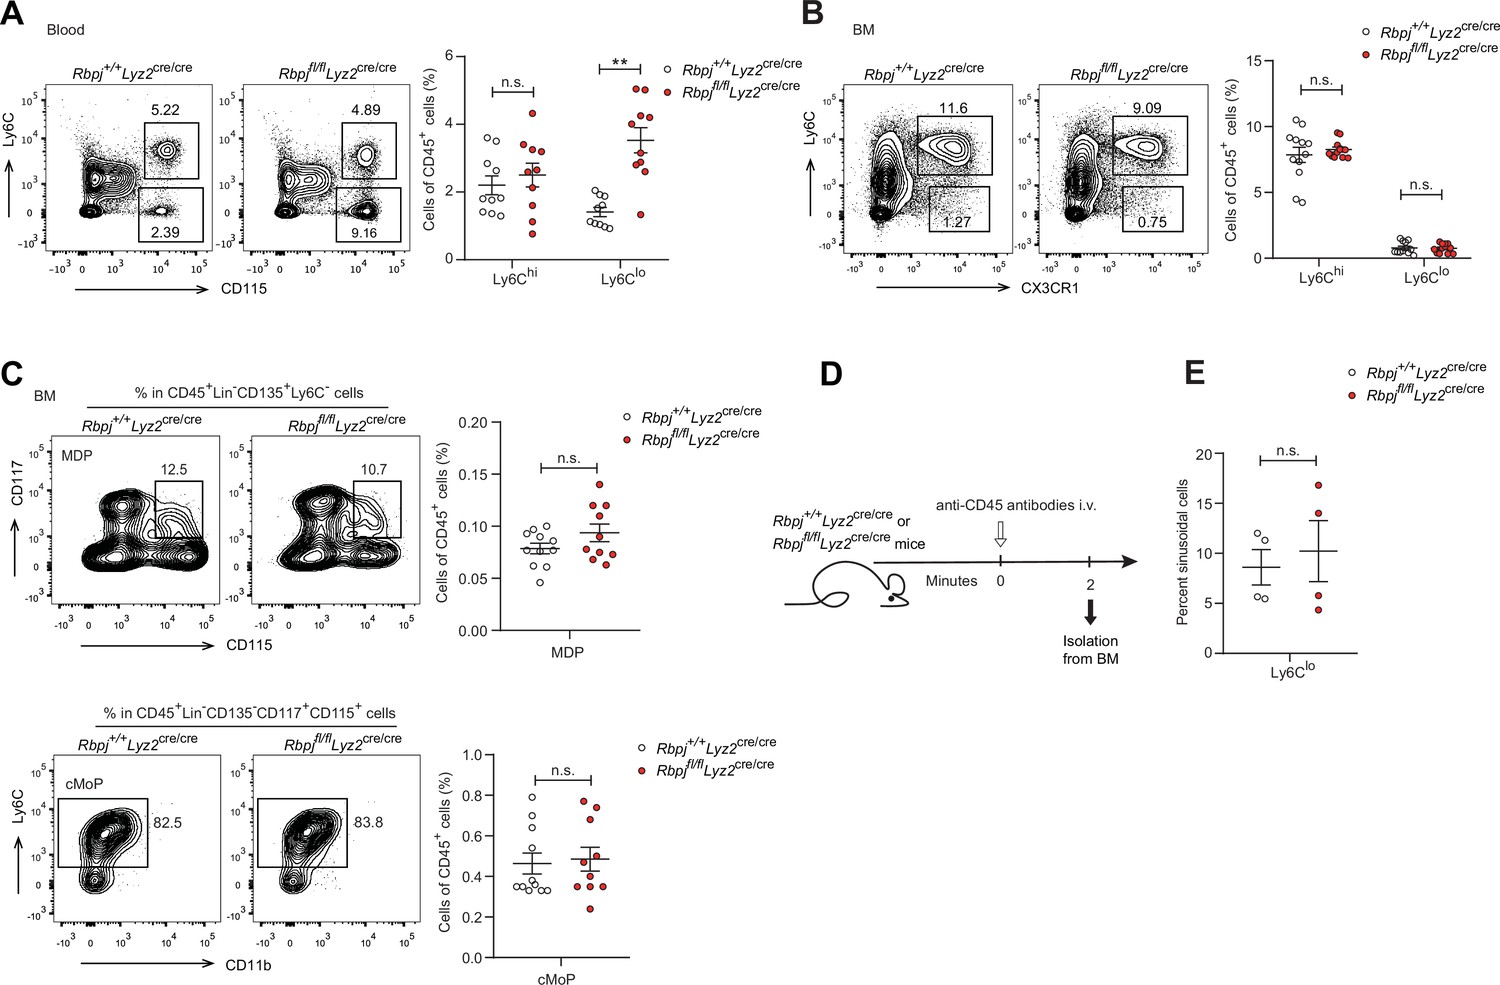
RBP-J-deficient mice display more blood Ly6Clo monocytes.
(A) Blood Ly6Chi and Ly6Clo monocytes in Rbpj+/+Lyz2cre/cre control and Rbpjfl/flLyz2cre/cre mice were determined by flow cytometry analyses (FACS). Representative FACS plots (left) and cumulative data of cell ratio (right) are shown. (B, C) Representative FACS plots and cumulative data quantitating percentages of bone marrow (BM) monocyte subsets (B) and myeloid progenitor cells (C) (CD45+CD11b+Ly6G-CD115+ Ly6Chi monocyte; CD45+CD11b+Ly6G-CD115+Ly6Clo monocyte; MDP, CD45+Lin-CD117+CD115+CD135+ Ly6C-; cMoP, CD45+Lin-CD11b-CD117+CD115+ CD135-Ly6C+). Lin: CD3, B220, Ter119, Gr-1 and CD11b. (D) Experimental outline for panel (E). (E) Cumulative data quantitating percentages of sinusoidal monocytes (CD45+) within total BM Ly6Clo monocytes. Data are pooled from at least two independent experiments; n ≥ 4 in each group. Data are shown as mean ± SEM; n.s., not significant; **p<0.01 (two-tailed Student’s unpaired t-test). Each symbol represents an individual mouse.
-
Figure 1—source data 1
Data for Figure 1.
- https://cdn.elifesciences.org/articles/88135/elife-88135-fig1-data1-v1.xlsx
Figure 1—figure supplement 1
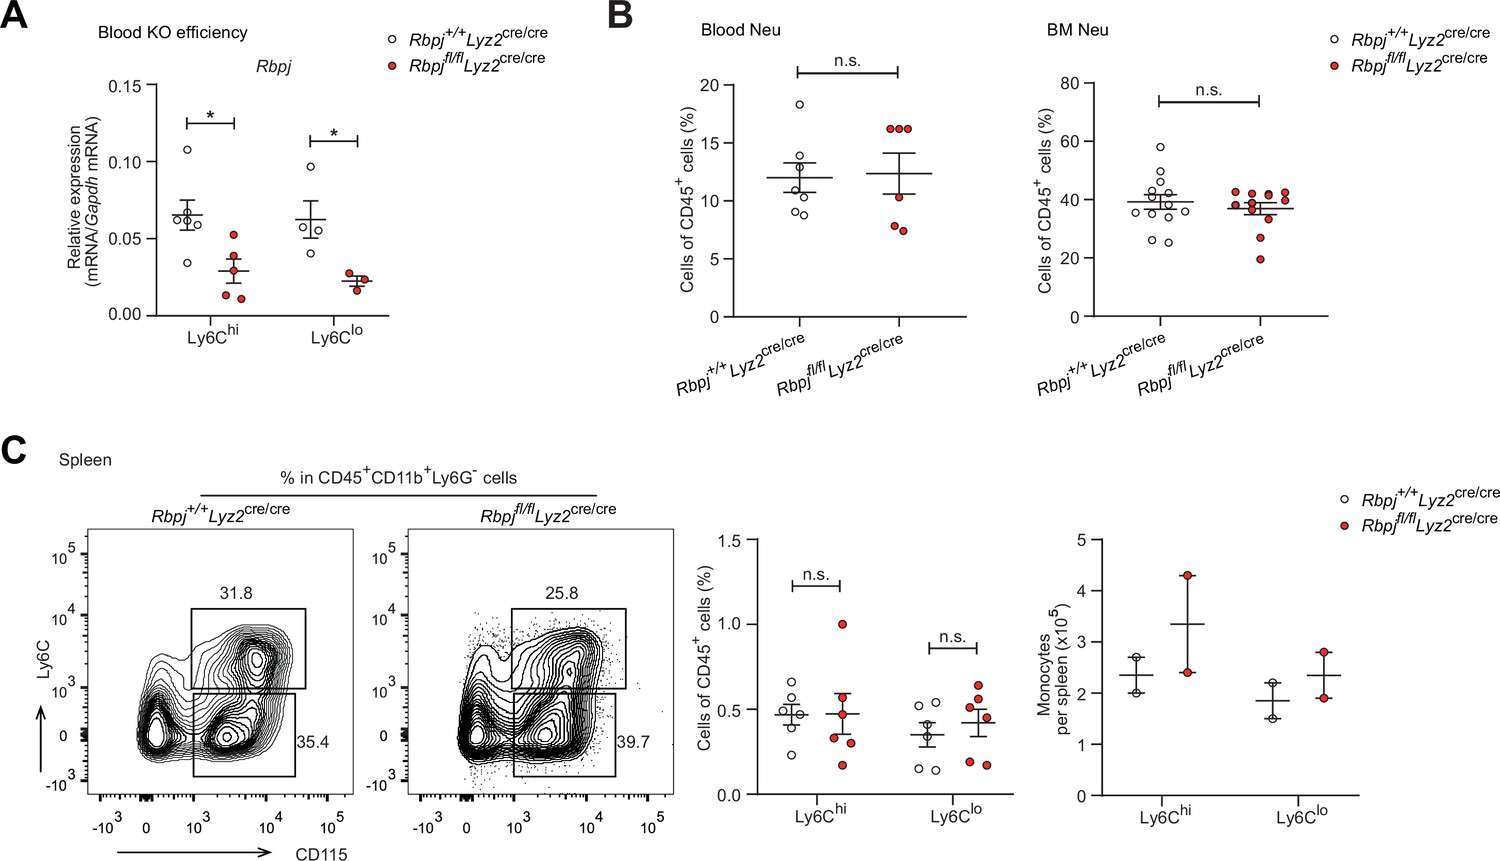
Control and RBP-J-deficient mice show similar neutrophils.
(A) Quantitative real-time PCR (qPCR) analysis of Rbpj expression in sorted monocyte subsets from control and RBP-J-deficient mice. (B) Blood and bone marrow (BM) CD45+CD11b+Ly6G+ neutrophils were determined by FACS. Cumulative data of cell ratio are shown. (C) Spleen monocyte subsets were determined by FACS. Representative FACS plots (left) and cumulative data of cell ratio and absolute numbers (right) are shown. Data are pooled from at least two independent experiments; n ≥ 2 in each group. Data are shown as mean ± SEM; n.s., not significant; *p<0.05 (two-tailed Student’s unpaired t-test). Each symbol represents an individual mouse.
-
Figure 1—figure supplement 1—source data 1
Data for Figure 1—figure supplement 1.
- https://cdn.elifesciences.org/articles/88135/elife-88135-fig1-figsupp1-data1-v1.xlsx
Figure 2 with 1 supplement
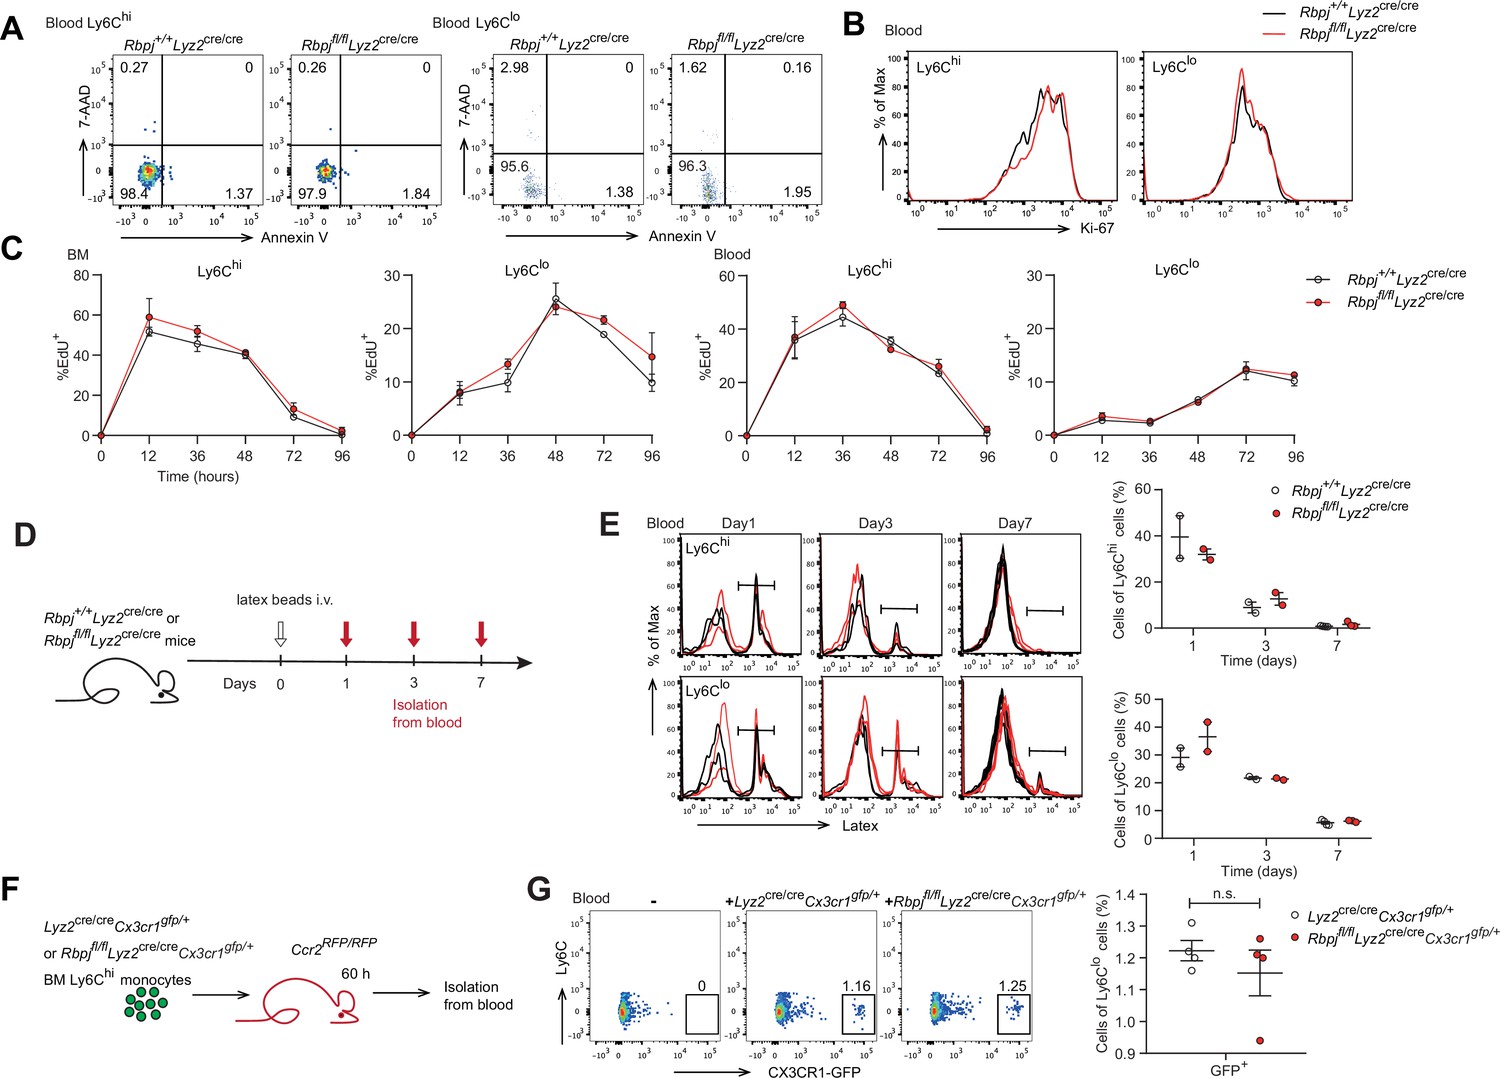
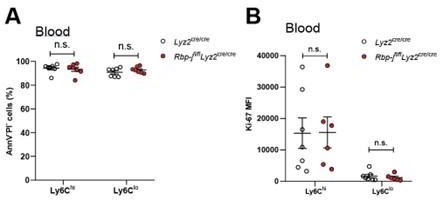
Monocyte subsets in RBP-J-deficient mice display normal cell death.
(A) Representative FACS plots of monocyte subsets in blood stained with 7-amino-actinomycin D (7-AAD) and Annexin V. (B) FACS analysis of Ki-67 expression in Rbpj+/+Lyz2cre/cre control and Rbpjfl/flLyz2cre/cre blood monocyte subsets. Black lines represent control mice, and red lines represent RBP-J-deficient mice. (C) Analysis of time course of EdU incorporation of monocyte subsets in bone marrow (BM) and blood after a single 1 mg EdU pulsing. The percentages of EdU+ cells among the indicated monocyte subsets are shown. (D) Experimental outline for panel (E). (E) Analysis of time course of latex beads incorporation of monocyte subsets in blood after latex beads injection. The percentages of latex+ cells among the indicated monocyte subsets are shown. (F) Cartoon depicting the adoptive transfer. BM GFP+Ly6Chi monocytes were sorted from Lyz2cre/creCx3cr1gfp/+ or Rbpjfl/flLyz2cre/creCx3cr1gfp/+ mice and transferred into Ccr2RFP/RFP recipient mice. Sixty hours after transfer, cell fate was analyzed. (G) Representative FACS plots are shown in the left panel, and the frequencies of GFP+Ly6Clo monocytes within total Ly6Clo monocytes are shown in the right panel. Data are pooled from two independent experiments (G); n ≥ 2 in each group (C, E, G). Data are shown as mean ± SEM; n.s., not significant; (two-tailed Student’s unpaired t-test). Each symbol represents an individual mouse (E, G).
-
Figure 2—source data 1
Data of Figure 2.
- https://cdn.elifesciences.org/articles/88135/elife-88135-fig2-data1-v1.xlsx
Figure 2—figure supplement 1
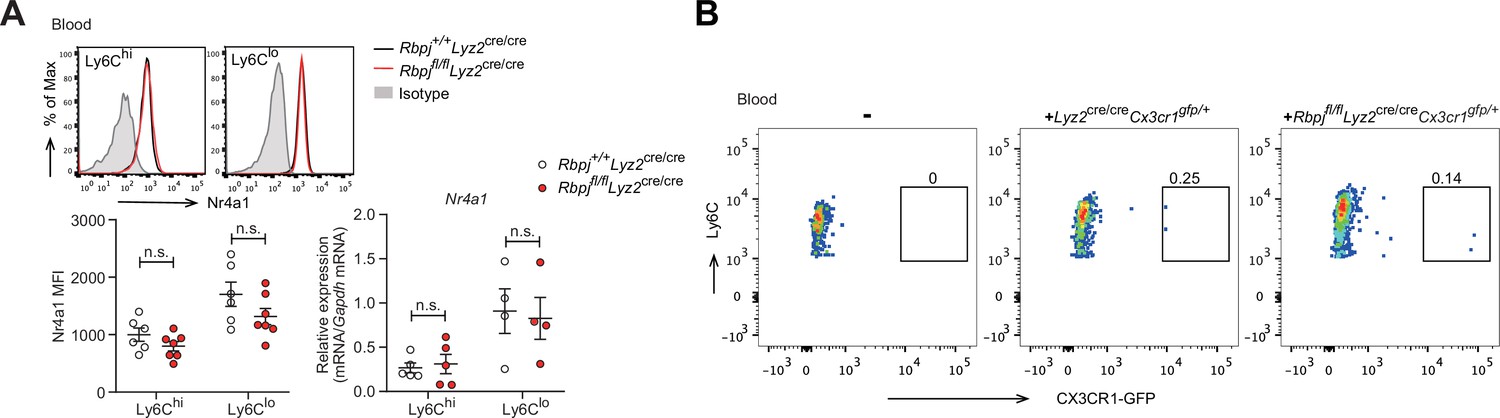
The conversion of Ly6Chi monocyte is identical in control and RBP-J-deficient mice.
(A) Representative FACS plots, cumulative mean fluorescence intensity (MFI) and quantitative real-time PCR (qPCR) analysis of Nr4a1 expression in control and RBP-J-deficient blood monocyte subsets. Shaded curves represent isotype control, black lines represent control mice, and red lines represent RBP-J-deficient mice. (B) Representative FACS plots of GFP+Ly6Chi monocytes in recipient. Data are pooled from two independent experiments (A); n ≥ 4 in each group. Data are shown as mean ± SEM; n.s., not significant (two-tailed Student’s unpaired t-test). Each symbol represents an individual mouse.
-
Figure 2—figure supplement 1—source data 1
Data for Figure 2—figure supplement 1.
- https://cdn.elifesciences.org/articles/88135/elife-88135-fig2-figsupp1-data1-v1.xlsx
Figure 3 with 1 supplement

The role of RBP-J in blood Ly6Clo monocytes is cell-intrinsic.
(A) Cartoon depicting the bone marrow (BM) transplantation. BM recipient 6-week-old male C57BL/6 mice (CD45.2) were lethally irradiated. BM cells from donor mice (Rbpj+/+Lyz2cre/cre or Rbpjfl/flLyz2cre/cre and CD45.1, Cx3cr1gfp/+) were collected and transferred into recipient mice. Mice were used after 8 wk of BM reconstitution. (B) Representative FACS plots (left) and cumulative data (right) quantitating the frequency of Rbpj+/+Lyz2cre/cre and Rbpjfl/flLyz2cre/cre donor cells among Ly6Chi and Ly6Clo monocytes in the blood of recipient mice. (C) Cartoon depicting the generation of Rbpj+/+Lyz2cre/cre control or Rbpjfl/flLyz2cre/cre and Cx3cr1gfp/+ parabiotic pairs. (D) Representative FACS plots (left) and cumulative data (right) quantitating percentages of monocyte subsets derived from control or RBP-J-deficient mice in control or RBP-J-deficient mice. (E) Representative FACS plots (left) and cumulative data (right) quantitating percentages of monocyte subsets derived from control or RBP-J-deficient mice in Cx3cr1gfp/+ mice. Data are pooled from at least two independent experiments; n ≥ 6 in each group. Data are shown as mean ± SEM; n.s., not significant; ***p<0.001; ****p<0.0001 (two-tailed Student’s unpaired t-test). Each symbol represents an individual mouse. SSC-A, side scatter area.
-
Figure 3—source data 1
Data of Figure 3.
- https://cdn.elifesciences.org/articles/88135/elife-88135-fig3-data1-v1.xlsx
Figure 3—figure supplement 1
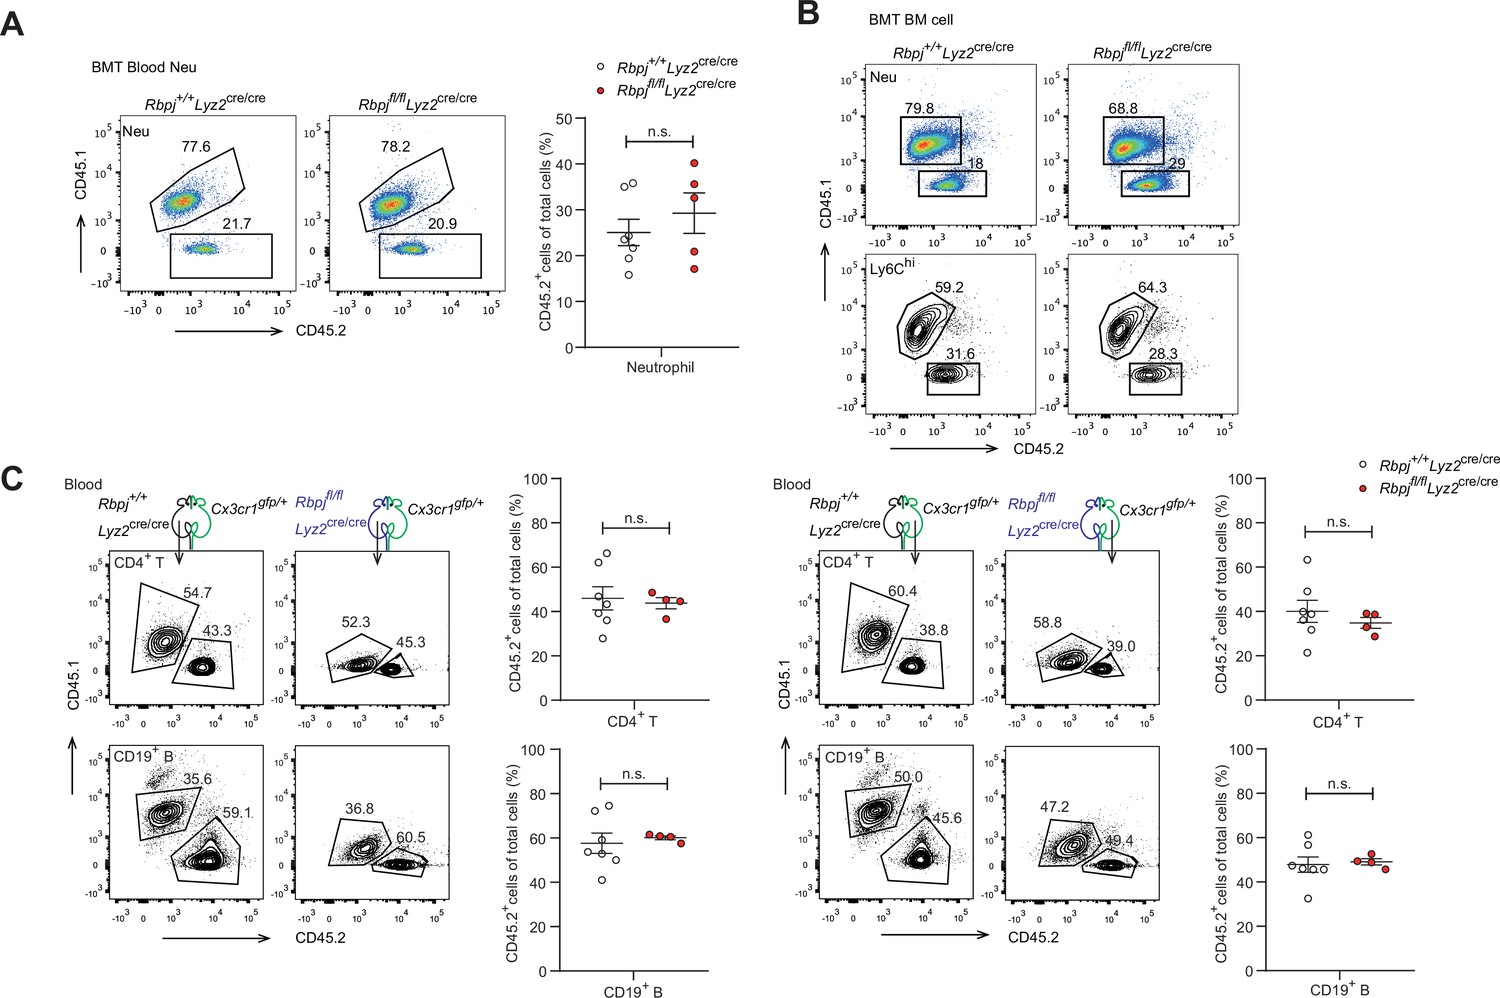
Cell-intrinsic requirement of RBP-J for Ly6Clo monocytes maintenance.
(A) Representative FACS plots (left) and cumulative data (right) quantitating percentages of blood neutrophils in recipient mice. (B) Bone marrow (BM) neutrophils and Ly6Chi monocytes in recipient mice were determined by FACS. (C) CD4+ T cells and CD19+ B cells were analyzed by FACS in parabiotic mice. Data are pooled from at least two independent experiments (A, C); n ≥ 4 in each group. Data are shown as mean ± SEM; n.s., not significant (two-tailed Student’s unpaired t-test). Each symbol represents an individual mouse.
-
Figure 3—figure supplement 1—source data 1
Data for Figure 3—figure supplement 1.
- https://cdn.elifesciences.org/articles/88135/elife-88135-fig3-figsupp1-data1-v1.xlsx
Figure 4 with 1 supplement
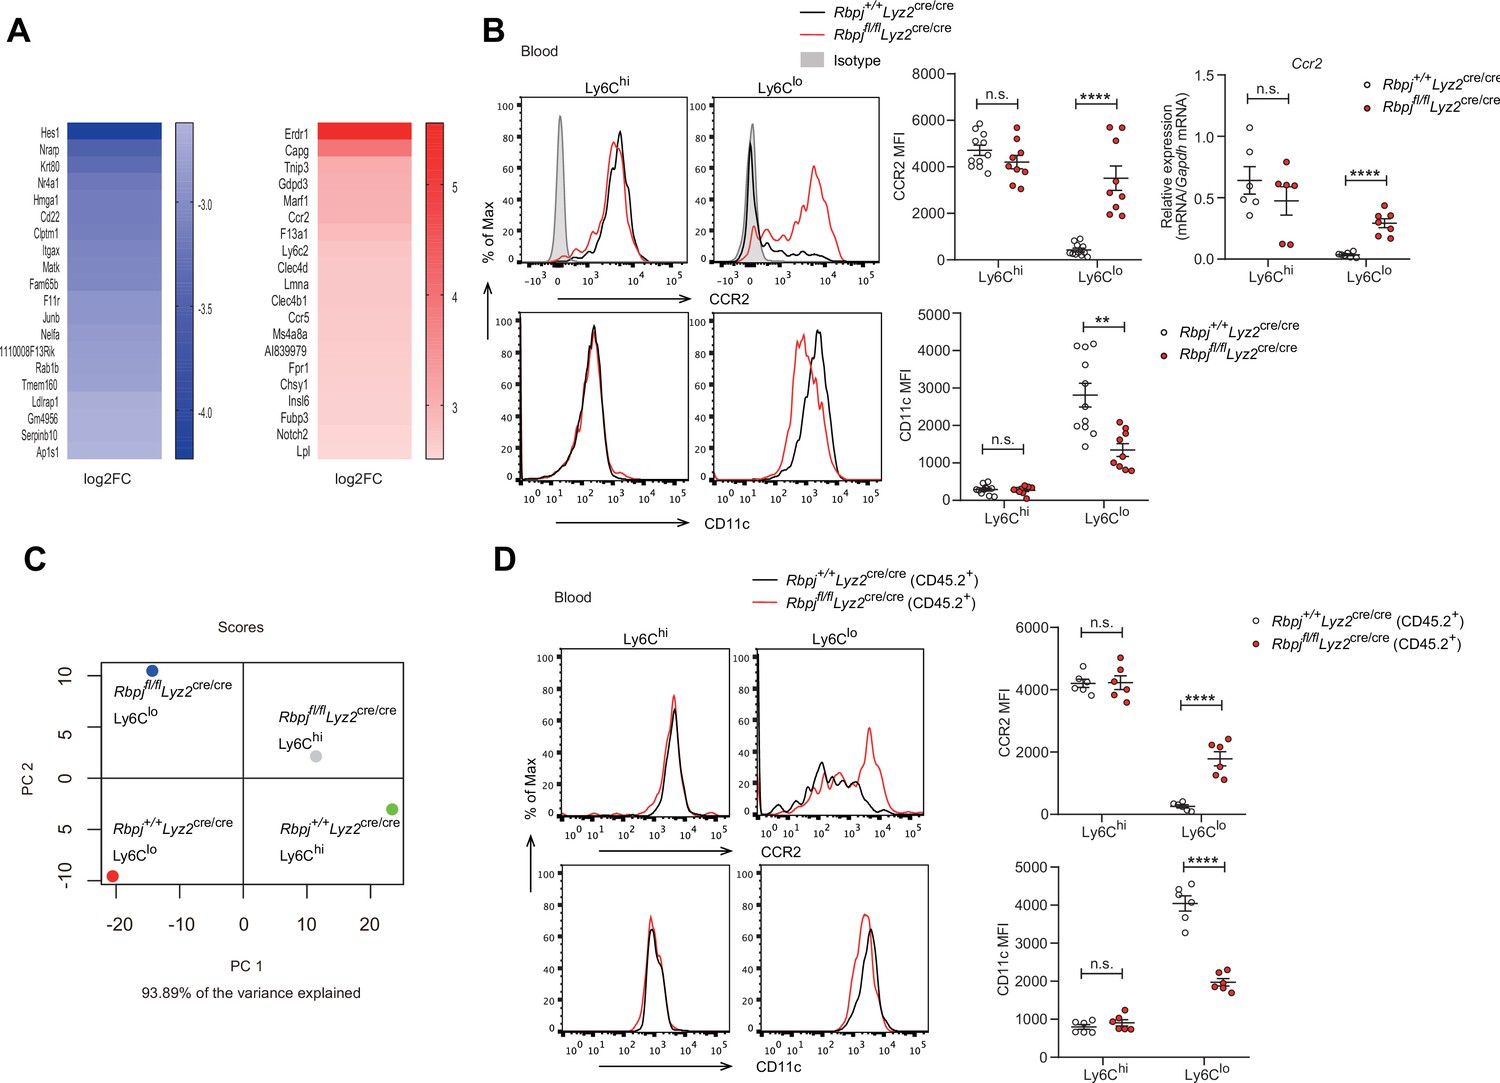
Phenotypic markers in Ly6Clo monocytes are changed in RBP-J-deficient mice.
(A) Heatmap of RNA-seq dataset showing the top 20 downregulated and upregulated genes in blood Ly6Clo monocytes from Rbpjfl/flLyz2cre/cre versus Rbpj+/+Lyz2cre/cre control mice. Blue and red font indicates downregulated and upregulated genes in RBP-J-deficient Ly6Clo monocytes respectively. (B) Representative FACS plots, cumulative mean fluorescence intensity (MFI), and quantitative real-time PCR (qPCR) analysis of CCR2/CD11c expression in control and RBP-J-deficient blood monocyte subsets. Shaded curves represent isotype control, black lines represent control mice, and red lines represent RBP-J-deficient mice. (C) Principal component analysis (PCA) of indicated cell types. (D) Representative FACS plots and cumulative MFI of CCR2/CD11c expression in blood monocyte subsets derived from control or RBP-J-deficient mice. Black lines represent control mice, and red lines represent RBP-J-deficient mice. Data are pooled from two independent experiments (B, D); n ≥ 6 in each group. Data are shown as mean ± SEM; n.s., not significant; **p<0.01; ****p<0.0001 (two-tailed Student’s unpaired t-test). Each symbol represents an individual mouse.
-
Figure 4—source data 1
Data of Figure 4.
- https://cdn.elifesciences.org/articles/88135/elife-88135-fig4-data1-v1.xlsx
Figure 4—figure supplement 1
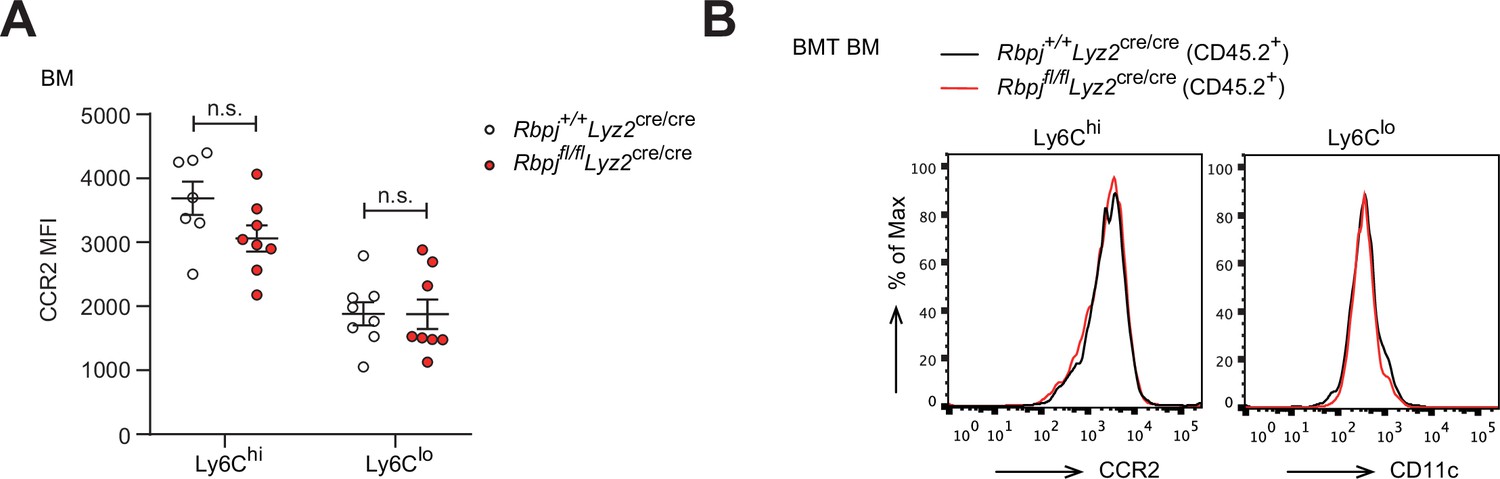
Normal expression of CCR2 and CD11c in bone marrow (BM) monocytes.
(A) Cumulative mean fluorescence intensity (MFI) of CCR2 expression in BM monocyte subsets. (B) FACS plots of CCR2 and CD11c in BM Ly6Chi and Ly6Clo monocytes from control and RBP-J-deficient mice. Data are pooled from three independent experiments (A); n ≥ 7 in each group. Data are shown as mean ± SEM; n.s., not significant (two-tailed Student’s unpaired t-test). Each symbol represents an individual mouse.
-
Figure 4—figure supplement 1—source data 1
Data for Figure 4—figure supplement 1.
- https://cdn.elifesciences.org/articles/88135/elife-88135-fig4-figsupp1-data1-v1.xlsx
Figure 5
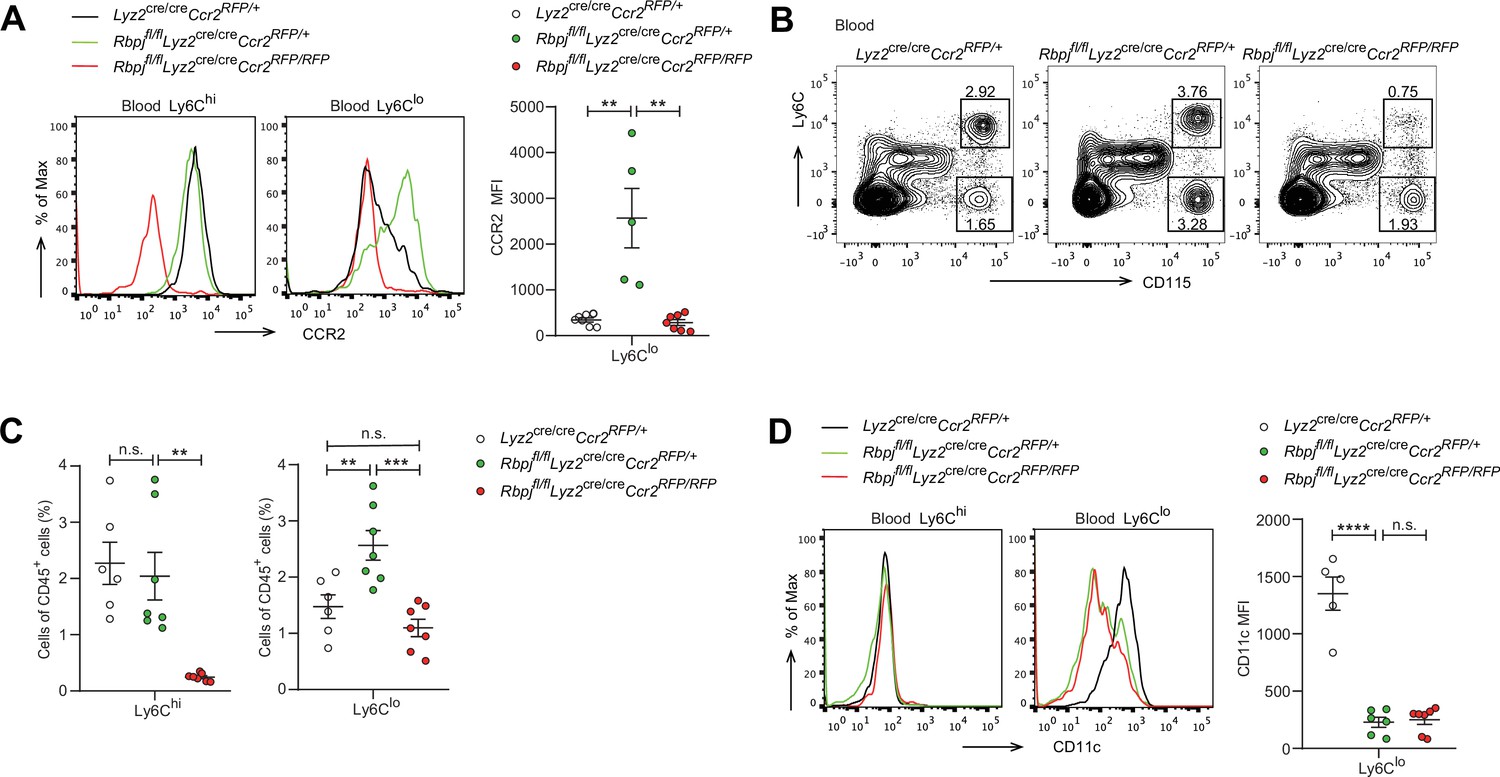
Blood Ly6Clo monocytes are decreased in double-deficient (DKO) mice.
(A) Representative FACS plots and cumulative mean fluorescence intensity (MFI) of CCR2 expression in Lyz2cre/creCcr2RFP/+ control, Rbpjfl/flLyz2cre/creCcr2RFP/+ and Rbpjfl/flLyz2cre/creCcr2RFP/RFP (DKO) blood Ly6Chi and Ly6Clo monocytes are shown. (B, C) Blood monocyte subsets in control, RBP-J-deficient, and DKO mice were determined by FACS. Representative FACS plots (B) and cumulative data of cell ratio (C) are shown. (D) Representative FACS plots and cumulative MFI of CD11c expression in control, RBP-J-deficient and DKO blood Ly6Chi and Ly6Clo monocytes are shown. Data are pooled from at least two independent experiments; n ≥ 5 in each group. Data are shown as mean ± SEM; n.s., not significant; **p<0.01; ***p<0.001; ****p<0.0001 (two-tailed Student’s unpaired t-test). Each symbol represents an individual mouse.
-
Figure 5—source data 1
Data for Figure 5.
- https://cdn.elifesciences.org/articles/88135/elife-88135-fig5-data1-v1.xlsx
Figure 6 with 1 supplement
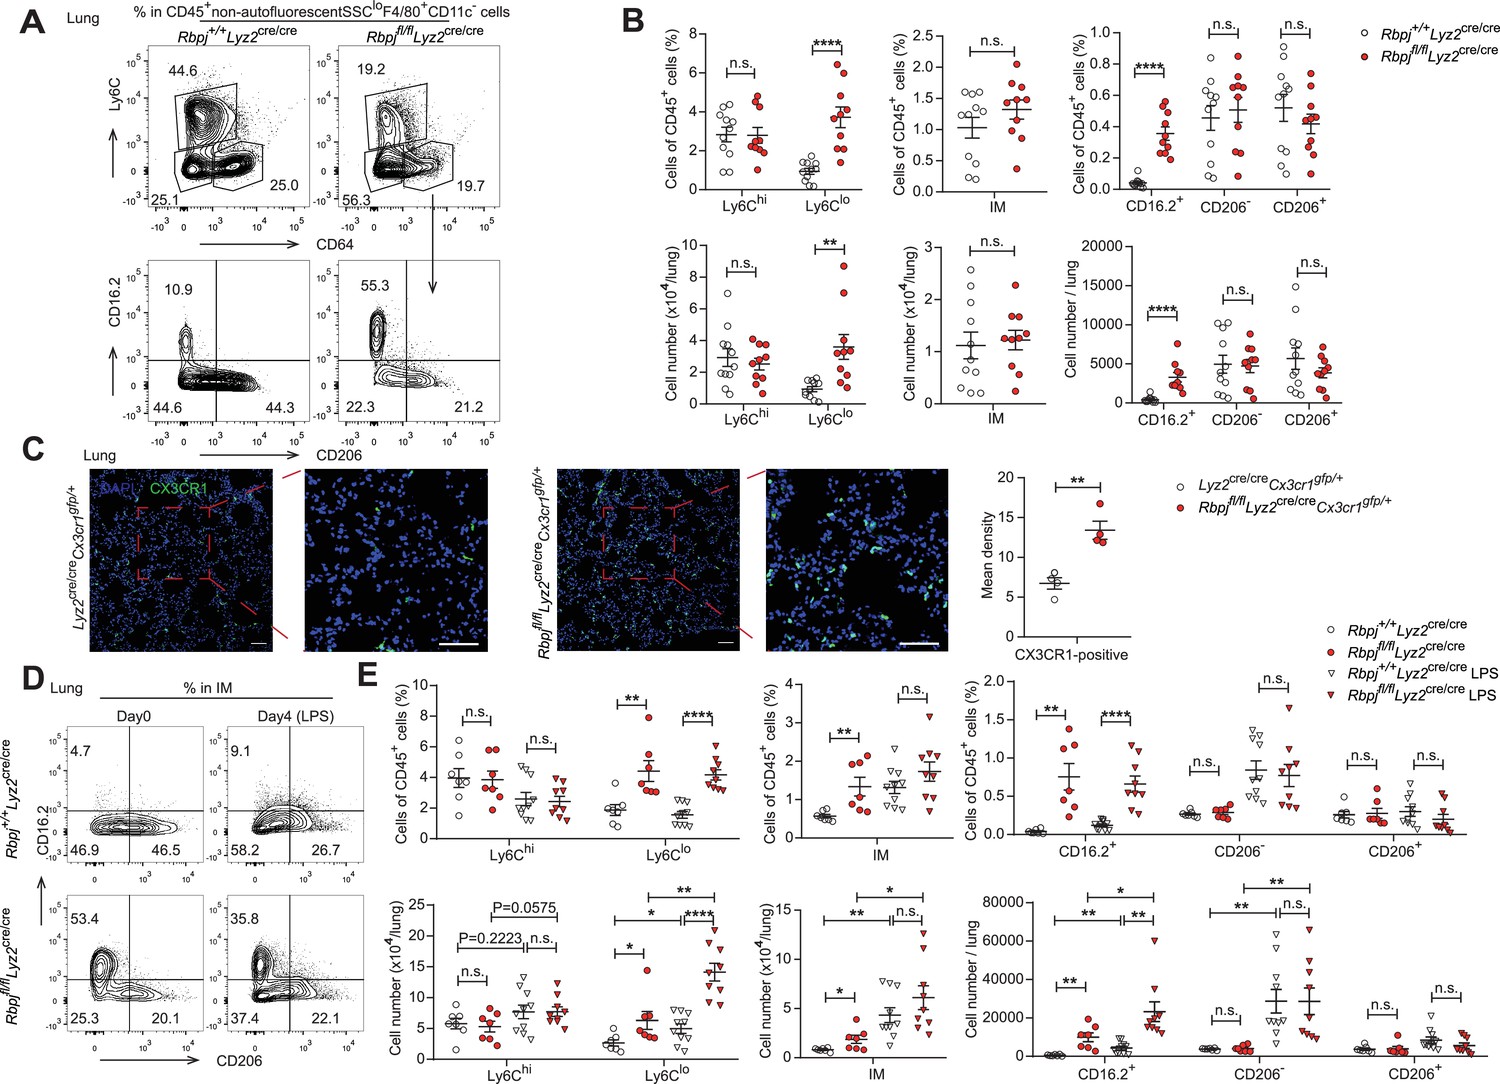
RBP-J-deficient mice exhibit more lung Ly6Clo monocytes and CD16.2+ interstitial macrophages (IM).
(A, B) indicate populations in the lungs of Rbpj+/+Lyz2cre/cre and Rbpjfl/flLyz2cre/cre mice were determined by FACS. Representative FACS plots (A) and cumulative data of cell ratio and absolute numbers (B) are shown. (C) Immunofluorescence staining for GFP+ cells in the lungs from Lyz2cre/creCx3cr1gfp/+ and Rbpjfl/flLyz2cre/creCx3cr1gfp/+ mice (CX3CR1 [green]; DAPI [blue]). Scale bars represent 50 µm. (D, E) Rbpj+/+Lyz2cre/cre and Rbpjfl/flLyz2cre/cre mice were instilled intranasally with phosphate buffered saline (PBS) or PBS containing lipopolysaccharide (LPS), and lungs were harvested at the indicated time points. Representative FACS plots (D) and cumulative data of cell ratio and absolute numbers (E) are shown. Data are pooled from at least two independent experiments; n ≥ 4 in each group. Data are shown as mean ± SEM; n.s., not significant; *p<0.05; **p<0.01; ****p<0.0001 (two-tailed Student’s unpaired t-test). Each symbol represents an individual mouse.
-
Figure 6—source data 1
Data for Figure 6.
- https://cdn.elifesciences.org/articles/88135/elife-88135-fig6-data1-v1.xlsx
-
Figure 6—source data 2
Data for Figure 6C.
- https://cdn.elifesciences.org/articles/88135/elife-88135-fig6-data2-v1.zip
Figure 6—figure supplement 1
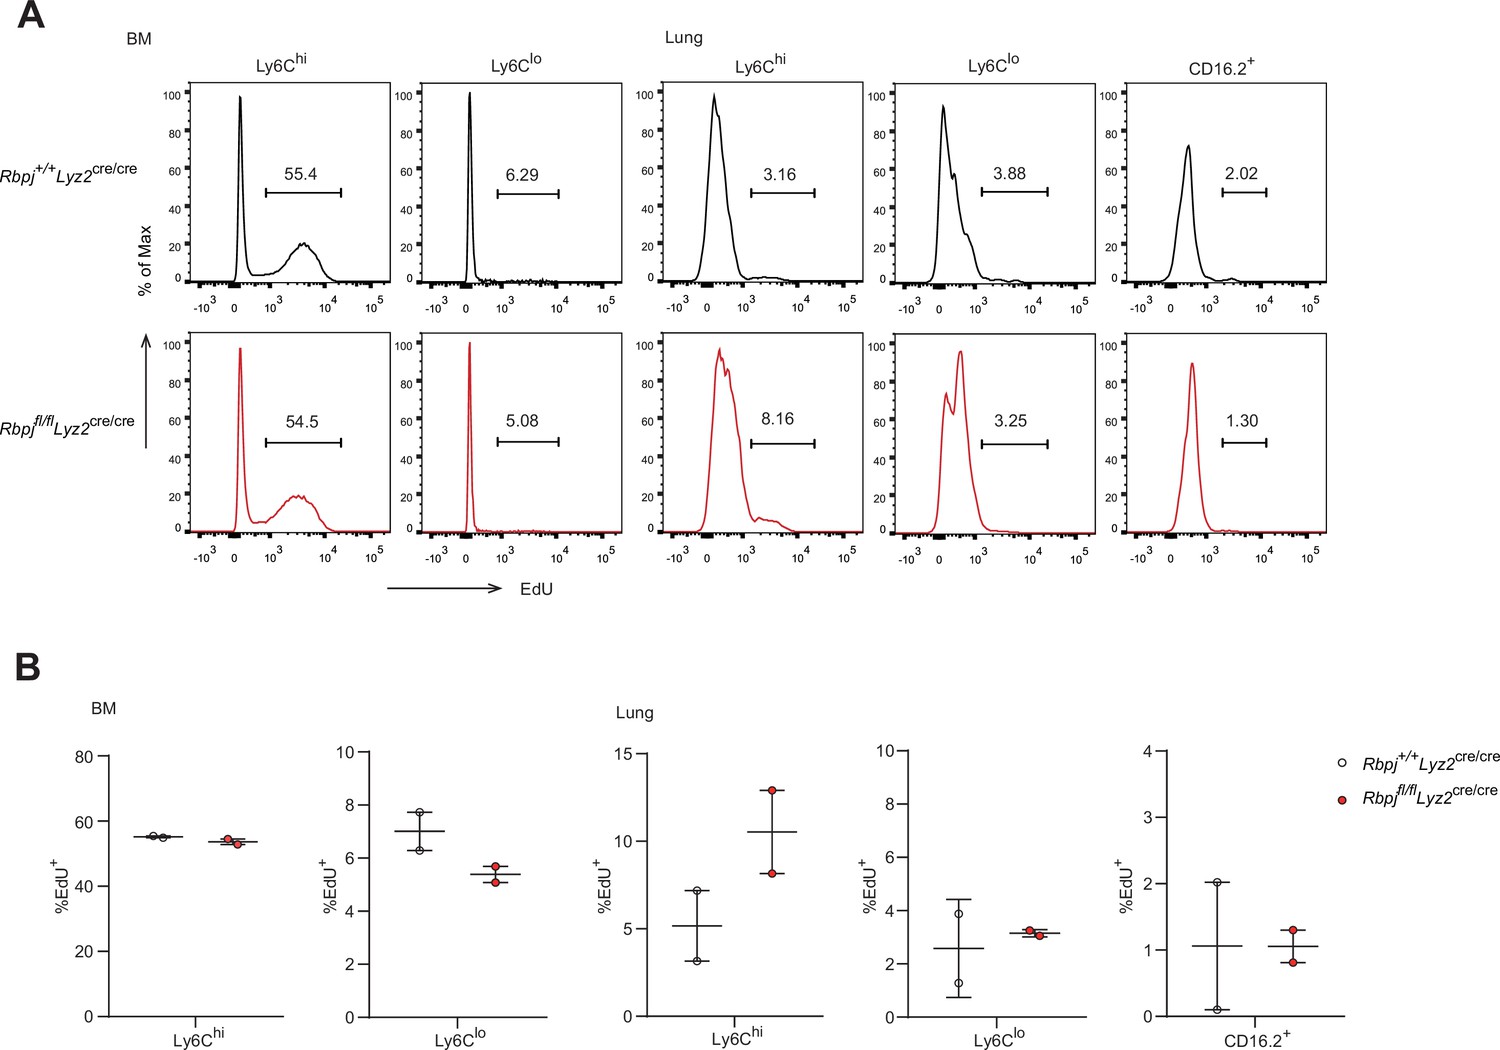
RBP-J is not required for turnover of lung Ly6Clo monocytes and CD16.2+ interstitial macrophages (IM).
(A, B) Incorporation of EdU was assessed 24 hours after injection. Bone marrow (BM) monocyte subsets were used as controls. FACS plots (A) and representative data (B) are shown. Each symbol represents an individual mouse.
-
Figure 6—figure supplement 1—source data 1
Data for Figure 6—figure supplement 1.
- https://cdn.elifesciences.org/articles/88135/elife-88135-fig6-figsupp1-data1-v1.xlsx
Figure 7
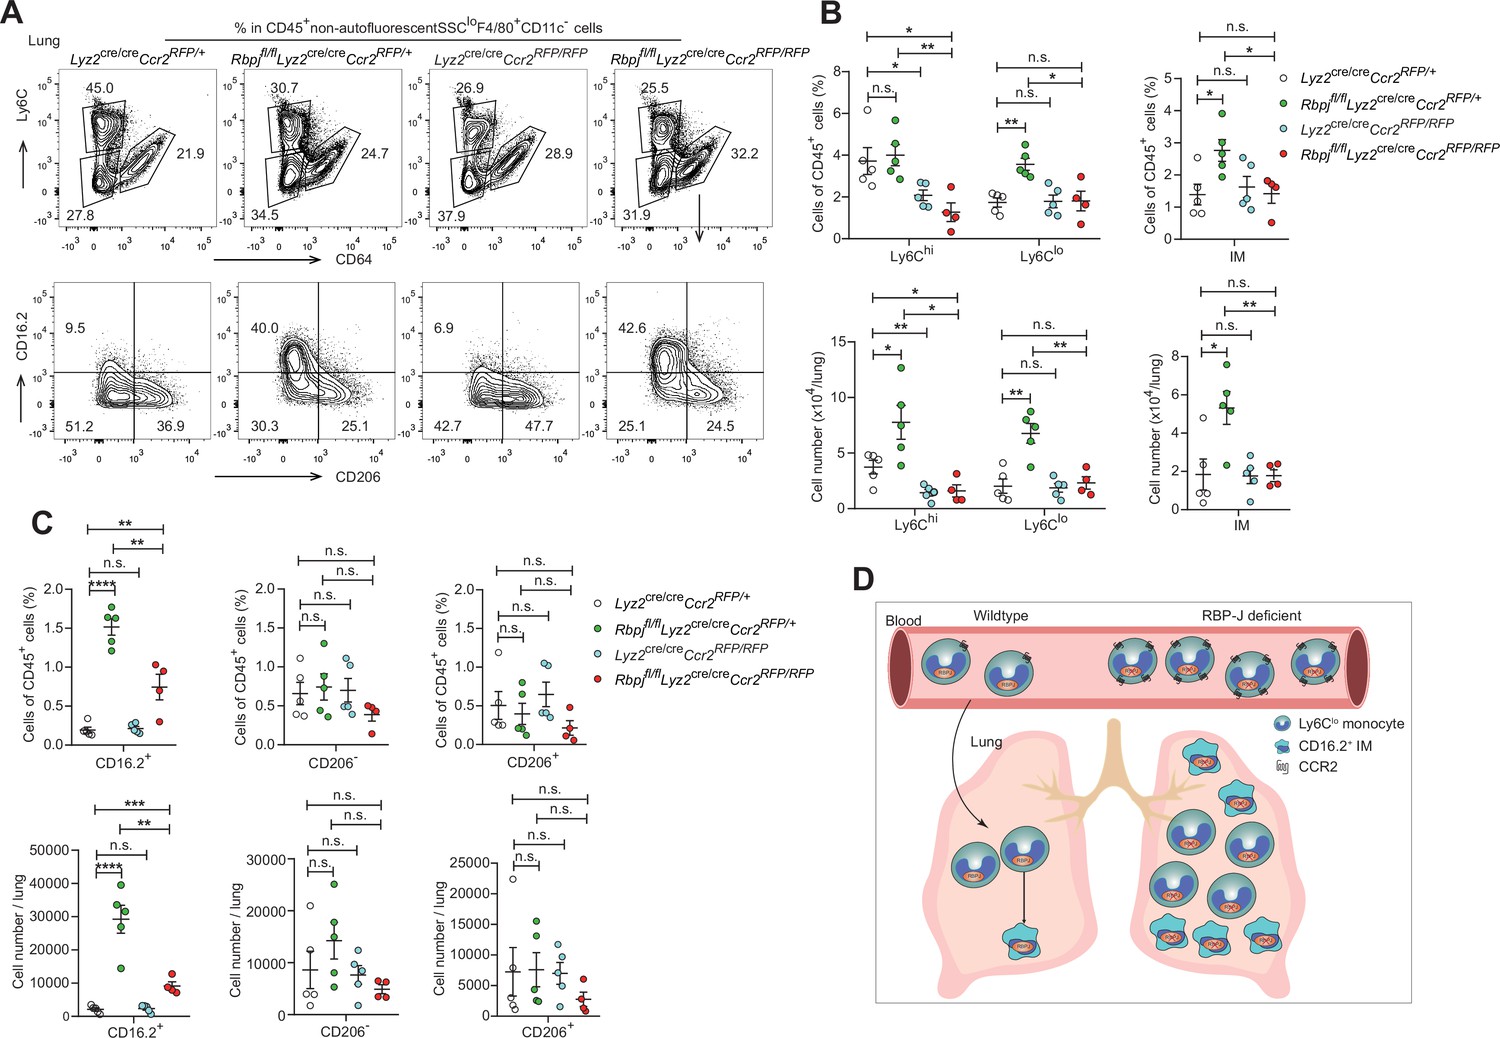
Double-deficient (DKO) mice lack lung Ly6Clo monocytes and CD16.2+ interstitial macrophages (IM).
(A) Representative FACS plots of lung monocyte and IM subsets in Lyz2cre/creCcr2RFP/+, Rbpjfl/flLyz2cre/creCcr2RFP/+, Lyz2cre/creCcr2RFP/RFP and Rbpjfl/flLyz2cre/creCcr2RFP/RFP mice. (B, C) Cumulative data of cell ratio and absolute numbers of monocyte (B) and IM (C) subsets. (D) Proposed model. RBP-J is a crucial regulator of blood Ly6Clo monocytes. Mice with conditional deletion of RBP-J in myeloid cells exhibit a marked increase in blood Ly6Clo monocytes, which highly express CCR2, and subsequently accumulate lung Ly6Clo monocytes and CD16.2+ IM. Data are pooled from two independent experiments; n ≥ 4 in each group. Data are shown as mean ± SEM; n.s., not significant; *p<0.05; **p<0.01; ***p<0.001; ****p<0.0001 (two-tailed Student’s unpaired t-test). Each symbol represents an individual mouse.
-
Figure 7—source data 1
Data for Figure 7.
- https://cdn.elifesciences.org/articles/88135/elife-88135-fig7-data1-v1.xlsx
Author response image 1
Author response image 2
Author response image 3
Tables
Table 1
Primers sequences for regular quantitative real-time PCR (qPCR) used in this study.
| Gene | Forward primer | Reverse primer |
|---|---|---|
| Gapdh | ATCAAGAAGGTGGTGAAGCA | AGACAACCTGGTCCTCAGTGT |
| Rbpj | ACCCCTGTGCCTGTCGTAGAA | TCCCGGAATGCAGAAATGTC |
| Nr4a1 | TTGAGCTTGAATACAGGGCA | AGTTGGGGGAGTGTGCTAGA |
| Ccr2 | CCTTGGGAATGAGTAACTGTGTGAT | ATGGAGAGATACCTTCGGAACTTCT |
Appendix 1—key resources table
| Reagent type (species) or resource | Designation | Source or reference | Identifiers | Additional information |
|---|---|---|---|---|
| Strain, strain background (Mus musculus) | Cx3cr1gfp/gfp | Jackson Laboratory | Strain #: 005582 from Jackson Laboratory | |
| Strain, strain background (M. musculus) | Ccr2RFP/RFP | Jackson Laboratory | Strain #: 017586 from Jackson Laboratory | |
| Strain, strain background (M. musculus) | Rbpjfl/fl | Tasuku Honjo of Kyoto University | ||
| Strain, strain background (M. musculus) | Lyz2-Cre | Jackson Laboratory | Strain #: 004781 from Jackson Laboratory | |
| Strain, strain background (M. musculus) | C57BL6/J | Jackson Laboratory | Strain #: 000664 from Jackson Laboratory | |
| Strain, strain background (M. musculus) | CD45.1 | Jackson Laboratory | Strain #:002014 from Jackson Laboratory | |
| Antibody | APC/Cy7 anti-mouse CD45 antibody | BioLegend | 103116 | 1:400 |
| Antibody | PE anti-mouse CD45 | BioLegend | 103106 | 1:400 |
| Antibody | Brilliant Violet 510 anti-mouse CD45 antibody | BioLegend | 103137 | 1:400 |
| Antibody | Alexa Fluor 700 anti-mouse Ly-6C | BioLegend | 128024 | 1:400 |
| Antibody | PE anti-mouse Ly-6C | BD Biosciences | 560592 | 1:400 |
| Antibody | CD4 monoclonal antibody, PerCP-Cyanine5.5 | eBioscience | 45-0042-82 | 1:400 |
| Antibody | PE anti-mouse CD3ε antibody | BioLegend | 100307 | 1:400 |
| Antibody | BV605 anti-mouse CD19 antibody | BioLegend | 115539 | 1:400 |
| Antibody | BV421 anti-mouse CD16.2 antibody | BioLegend | 149521 | 1:400 |
| Antibody | CD11c monoclonal antibody, PE-Cyanine7 | eBioscience | 25-0114-82 | 1:400 |
| Antibody | CD11c monoclonal antibody, PerCP-Cyanine5.5 | eBioscience | 45-0114-82 | 1:400 |
| Antibody | Ly-6G monoclonal antibody, APC | eBioscience | 17-9668-82 | 1:400 |
| Antibody | Ly-6G monoclonal antibody, PerCP-eFluor 710 | eBioscience | 46-9668-82 | 1:400 |
| Antibody | CD11b monoclonal antibody, PerCP-Cyanine5.5 | eBioscience | 45-0112-82 | 1:400 |
| Antibody | CD11b monoclonal antibody, PE-Cyanine7 | eBioscience | 25-0112-82 | 1:400 |
| Antibody | CD117 (c-Kit) monoclonal antibody, APC | eBioscience | 17-1171-82 | 1:400 |
| Antibody | CD135 (Flt3) monoclonal antibody, APC, | eBioscience | 17-1351-82 | 1:400 |
| Antibody | CD135 (Flt3) monoclonal antibody, PE | eBioscience | 12-1351-82 | 1:400 |
| Antibody | Brilliant Violet 421 anti-mouse CD192 (CCR2) antibody | BioLegend | 150605 | 1:400 |
| Antibody | Mouse Hematopoietic Lineage Antibody Cocktail, eFluor 450 | eBioscience | 88-7772-72 | 1:400 |
| Antibody | Brilliant Violet 421 anti-mouse CD45.1 antibody | BioLegend | 110732 | 1:400 |
| Antibody | CD45.2 monoclonal antibody, PE-Cyanine7 | eBioscience | 25-0454-80 | 1:400 |
| Antibody | FITC anti-mouse F4/80 antibody | BioLegend | 123107 | 1:400 |
| Antibody | APC/Cyanine7 anti-mouse F4/80 antibody | BioLegend | 123117 | 1:400 |
| Antibody | APC anti-mouse CD64 antibody | BioLegend | 139306 | 1:400 |
| Antibody | CD206 monoclonal antibody, PE | eBioscience | 12-2061-82 | 1:400 |
| Antibody | PerCP/Cyanine5.5 anti-mouse CD206 antibody | BioLegend | 141715 | 1:400 |
| Antibody | Nur77 monoclonal antibody, PerCP-eFluor 710 | eBioscience | 46-5965-82 | 1:400 |
| Antibody | Ki-67 monoclonal antibody, APC | eBioscience | 17-5698-82 | 1:400 |
| Antibody | CD115 monoclonal antibody, Biotin | eBioscience | 13-1152-85 | 1:400 |
| Antibody | Brilliant Violet 605 Streptavidin | BioLegend | 405229 | 1:400 |
| Antibody | Rabbit anti-GFP antibody | Proteintech | 50430-2-AP | 1:200 |
| Antibody | Goat anti-rabbit Alexa Fluor 488 | Cell Signaling Technology | 4412S | 1:1000 |
| Chemical compound, drug | Phosphate buffered saline (PBS) | Gibco | C10010500BT | |
| Chemical compound, drug | CountBright Absolute Counting Beads | Invitrogen | C36950 | |
| Chemical compound, drug | DAPI | Solarbio | C0060-1ml | |
| Chemical compound, drug | HBSS | MACGENE | CC016.1 | |
| Chemical compound, drug | FBS | Gibco | 16000-044 | |
| Chemical compound, drug | Collagenase type I | Sigma-Aldrich | C0130-500MG | |
| Chemical compound, drug | DNase I | Sigma-Aldrich | 10104159001 | |
| Chemical compound, drug | Percoll | GE Healthcare | 17-0891-01 | |
| Chemical compound, drug | SlowFade Diamond Antifade Mountant | Life Technologies | S36972 | |
| Chemical compound, drug | Tween-20 | Amresco | 0777-1L | |
| Chemical compound, drug | Paraformaldehyde | Sigma-Aldrich | 158127-500G | |
| Chemical compound, drug | OCT | Sakura Finetek | 4583 | |
| Chemical compound, drug | Triton X-100 | Merck Millipore | 648466 | |
| Chemical compound, drug | Glycine | Amresco | 0167-5kg | |
| Chemical compound, drug | Lipopolysaccharide (LPS) | Sigma-Aldrich | L2630 | |
| Commercial assay or kit | Cytofix/Cytoperm Fixation/Permeabilization Solution Kit | BD Biosciences | 554715 | |
| Commercial assay or kit | Click-iT EdU AF488 Flow Cytometry Assay Kit | Invitrogen | C10425 | |
| Commercial assay or kit | Fluoresbrite Polychromatic Red Microspheres | Polysciences | 19507-5 | |
| Commercial assay or kit | 7-AAD Viability Staining Solution | BioLegend | 420403 | |
| Commercial assay or kit | Total RNA Purification Kit | GeneMarkbio | TR01-150 | |
| Commercial assay or kit | FastSYBR mixture | CWBIO | CW2622M | |
| Commercial assay or kit | Reverse Transcriptase M-MLV | Takara | 2641B | |
| Commercial assay or kit | Annexin V Apoptosis Detection Kit APC | eBioscience | 88-8007-72 | |
| Software, algorithm | FlowJo | FlowJo | RRID:SCR_008520 | |
| Software, algorithm | Prism | GraphPad | RRID:SCR_002798 | |
| Software, algorithm | ImageJ | ImageJ | RRID:SCR_003070 |
Additional files
Download links
A two-part list of links to download the article, or parts of the article, in various formats.
Downloads (link to download the article as PDF)
Open citations (links to open the citations from this article in various online reference manager services)
Cite this article (links to download the citations from this article in formats compatible with various reference manager tools)
RBP-J regulates homeostasis and function of circulating Ly6Clo monocytes
eLife 12:RP88135.
https://doi.org/10.7554/eLife.88135.3


