Hunger- and thirst-sensing neurons modulate a neuroendocrine network to coordinate sugar and water ingestion
- University of California, Berkeley, United States
Figures
Figure 1 with 1 supplement
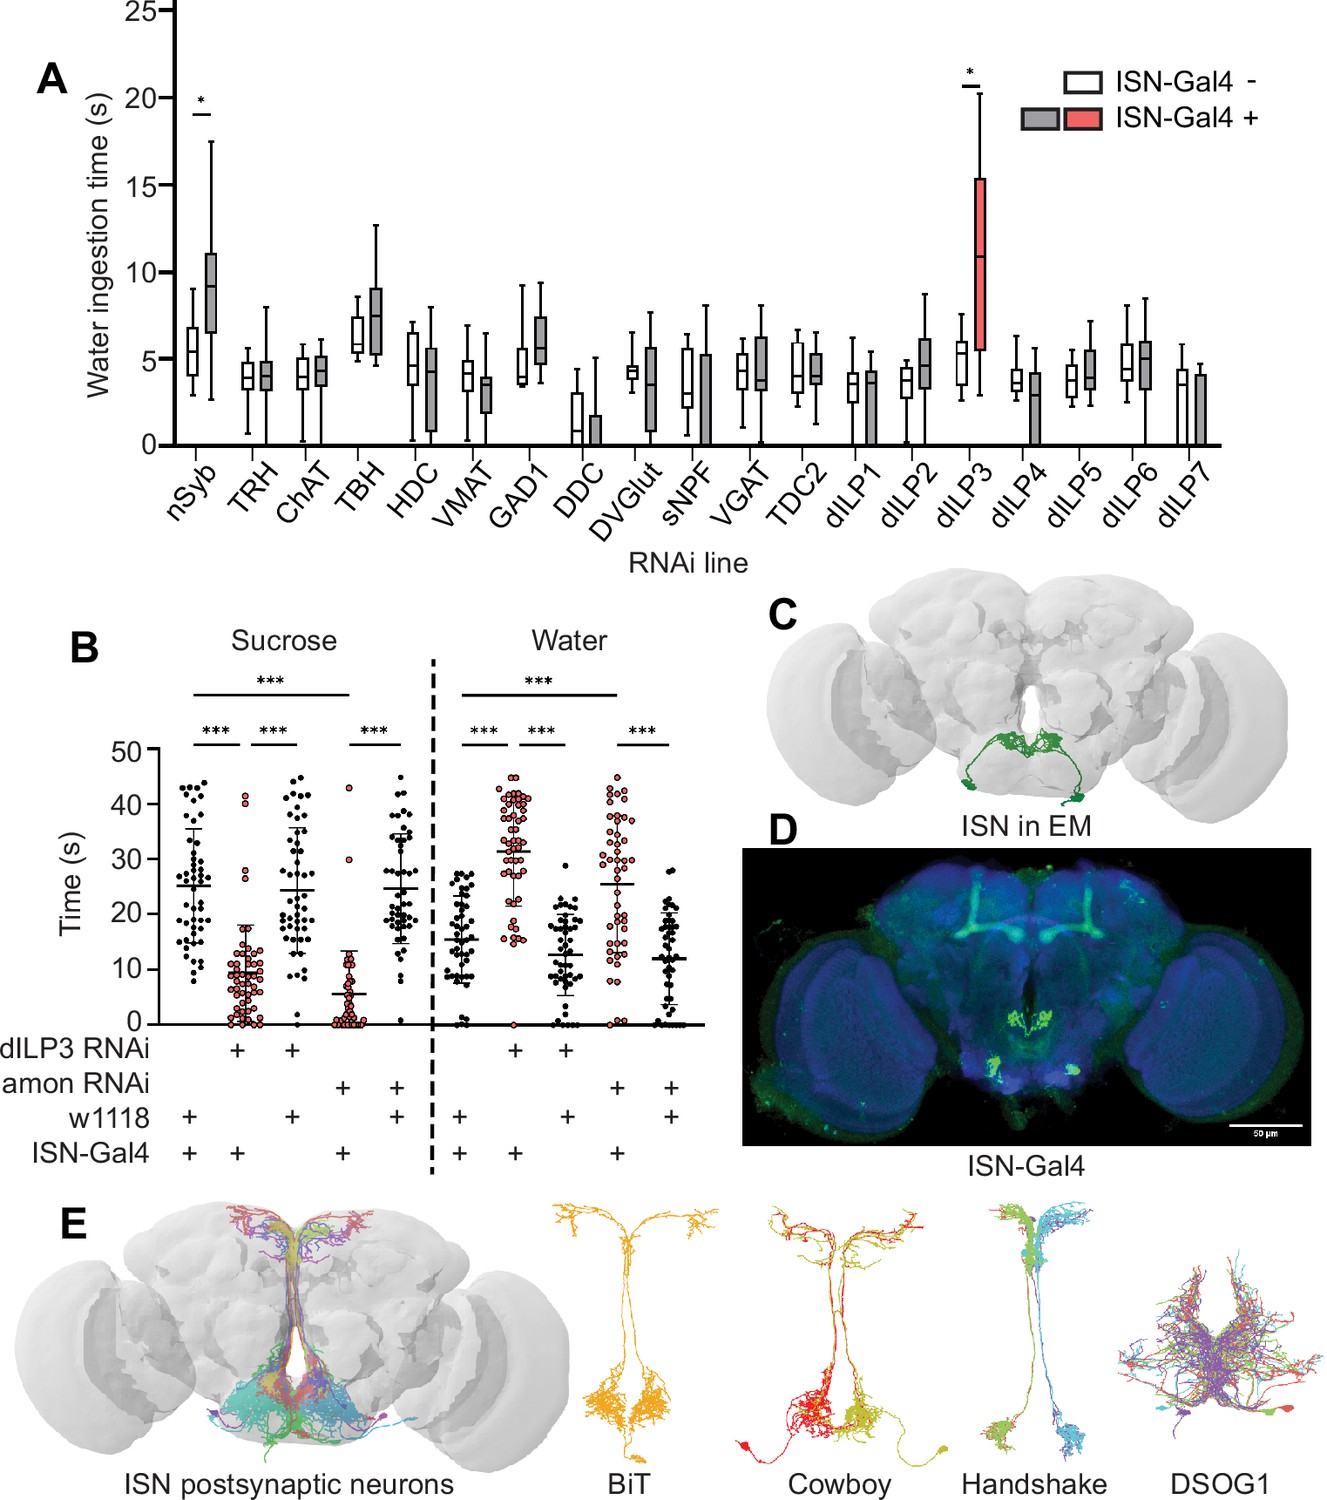
Interoceptive subesophageal zone neurons (ISNs) relay information to the pars intercerebralis.
(A) Temporal consumption assay screen for water ingestion using RNAi targeting different neurotransmitter pathways. UAS-RNAi+ or - ISN-Gal4. RNAi against: nSynaptobrevin (nSyb), tryptophan hydroxylase (TRH), choline acetyltransferase (ChAT), tyrosine beta-hydroxylase (TBH), histamine decarboxylase (HDC), vesicular monoamine transporter (VMAT), glutamic acid decarboxylase 1 (GAD1), dopa decarboxylase (DDC), Drosophila vesicular glutamate transporter (DVGlut), short neuropeptide F (sNPF), vesicular GABA transporter (VGAT), tyrosine decarboxylase 2 (TDC2), Drosophila insulin-like peptide 1 (dILP1), Drosophila insulin-like peptide 2 (dILP2), Drosophila insulin-like peptide 3 (dILP3), Drosophila insulin-like peptide 4 (dILP4), Drosophila insulin-like peptide 5 (dILP5), Drosophila insulin-like peptide 6 (dILP6), Drosophila insulin-like peptide 7 (dILP7). Represented are the mean, and the 10–90 percentile; data was analyzed using Kruskal-Wallis test, followed by multiple comparisons against the RNAi control; p-values were adjusted using false discovery rate. n=8–39 animals/genotype except nSyb positive control (70–72). (B) Temporal consumption assay for 1 M sucrose or water using RNAi targeting dILP3 or amontillado in ISNs. Sucrose assay: Kruskal-Wallis test followed by Dunn’s multiple comparison tests against ISN control and respective RNAi control. Water assay: ANOVA, Šídák’s multiple comparison test to ISN control and respective RNAi control. n=48–52 animals/genotype. (C) ISNs reconstruction from full adult fly brain (FAFB) volume. (D) Light microscopy image of ISN-Gal4 registered to JFRC2010. (E) ISN postsynaptic neurons based on synapse predictions using FAFB volume (Zheng et al., 2018) and connectome annotation versioning engine (CAVE, Buhmann et al., 2021; Ida et al., 2012). Left: 10 postsynaptic neurons, right: postsynaptic neurons bilateral T-shaped neuron (BiT), Cowboy, Handshake, and DSOG1. *p<0.05, ***p<0.001.
-
Figure 1—source data 1
ISN neurotransmitter screen.
- https://cdn.elifesciences.org/articles/88143/elife-88143-fig1-data1-v1.xlsx
Figure 1—figure supplement 1
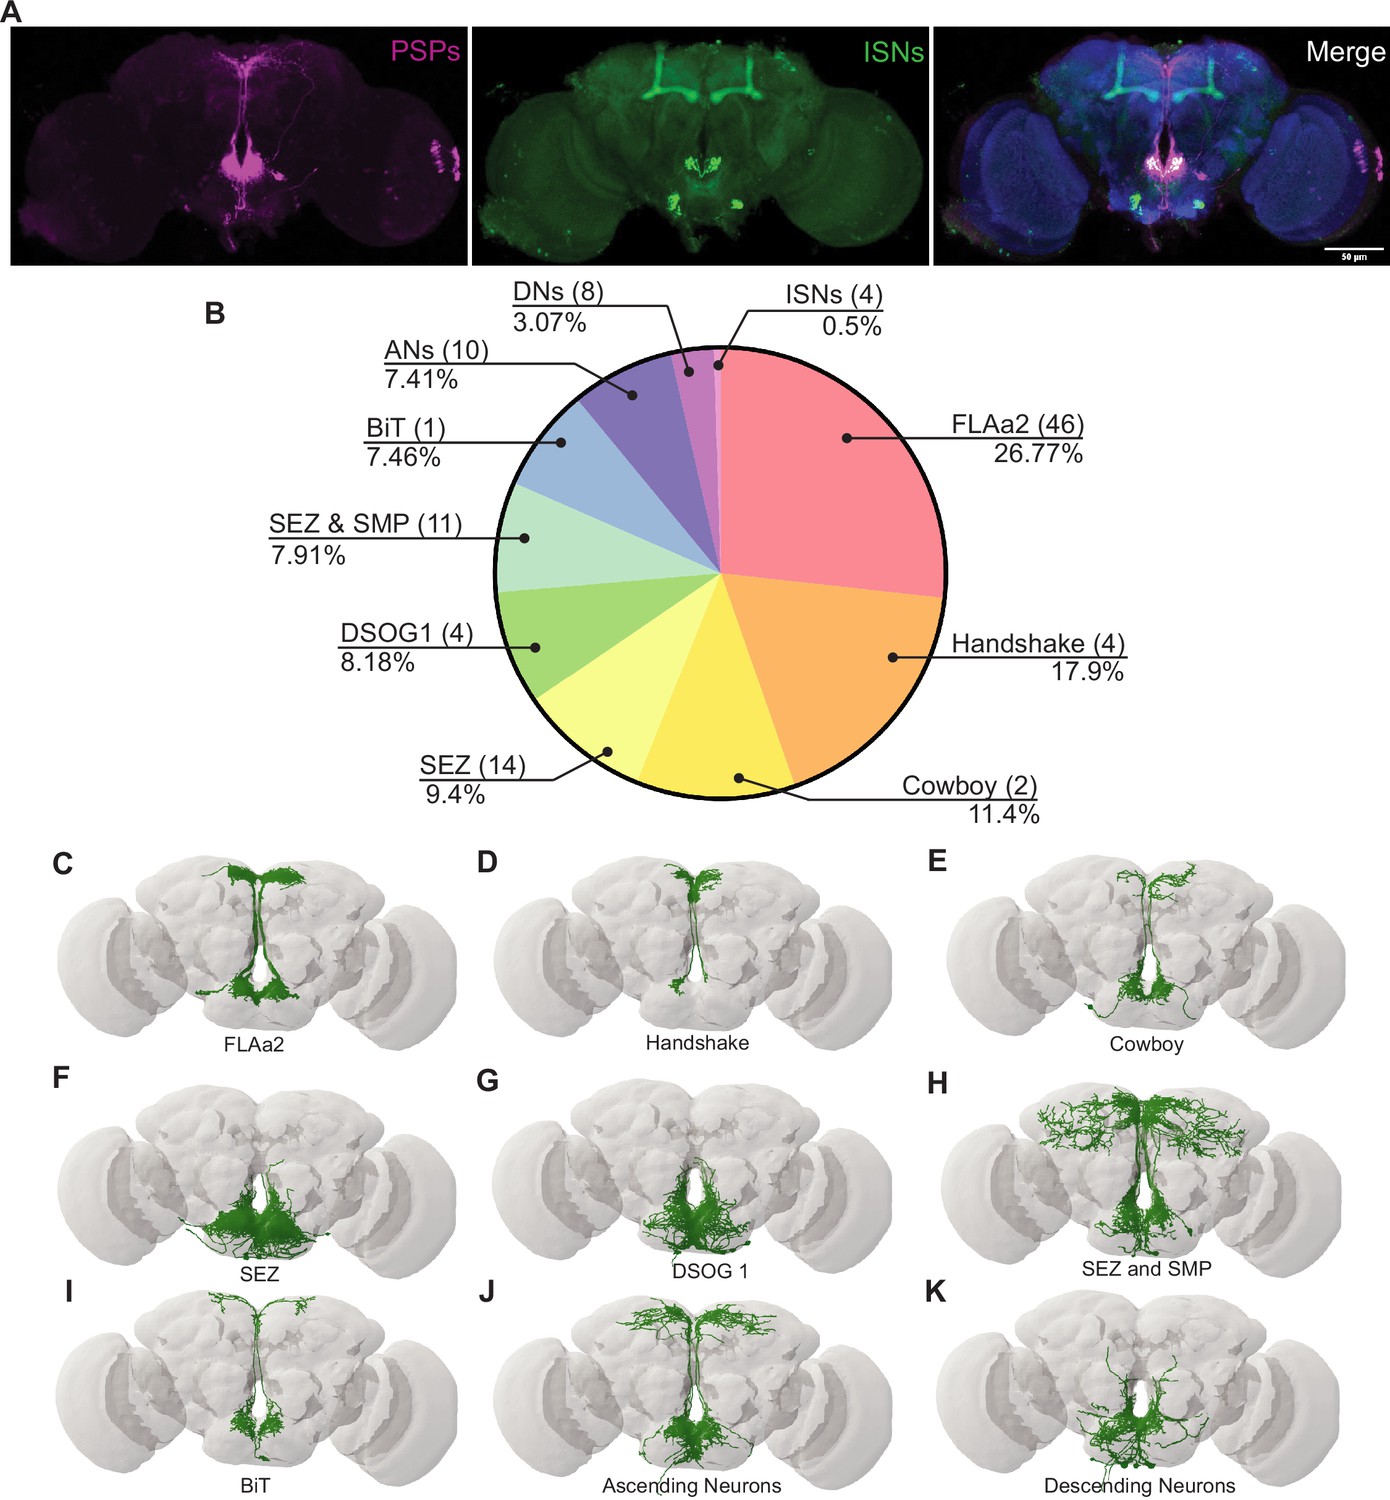
Interoceptive subesophageal zone neuron (ISN) postsynaptic partners labeled by trans-Tango and EM.
(A) Expression of trans-Tango ligand in the ISNs (green) and postsynaptic partners (PSPs) (magenta). nc82 staining in blue. (B) Distribution of synaptic output from the ISNs divided by cell class or brain region. Total of 4050 synapses from the ISNs and 104 postsynaptic partners. FLAa2 (46 neurons) receive 26.77% of all ISN output, Handshake (4 neurons) 17.9%, Cowboy (2 neurons) 11.4%, neurons located in the subesophageal zone (SEZ) (14 neurons) 9.04%, DSOG1 (4 neurons) 8.18%, neurons with neurites in the subesophageal zone and superior medial protocerebrum (SEZ and SMP) (11 neurons) 7.91%, bilateral T-shaped neuron (BiT) (1 neuron) 7.46%, ascending neurons (ANs) (10 neurons) 4.41%, descending neurons (DNs) (8 neurons) 3.07%, and ISNs (4 neurons) 0.5%. Only postsynaptic partners with five or more synapses were considered for this analysis. Reconstruction of FLAa2 neurons (C), Handshake neurons (D), Cowboy neurons (E), neurons innervating the SEZ (F), DSOG1 neurons (G), neurons innervating the SEZ and SMP (H), BiT (I), ascending neurons (J), descending neurons (K).
Figure 2 with 2 supplements
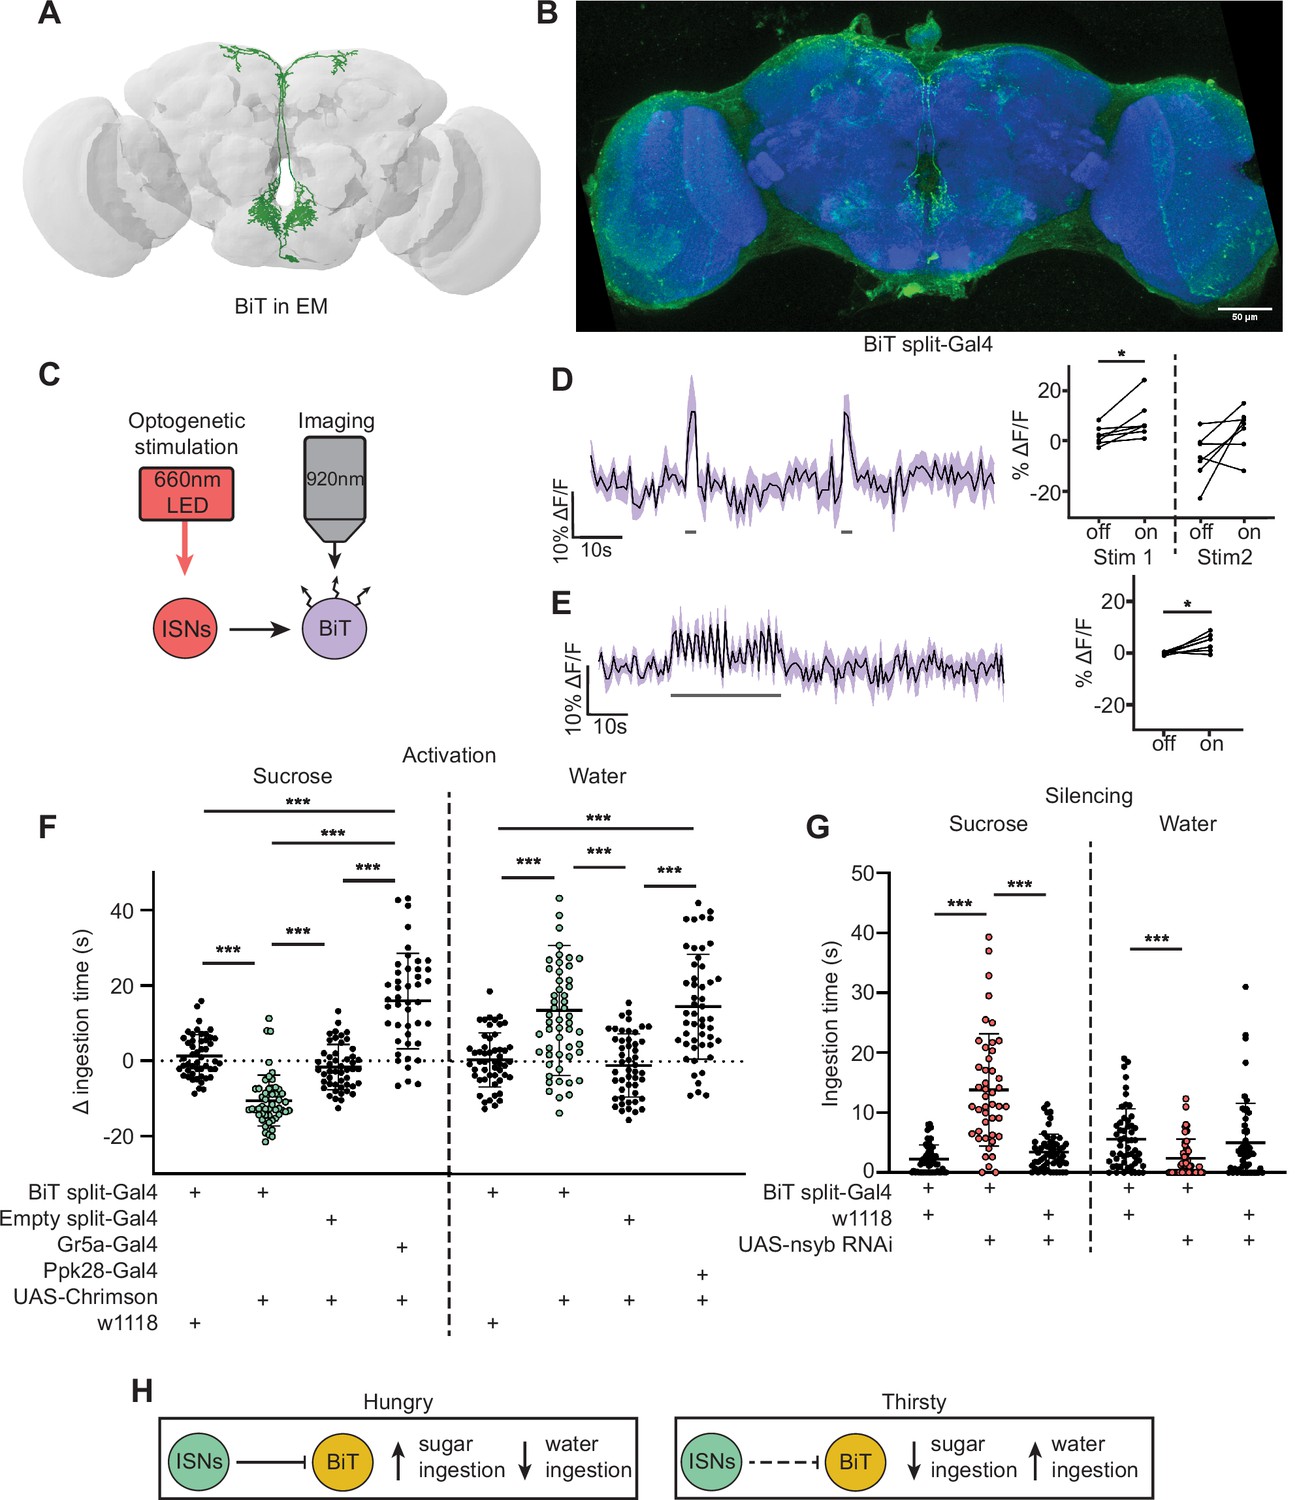
Interoceptive subesophageal zone neurons (ISNs) inhibit bilateral T-shaped neuron (BiT), which oppositely regulates sugar and water ingestion.
(A) BiT neuron reconstruction from full adult fly brain (FAFB) dataset. (B) Light microscopy image of BiT split-Gal4. (C) Experimental setup for in vivo voltage imaging. We expressed the light-sensitive ion channel Chrimson in the ISNs and optogenetically stimulated them with 660 nm LED. We expressed the voltage sensor ArcLight in BiT and imaged it with a two-photon microscope. (D) ArcLight response of BiT soma to 2 s optogenetic stimulation of the ISNs or (E) 30 s optogenetic stimulation of the ISNs. Left: Scatter plot shows mean ± SEM of all flies imaged, gray bars represent LED stimulation. Right: Quantification of mean fluorescence intensity before stim (off) and during stim (on), each dot represents one fly. Paired Wilcoxon and paired t-test (Stim 2, p=0.07). n=7 flies. (F) Temporal consumption assay for 1 M sucrose or water during acute optogenetic activation of BiT with Chrimson. Ingestion time of females exposed to light normalized to dark controls of indicated genotype. Sucrose: Kruskal-Wallis test with Dunn’s multiple comparison test. Water: One-way ANOVA with Holm-Šídák multiple comparison test. n=44–54 animals/genotype. (G) Temporal consumption assay for 1 M sucrose or water using RNAi targeting nSyb in BiT. Kruskal-Wallis with Dunn’s multiple comparison test. n=45–57 animals/genotype. (H) Neural model for BiT coordination of sucrose and water intake. Dashed lines indicate inactive synapses. *p<0.05, ***p<0.001.
-
Figure 2—source data 1
BiT functional imaging.
- https://cdn.elifesciences.org/articles/88143/elife-88143-fig2-data1-v1.xlsx
Figure 2—figure supplement 1
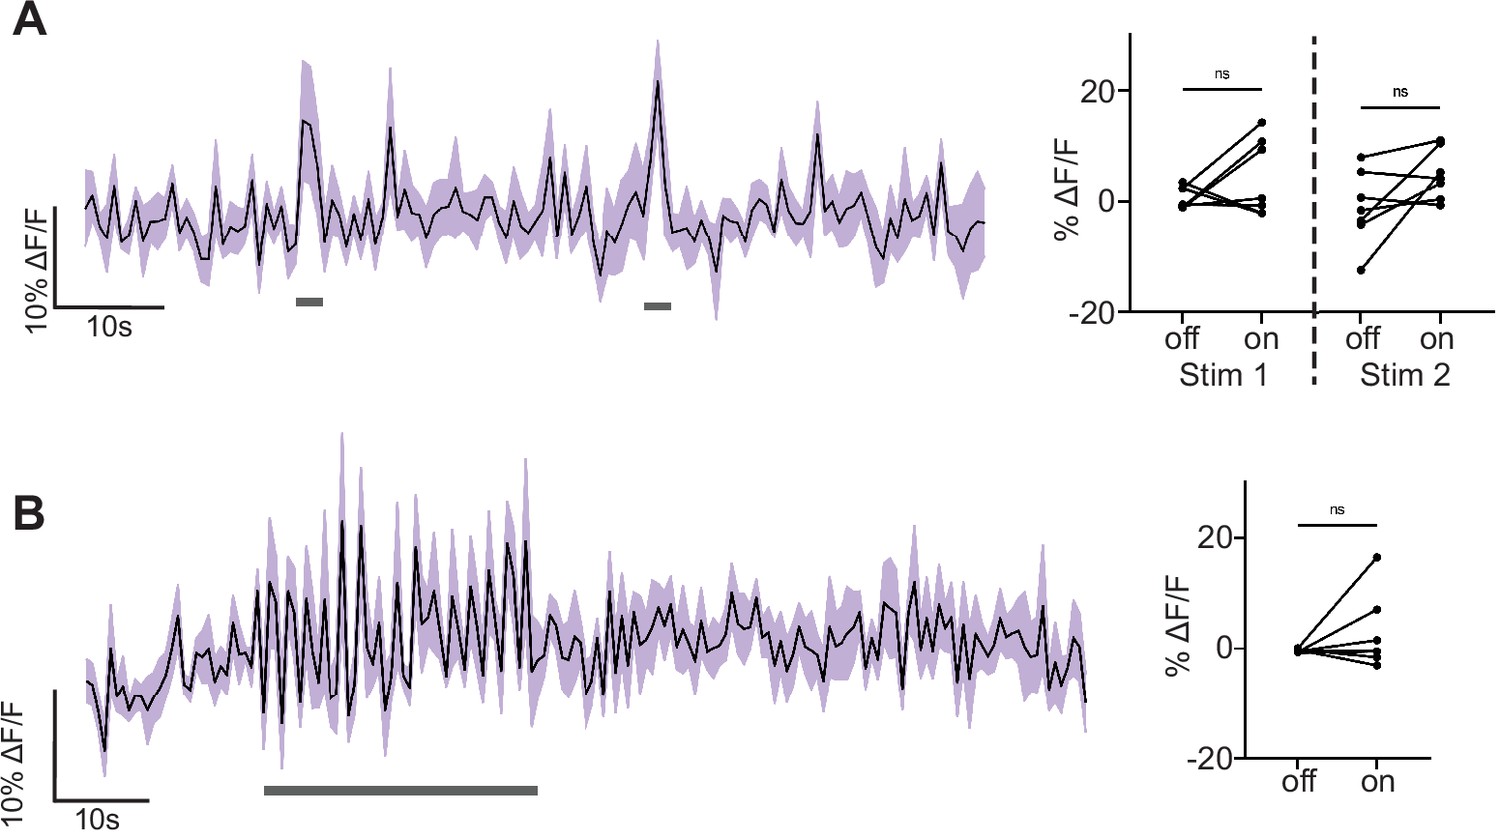
Bilateral T-shaped neuron (BiT) genetic control functional imaging.
Genetic controls: we expressed the light-sensitive ion channel Chrimson without the interoceptive subesophageal zone neuron (ISN)-LexA driver and exposed the brains to 660 nm LED. We expressed the voltage sensor ArcLight in BiT and imaged it with a two-photon microscope. (A) ArcLight response of BiT soma to 2 s LED exposure or (B) 30 s LED exposure. Left: Scatter plot shows mean ± SEM of all flies imaged, gray bars represent LED stimulation. Right: Quantification of mean fluorescence intensity before stim (off) and during stim (on), each dot represents one fly. Paired Wilcoxon or paired t-test. n=7 flies.
Figure 2—figure supplement 2
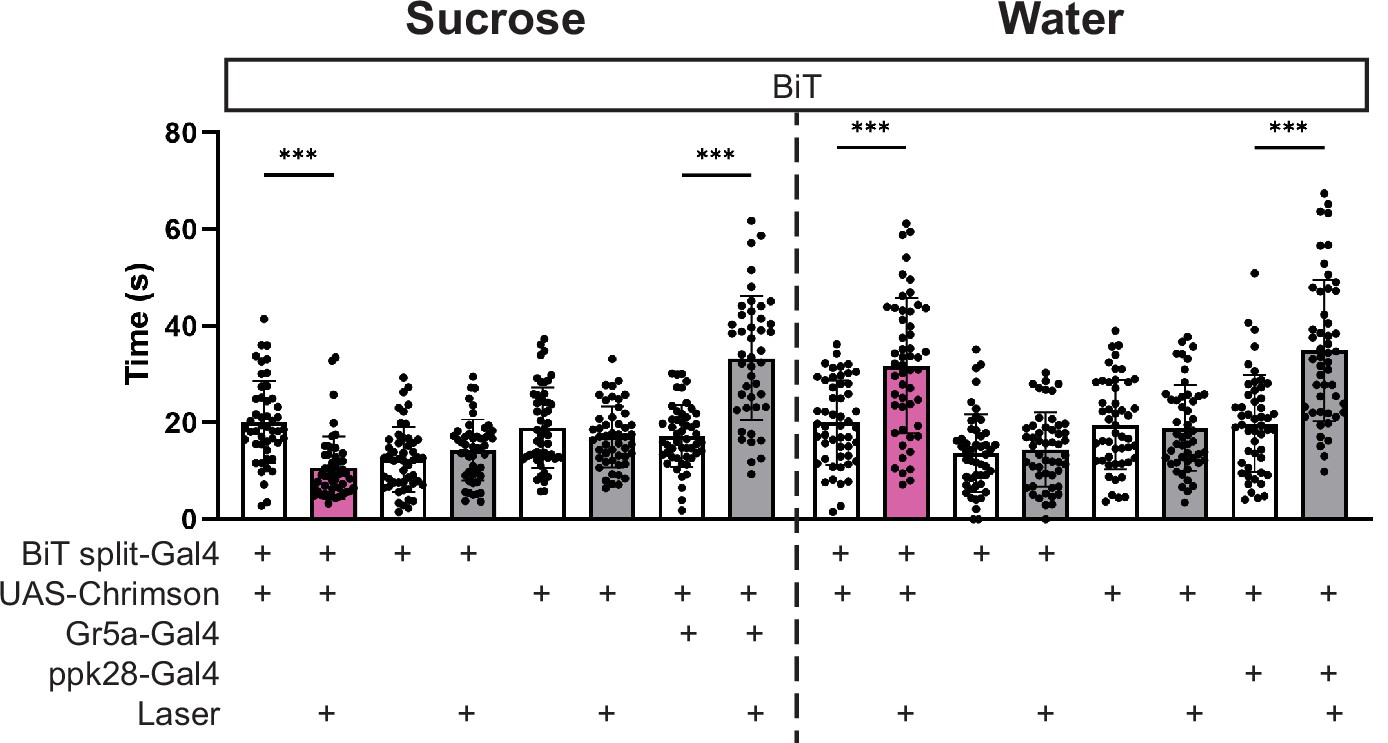
Bilateral T-shaped neuron (BiT) optogenetic activation ingestion phenotype.
Temporal consumption assay for 1 M sucrose or water during acute optogenetic activation of BiT with Chrimson. Represented are the mean, and the 10–90 percentile. Data was analyzed using Kruskal-Wallis test, followed by multiple comparisons against the no laser control. n=44–54 animals/genotype. ***p<0.001.
Figure 3 with 2 supplements
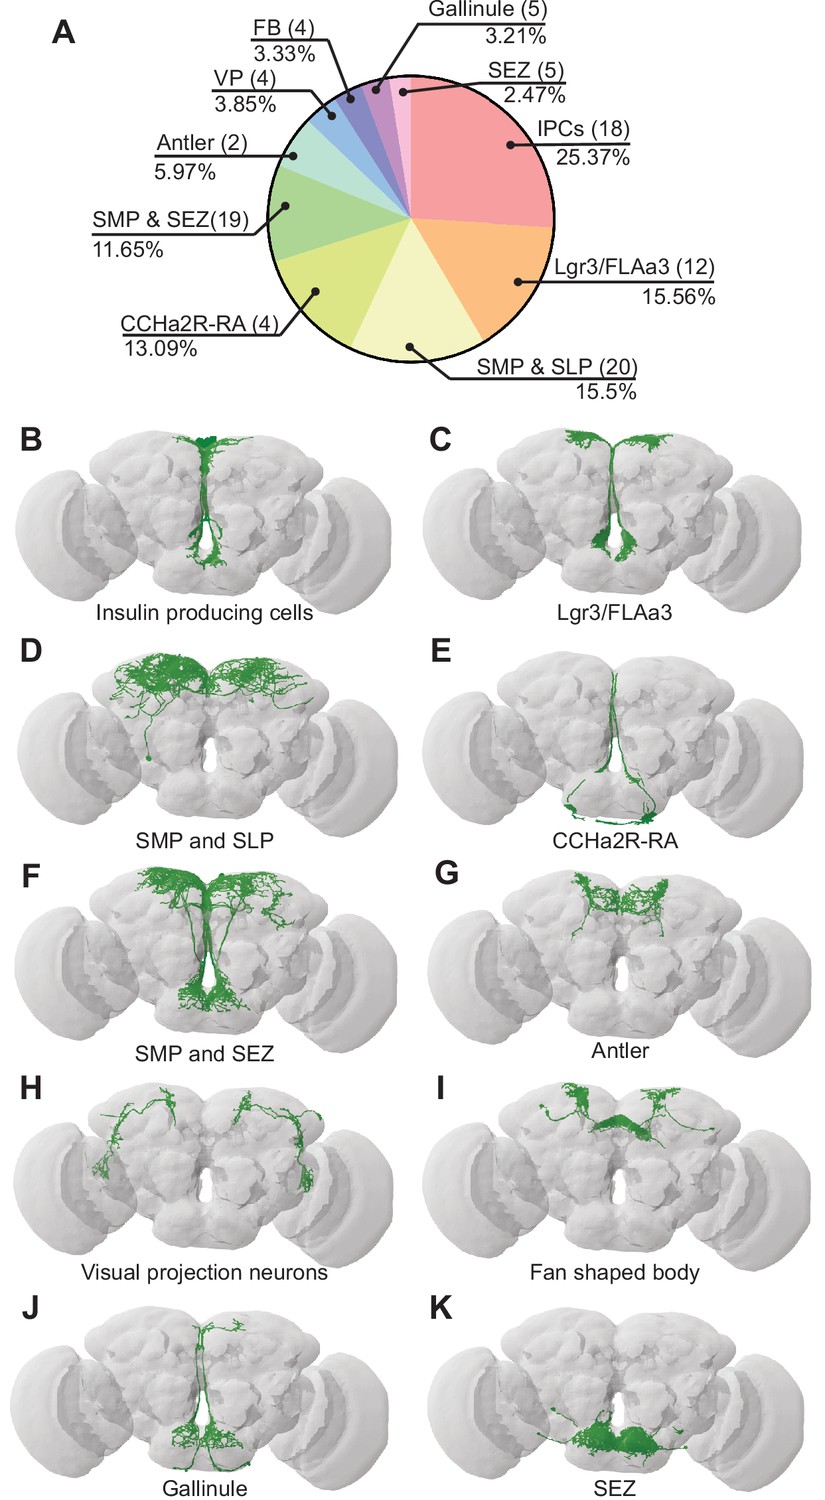
Bilateral T-shaped neuron (BiT) postsynaptic neurons include neuroendocrine cells.
(A) Distribution of synaptic output from BiT divided by cell class or brain region. Total of 1742 synapses from BiT and 93 postsynaptic partners. Insulin producing cells (IPCs) (18 neurons) receive 25.37% of all BiT output, Lgr3/FLAa3 (12 neurons) 15.56%, superior medial protocerebrum (SMP) and superior lateral protocerebrum (SLP) (20 neurons) 15.5%, CCHamide-2 receptor isoform RA (CCHa2R-RA) (4 neurons) 13.09%, SMP and subesophageal zone (SEZ) (19 neurons) 11.65%, Antler (2 neurons) 5.97%, visual projections (4 neurons) 3.85%, fan shaped body (4 neurons) 3.33%, Gallinule (5 neurons) 3.21%, SEZ (5 neurons) 2.47%. Only postsynaptic partners with five or more synapses were considered for this analysis. Reconstruction of IPCs (B), Lgr3/FLAa3 neurons (C), neurons innervating the SMP and SLP (D), CCHa2R-RA neurons (E), neurons innervating the SMP and SEZ (F), Antler neurons (G), visual projection neurons (H), neurons innervating the fan shaped body (I), Gallinule neurons (J), and neurons innervating the SEZ (K).
-
Figure 3—source data 1
IPCs functional imaging.
- https://cdn.elifesciences.org/articles/88143/elife-88143-fig3-data1-v1.xlsx
Figure 3—figure supplement 1
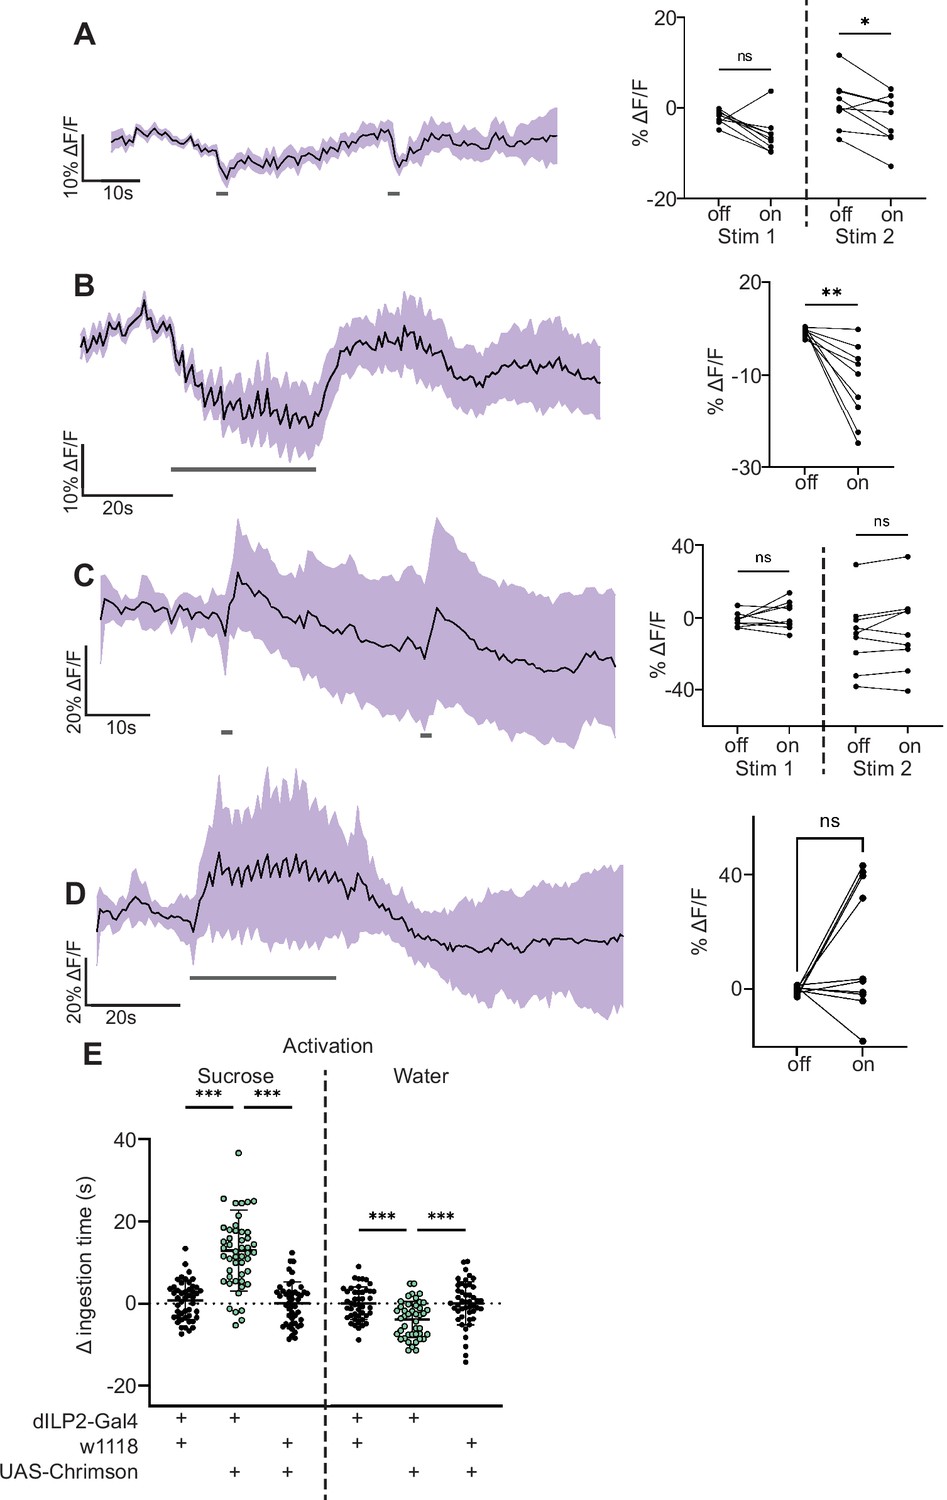
Insulin producing cell (IPC) response to bilateral T-shaped neuron (BiT) stimulation.
(A and B): We expressed the light-sensitive ion channel Chrimson in BiT and optogenetically stimulated it with 660nm LED. We expressed the calcium sensor GCaMP in the IPCs and imaged them with a two-photon microscope. (A) Calcium response of IPC somas to 2 s optogenetic activation of BiT or (B) 30 s optogenetic activation of BiT. Left: Scatter plot shows mean ± SEM of all flies imaged, gray bars represent LED stimulation. Right: Quantification of mean fluorescence intensity before stim (off) and during stim (on), each dot represents one fly. Paired Wilcoxon test or paired t-test. n=9 flies. (C and D) Genetic controls: we expressed the light-sensitive ion channel Chrimson without the BiT-split Gal4 driver and exposed the brains to 660 nm LED. We expressed the calcium sensor GCaMP in the IPCs and imaged them with a two-photon microscope. (C) Calcium response of IPC somas to 2 s LED exposure or (D) 30 s LED exposure. Left: Scatter plot shows mean ± SEM of all flies imaged, gray bars represent LED stimulation. Right: Quantification of mean fluorescence intensity before stim (off) and during stim (on), each dot represents one fly. Paired t-test. n=9–10 flies. (E) Temporal consumption assay for 1 M sucrose or water during acute optogenetic activation of IPCs with Chrimson. Ingestion time of females exposed to light normalized to dark controls of indicated genotype. One-way ANOVA with Holm-Šídák multiple comparison test. n=43–49 animals/genotype. *p<0.05, **p<0.01, ***p<0.001.
Figure 3—figure supplement 2
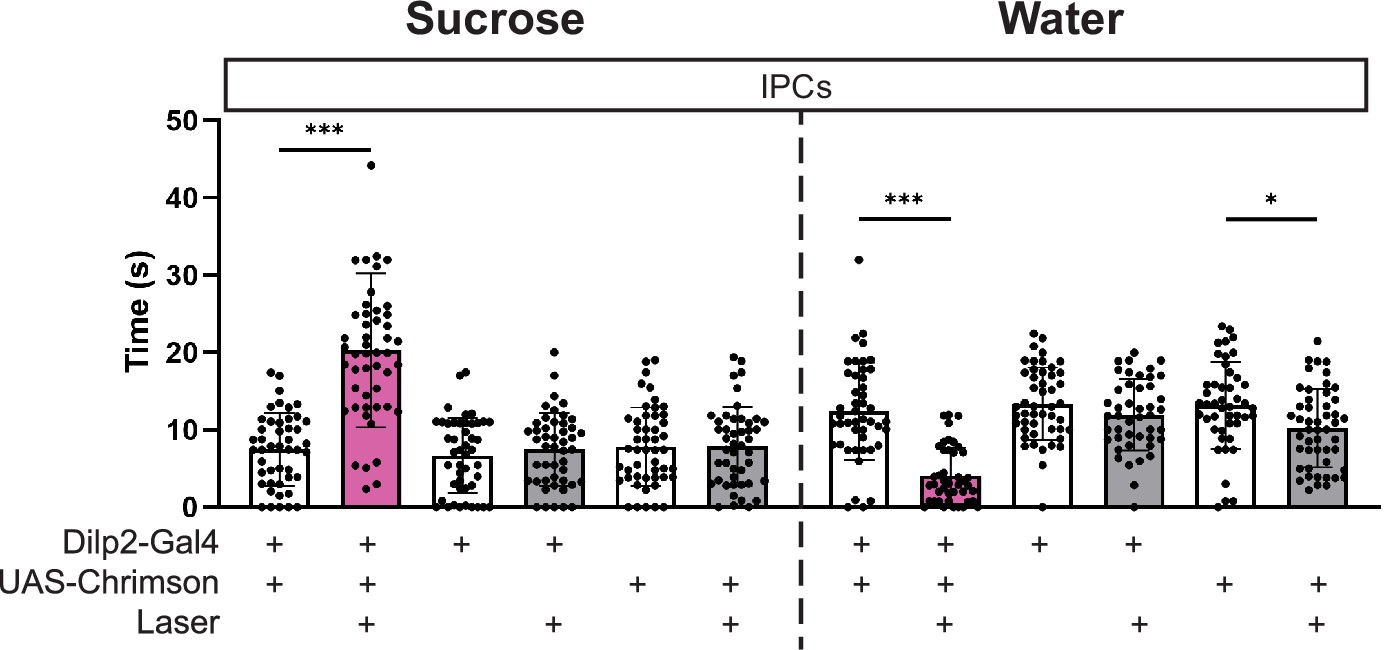
Insulin producing cell (IPC) optogenetic activation ingestion phenotype.
Temporal consumption assay for 1 M sucrose or water during acute optogenetic activation of IPCs with Chrimson.Represented are the mean, and the 10–90 percentile. Data was analyzed using one-way ANOVA, followed by multiple comparisons against the no laser control. n=43–49 animals/genotype. *p<0.05, ***p<0.001.
Figure 4 with 2 supplements
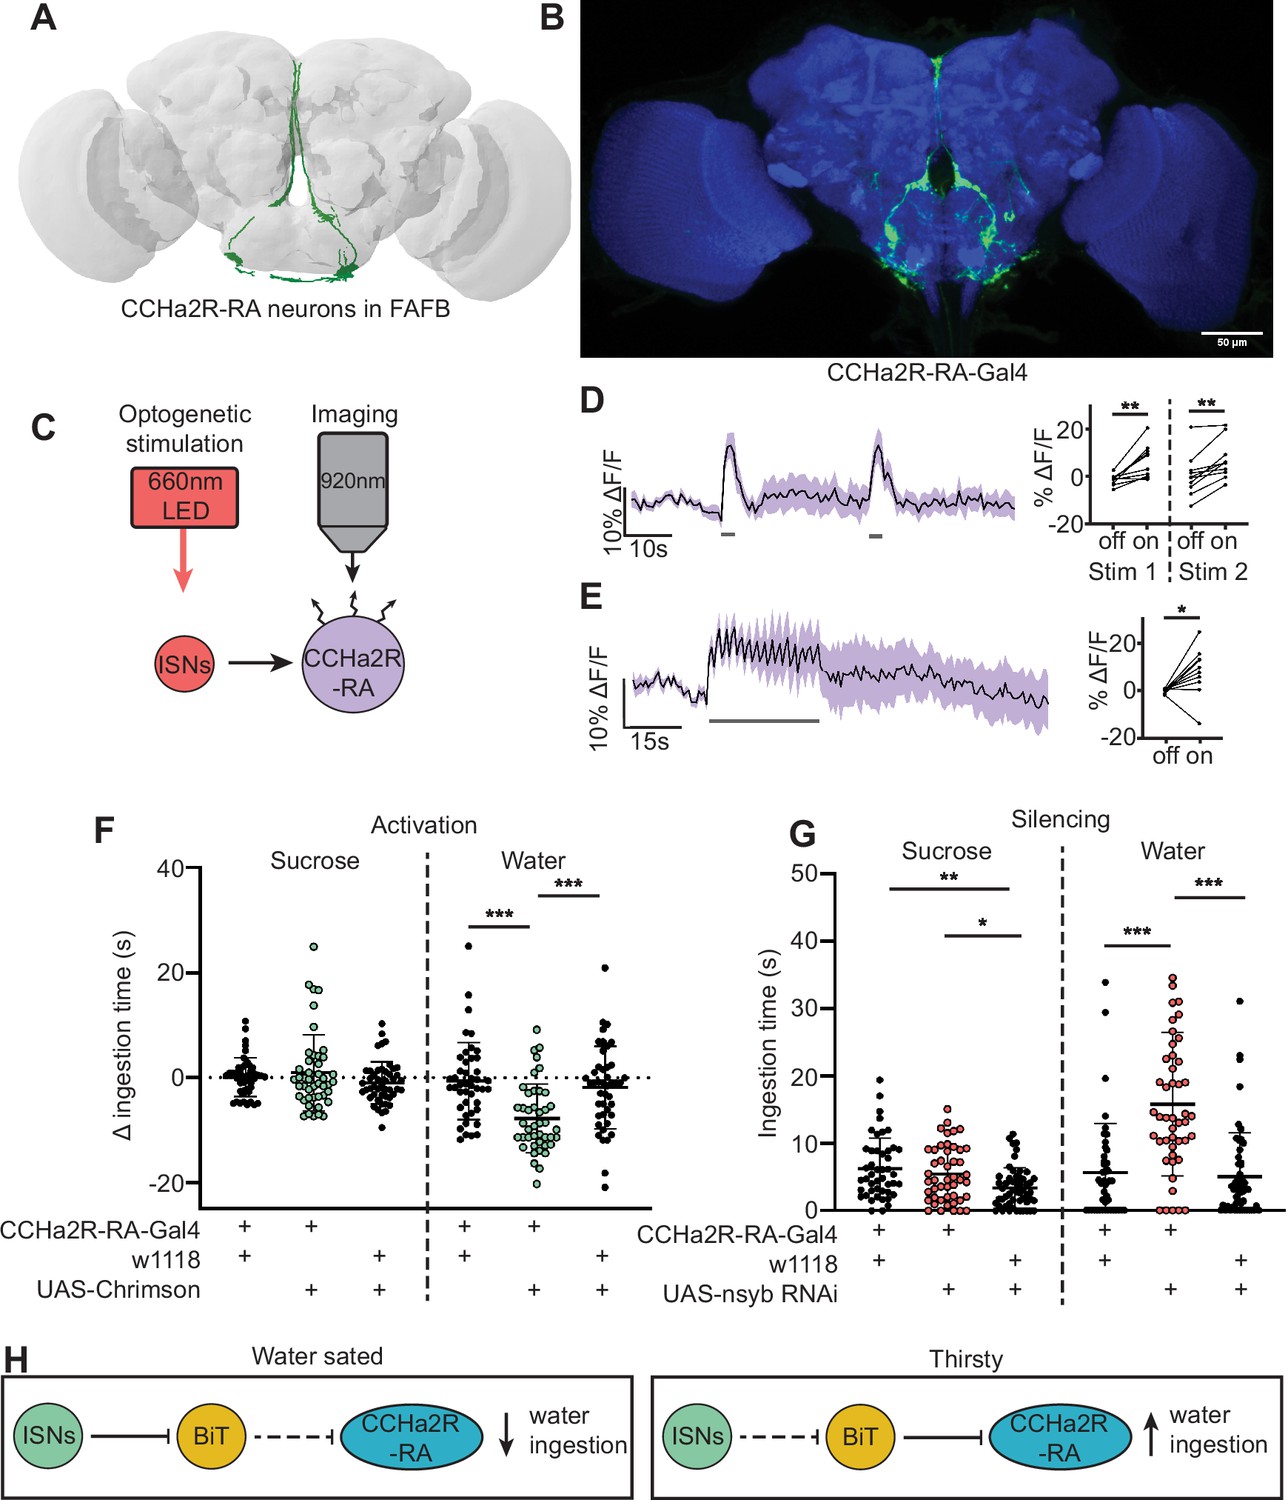
CCHamide-2 receptor isoform RA (CCHa2R-RA) neurons regulate water but not sugar ingestion and are likely inhibited by bilateral T-shaped neuron (BiT).
(A) CCHa2R-RA neurons reconstruction from full adult fly brain (FAFB) dataset. (B) Light microscopy image of CCHa2R-RA-Gal4. (C) Experimental setup for in vivo calcium imaging. We expressed the light-sensitive ion channel Chrimson in the interoceptive subesophageal zone neurons (ISNs) and optogenetically stimulated them with 660 nm LED. We expressed the calcium sensor GCaMP in the CCHa2R-RA neurons and imaged them with a two-photon microscope. (D) Calcium responses of CCHa2R-RA neurites in subesophageal zone (SEZ) to 2 s optogenetic stimulation of the ISNs or (E) 30 s optogenetic stimulation of the ISNs. Left: Scatter plot shows mean ± SEM of all flies imaged, gray bars represent LED stimulation. Right: Quantification of mean fluorescence intensity before stim (off) and during stim (on), each dot represents one fly. Paired t-test and paired Wilcoxon test. n=10 flies. (F) Temporal consumption assay for 1 M sucrose or water during acute optogenetic activation of CCHa2R-RA neurons with Chrimson. Ingestion time of females exposed to light normalized to dark controls of indicated genotype. Sucrose: Kruskal-Wallis with Dunn’s multiple comparison test. Water: One-way ANOVA with Holm-Šídák multiple comparison test. n=42–47 animals/genotype. (G) Temporal consumption assay for 1 M sucrose or water using RNAi targeting nSynaptobrevin (nSyb) in CCHa2R-RA neurons. Kruskal-Wallis with Dunn’s multiple comparison test. n=45–54 animals/genotype. (H) Neural model for CCHa2R-RA regulation of water intake. Dashed lines indicate inactive synapses. *p<0.05, **p<0.01, ***p<0.001.
-
Figure 4—source data 1
CCha2R-RA functional imaging.
- https://cdn.elifesciences.org/articles/88143/elife-88143-fig4-data1-v1.xlsx
Figure 4—figure supplement 1
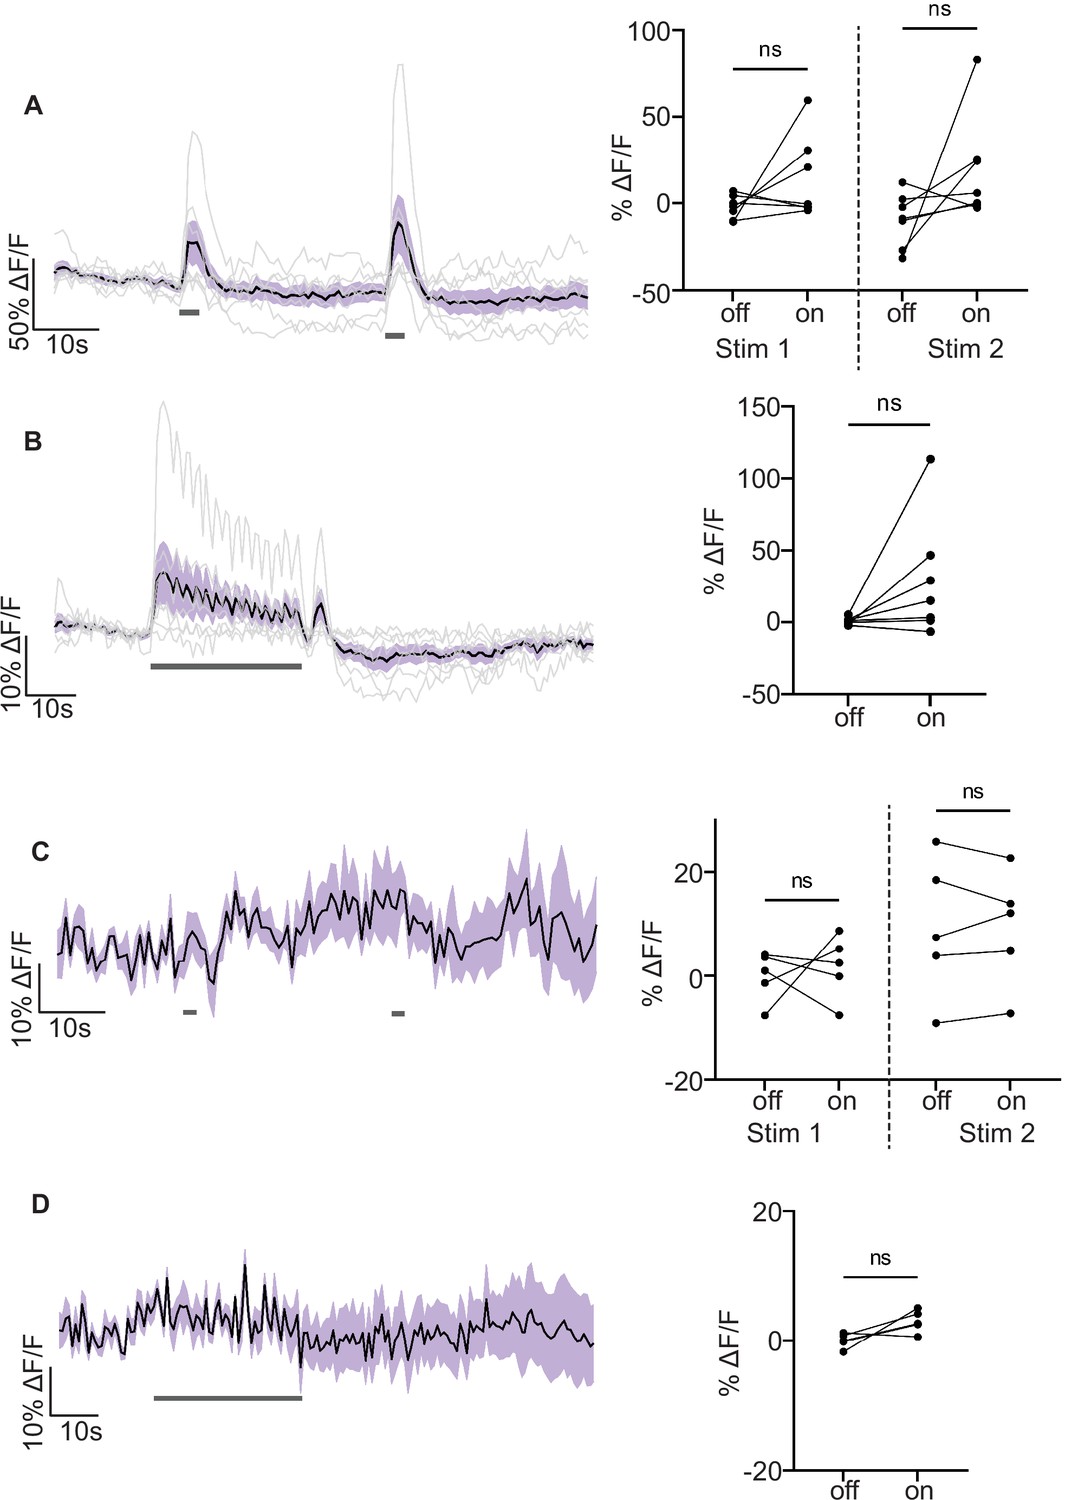
CCHamide-2 receptor isoform RA (CCHa2R-RA) genetic controls functional imaging and response to bilateral T-shaped neuron (BiT) optogenetic stimulation.
(A and B): Genetic controls: we expressed the light-sensitive ion channel Chrimson without the interoceptive subesophageal zone neuron (ISN)-LexA driver and exposed the brains to 660nm LED. We expressed the calcium sensor GCaMP in the CCHa2R-RA neurons and imaged them with a two-photon microscope. (A) Calcium response of CCHa2R-RA subesophageal zone (SEZ) neurites to 2 s LED exposure or (B) 30 s LED exposure. Left: Scatter plot shows mean ± SEM of all flies imaged, with individual traces in gray, gray bars represent LED stimulation. Right: Quantification of mean fluorescence intensity before stim (off) and during stim (on), each dot represents one fly. Paired Wilcoxon test and paired t-test. n=7 flies. (C and D) We expressed the light-sensitive ion channel Chrimson in BiT and optogenetically stimulated it with 660 nm LED. We expressed the calcium sensor GCaMP in the CCHa2R-RA neurons and imaged them with a two-photon microscope. (C) Calcium response of CCHa2R-RA somas to 2 s optogenetic stimulation of BiT or (D) 30 s optogenetic stimulation of BiT. Left: Scatter plot shows mean ± SEM of all flies imaged, gray bars represent LED stimulation. Right: Quantification of mean fluorescence intensity before stim (off) and during stim (on), each dot represents one fly. Paired t-test. n=5 flies.
Figure 4—figure supplement 2
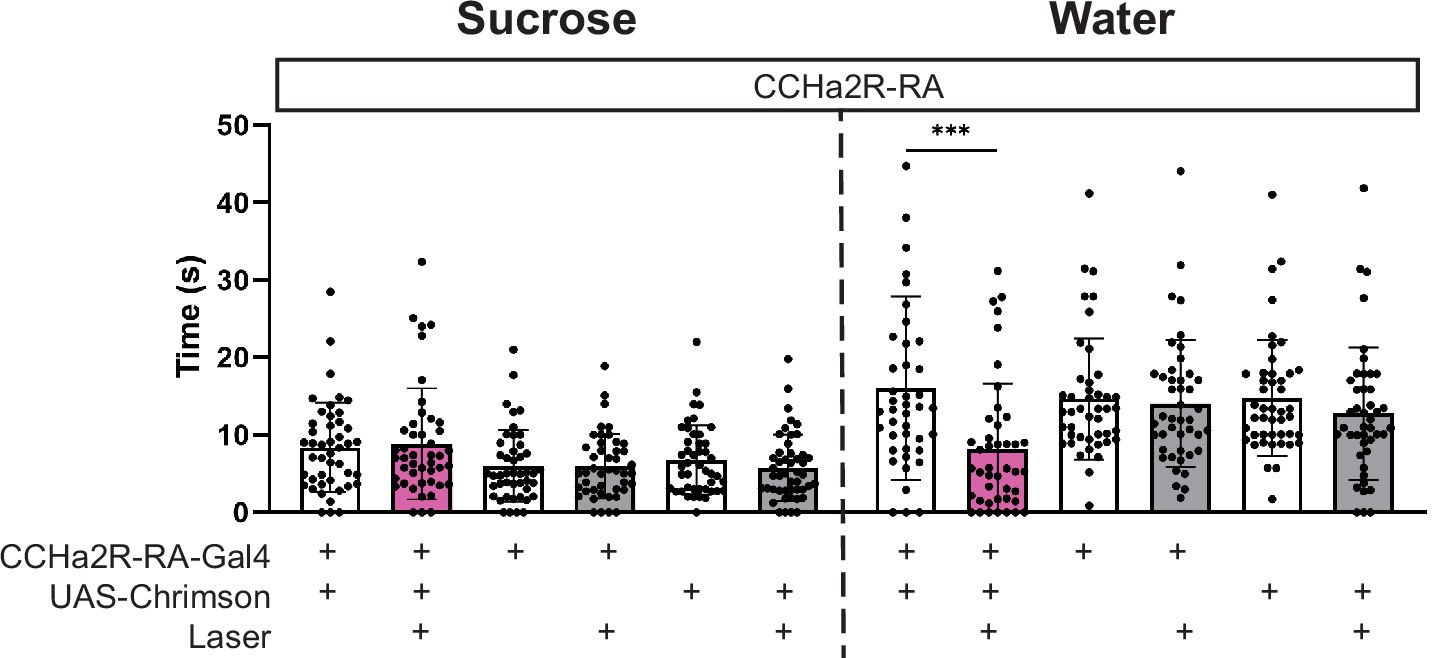
CCHamide-2 receptor isoform RA (CCHa2R-RA) optogenetic activation ingestion phenotype.
Temporal consumption assay for 1 M sucrose or water during acute optogenetic activation of CCHa2R-RA neurons with Chrimson. Represented are the mean, and the 10–90 percentile. Data was analyzed using Kruskal-Wallis test, followed by multiple comparisons against the no laser control. n=42–47 animals/genotype. ***p<0.001.
Figure 5 with 2 supplements
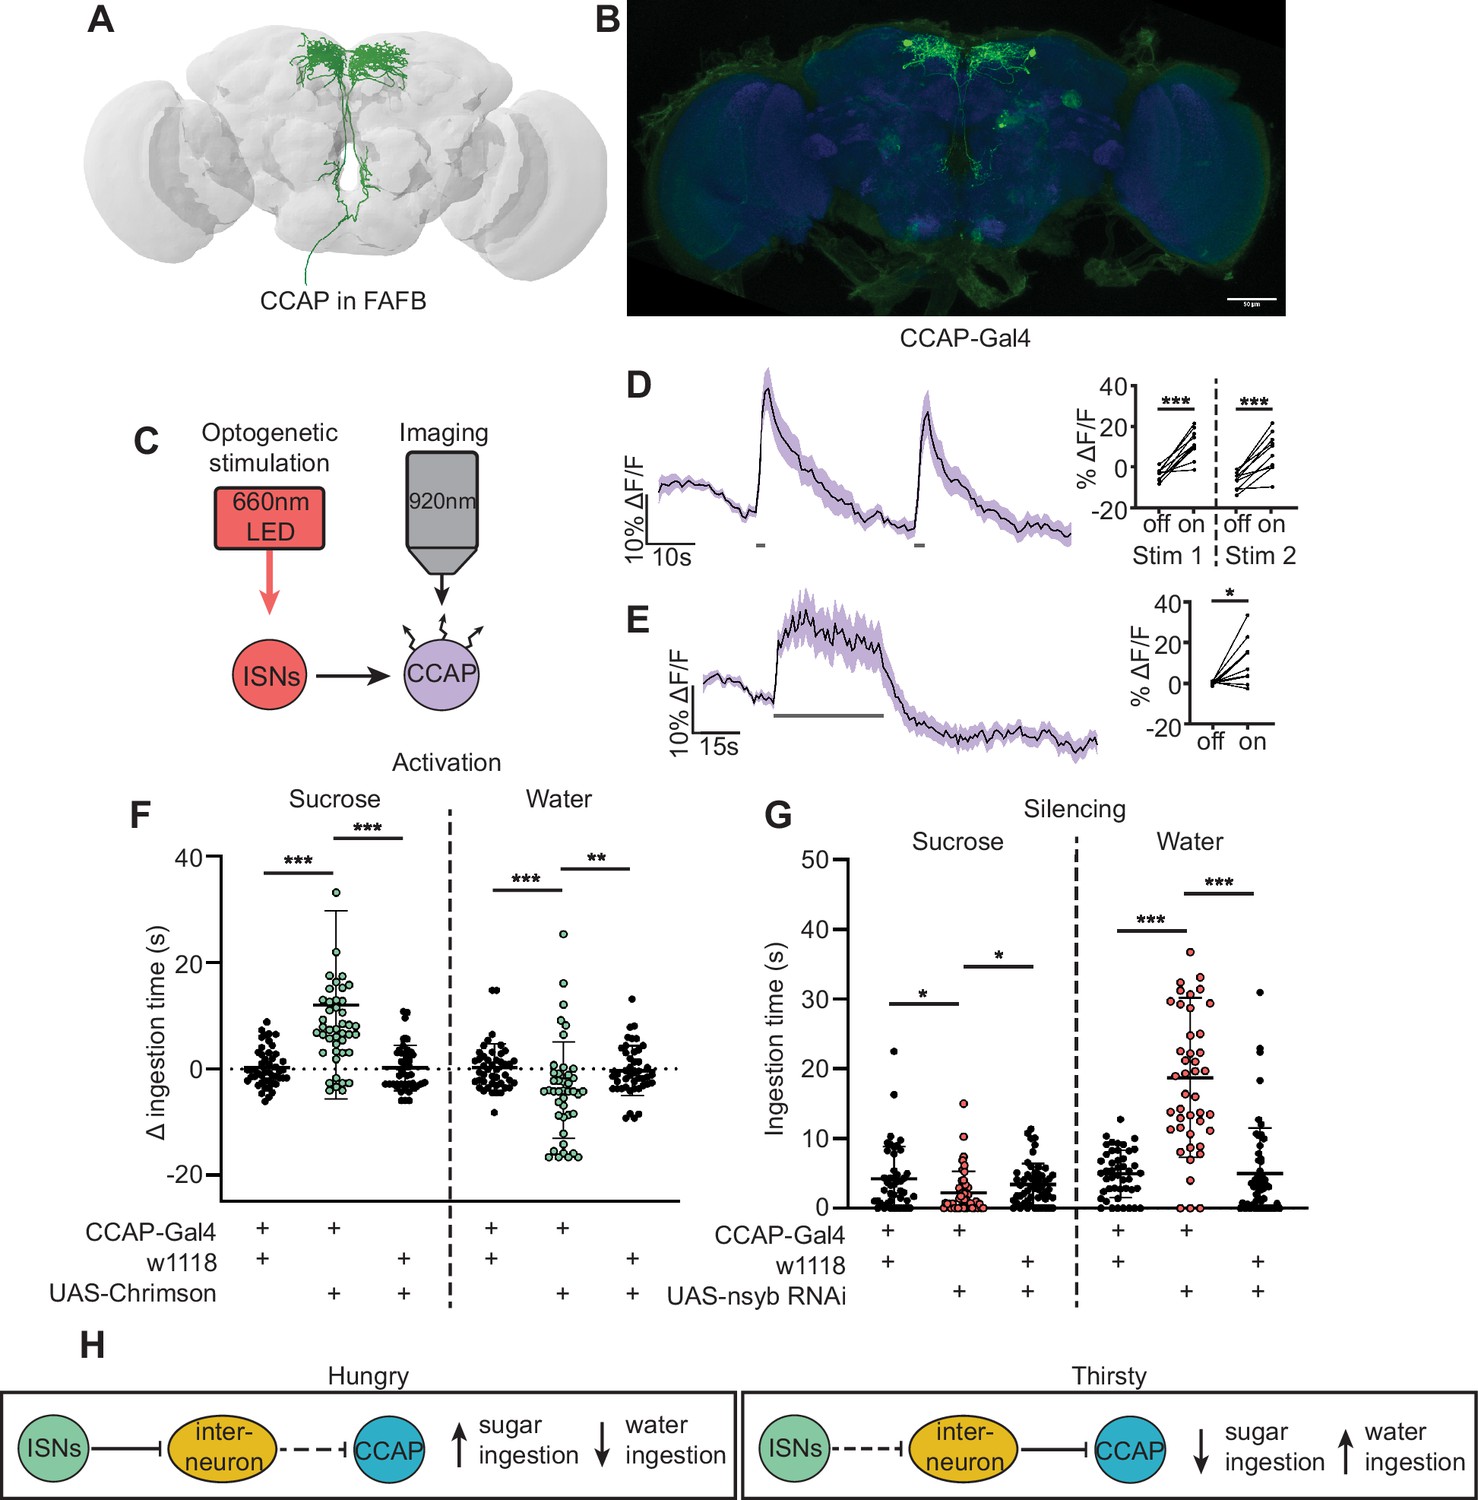
Crustacean cardioactive peptide (CCAP) neurons are downstream of the interoceptive subesophageal zone neurons (ISNs) and oppositely regulate sugar and water ingestion.
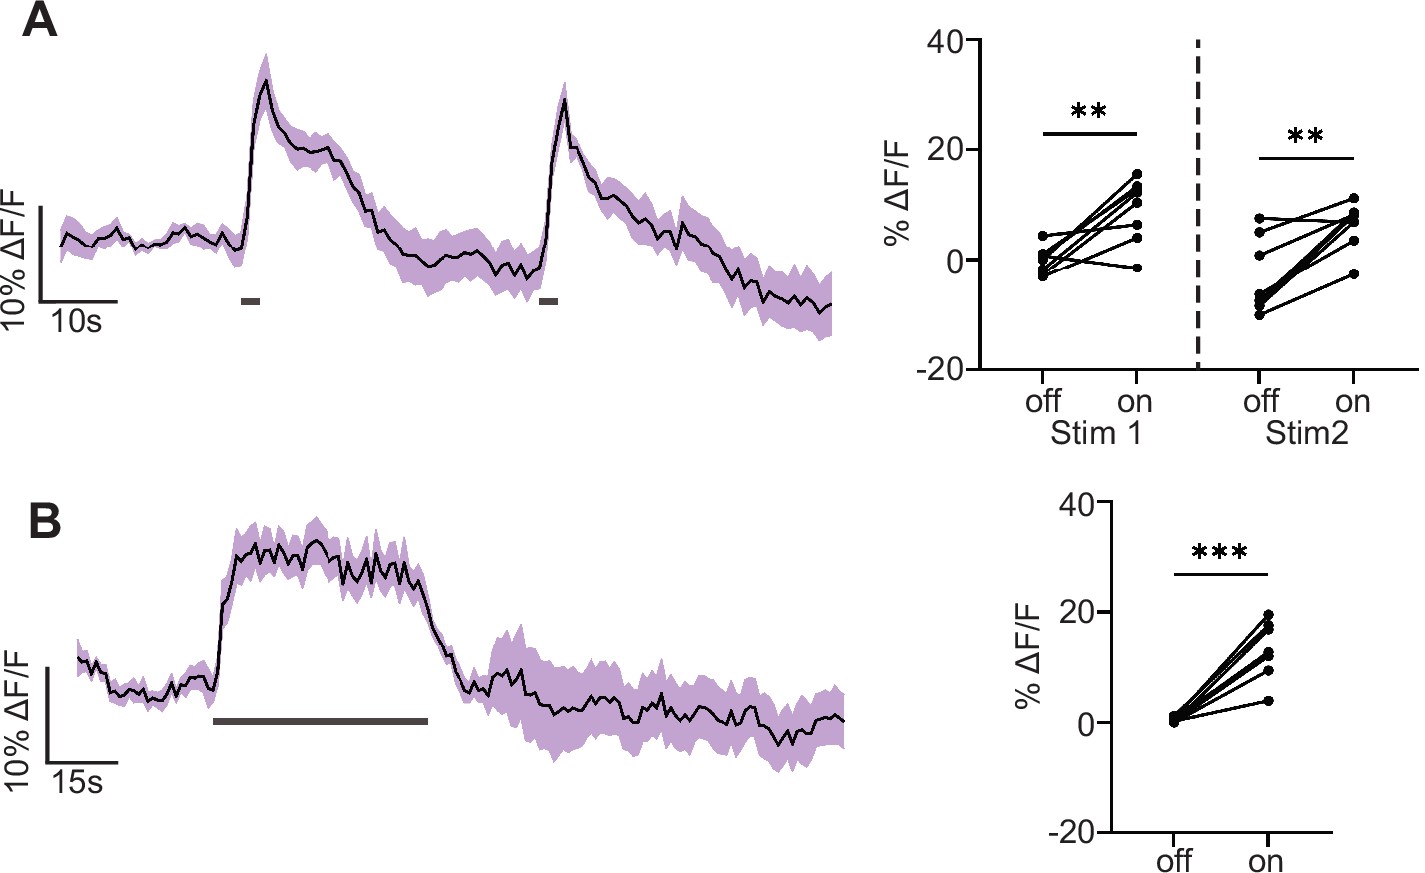
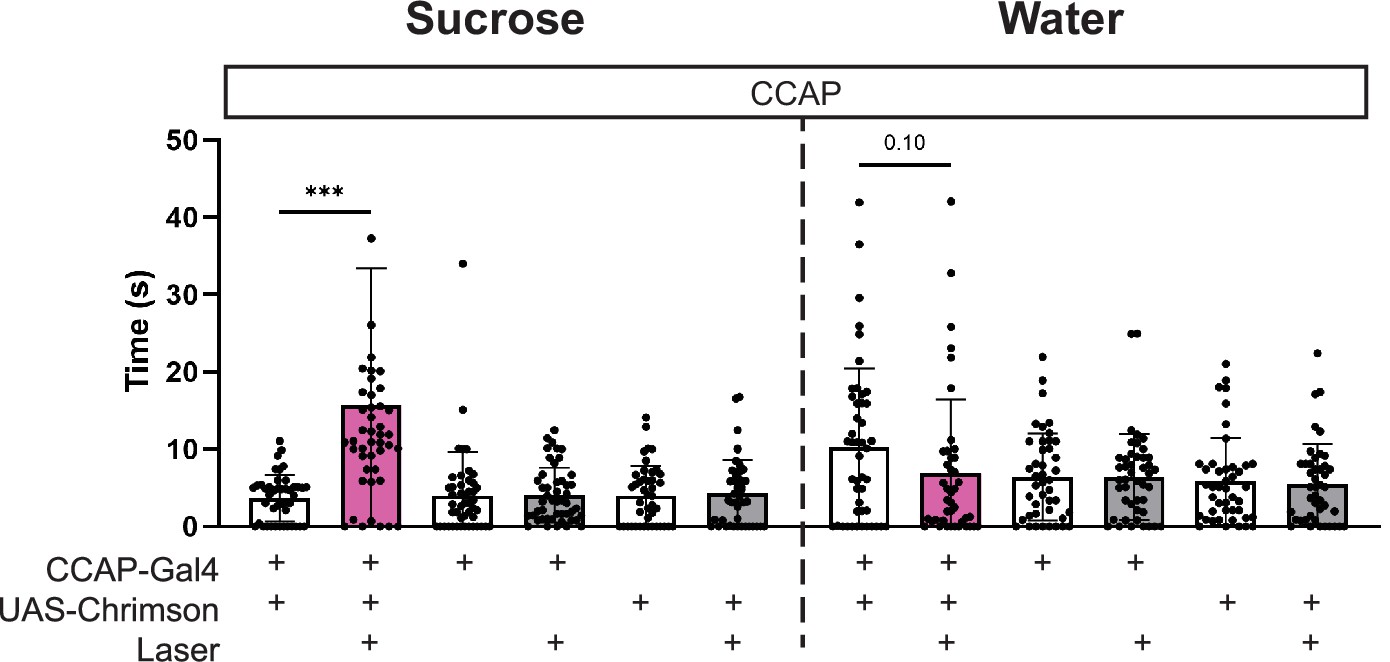
(A) CCAP neurons reconstruction from full adult fly brain (FAFB) dataset. (B) Light microscopy image of CCAP-Gal4. (C) Experimental setup for in vivo calcium imaging. We expressed the light-sensitive ion channel Chrimson in the ISNs and optogenetically stimulated them with 660 nm LED. We expressed the calcium sensor GCaMP in the CCAP neurons and imaged them with a two-photon microscope. (D) Calcium response of CCAP neurites to 2 s optogenetic stimulation of the ISNs or (E) 30 s optogenetic stimulation of the ISNs. Left: Scatter plot shows mean ± SEM of all flies imaged, gray bars represent LED stimulation. Right: Quantification of mean fluorescence intensity before stim (off) and during stim (on), each dot represents one fly. Paired t-test. n=10 flies. (F) Temporal consumption assay for 1 M sucrose or water during acute optogenetic activation of CCAP neurons with Chrimson. Ingestion time of females exposed to light normalized to dark controls of indicated genotype. Sucrose: Kruskal-Wallis with Dunn’s multiple comparison test, Water: One-way ANOVA with Holm-Šídák multiple comparison test. n=42–48 animals/genotype. (G) Temporal consumption assay for 1 M sucrose or water using RNAi targeting nSynaptobrevin (nSyb) in CCAP neurons. Kruskal-Wallis with Dunn’s multiple comparison test. n=45–54 animals/genotype. (H) Neural model for CCAP coordination of sugar and water intake. Dashed lines indicate inactive synapses. *p<0.05, **p<0.01, ***p<0.001.
-
Figure 5—source data 1
CCAP functional imaging.
- https://cdn.elifesciences.org/articles/88143/elife-88143-fig5-data1-v1.xlsx
Figure 5—figure supplement 1
Crustacean cardioactive peptide (CCAP) responds to interoceptive subesophageal zone neuron (ISN) activation using another CCAP-Gal4 driver.
We expressed the light-sensitive ion channel Chrimson in the ISNs and optogenetically stimulated them with 660 nm LED. We expressed the calcium sensor GCaMP in the CCAP neurons and imaged them with a two-photon microscope. (A) Calcium response of CCAP neurites to 2 s optogenetic stimulation of the ISNs or (B) 30 s optogenetic stimulation of the ISNs. Left: Scatter plot shows mean ± SEM of all flies imaged, gray bars represent LED stimulation. Right: Quantification of mean fluorescence intensity before stim (off) and during stim (on), each dot represents one fly. Paired t-test. n=8 flies. **p<0.01, ***p<0.001.
Figure 5—figure supplement 2
Crustacean cardioactive peptide (CCAP) optogenetic activation ingestion phenotype.
Temporal consumption assay for 1 M sucrose or water during acute optogenetic activation of CCAP neurons with Chrimson. Represented are the mean, and the 10–90 percentile. Data was analyzed using Kruskal-Wallis test, followed by multiple comparisons against the no laser control. n=42–48 animals/genotype. ***p<0.001.
Figure 6
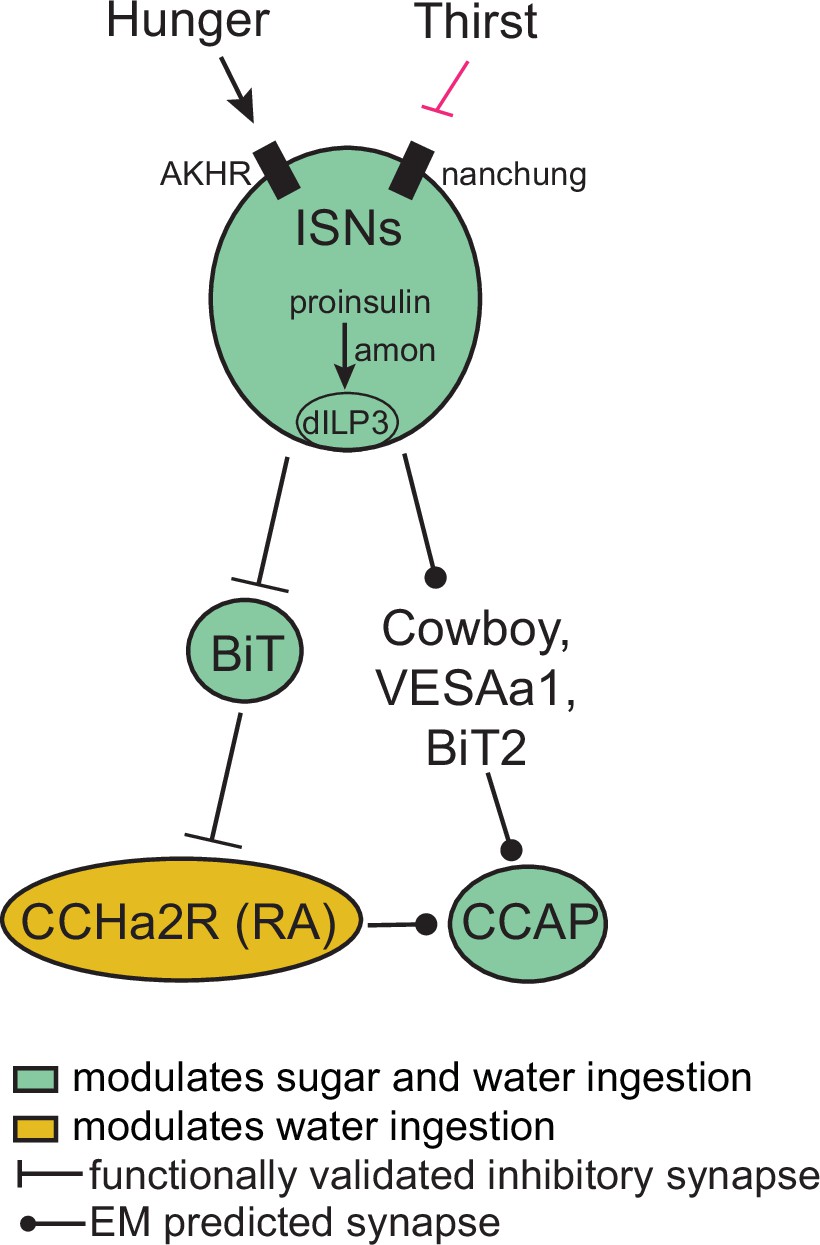
Interoceptive subesophageal zone neurons (ISN) regulation of sugar and water ingestion model.
Hunger signals activate the ISN while thirst signals inhibit the ISNs. ISNs use Drosophila insulin-like peptide 3 (dILP3) as a neurotransmitter and require amontillado (amon) for neuropeptide processing. ISN activity inhibits bilateral T-shaped neuron (BiT), which in turn inhibits CCHamide-2 receptor isoform RA (CCHa2R-RA) neurons. Crustacean cardioactive peptide (CCAP) neurons are downstream of the ISNs, connected via Cowboy, VESAa1, BiT2, and CCHa2R-RA neurons. BiT activity inhibits sugar ingestion and promotes water ingestion. CCAP activity promotes sugar ingestion and inhibits water ingestion. CCHa2R-RA activity inhibits water ingestion.
Tables
Key resources table
| Reagent type (species) or resource | Designation | Source or reference | Identifiers | Additional information |
|---|---|---|---|---|
| Genetic reagent (D. melanogaster) | UAS-nSynaptobrevin RNAi | Bloomington Drosophila Stock Center | BDSC 31983 | |
| Genetic reagent (D. melanogaster) | UAS-dcr2 | Bloomington Drosophila Stock Center | BDSC 24650 | |
| Genetic reagent (D. melanogaster) | UAS-Trh RNAi | Bloomington Drosophila Stock Center | BDSC 25842 | |
| Genetic reagent (D. melanogaster) | UAS-ChAT RNAi | Bloomington Drosophila Stock Center | BDSC 25856 | |
| Genetic reagent (D. melanogaster) | UAS-Tbh RNAi | Bloomington Drosophila Stock Center | BDSC 27667 | |
| Genetic reagent (D. melanogaster) | UAS-Hdc RNAi | Bloomington Drosophila Stock Center | BDSC 26000 | |
| Genetic reagent (D. melanogaster) | UAS-VMAT RNAi | Bloomington Drosophila Stock Center | BDSC 31257 | |
| Genetic reagent (D. melanogaster) | UAS-GAD1 RNAi | Bloomington Drosophila Stock Center | BDSC 28079 | |
| Genetic reagent (D. melanogaster) | UAS-DDC RNAi | Bloomington Drosophila Stock Center | BDSC 27030 | |
| Genetic reagent (D. melanogaster) | UAS-DVGlut RNAi | Bloomington Drosophila Stock Center | BDSC 27538 | |
| Genetic reagent (D. melanogaster) | UAS-sNPF RNAi | Bloomington Drosophila Stock Center | BDSC 25867 | |
| Genetic reagent (D. melanogaster) | UAS-VGAT RNAi | Bloomington Drosophila Stock Center | BDSC 41958 | |
| Genetic reagent (D. melanogaster) | UAS-TDC2 RNAi | Bloomington Drosophila Stock Center | BDSC 25871 | |
| Genetic reagent (D. melanogaster) | UAS-dILP1 RNAi | Bloomington Drosophila Stock Center | BDSC 32861 | |
| Genetic reagent (D. melanogaster) | UAS-dILP2 RNAi | Bloomington Drosophila Stock Center | BSC 32475 | |
| Genetic reagent (D. melanogaster) | UAS-dILP3 RNAi | Bloomington Drosophila Stock Center | BSC 31492 | |
| Genetic reagent (D. melanogaster) | UAS-dILP4 RNAi | Bloomington Drosophila Stock Center | BDSC 33682 | |
| Genetic reagent (D. melanogaster) | UAS-dILP5 RNAi | Bloomington Drosophila Stock Center | BDSC 31378 | |
| Genetic reagent (D. melanogaster) | UAS-dILP6 RNAi | Bloomington Drosophila Stock Center | BDSC 33684 | |
| Genetic reagent (D. melanogaster) | UAS-dILP7 RNAi | Bloomington Drosophila Stock Center | BDSC 32862 | |
| Genetic reagent (D. melanogaster) | UAS-amon RNAi | Bloomington Drosophila Stock Center | BDSC 29009 | |
| Genetic reagent (D. melanogaster) | ISN-Gal4 (VT011155-Gal4) | FlyLight, Janelia Research Campus | Fly Light ID 54404 | |
| Genetic reagent (D. melanogaster) | ISN-LexA (GMR34G02-LexA) | Bloomington Drosophila Stock Center | BDSC 54138 | |
| Genetic reagent (D. melanogaster) | UAS-myrGFP.QUAS-mtdTomato-3xHA; trans-Tango | Bloomington Drosophila Stock Center | BDSC 77124 | |
| Genetic reagent (D. melanogaster) | VT002073-Gal4.AD | Bloomington Drosophila Stock Center | BDSC 71871 | |
| Genetic reagent (D. melanogaster) | VT040568-Gal4.DBD | Bloomington Drosophila Stock Center | BDSC 72902 | |
| Genetic reagent (D. melanogaster) | UAS-csChrimson.mVenus | Bloomington Drosophila Stock Center | BDSC 55134 | |
| Genetic reagent (D. melanogaster) | LexAop-ChrimsonR.mCherry | Gift from Jayaraman Lab | ||
| Genetic reagent (D. melanogaster) | UAS-ArcLight | Bloomington Drosophila Stock Center | BDSC 51056 | |
| Genetic reagent (D. melanogaster) | Empty split | Bloomington Drosophila Stock Center | BDSC 79603 | |
| Genetic reagent (D. melanogaster) | ppk28-Gal4 | Cameron et al., 2010. | BDSC 93020 | |
| Genetic reagent (D. melanogaster) | Gr5a-Gal4 | Chyb et al., 2003. | BDSC 57592, 57591 | |
| Genetic reagent (D. melanogaster) | CCha2R-RA-Gal4 | Bloomington Drosophila Stock Center | BDSC 84603 | |
| Genetic reagent (D. melanogaster) | LexAop-CsChrimson.tdTomato (III) | Bloomington Drosophila Stock Center | BDSC 82183 | |
| Genetic reagent (D. melanogaster) | UAS-GCaMP6s (III) | Bloomington Drosophila Stock Center | BDSC 42749 | |
| Genetic reagent (D. melanogaster) | 20XUAS-GCaMP7b | Bloomington Drosophila Stock Center | BDSC 79029 | |
| Genetic reagent (D. melanogaster) | CCAP-Gal4 (II) | Bloomington Drosophila Stock Center | BDSC 25685 | |
| Genetic reagent (D. melanogaster) | CCAP-Gal4 (III) | Bloomington Drosophila Stock Center | BDSC 25686 | |
| Genetic reagent (D. melanogaster) | CCHa2R (RA)-LexA | Bloomington Drosophila Stock Center | BDSC 84363 | |
| Genetic reagent (D. melanogaster) | dILP2-LexA | Li and Gong, 2015. | ||
| Antibody | Anti-Brp (nc82) (Mouse monoclonal) | DSHB, University of Iowa, USA | DSHB Cat# nc82, RRID:AB_2314866 | 1:40 |
| Antibody | Anti-GFP (Chicken polyclonal) | Invitrogen | Thermo Fisher Scientific Cat# A10262, RRID:AB_2534023 | 1:1000 |
| Antibody | Anti-dsRed (Rabbit polyclonal) | Takara, Living Colors | Takara Bio Cat# 632496, RRID:AB_10013483 | 1:1000 |
| Antibody | Anti-mouse AF647 (Goat polyclonal) | Invitrogen | Thermo Fisher Scientific Cat# A-21236, RRID:AB_2535805 | 1:500 |
| Antibody | Anti-chicken AF488 (Goat polyclonal) | Life Technologies | Thermo Fisher Scientific Cat# A-11039, RRID:AB_2534096 | 1:1000 |
| Antibody | Anti-rabbit AF568 (Goat polyclonal) | Invitrogen | Thermo Fisher Scientific Cat# A-11036, RRID:AB_10563566 | 1:1000 |
| Chemical compound | All trans-Retinal | MilliporeSigma | Cat# R2500 | |
| Software, algorithm | Fiji | https://fiji.sc/ | RRID: SCR_002285 | |
| Software, algorithm | NAVis | Copyright 2018, Philipp Schlegel | ||
| Software, algorithm | CATMAID | Saalfeld et al., 2009; https://catmaid.org | ||
| Software, algorithm | Flywire | Flywire; https://flywire.ai/ | RRID:SCR_019205 | |
| Software, algorithm | GraphPad Prism | GraphPad Software; https://www.graphpad.com/scientific-software/prism/ | RRID:SCR_002798 | |
| Software, algorithm | Python | Python Software Foundation; https://www.python.org/downloads/ | ||
| Software, algorithm | Adobe Illustrator | Adobe Software; https://www.adobe.com/products/illustrator.html | ||
| Software, algorithm | CAVE (connectome annotation versioning engine) | https://github.com/seung-lab/CAVEclient/blob/master/FlyWireSynapseTutorial.ipynb; seung-lab, 2021; Buhmann et al., 2021; Eckstein et al., 2020; Heinrich et al., 2018 | ||
| Software, algorithm | R Project for Statistical Computing | Dessau and Pipper, 2008 | RRID:SCR_001905 |
Additional files
-
MDAR checklist
- https://cdn.elifesciences.org/articles/88143/elife-88143-mdarchecklist1-v1.pdf
-
Supplementary file 1
Interoceptive subesophageal zone neuron (ISN) postsynaptic partners.
Number of synapses from the four ISNs onto different cell types, including the Flywire tracing contributions of different laboratories.
- https://cdn.elifesciences.org/articles/88143/elife-88143-supp1-v1.docx
-
Supplementary file 2
Bilateral T-shaped neuron (BiT) postsynaptic neurons.
Number of synapses from BiT onto different cell types, including the Flywire tracing contributions of different laboratories.
- https://cdn.elifesciences.org/articles/88143/elife-88143-supp2-v1.docx
-
Supplementary file 3
Synapses from interoceptive subesophageal zone neuron (ISN) postsynaptic partners onto crustacean cardioactive peptide (CCAP) neurons.
Number of synapses from ISN postsynaptic partners onto CCAP neurons, including the Flywire tracing contributions of different laboratories.
- https://cdn.elifesciences.org/articles/88143/elife-88143-supp3-v1.docx
-
Supplementary file 4
Fly genotypes used. Fly genotypes used throughout the study, as shown in different figure panels.
- https://cdn.elifesciences.org/articles/88143/elife-88143-supp4-v1.docx
Download links
A two-part list of links to download the article, or parts of the article, in various formats.
Downloads (link to download the article as PDF)
Open citations (links to open the citations from this article in various online reference manager services)
Cite this article (links to download the citations from this article in formats compatible with various reference manager tools)
Hunger- and thirst-sensing neurons modulate a neuroendocrine network to coordinate sugar and water ingestion
eLife 12:RP88143.
https://doi.org/10.7554/eLife.88143.3


