Ligand bias underlies differential signaling of multiple FGFs via FGFR1
- Department of Materials Science and Engineering, Institute for NanoBioTechnology, and Program in Molecular Biophysics, Johns Hopkins University, United States
- Department of Biology, Faculty of Medicine, Masaryk University, Czech Republic
- Institute of Animal Physiology and Genetics of the CAS, Czech Republic
- International Clinical Research Center, St. Anne's University Hospital, Czech Republic
Figures
Figure 1
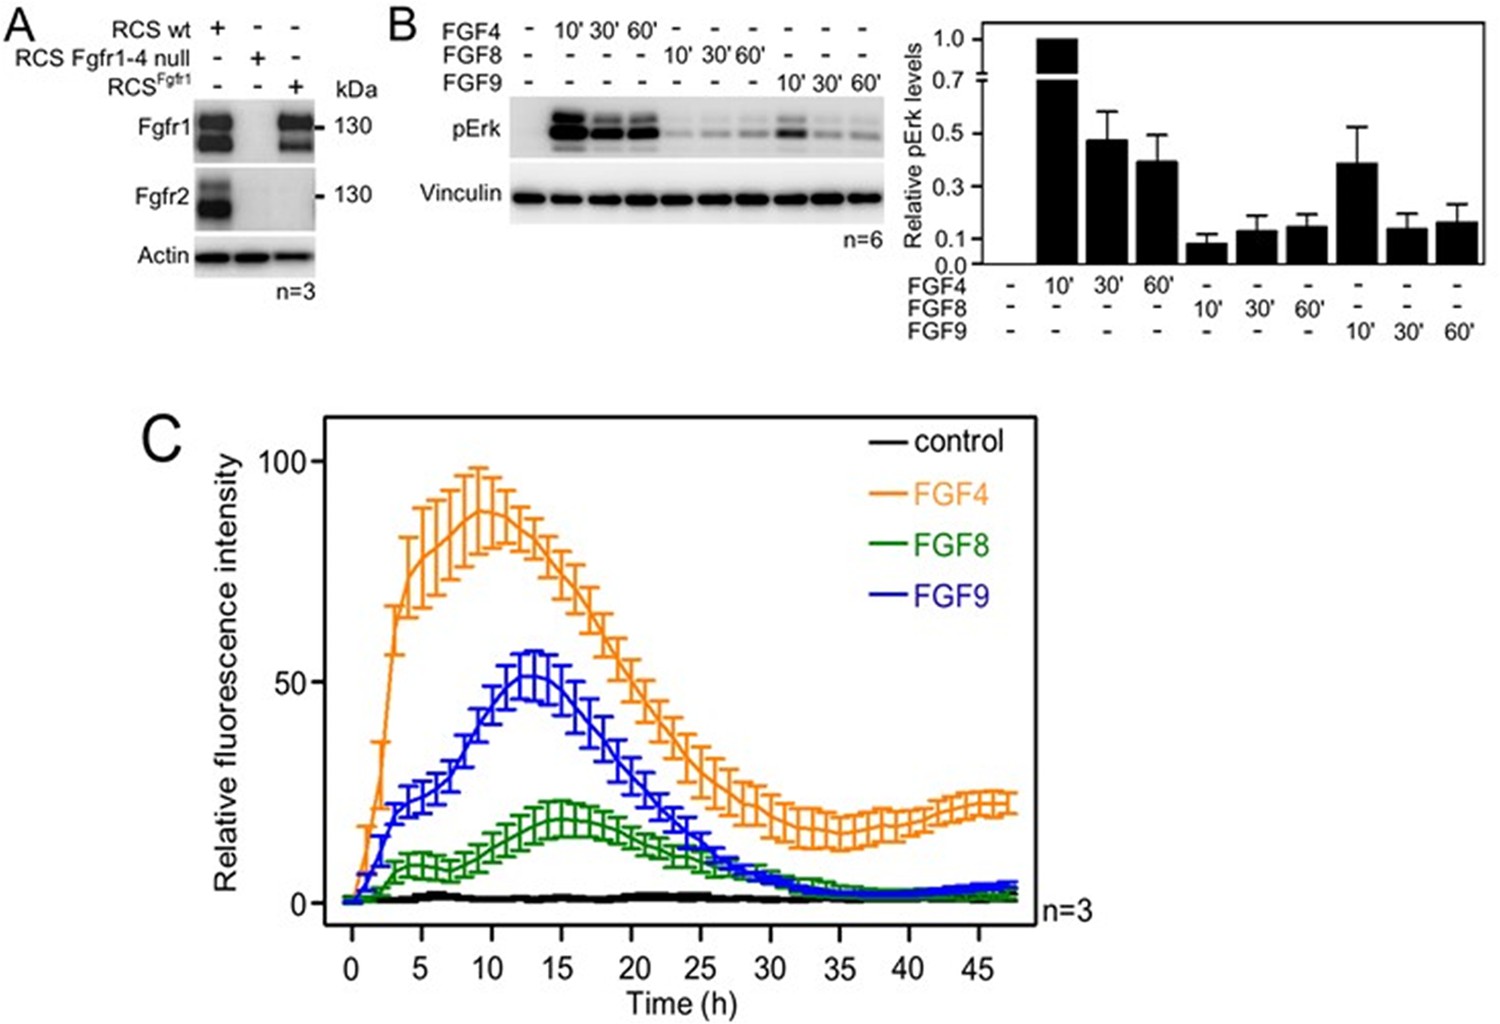
Activation of FGF signaling in RCS^Fgfr1 cells.
(A) Expression of FGFR1 and FGFR2 in wild-type rat chondrosarcoma (RCS) cells, RCS cells null for FGFR1–4, and RCS cells expressing only endogenous FGFR1 (RCSFgfr1). Actin serves as a loading control; n, number of biologically independent experiments. (B) RCSFgfr1 cells were treated with FGF4, FGF8, and FGF9 for indicated times and ERK phosphorylation (pErk) was monitored by western blot. Vinculin serves as a loading control. pErk signal was quantified and graphed (right) as relative values compared to the 10’ FGF4 stimulation; data show average and SEM of six biologically independent experiments. (C) RCSFgfr1 expressing the pKrox(MapERK)d1EGFP reporter were treated with FGF4, FGF8, and FGF9 and pKrox24 transactivation was monitored for 48 hr.
-
Figure 1—source data 1
Original files for the western blots in Figure 1A.
- https://cdn.elifesciences.org/articles/88144/elife-88144-fig1-data1-v2.zip
-
Figure 1—source data 2
PDF containing Figure 1A and original western blots.
- https://cdn.elifesciences.org/articles/88144/elife-88144-fig1-data2-v2.pdf
-
Figure 1—source data 3
Original files for the western blots in Figure 1B.
- https://cdn.elifesciences.org/articles/88144/elife-88144-fig1-data3-v2.zip
-
Figure 1—source data 4
PDF containing Figure 1B and original western blots.
- https://cdn.elifesciences.org/articles/88144/elife-88144-fig1-data4-v2.pdf
-
Figure 1—source data 5
Data plotted in Figure 1B.
- https://cdn.elifesciences.org/articles/88144/elife-88144-fig1-data5-v2.xlsx
-
Figure 1—source data 6
Data plotted in Figure 1C.
- https://cdn.elifesciences.org/articles/88144/elife-88144-fig1-data6-v2.xlsx
Figure 2
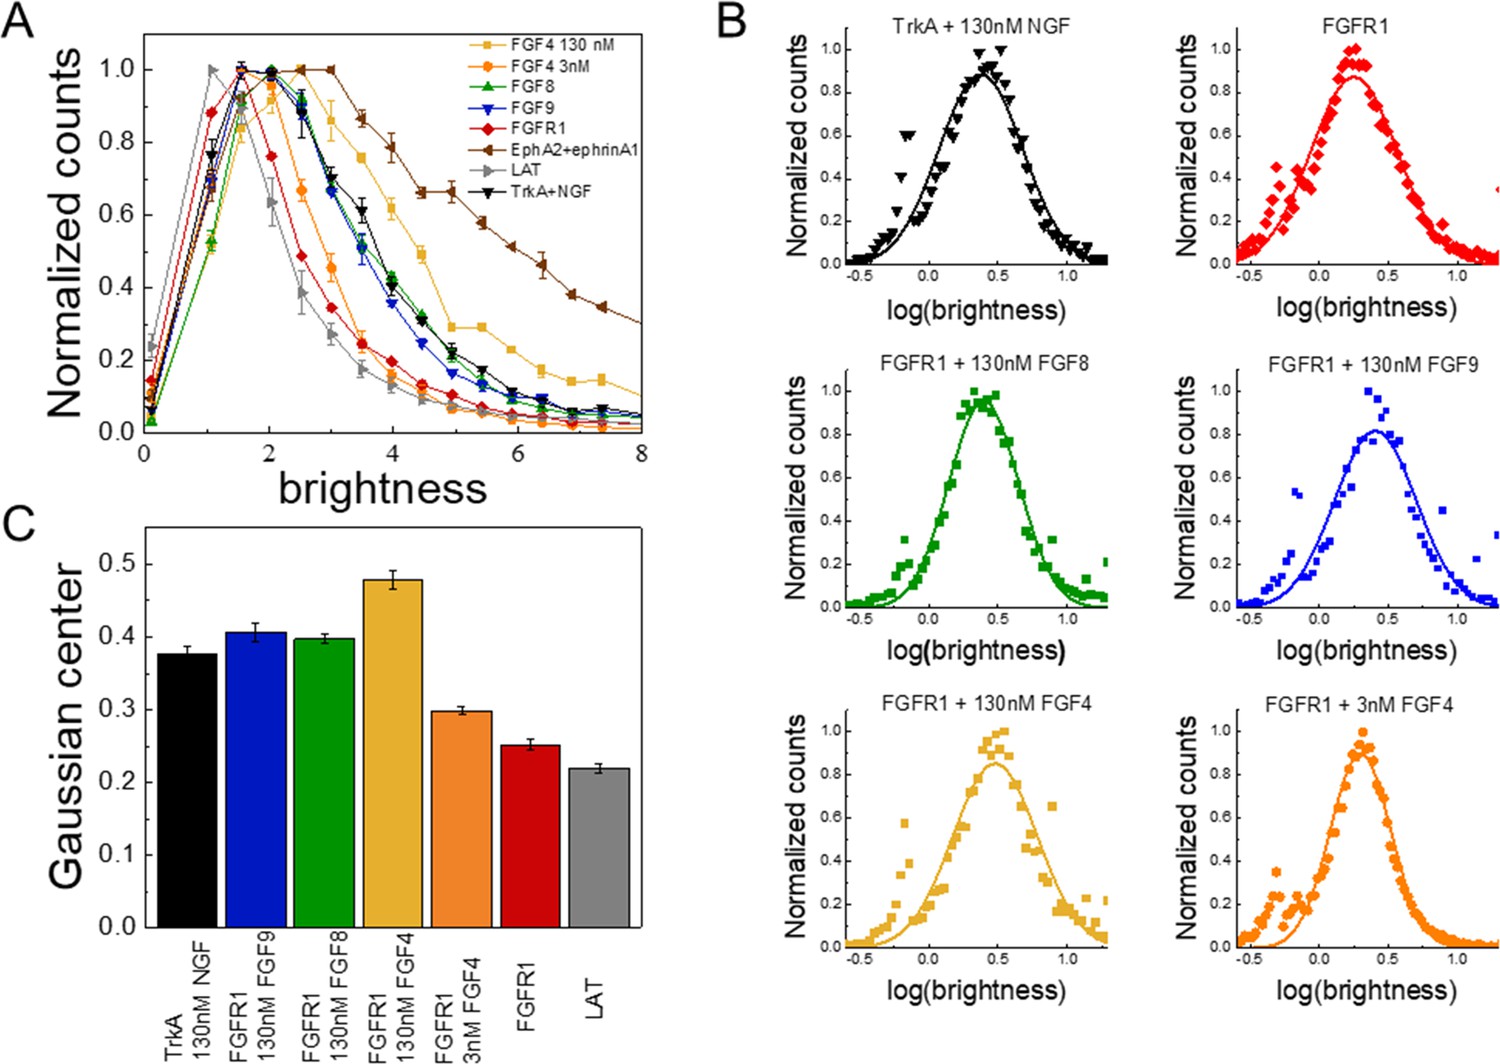
The oligomerization state of FGFR1, as measured by fluorescence intensity fluctuation (FIF) spectrometry.
(A) Brightness distributions shown on the linear scale. Brightness scales with the oligomer size. Linker for activation of T-cells (LAT) (gray) is a monomer control, TrkA+130 nM nerve growth factor (NGF) (black) is a dimer control. EphA2 bound to ephrinA1-Fc (brown) is an oligomer control. All distributions are scaled to a maximum of 1. (B) Distributions of log(brightness). Points represent the experimental FIF data, and the solid lines are the best-fit Gaussians. (C) Means of the best-fit Gaussians and the standard errors of the mean. Each data set is derived from at least 100 cells in three biologically independent experiments.
-
Figure 2—source data 1
Fluorescence intensity fluctuations (FIF) brightness value distributions.
- https://cdn.elifesciences.org/articles/88144/elife-88144-fig2-data1-v2.xlsx
Figure 3
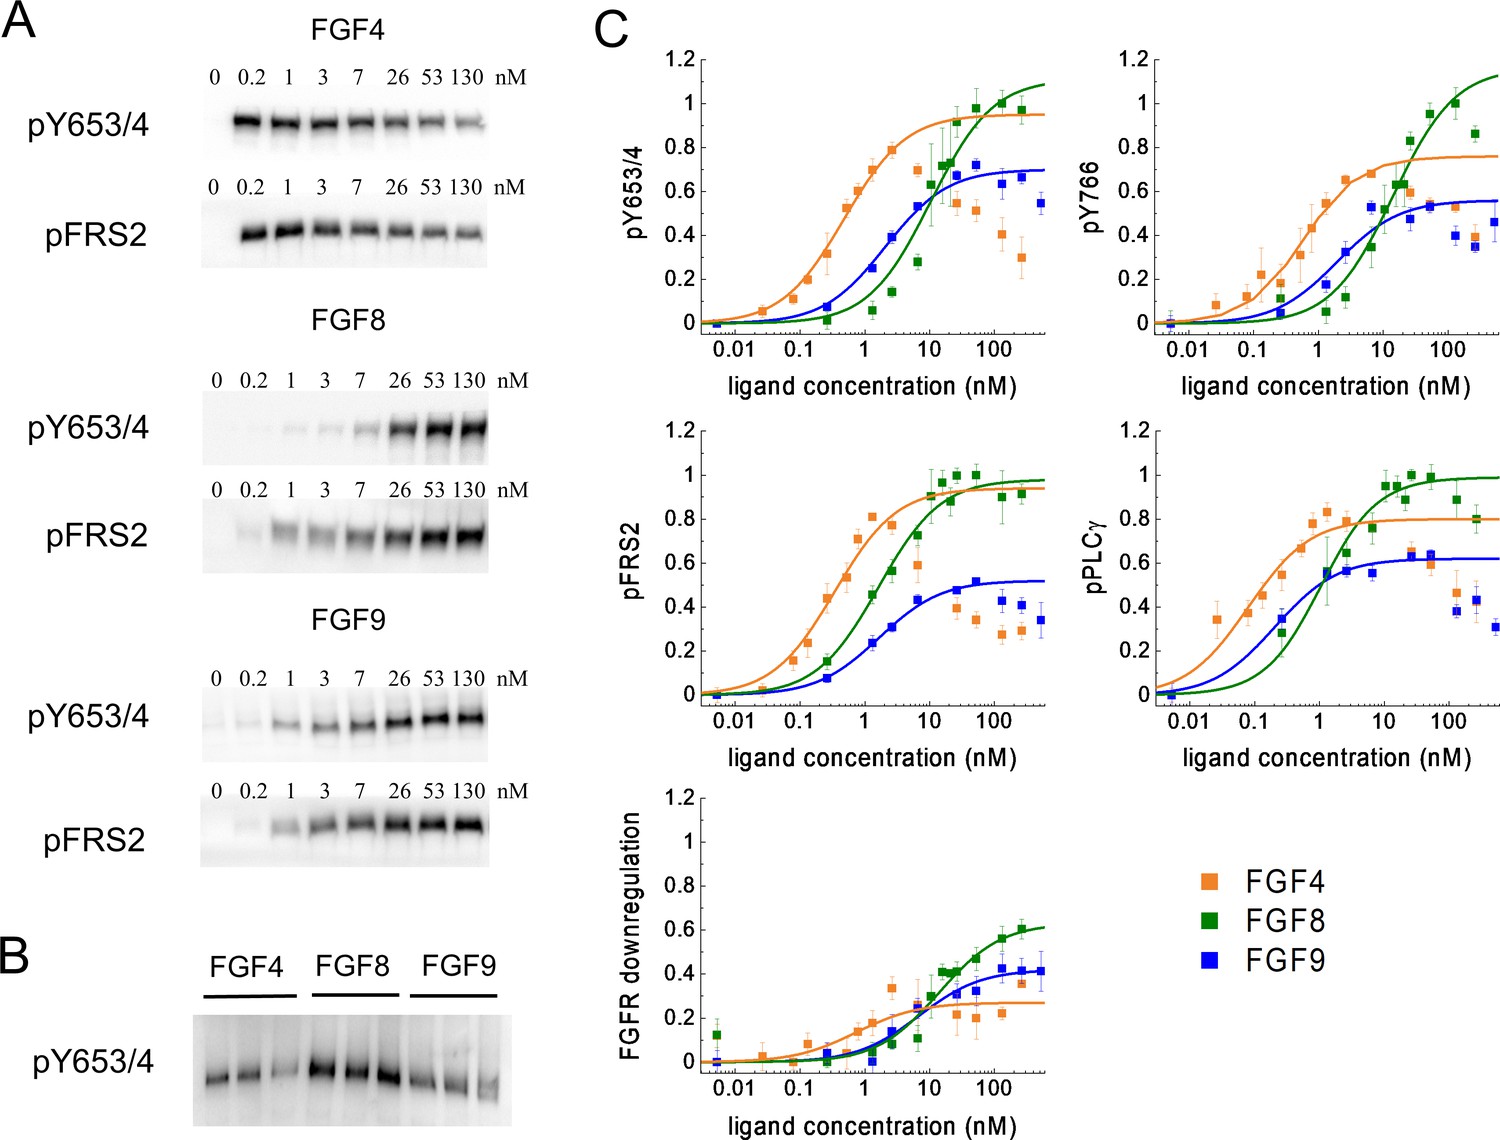
Phosphorylation of FGFR1 and downstream signaling substrates in HEK 293T cells.
(A) Sample western blots for Y653/4 FGFR1 phosphorylation and FRS2 phosphorylation in response to FGF4, FGF8, and FGF9. (B) An example blot used for data scaling, where samples with maximum phosphorylation in response to FGF4, FGF8, and FGF9 are re-run on the same gel. (C) Dose-response curves from the western blot experiments. The points represent the averaged data, mean ± SEM, while the solid lines are the best-fit rectangular hyperbolic curves. Fit parameters are shown in Table 1. Data are from three to five biologically independent experiments.
-
Figure 3—source data 1
Original files for the western blots in Figure 3A and B.
- https://cdn.elifesciences.org/articles/88144/elife-88144-fig3-data1-v2.pdf
-
Figure 3—source data 2
PDF containing Figure 3A and B and original western blots.
- https://cdn.elifesciences.org/articles/88144/elife-88144-fig3-data2-v2.pdf
-
Figure 3—source data 3
pY653/654 phosphorylation dose-response curves.
- https://cdn.elifesciences.org/articles/88144/elife-88144-fig3-data3-v2.pdf
-
Figure 3—source data 4
Y766 phosphorylation dose-response curves.
- https://cdn.elifesciences.org/articles/88144/elife-88144-fig3-data4-v2.xlsx
-
Figure 3—source data 5
pPLCγ phosphorylation dose-response curves.
- https://cdn.elifesciences.org/articles/88144/elife-88144-fig3-data5-v2.xlsx
-
Figure 3—source data 6
pFRS2 phosphorylation dose-response curves.
- https://cdn.elifesciences.org/articles/88144/elife-88144-fig3-data6-v2.xlsx
-
Figure 3—source data 7
Fibroblast growth factor receptor (FGFR) downregulation dose-response curves.
- https://cdn.elifesciences.org/articles/88144/elife-88144-fig3-data7-v2.xlsx
Figure 4
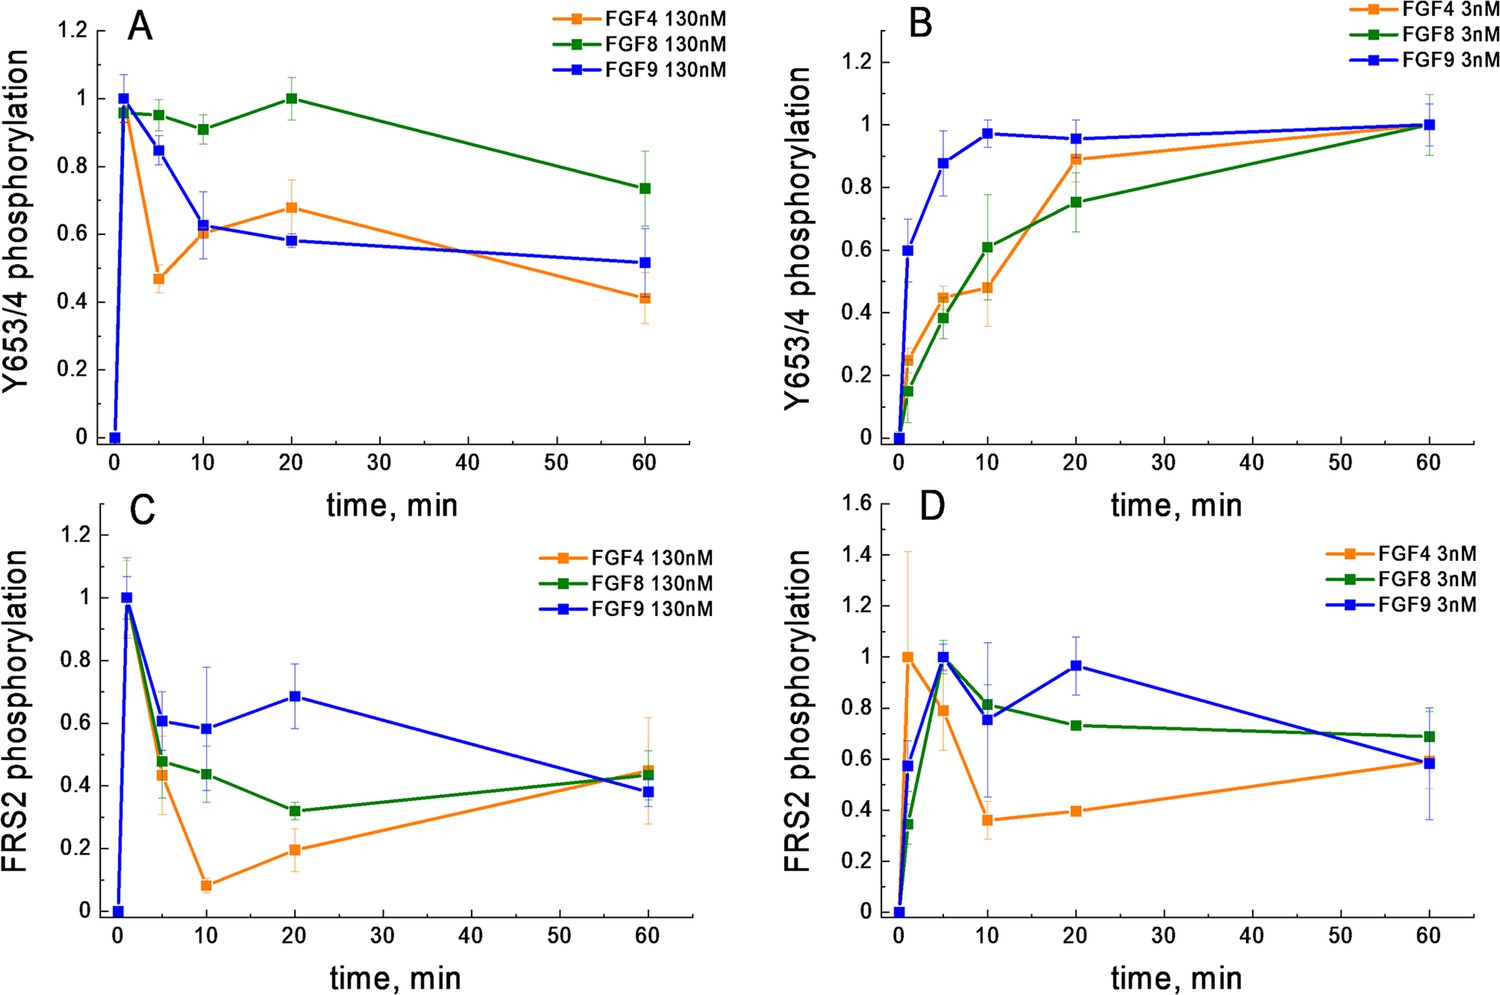
FGFR1 phosphorylation as a function of time after ligand addition.
(A) Phosphorylation time course of Y653/654 at high ligand concentration (130 nM). (B) Phosphorylation time course of Y653/654 at low ligand concentration (2.6 nM). (C) Phosphorylation time course of FRS2 at high ligand concentration (130 nM). (D) Phosphorylation time course of FRS2 at low ligand concentration (2.6 nM). Shown are means and standard errors of replicates from three biologically independent experiments.
-
Figure 4—source data 1
All kinetics data plotted in Figure 4.
- https://cdn.elifesciences.org/articles/88144/elife-88144-fig4-data1-v2.xlsx
Figure 5 with 1 supplement
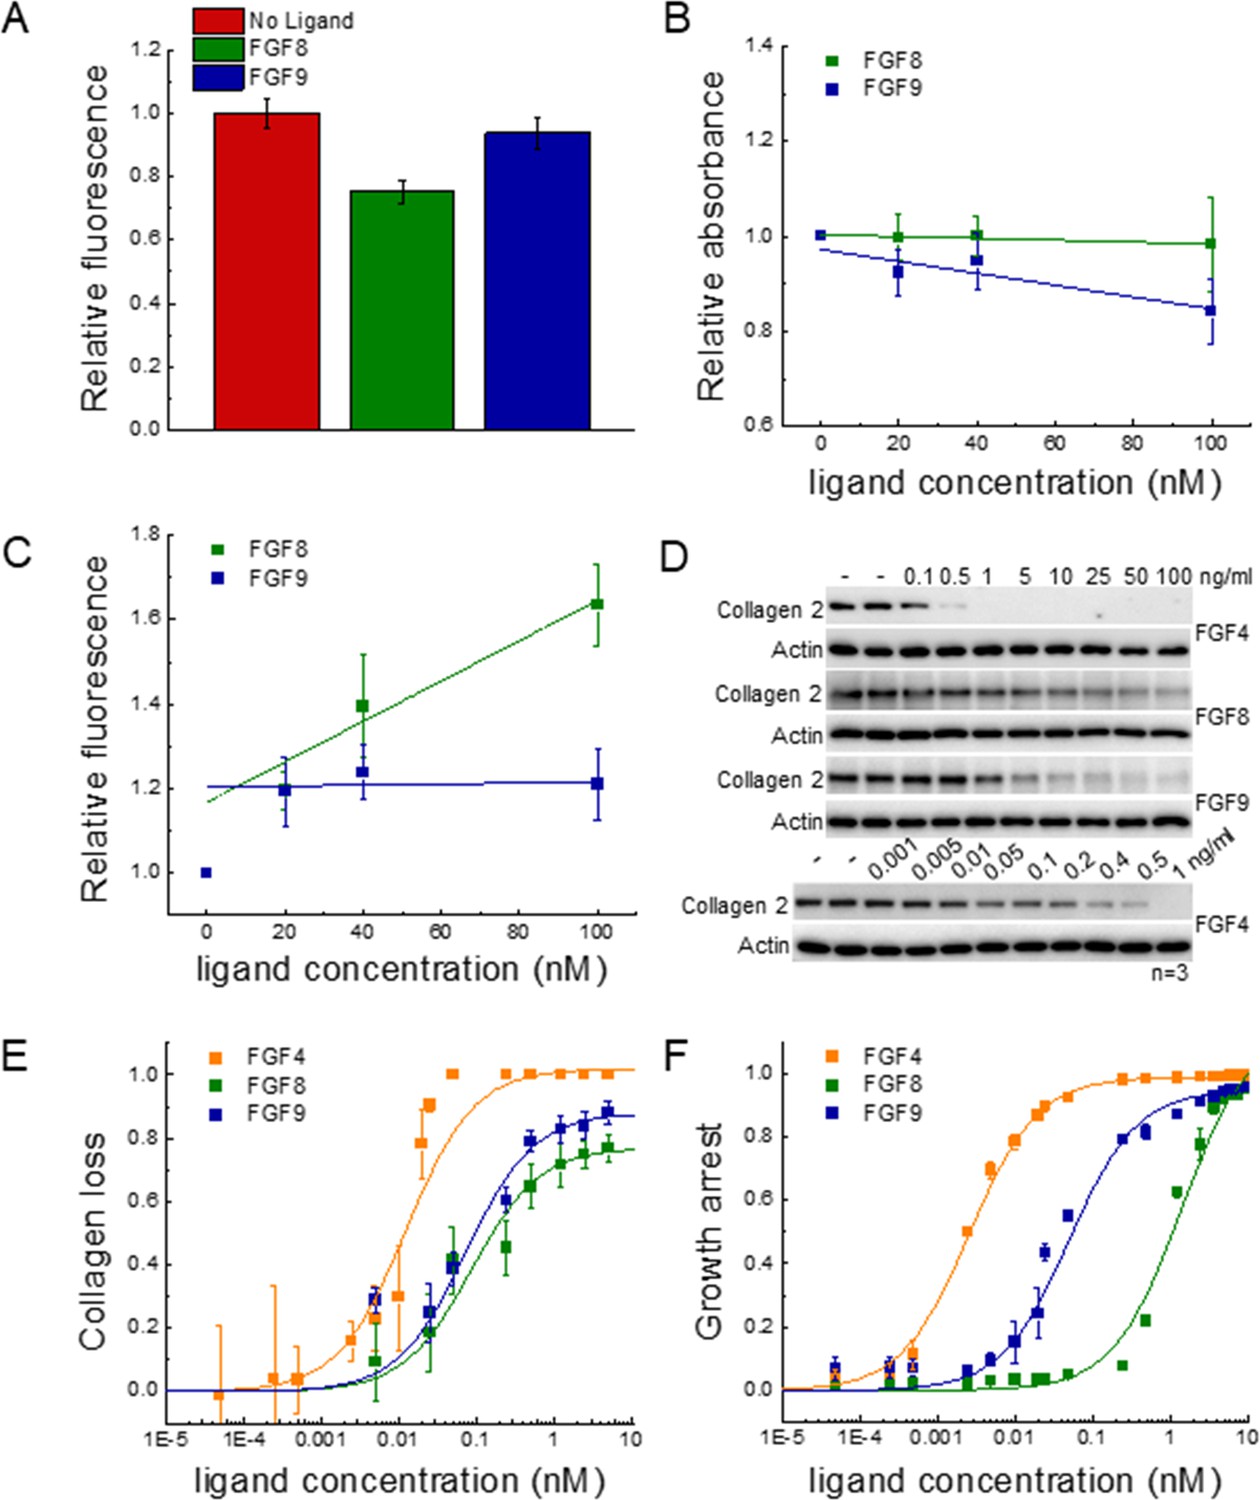
Functional FGFR1-mediated responses to different ligands.
(A) FGFR1 concentration in the plasma membrane of HEK 293T cells at t=2 min following ligand addition for FGF8, FGF9, and no ligand control. (B) HEK 293T cell viability after ligand exposure and 6 days of starvation for varying ligand concentrations. (C) Apoptosis of HEK 293T cells under starvation conditions, exposed to varying concentrations of FGF8 and FGF9. Results are summarized in Supplementary file 5. (D) RCSFgfr1 cells were treated with FGF4, FGF8, and FGF9 for 48 hr, and the levels of collagen type 2 were determined by western blot. Actin serves as a loading control. (E) Dose-response curves describing collagen type 2 loss. (F) Dose-response curves for growth arrest of RCSFgfr1 cells after 72 hr, in response to FGF4, FGF8, and FGF9. Data are from at least three biologically independent experiments.
-
Figure 5—source data 1
FGFR1 membrane concentration, cell viability, and apoptosis data plotted in Figure 5A, B, and C.
- https://cdn.elifesciences.org/articles/88144/elife-88144-fig5-data1-v2.xlsx
-
Figure 5—source data 2
Original files for the western blots in Figure 5D.
- https://cdn.elifesciences.org/articles/88144/elife-88144-fig5-data2-v2.zip
-
Figure 5—source data 3
PDF containing Figure 5D and original western blots.
- https://cdn.elifesciences.org/articles/88144/elife-88144-fig5-data3-v2.pdf
-
Figure 5—source data 4
Collagen amounts, used to generate the dose-response curves for collagen type 2 loss in Figure 5E.
- https://cdn.elifesciences.org/articles/88144/elife-88144-fig5-data4-v2.xlsx
-
Figure 5—source data 5
Cell counts, used to generate the dose-response curves for growth arrest in Figure 5F.
- https://cdn.elifesciences.org/articles/88144/elife-88144-fig5-data5-v2.xlsx
Figure 5—figure supplement 1
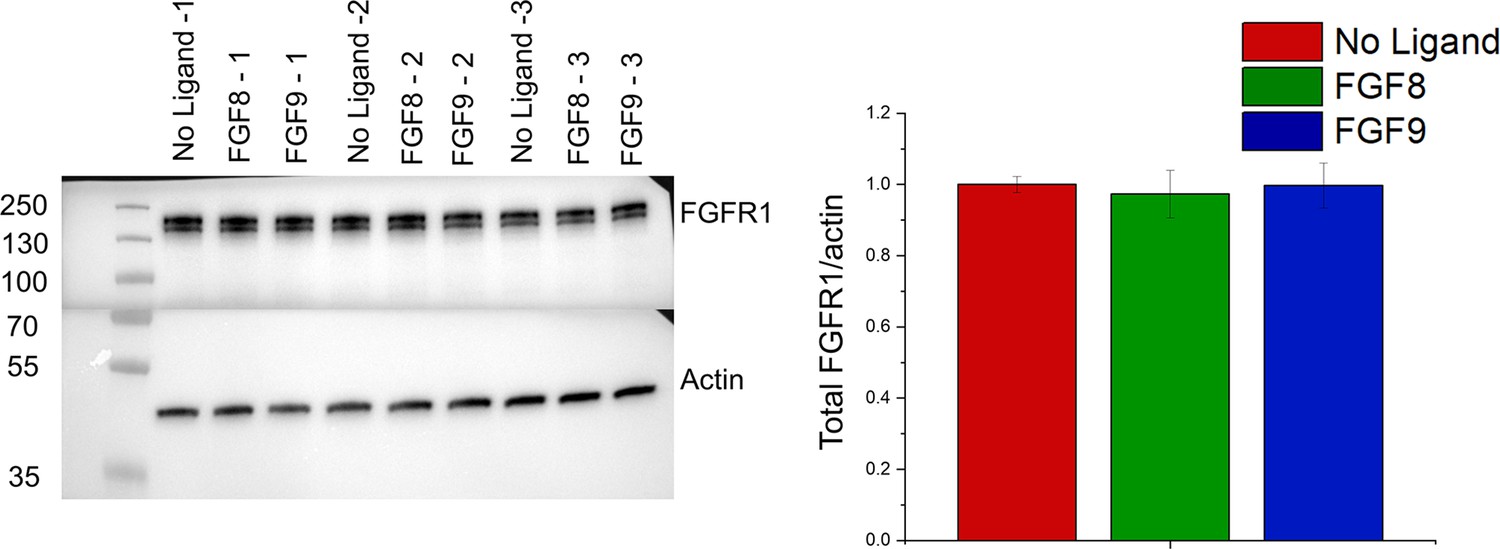
Total cellular expression of FGFR1 in the stable FGFR1 line.
Shown are results for three different biologically independent samples in the absence of ligand, three samples that have been treated with FGF8 for 2 min, and three samples that have been treated with FGF9 for 2 min. All the expressions are the same.
-
Figure 5—figure supplement 1—source data 1
Original files for the western blots in Figure 5—figure supplement 1.
- https://cdn.elifesciences.org/articles/88144/elife-88144-fig5-figsupp1-data1-v2.zip
-
Figure 5—figure supplement 1—source data 2
PDF containing Figure 5—figure supplement 1 and original western blots.
- https://cdn.elifesciences.org/articles/88144/elife-88144-fig5-figsupp1-data2-v2.pdf
Figure 6
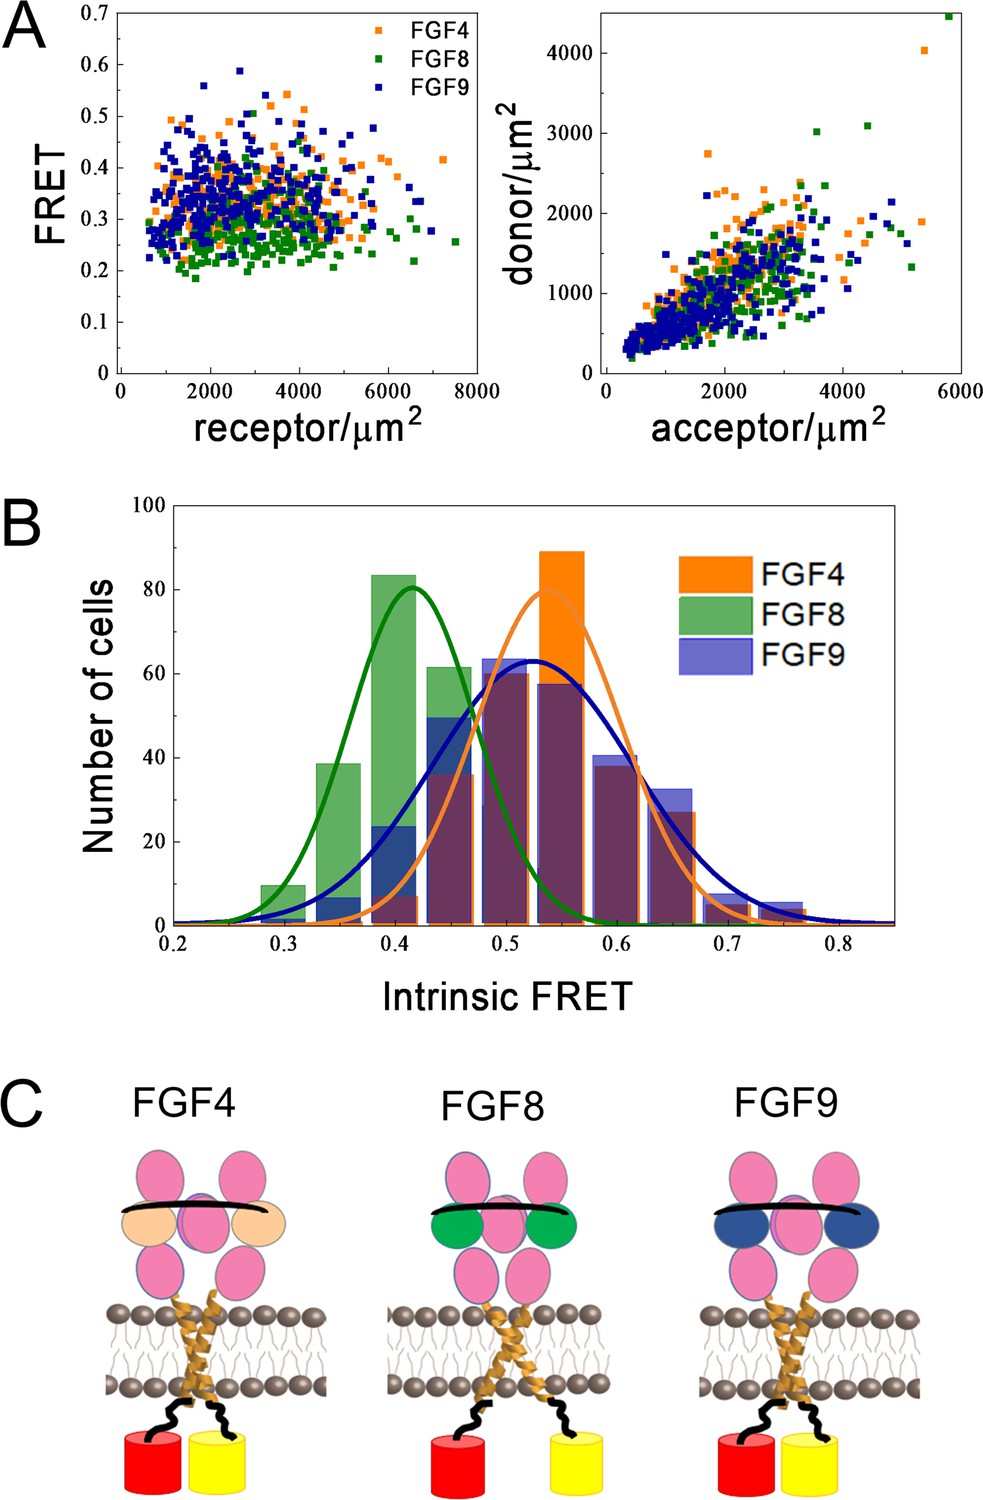
Differences in FGFR1 transmembrane domain association in response to FGF ligands.
(A and B) Förster resonance energy transfer (FRET) data for ECTM-FGFR1-YFP and ECTM-FGFR1-mCherry in the presence of saturating FGF4 (orange), FGF8 (green), or FGF9 (blue) concentrations. (A) Measured FRET efficiencies versus total receptor (ECTM-FGFR1-YFP + ECTM-FGFR1-mCherry) concentrations and measured donor (ECTM-FGFR1-YFP) concentrations versus acceptor (ECTM-FGFR1-YFP) concentrations in single vesicles. (B) Histograms of single-vesicle intrinsic FRET values. Intrinsic FRET is a measure of the separation between the fluorescent proteins. Different intrinsic FRET values were measured for FGF8 and FGF4/FGF9. (C) Graphical representation of experimental results showing that in the presence of FGF8 the transmembrane (TM) C-termini are positioned further apart from each other, as compared to the cases of FGF4 and FGF9.
-
Figure 6—source data 1
FGF4 Förster resonance energy transfer (FRET) data.
- https://cdn.elifesciences.org/articles/88144/elife-88144-fig6-data1-v2.xlsx
-
Figure 6—source data 2
FGF8 Förster resonance energy transfer (FRET) data.
- https://cdn.elifesciences.org/articles/88144/elife-88144-fig6-data2-v2.xlsx
-
Figure 6—source data 3
FGF9 Förster resonance energy transfer (FRET) data.
- https://cdn.elifesciences.org/articles/88144/elife-88144-fig6-data3-v2.xlsx
Tables
Table 1
Best-fit parameters for dose-response curves in Figures 3 and 5.
EC50 is the potency of the ligand, and Etop is the efficacy (see Equation 1).
| pY653/4 | PLCγ | ||||
|---|---|---|---|---|---|
| EC50, M | Etop | EC50, M | Etop | ||
| FGF4 | 4.77E-10±0.42E-10 | 0.95±0.03 | FGF4 | 7.98E-11±2.15E-11 | 0.80±0.04 |
| FGF8 | 1.04E-8±0.23E-8 | 1.11±0.07 | FGF8 | 1.05E-9±0.23E-9 | 0.99±0.03 |
| FGF9 | 2.09E-9±0.31E-9 | 0.70±0.02 | FGF9 | 2.05E-10±0.40E-10 | 0.62±0.02 |
| pY766 | pFRS2 | ||||
| EC50, M | Etop | EC50, M | Etop | ||
| FGF4 | 5.84E-10±1.26E-10 | 0.76±0.05 | FGF4 | 3.42E-10±0.70E-10 | 0.94±0.06 |
| FGF8 | 1.42E-8±0.25E-8 | 1.16±0.07 | FGF8 | 1.62E-9±0.29E-9 | 0.98±0.03 |
| FGF9 | 1.94E-9±0.71E-9 | 0.56±0.05 | FGF9 | 1.65E-9±0.15E-9 | 0.52±0.01 |
| FGFR1 Downregulation | Growth arrest | ||||
| EC50, M | Etop | EC50, M | Etop | ||
| FGF4 | 7.34E-10±4.54E-10 | 0.27±0.04 | FGF4 | 2.59E-12±1.1E-13 | 0.99±0.00 |
| FGF8 | 1.39E-8±0.39E-8 | 0.63±0.05 | FGF8 | 1.60E-9±2.3E-10 | 1.14±0.04 |
| FGF9 | 6.80E-9±2.08E-9 | 0.42±0.02 | FGF9 | 5.89E-11±8.5E-12 | 0.95±0.00 |
| Collagen type 2 loss | |||||
| EC50, M | Etop | ||||
| FGF4 | 1.24E-11±2.79E-12 | 1.02±0.01 | |||
| FGF8 | 8.51E-11±2.86E-11 | 0.77±0.03 | |||
| FGF9 | 5.67E-11±2.89E-11 | 0.86±0.06 | |||
Table 2
Calculated bias coefficients using Equation 2.
Gray shading indicates statistical significance between either FGF4 or FGF9 and the reference ligand FGF8 (see Supplementary file 4 for p-values).
| β | ||
|---|---|---|
| 4v8 | 9v8 | |
| pY653/4 vs pY766 | –0.07±0.16 | 0.05±0.15 |
| pY653/4 vs PLCγ | –0.24±0.18 | 0.01±0.14 |
| pY653/4 vs pFRS2 | –0.61±0.16 | –0.78±0.12 |
| pY766 vs pPLCγ | –0.18±0.19 | –0.04±0.17 |
| pY766 vs pFRS2 | –0.54±0.17 | –0.83±0.16 |
| pPLCγ vs pFRS2 | –0.37±0.20 | –0.79±0.13 |
| pY653/4 vs downregulation | –0.36±0.26 | –0.36±0.16 |
| pY766 vs downregulation | –0.29±0.27 | –0.41±0.19 |
| pPLCγ vs downregulation | –0.12±0.28 | –0.37±0.16 |
| pFRS2 vs downregulation | 0.25±0.27 | 0.42±0.15 |
| Collagen loss vs growth arrest | –1.77±0.20 | –1.13±0.18 |
Key resources table
| Reagent type (species) or resource | Designation | Source or reference | Identifiers | Additional information |
|---|---|---|---|---|
| Antibody | Fgfr1 (rabbit monoclonal) | Cell Signaling | 9740 | (1:1000) |
| Antibody | Fgfr2 (rabbit polyclonal) | Santa Cruz | sc122 | (1:1000) |
| Antibody | Collagen 2 (rabbit polyclonal) | Cedarlane | CL50241AP | (1:1000) |
| Antibody | Actin (mouse monoclonal) | Cell Signaling | 3700 | (1:1000) |
| Antibody | Vinculin (rabbit monoclonal) | Cell Signaling | 13901 | (1:1000) |
| Antibody | pERK (rabbit polyclonal) | Cell Signaling | 9101 | (1:1000) |
| Antibody | Anti-Y653/654 (rabbit polyclonal) | Cell Signaling | 3471S | (1:1000) |
| Antibody | Anti-pY766 FGFR1 (rabbit monoclonal) | Cell Signaling | 2544S | (1:1000) |
| Antibody | Anti-pFRS2 (rabbit monoclonal) | Cell Signaling | 3861S | (1:1000) |
| Antibody | Anti-pPLCγ (rabbit polyclonal) | Cell Signaling | 2821S | (1:1000) |
| Antibody | Anti-PLCγ (rabbit polyclonal) | Cell Signaling | 2822S | (1:1000) |
| Antibody | Anti-V5 (mouse monocolonal) | Invitrogen | 46-0705 | (1:1000) |
| Antibody (secondary) | Anti-rabbit | Promega | W4011 | (1:10,000) |
| Antibody (secondary) | Anti-mouse | Millipore Sigma | A6782 | (1:10,000) |
| Cell line (Homo sapiens) | HEK 293T FGFR1 | This paper | Stable cell line developed and maintained by Hristova lab, identity authenticated by SRT profiling, negative for mycoplasma | |
| Cell line (Rattus norvegicus) | RCS WT | PMID:749928 | A gift from Benoit de Crombrugghe | |
| Cell line (Rattus norvegicus) | RCS Fgfr1-4 null | PMID:33952673 | ||
| Cell line (Rattus norvegicus) | RCSFgfr1 | This paper | Progenitors: Fgfr3/4 KO RCS cells from Carmine Settembre, identity authenticated by SRT profiling, negative for mycoplasma | |
| Chemical compound, drug | 2× Laemmli Buffer | Bio-Rad | 1610737 | |
| Chemical compound, drug | Tris/Gly/SDS running buffer | Bio-Rad | 1610732 | |
| Chemical compound, drug | Transfer buffer | Bio-Rad | 1610734 | |
| Chemical compound, drug | Fugene HD | Promega | E2311 | |
| Commercial assay or kit | Bio-Rad Mini-Protean TGX precast gels | Bio-Rad | 4561026 | |
| Commercial assay or kit | PVDF membranes | Bio-Rad | 1620177 | |
| Commercial assay or kit | West Femto Supersignal | Thermo Fisher Scientific | 1706435 | |
| Commercial assay or kit | Bio-Rad Magic Red Caspase 3-7 kit | Bio-Rad | ICT 935 | |
| Commercial assay or kit | MTT Cell Proliferation Assay Kit | Cell BioLabs | CBS-252 | |
| Other | Iblot 2 Gel Transfer Device | Thermo Fisher Scientific | IB21001 | Equipment for transfer |
| Gene (Rattus norvegicus) | Fgfr1 | Ensembl | Ensembl:ENSRNOG00000016050 | |
| Peptide, recombinant protein | FGF4 | R&D Systems | 235-F4-025 | |
| Peptide, recombinant protein | FGF8 | R&D Systems | 423-F8-025 | |
| Peptide, recombinant Protein | FGF9 | R&D Systems | 273-F9-025 | |
| Recombinant DNA reagent | FGFR1-ECTM-eYFP (plasmid) | PMID:26725515 | YFP-Dr M. Betenbaugh, FGFR1 in pRK5- Dr M Mohammadi, into pcDNA3.1 vector | |
| Recombinant DNA reagent | FGFR1-ECTM-mCherry (plasmid) | PMID:26725515 | pRSET-mCherry- Dr R.Tsien, FGFR1 in pRK5- Dr M Mohammadi, into pcDNA3.1 vector | |
| Recombinant DNA reagent | pKrox(MapERK)d1EGFP | This paper | Addgene plasmid #214912 | Progenitors: pKrox24(MapErk)DsRed (PMID:28199182), pTR01F (PMID:24376882), d1EGFP (PMID:16508309), PCR of mEgr1 3’UTR |
| Software | FIF software | PMID:31110281 | ||
| Software | Mathematica | Wolfram | 13 | |
| Software | Prism | GraphPad | 9.2.0 |
Additional files
-
Supplementary file 1
Best-fit Gaussian parameters for the different log(brightness) distributions.
- https://cdn.elifesciences.org/articles/88144/elife-88144-supp1-v2.docx
-
Supplementary file 2
Calculated Z values from the Gaussian fit parameters in Supplementary file 1.
- https://cdn.elifesciences.org/articles/88144/elife-88144-supp2-v2.docx
-
Supplementary file 3
β’4, β’8, and β’9 values calculated for each response using Equation 4.
- https://cdn.elifesciences.org/articles/88144/elife-88144-supp3-v2.docx
-
Supplementary file 4
Comparison of β’4, β’8, and β’9 values from Supplementary file 3.
- https://cdn.elifesciences.org/articles/88144/elife-88144-supp4-v2.docx
-
Supplementary file 5
Summary of results shown in Figure 5A–C.
- https://cdn.elifesciences.org/articles/88144/elife-88144-supp5-v2.docx
-
MDAR checklist
- https://cdn.elifesciences.org/articles/88144/elife-88144-mdarchecklist1-v2.docx
Download links
A two-part list of links to download the article, or parts of the article, in various formats.
Downloads (link to download the article as PDF)
Open citations (links to open the citations from this article in various online reference manager services)
Cite this article (links to download the citations from this article in formats compatible with various reference manager tools)
Ligand bias underlies differential signaling of multiple FGFs via FGFR1
eLife 12:RP88144.
https://doi.org/10.7554/eLife.88144.4


