Network-level changes in the brain underlie fear memory strength
- Department of Psychology, McGill University, Canada
- Department of Neurophysiology, Ruhr-University Bochum, Germany
Figures
Figure 1
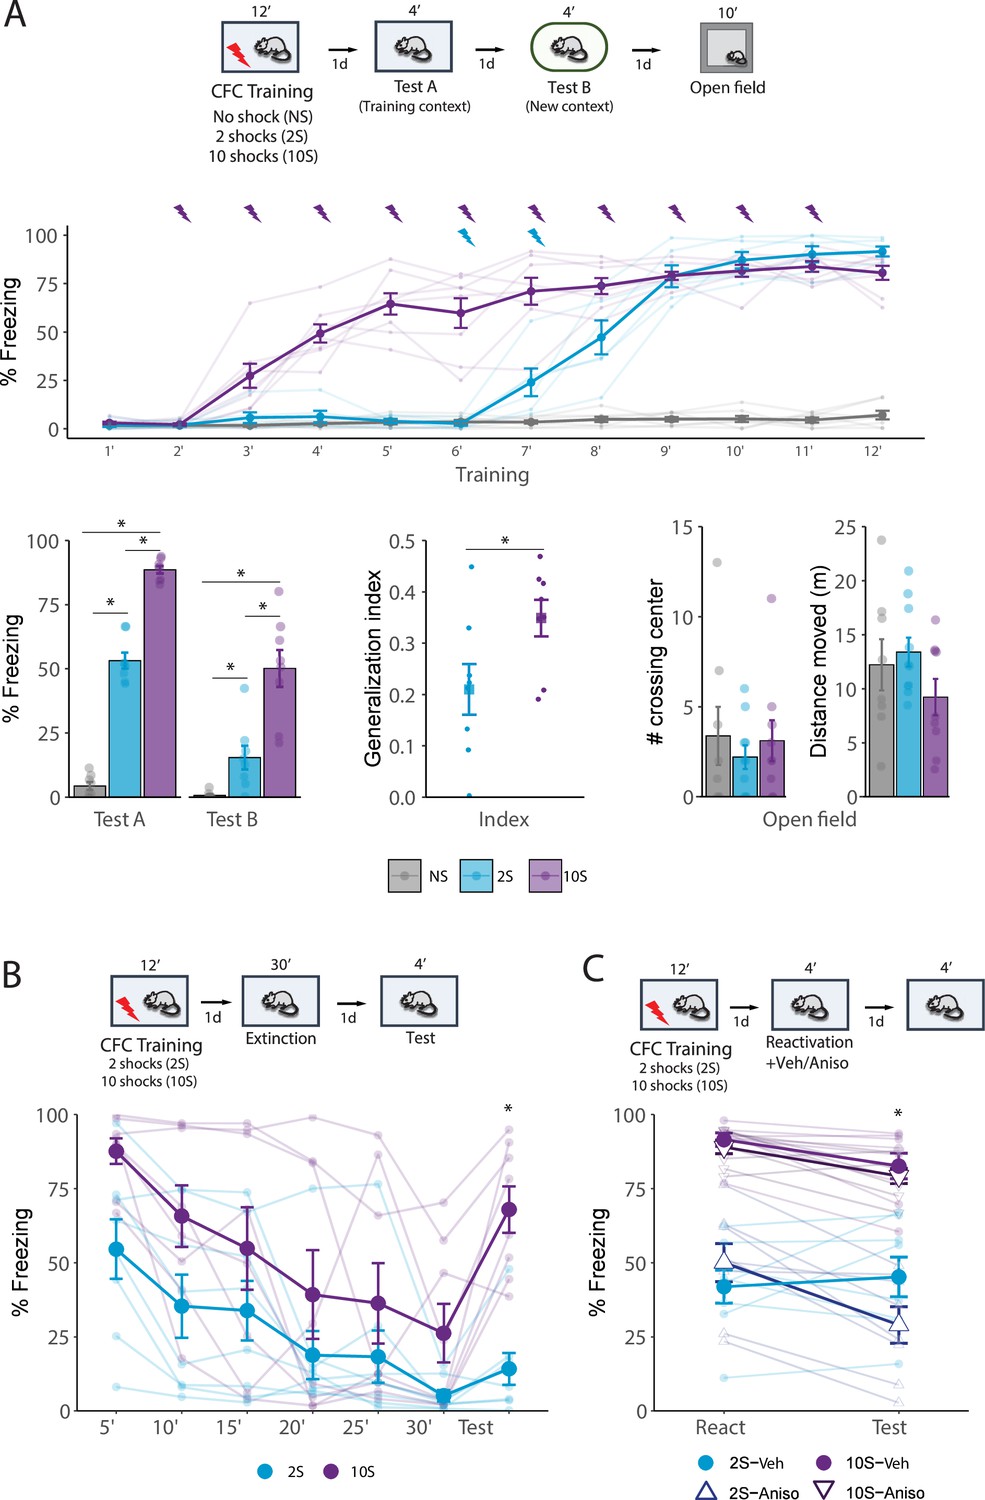
Behavioral differences triggered by contextual fear conditioning (CFC) using different numbers of foot shocks.
(A) Animals were placed in a fear conditioning box for 10 min and received either no foot shock (NS group), 2 shocks (2S group), or 10 shocks (10S group). One day later, they returned to the same context for 4 min (Test A), and on the following day were placed for 4 min in a new, distinct context (Test B). The next day, rats were placed for 10 min in an open-field arena. During training, freezing behavior increased following shock presentations in both 2S and 10S groups (N = 6/8 per group). In both Tests A and B (left), animals trained with 10 shocks displayed higher freezing levels than other groups, and animals that received no shock displayed the lowest freezing. To assess how animals from the 2S and 10S groups differed regarding fear generalization, an index was calculated (Freezing in Test 2/Freezing in Test 1 + Test 2), revealing that 10S animals expressed higher generalization (center). In the open-field test, there were no differences between groups across parameters of exploratory behavior (right). (B) Animals were submitted to the 2S and 10S training protocols, and on the next day were re-exposed to the training context for 30 min to induce extinction learning. The next day, a 4 min test was performed to evaluate extinction retention. Throughout the extinction session, both groups exhibited a decrease in fear expression but 10S animals displayed significantly higher freezing. In the test session, 2S animals displayed extinction retention, with no increase in freezing in comparison to the last 5 min bin of the extinction session, whereas 10S animals displayed a return of fear to the levels of the first bin. (C) Animals were submitted to the 2S and 10S training protocols, and the next day the fear memory was reactivated by re-exposing animals to the training context for 4 min. Immediately after the reactivation session, anisomycin or its vehicle was injected i.p. to block memory reconsolidation. The efficiency of the reconsolidation was assessed the next day in a test where animals were again exposed to the conditioned context for 4 min. In the 2S group, anisomycin treatment led to a decrease in fear expression, whereas the same treatment was ineffective in the 10S group. Plots show the mean ± SEM. N = 8 per group. *p<0.05.
Figure 2
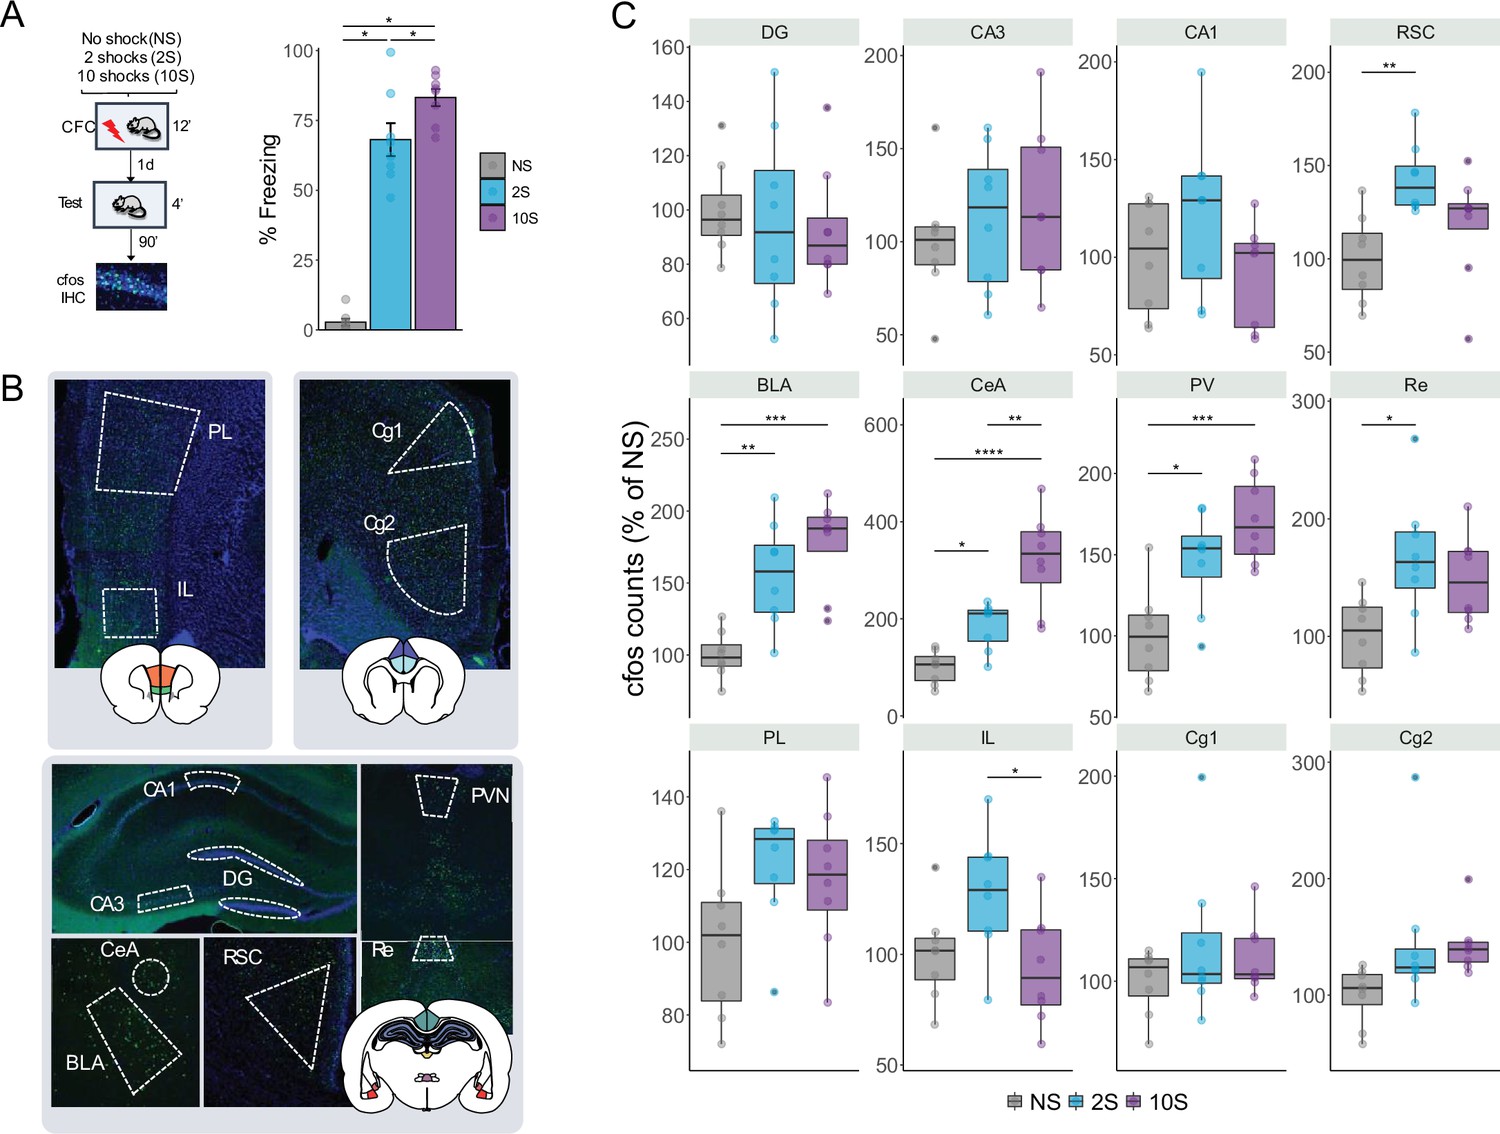
Retrieval-induced brain activation of neutral, mild, and strong fear memories.
(A) Animals were submitted to the NS, 2S, or 10S training protocols. To trigger the recall of the resulting memory, 1 d after training rats returned to the same context for 4 min, and 90 min later, brains were extracted for c-fos immunohistochemistry. During the test, animals in the 10S displayed higher freezing levels than all others, and 2S animals froze more than NS animals. (B) Boundaries of the regions targeted for c-fos quantification. Twelve regions were analyzed: in the hippocampus, the dentate gyrus (DG) and the CA3 and CA1 subfields; the basolateral (BLA) and the central (CeA) nuclei of the amygdala; the retrosplenial (RSC), infralimbic (IL), prelimbic (PL), and cingulate cortices (Cg1 and Cg2); the reuniens (Re) and paraventricular (PV) nuclei of the thalamus. (C) In the BLA, CeA, and PV, both 2S and 10S displayed higher c-fos expression than NS. In the CeA and PV, both 10S also displayed higher c-fos expression than 2S. In the Re and RSC, only the 2S group showed higher c-fos counts than the NS. In the IL, c-fos expression was reduced in the 10S group in comparison to 2S. Plots show the mean ± SEM. N = 8 per group. *p<0.05; ** p<0.01; *** p<0.001; **** p<0.0001.
Figure 3
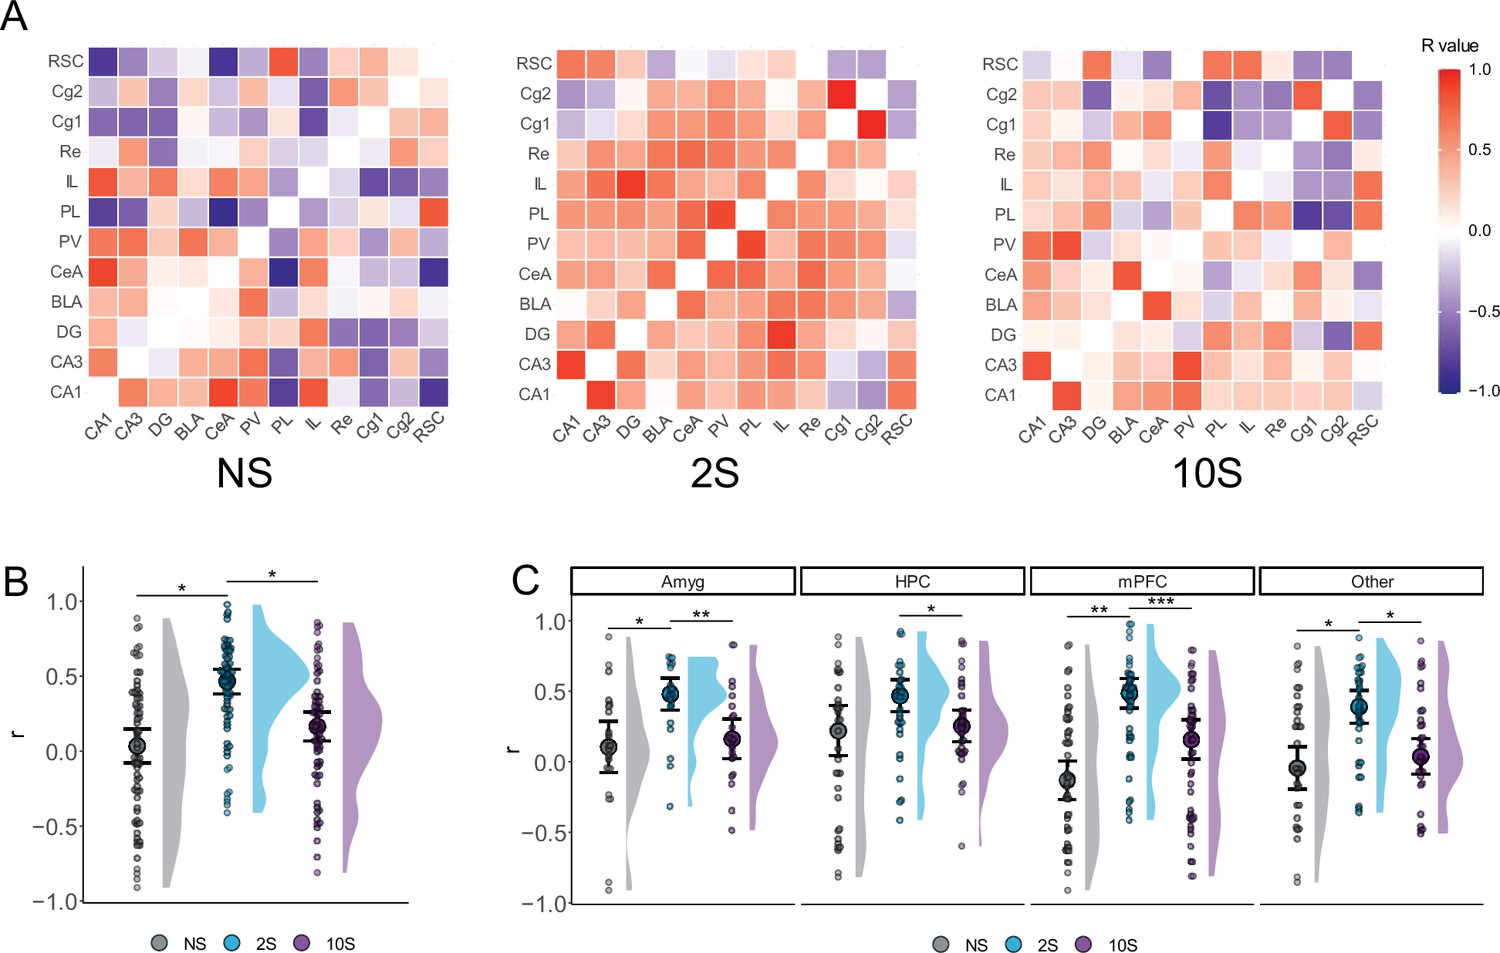
Altered functional connectivity during mild and strong fear memory recall.
(A) Color-coded matrices showing the interregional correlation values in the NS, 2S, and 10S groups. The diagonals were zeroed. (B) Mean r values were higher in the 2S group than in the others. (C) The 2S group displayed higher mean r values than the other groups in all regions except in the HPC, where it did not differ from 10S. Plots show the median ± CI. *p<0.05; ** p<0.01; *** p<0.001.
Figure 4
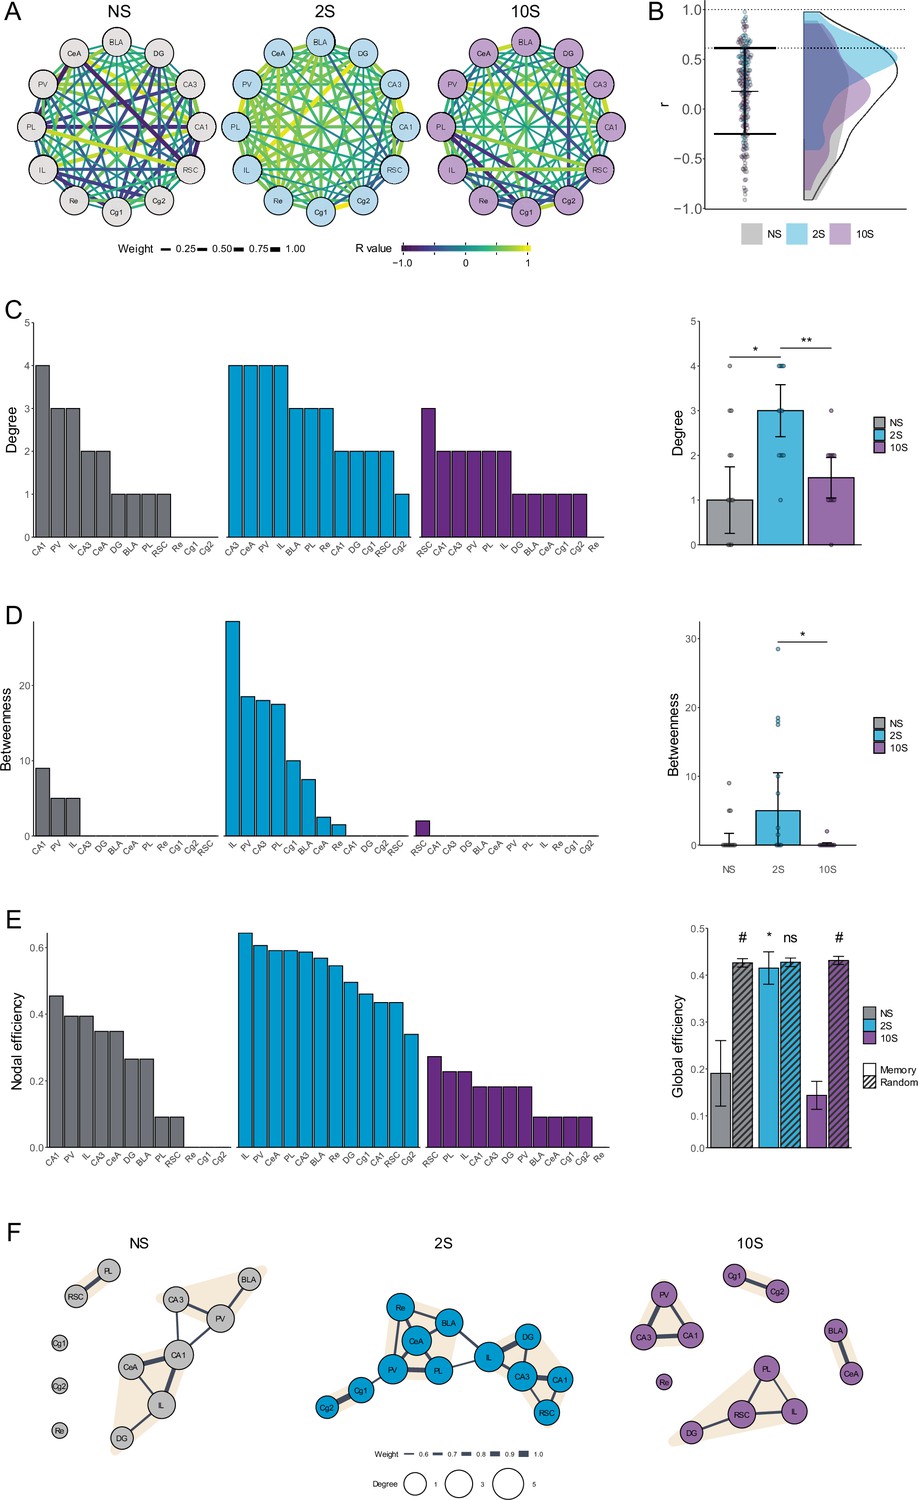
Analysis of functional brain networks engaged by the recall of mild and strong fear memories.
(A) Unfiltered networks comprising nodes representing brain regions, and edges representing the intercorrelation value between each pair of regions. The edges' width scale with its weight (absolute r-value) and colors indicate the real r-value. (B) R values that were retained after thresholding (between dotted lines) and assigned as edges in the functional memory networks. (C) Left: degree distribution in each group. Right: the mean degree was higher in the 2S group than in NS and 10S groups. * p<0.05; ** p<0.01. (D) Left: betweenness distribution in each group. Right: the mean betweenness was higher in the 2S than in NS and 10S. * p<0.05. (E) Left: nodal efficiency distribution in each group. Right: the global efficiency was higher in the 2S than in NS and 10S, and only in the 2S group it matched that of random networks with small-world configuration. * p<0.05. # Confidence interval for the difference between means > 95%.(F) Representation of the functional networks of the NS (left), 2S (center), and 10S (right) groups. The nodes represent brain regions and the edges represent the functional connections between them. The nodes' sizes are scaled according to their degree, and the edges are scaled according to their r value. Nodes detected as being part of the same cluster are highlighted with the same color. Plots show the median ± CI.
Additional files
Download links
A two-part list of links to download the article, or parts of the article, in various formats.
Downloads (link to download the article as PDF)
Open citations (links to open the citations from this article in various online reference manager services)
Cite this article (links to download the citations from this article in formats compatible with various reference manager tools)
Network-level changes in the brain underlie fear memory strength
eLife 12:RP88172.
https://doi.org/10.7554/eLife.88172.3


