Experimentally induced active and quiet sleep engage non-overlapping transcriptional programs in Drosophila
- Queensland Brain Institute, The University of Queensland, Australia
- School of BioSciences, The University of Melbourne, Australia
- Department of Neuroscience, School of Medicine, Washington University in St. Louis, United States
Figures
Figure 1
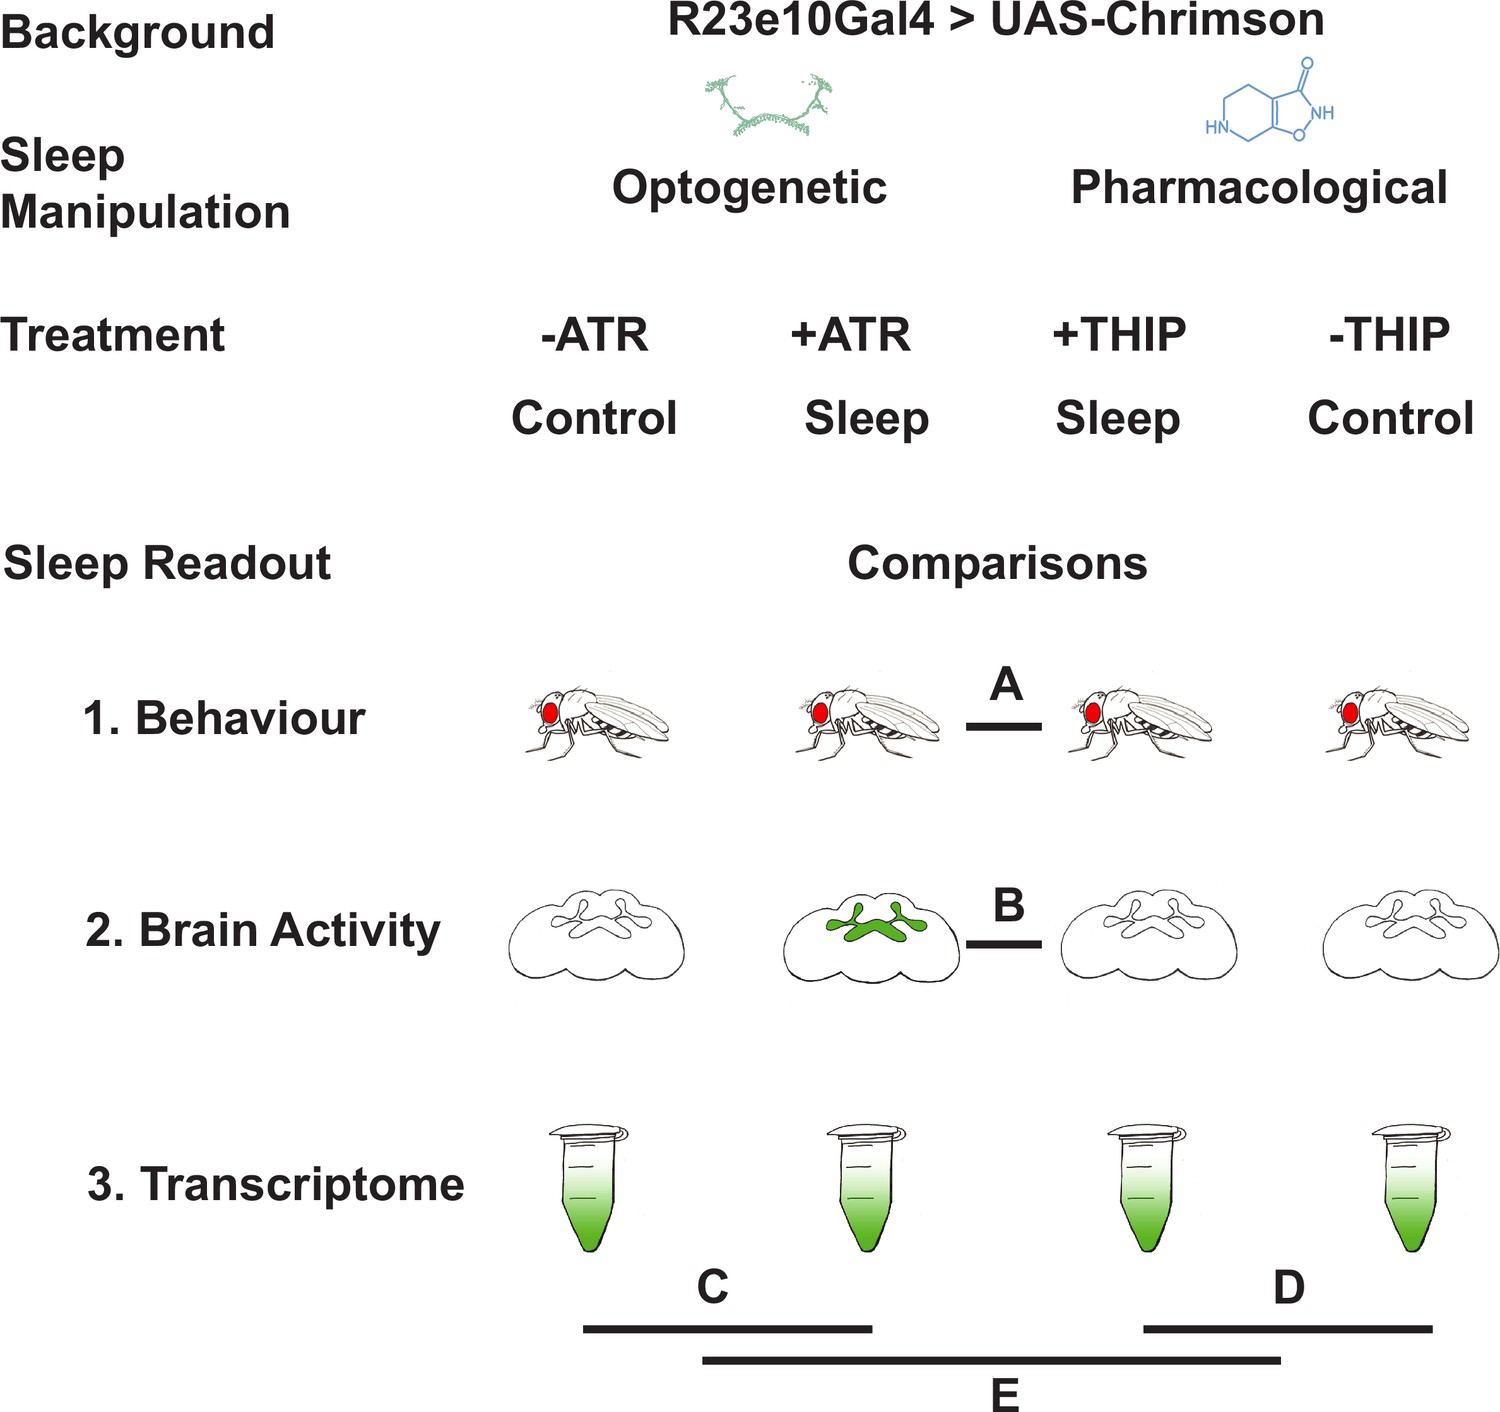
Study rationale and design.
The same genetic background strain (R23E10;UAS-Chrimson) was used for optogenetic or pharmacologically induced sleep. Flies were fed either all-trans retinal (ATR) or 4,5,6,7-tetrahyrdoisoxazolopyridin-3-ol (THIP) to promote either kind of sleep, which was assessed in three different ways: behavioral analysis, whole brain imaging, and gene expression changes. The comparisons made for each level of analysis are labeled A–E.
Figure 2
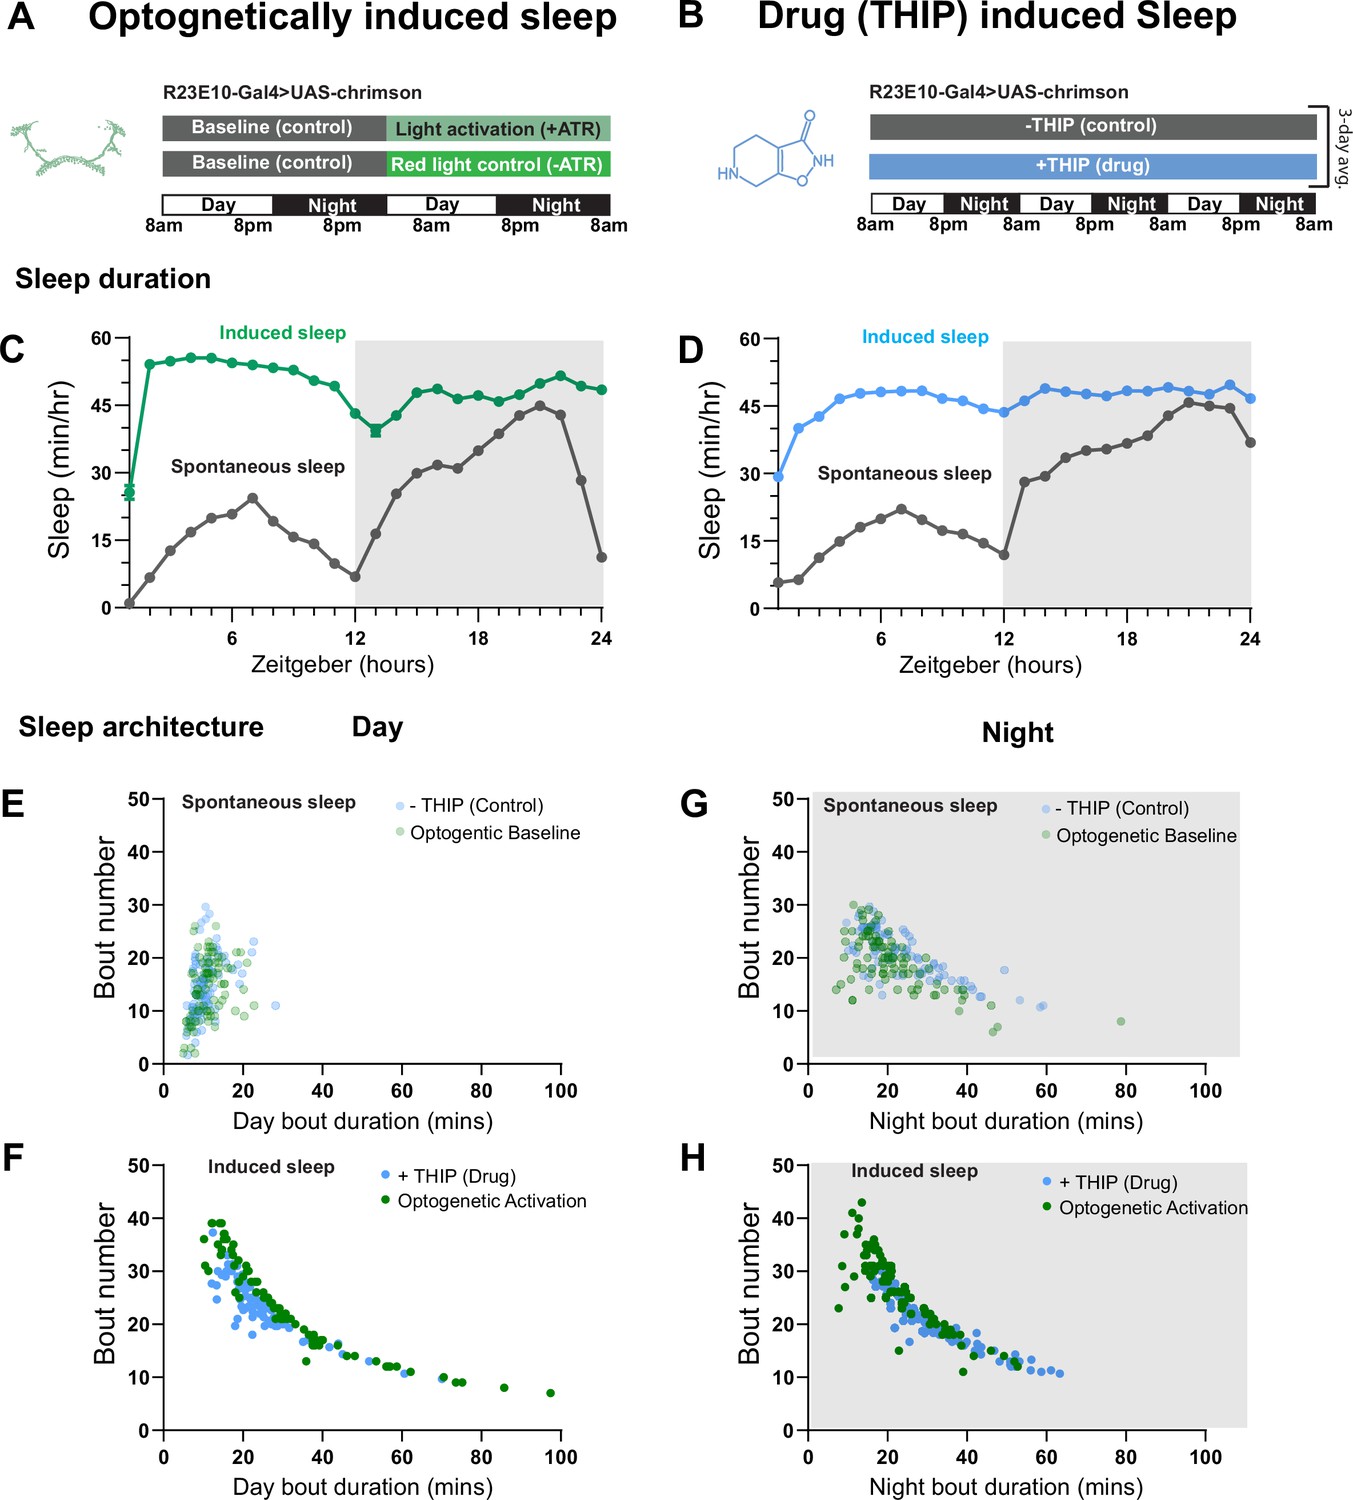
Optogenetic- and 4,5,6,7-tetrahyrdoisoxazolopyridin-3-ol (THIP)-induced sleep have similar effects on sleep duration and consolidation.
(A) Experimental regime for observing the effects of optogenetic activation and THIP provision (B). (C) Sleep profile across 24 hr in the baseline condition (gray) and optogenetic activation condition (green). (D) Three-day average of the 24 hr sleep profile of control (gray) and THIP fed (blue) flies. (E) Daytime sleep consolidation scatterplot for optogenetic baseline and THIP control flies. (F) Daytime sleep consolidation scatterplot for optogenetic- and THIP-induced sleep. (G) Night-time sleep consolidation scatterplot for optogenetic baseline and THIP control flies. (H) Night-time sleep consolidation scatterplot for optogenetic- and THIP-induced sleep. n = 87 for optogenetic activation across three replicates; n = 88 for –THIP, n = 85 for +THIP, across three replicates. Maximum bout duration possible is 720 min, or 12 hr. See Supplementary file 1 for statistics.
Figure 3
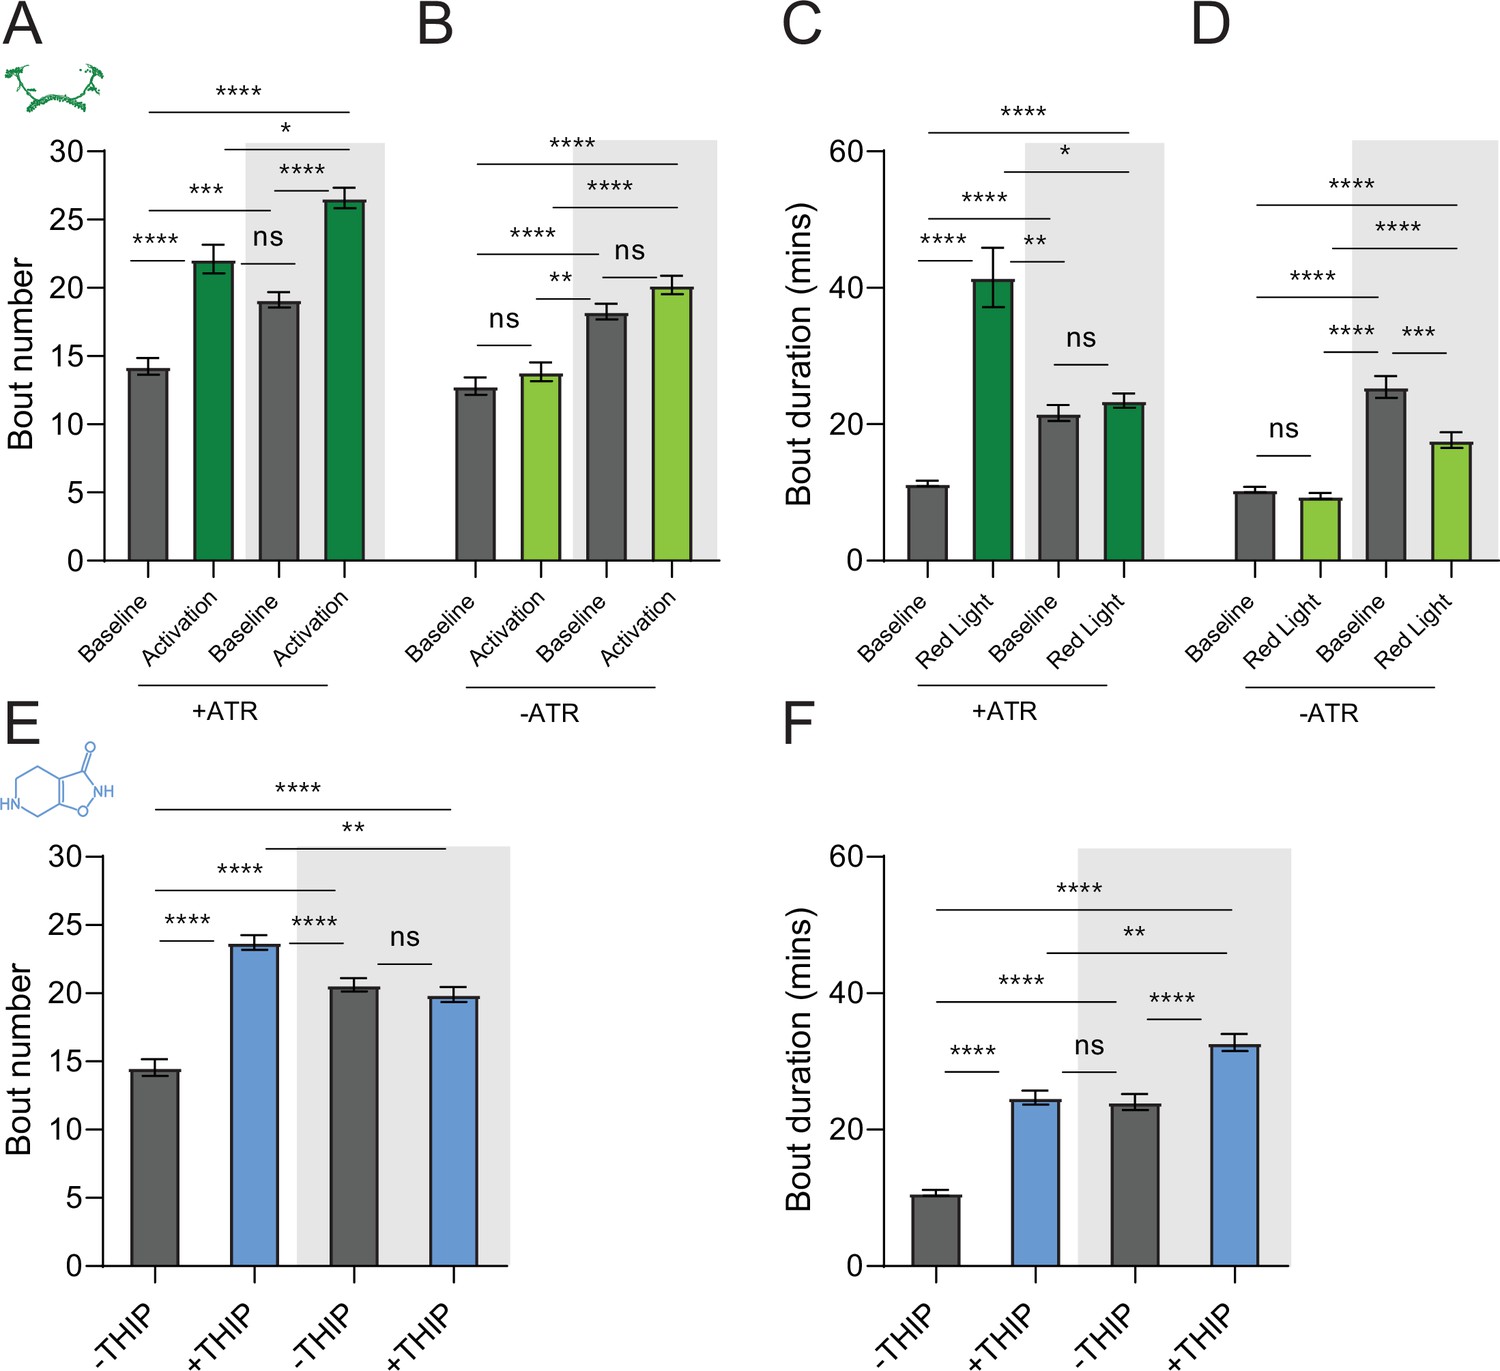
Sleep architecture in optogenetic- and 4,5,6,7-tetrahyrdoisoxazolopyridin-3-ol (THIP)-induced sleep.
(A, B) Average number of sleep bouts in control (gray) and optogenetic activation (green) conditions in the day and night for both +ATR (A) and –ATR (B) fed flies. Optogenetic-induced sleep results in an increase in the number of sleep bouts both during the day and the night, whereas red light alone has no effect. (C, D) Optogenetic activation (green) increases the average sleep duration during the day, but not the night when compared to controls (gray) in +ATR flies (C). (D) –ATR flies show no difference in mean sleep bout duration during the day, but show a decrease in average bout duration during the night. THIP (blue) increases both the average number of sleep bouts (E) and the average duration of sleep bouts (F) during the day, but not the night, when compared to controls (gray). Analysis for (A) and (B) = Kruskal–Wallis test with Dunn’s multiple-comparison correction. *p<0.05, ***p<0.001, ****p<0.0001. For (E) and (F), analysis = ordinary one-way ANOVA with Tukey’s correction for multiple comparisons. ***p<0.001, ****p<0.0001.
Figure 4
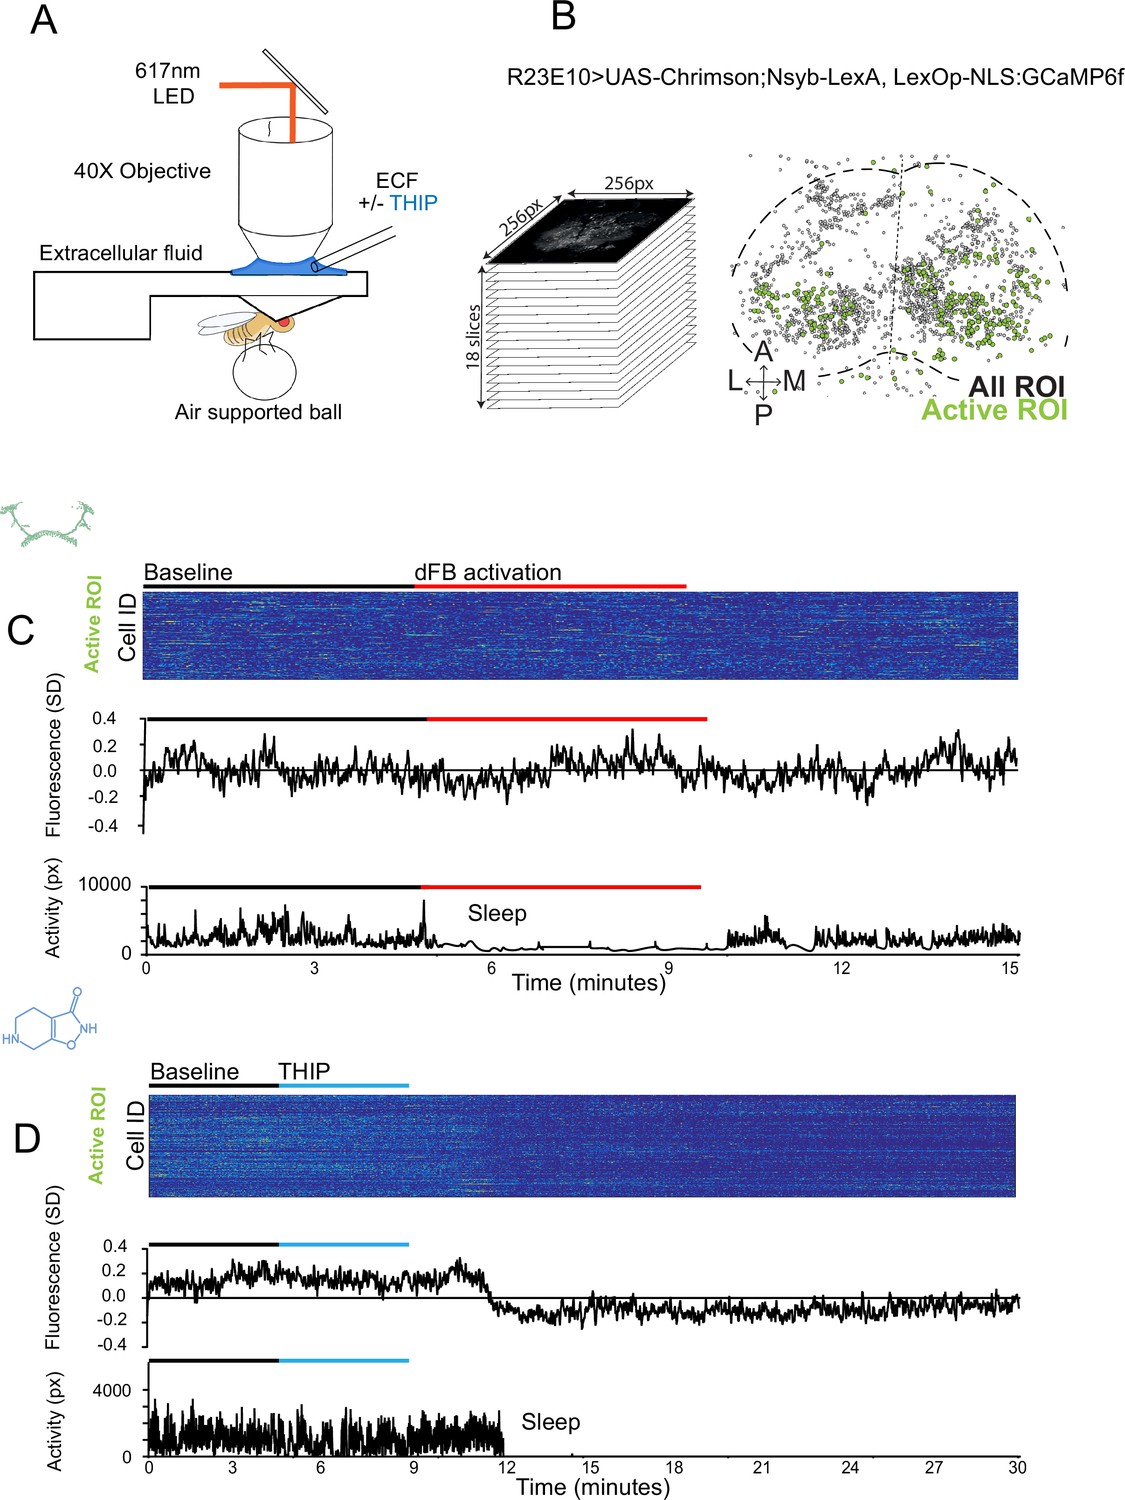
Brain imaging during optogenetic- and 4,5,6,7-tetrahyrdoisoxazolopyridin-3-ol (THIP)-induced sleep.
(A) Flies were mounted onto a custom-built holder that allowed a coronal visualization of the brain through the posterior side of the head. Perfusion of extracellular fluid (ECF) occurred throughout all experiments. A 617 nm LED was delivered to the brain through the imaging objective during optogenetic experiments. During THIP experiments, 4% THIP in ECF was perfused onto the brain through a custom perfusion system. Behavior was recorded as the movement of flies on an air-suspended ball. (B) Left: imaging was carried out across 18 z-slices, with a z-step of 6 μm. Each z-plane spanned 667 μm × 667 μm, which was captured across 256 × 256 pixels. Right: a collapsed mask from one fly of neurons found to be active (green) in (C) alongside all identified regions of interest (ROIs, gray). (C) Neural activity in an example fly brain, represented across cells (top) and as the population mean (middle) did not change following optogenetic-induced sleep (bottom). (D) Neural activity in an example fly brain, represented across cells (top) and as the population mean (middle) showed an initial high level of activity in the baseline condition, which decreased when the fly fell asleep (bottom) following THIP exposure. The Y-axis scale is standard deviation of the experiment mean, so the baseline is not absolute but rather reflects any difference with the overall experiment mean.
Figure 5
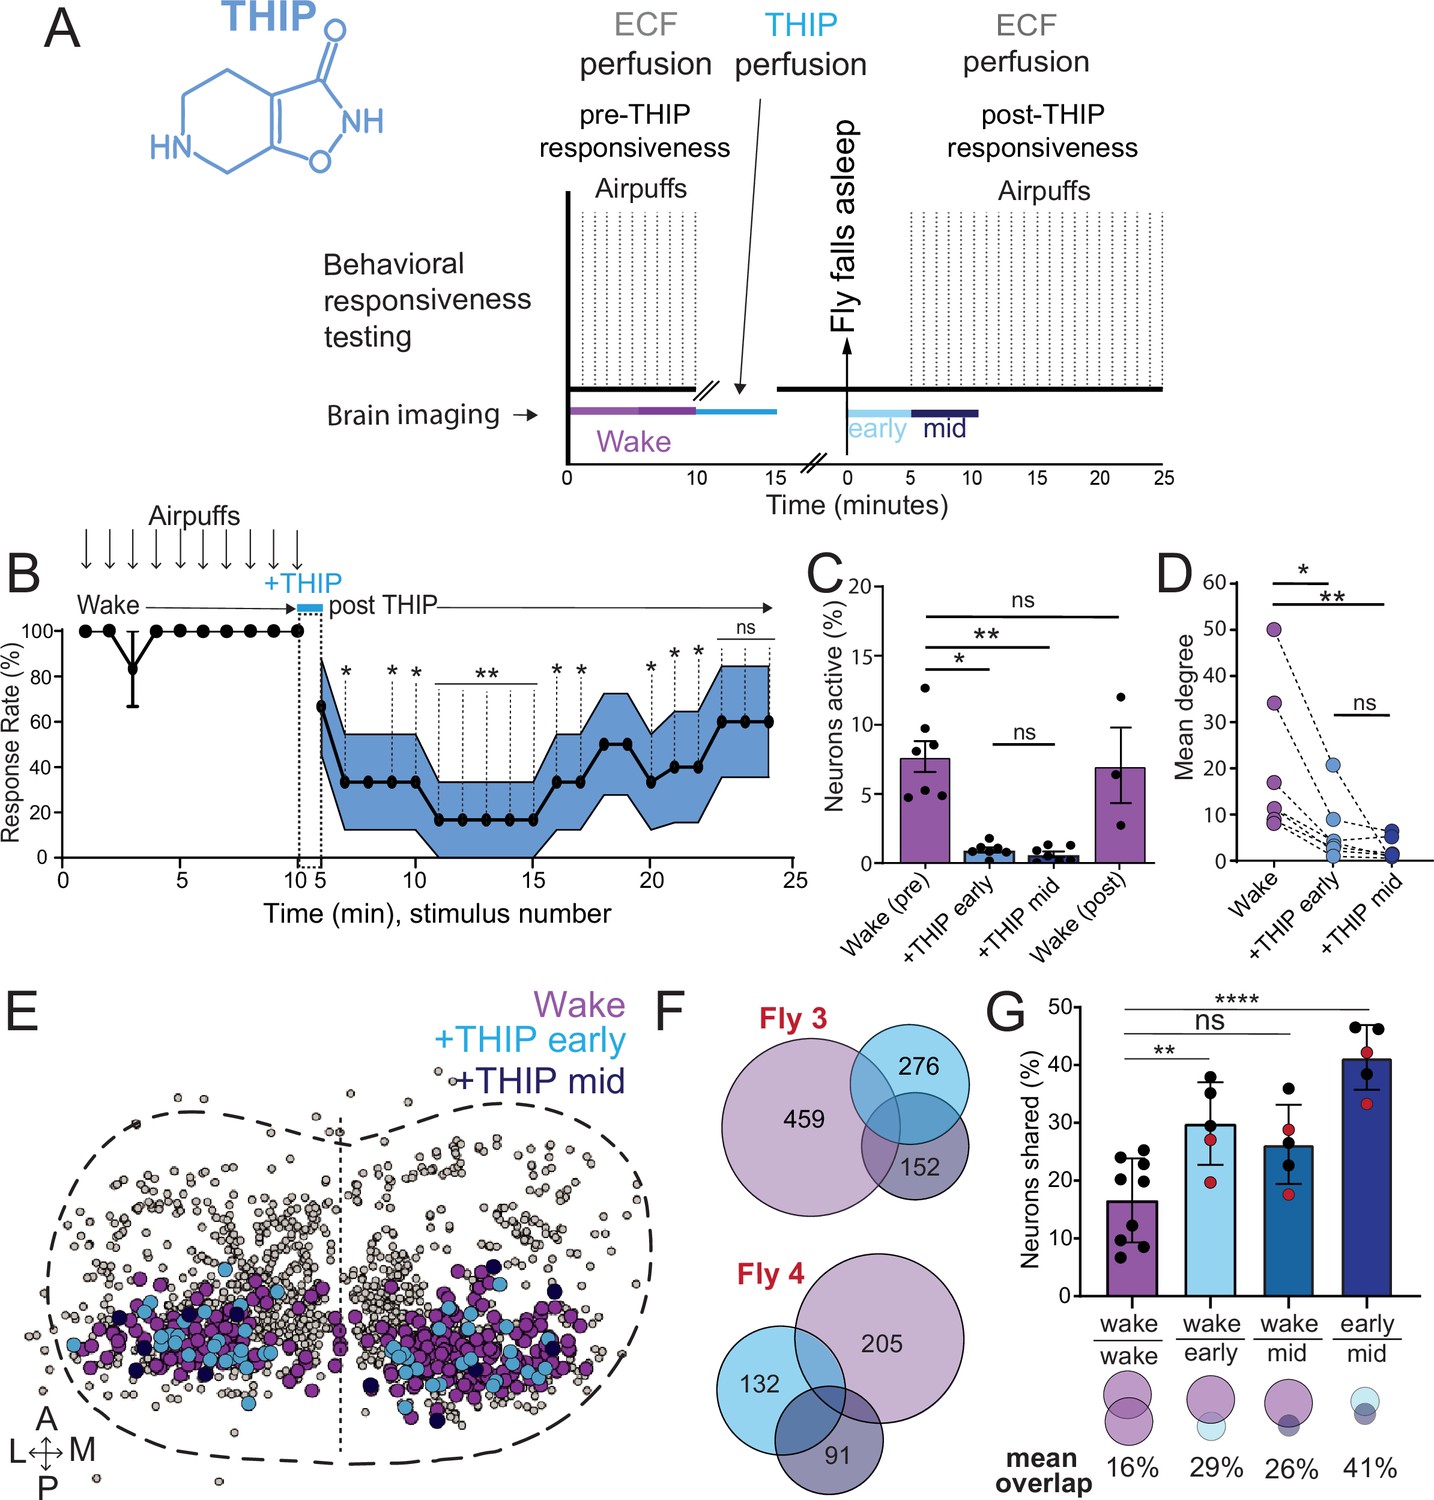
Brain activity and connectivity decrease during 4,5,6,7-tetrahyrdoisoxazolopyridin-3-ol (THIP)-induced sleep.
(A) Experimental protocol for behavioral responsiveness and brain imaging experiments. 5 min of baseline condition were recorded, during which the exposed brain was perfused with extracellular fluid (ECF), followed by 5 min of THIP perfusion. Following sleep induction, an additional 10 min of calcium activity was recorded, which was separated into ‘early’ and ‘mid’ sleep for analysis. Air puff stimuli were delivered to test for behavioral responsiveness. (B) Mean behavioral response rate (% ± SEM) to air puff stimuli over the course of an experiment (n = 6). Air puff delivery times are indicated by the solid dots. (C) Percent neurons active (± SEM) in UAS:Chrimson/X; Nsyb:LexA/+; LexOp:nlsGCaMP6f/R23E10:Gal4 flies during wake, THIP-induced sleep, and recovery (n = 9; three flies were recorded post-waking). (D) Correlation analysis (mean degree ± SEM) of active neurons in (C). (E) Collapsed mask of neurons active during wake, and both early and mid THIP sleep. (F) Overlap in neural identities between wake and THIP-induced sleep in two example flies. Number indicates active neurons within each condition; same color code as in (E). (G) Quantification of neural overlap data. Red dots indicate the flies shown in (F). n = 9 flies. All tests are one-way ANOVA with Dunnett’s multiple-comparison test. ns, not significant, *p<0.05, **p<0.01, ****p< 0.001.
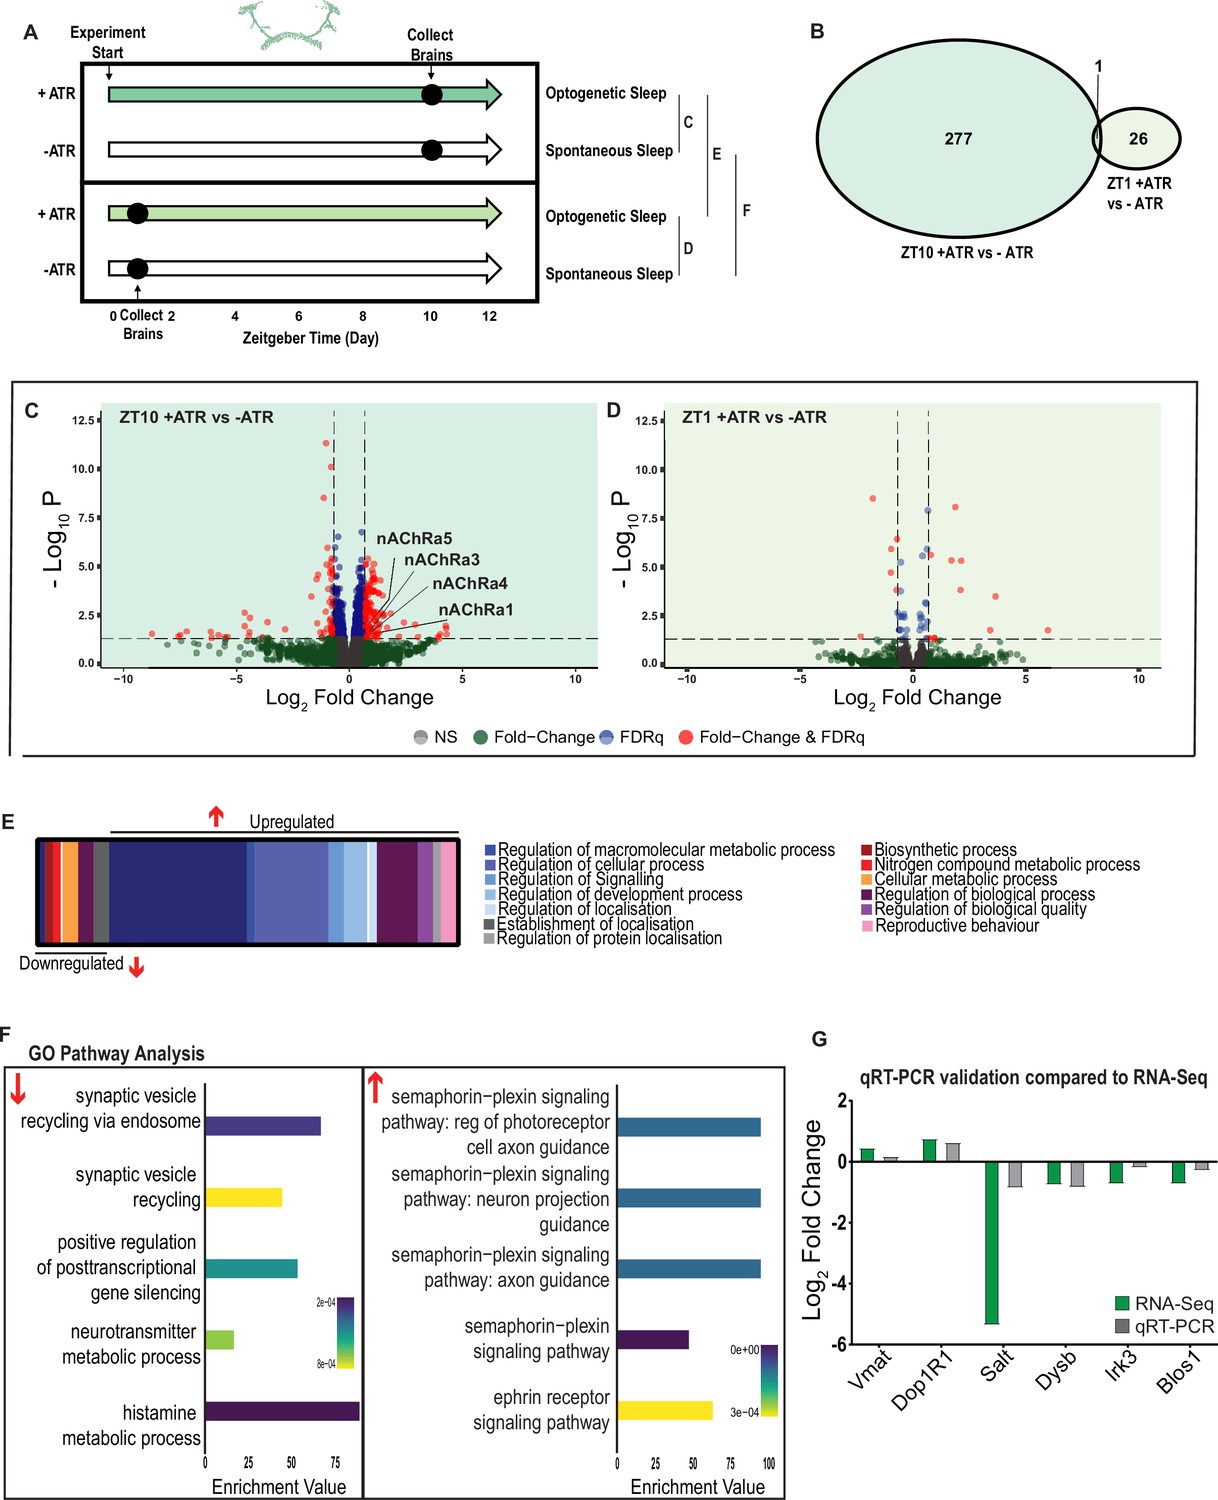
Figure 6 with 2 supplements
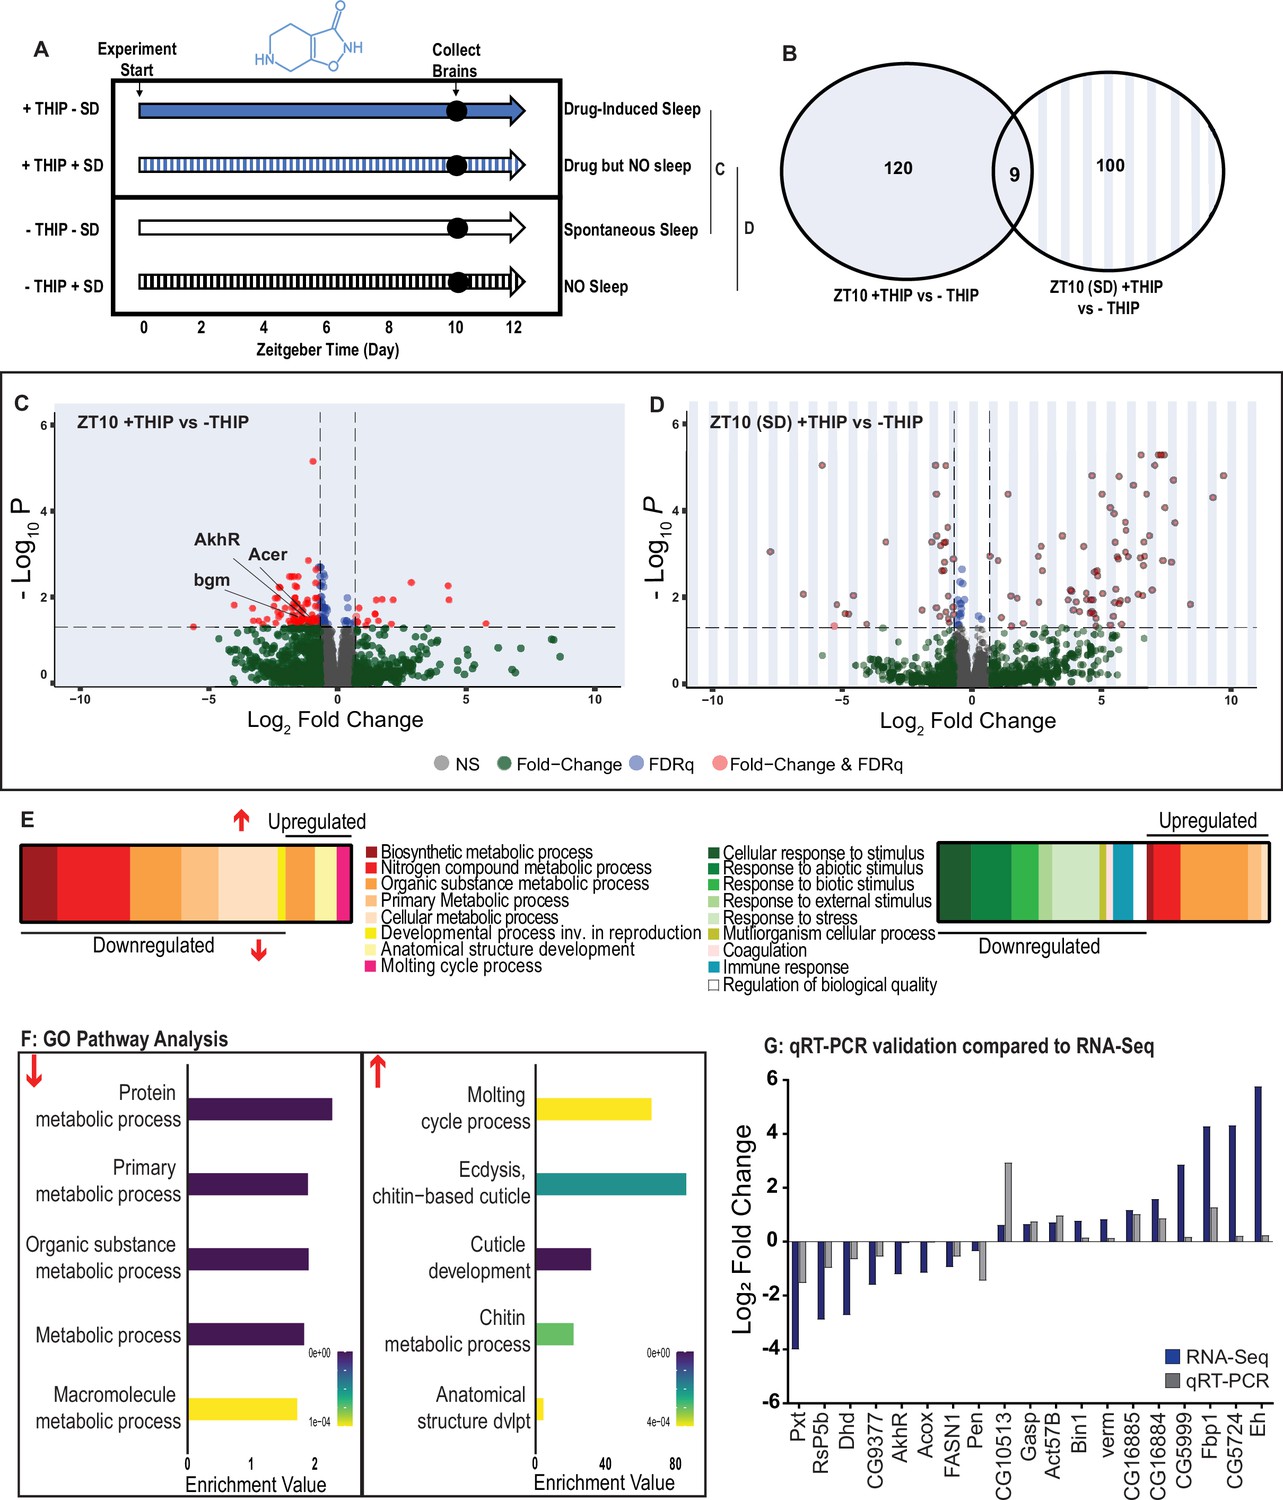
Metabolic processes are downregulated during 4,5,6,7-tetrahyrdoisoxazolopyridin-3-ol (THIP)-induced sleep.
(A) Schematic representation of the experimental set-up and samples processed using RNA-sequencing. (B) Venn diagram showing the gene expression overlap between flies that had been treated with THIP vs. their control (shaded blue) and flies that had been treated with THIP in a sleep-deprived background vs. their control (shaded blue bars). The number of significant differentially expressed genes in each category is indicated. (C) Volcano plot representing the distribution of differentially expressed genes in the presence or absence of THIP. Genes that are significantly up-/downregulated meeting a Log2Fold change of 0.58 and FDRq value of 0.05 are shown in red. Genes meeting the threshold for FDRq value only are shown in blue. Fold change only is shown in green. Those genes not meeting any predetermined criteria are shown in gray. (D) Volcano plot representing the distribution of differentially expressed genes in the presence or absence of THIP in a sleep-deprived background. Criteria as above (C). (E) Schematic representation of Gene Ontology (GO) enrichment of biological process results. Color coded to indicate parent and child terms for comparisons between groups highlighted above (C, left, D, right). (F) Bar chart representation of a subset of interesting significant GO pathway terms originating from the organic substance and primary metabolic processes for the dataset shown in (C). (G) Comparison between significant gene hits obtained via RNA-sequencing (blue) and qRT-PCR (gray) in response to THIP, represented by Log2Fold change values. See Figure 6—figure supplements 1 and 2 and Figure 6—source data 1 and 2.
-
Figure 6—source data 1
List of significant 4,5,6,7-tetrahyrdoisoxazolopyridin-3-ol (THIP)-sleep genes.
Raw data for all genes.
- https://cdn.elifesciences.org/articles/88198/elife-88198-fig6-data1-v1.xlsx
-
Figure 6—source data 2
List of significant sleep-deprivation genes in 4,5,6,7-tetrahyrdoisoxazolopyridin-3-ol (THIP)-fed flies.
Raw data for all genes.
- https://cdn.elifesciences.org/articles/88198/elife-88198-fig6-data2-v1.xlsx
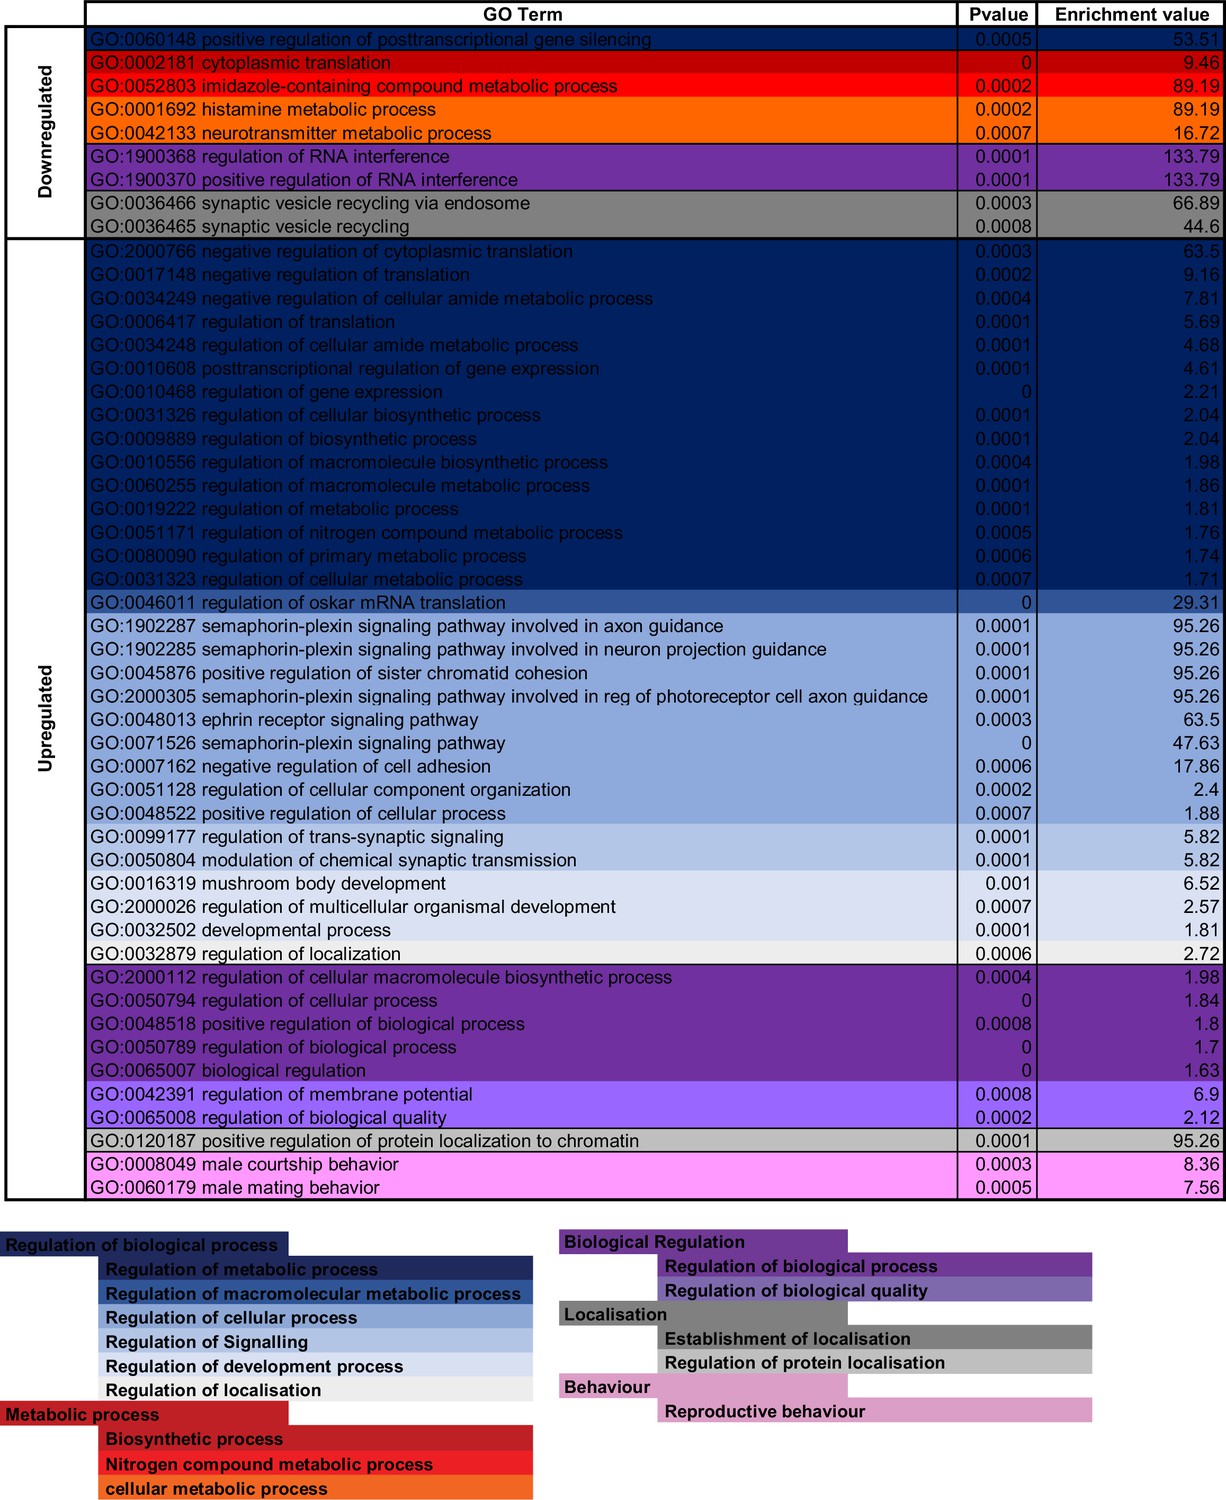
Figure 6—figure supplement 1
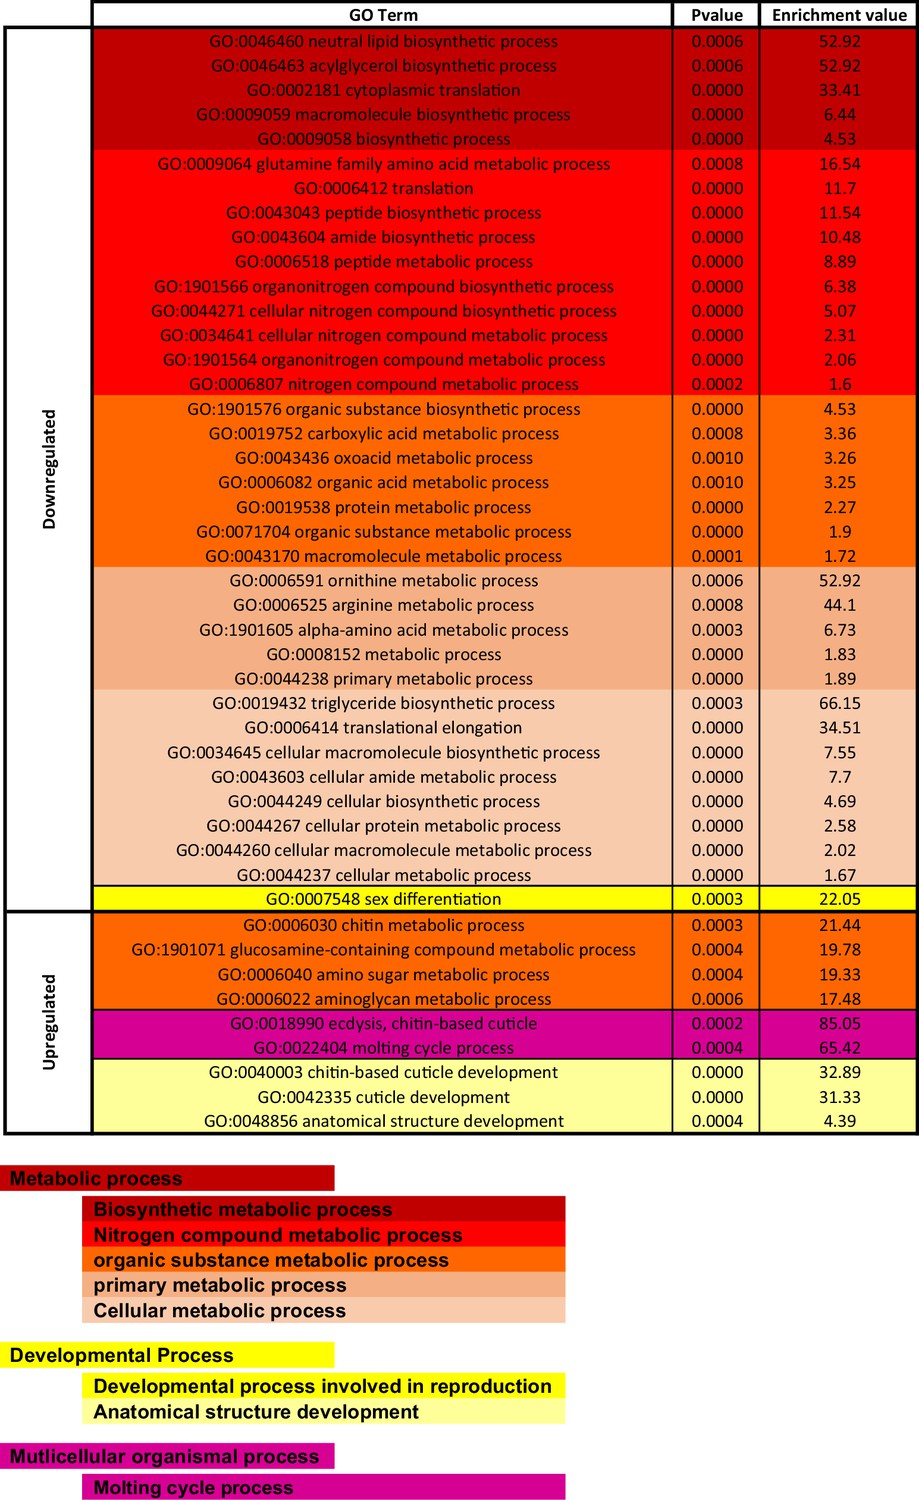
Gene Ontology (GO) enrichment analysis for 4,5,6,7-tetrahyrdoisoxazolopyridin-3-ol (THIP)-induced sleep.
Significantly downregulated and upregulated GO categories for THIP-sleep (Figure 6—source data 1), listed from most enriched at the top. Broad GO categories are identified below.
Figure 6—figure supplement 2
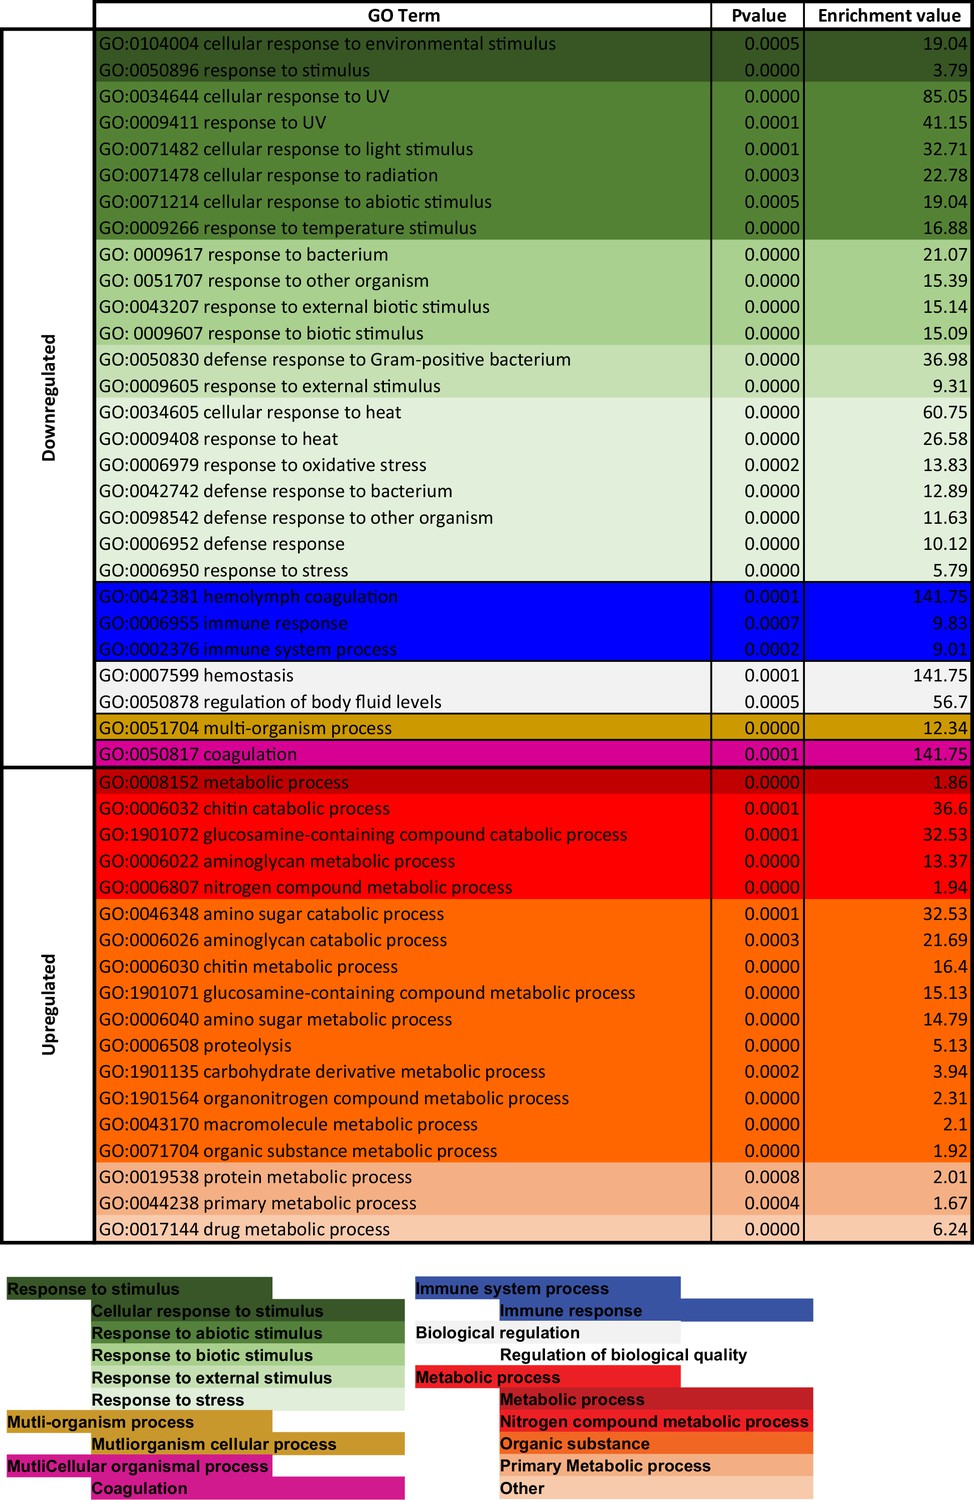
Gene Ontology (GO) enrichment analysis for 4,5,6,7-tetrahyrdoisoxazolopyridin-3-ol (THIP)-provisioned flies that were sleep deprived.
Significantly downregulated and upregulated GO categories for sleep-deprived flies (Figure 6—source data 2), listed from most enriched at the top. Broad GO categories are identified below.
Figure 7 with 3 supplements
A variety of biological processes including axon guidance are upregulated during optogenetic-induced sleep.
(A) Schematic representation of the experimental set-up and samples processed using RNA-sequencing. (B) Venn diagram showing the gene expression overlap between flies that experienced 10 hr of optogenetic-induced sleep (ZT10) compared to -ATR controls (ZT10) and those flies where optogenetic activation was restricted to 1 hr (ZT1) and compared to -ATR controls (ZT1). (C) Volcano plot representing the distribution of differentially expressed genes resulting from optogenetic optogenetic activation for 10 hr vs. control flies that were allowed to sleep spontaneously for 10 hr. Genes that are significantly up-/downregulated meeting a Log2Fold change of 0.58 and FDRq value of 0.05 are shown in red. Genes meeting the threshold for FDRq value only are shown in blue. Fold change only in green. Those genes not meeting any predetermined criteria are shown in gray. (D) Volcano plot representing the distribution of differentially expressed genes resulting from optogenetic activation for 1 hr vs. control flies that were allowed to sleep spontaneously for 1 hr. Criteria as above (C). (E) Schematic representation of Gene Ontology (GO) enrichment of biological process results. Color coded to indicate parent and child terms comparing flies that had been activated optogenetically for 10 hr vs. flies that had been allowed to spontaneously sleep for the same duration. (F) Bar chart representation of a subset of interesting significant GO pathway terms originating from the regulation of cellular processes and signaling biological processes. (G) Comparison between significant gene hits obtained via RNA-sequencing (green) and qRT-PCR (gray) in response to optogenetic sleep, represented by Log2Fold change values. See Figure 7—figure supplements 1–3 and Figure 7—source data 1–4.
-
Figure 7—source data 1
List of significant optogenetic-sleep genes after 10 hr activation.
Raw data for all genes.
- https://cdn.elifesciences.org/articles/88198/elife-88198-fig7-data1-v1.xlsx
-
Figure 7—source data 2
List of significant optogenetic-sleep genes after 1 hr activation.
Raw data for all genes.
- https://cdn.elifesciences.org/articles/88198/elife-88198-fig7-data2-v1.xlsx
-
Figure 7—source data 3
List of significant ZT10 vs. ZT1 genes in ATR+ dataset.
Raw data for all genes.
- https://cdn.elifesciences.org/articles/88198/elife-88198-fig7-data3-v1.xlsx
-
Figure 7—source data 4
List of significant ZT10 vs. ZT1 genes in ATR- dataset.
Raw data for all genes.
- https://cdn.elifesciences.org/articles/88198/elife-88198-fig7-data4-v1.xlsx
Figure 7—figure supplement 1
Gene Ontology (GO) enrichment analysis for optogenetic-induced sleep.
Significantly downregulated and upregulated GO categories for optogenetic-sleep (Figure 7—source data 1), listed from most enriched at the top. Broad GO categories are identified below.
Figure 7—figure supplement 2
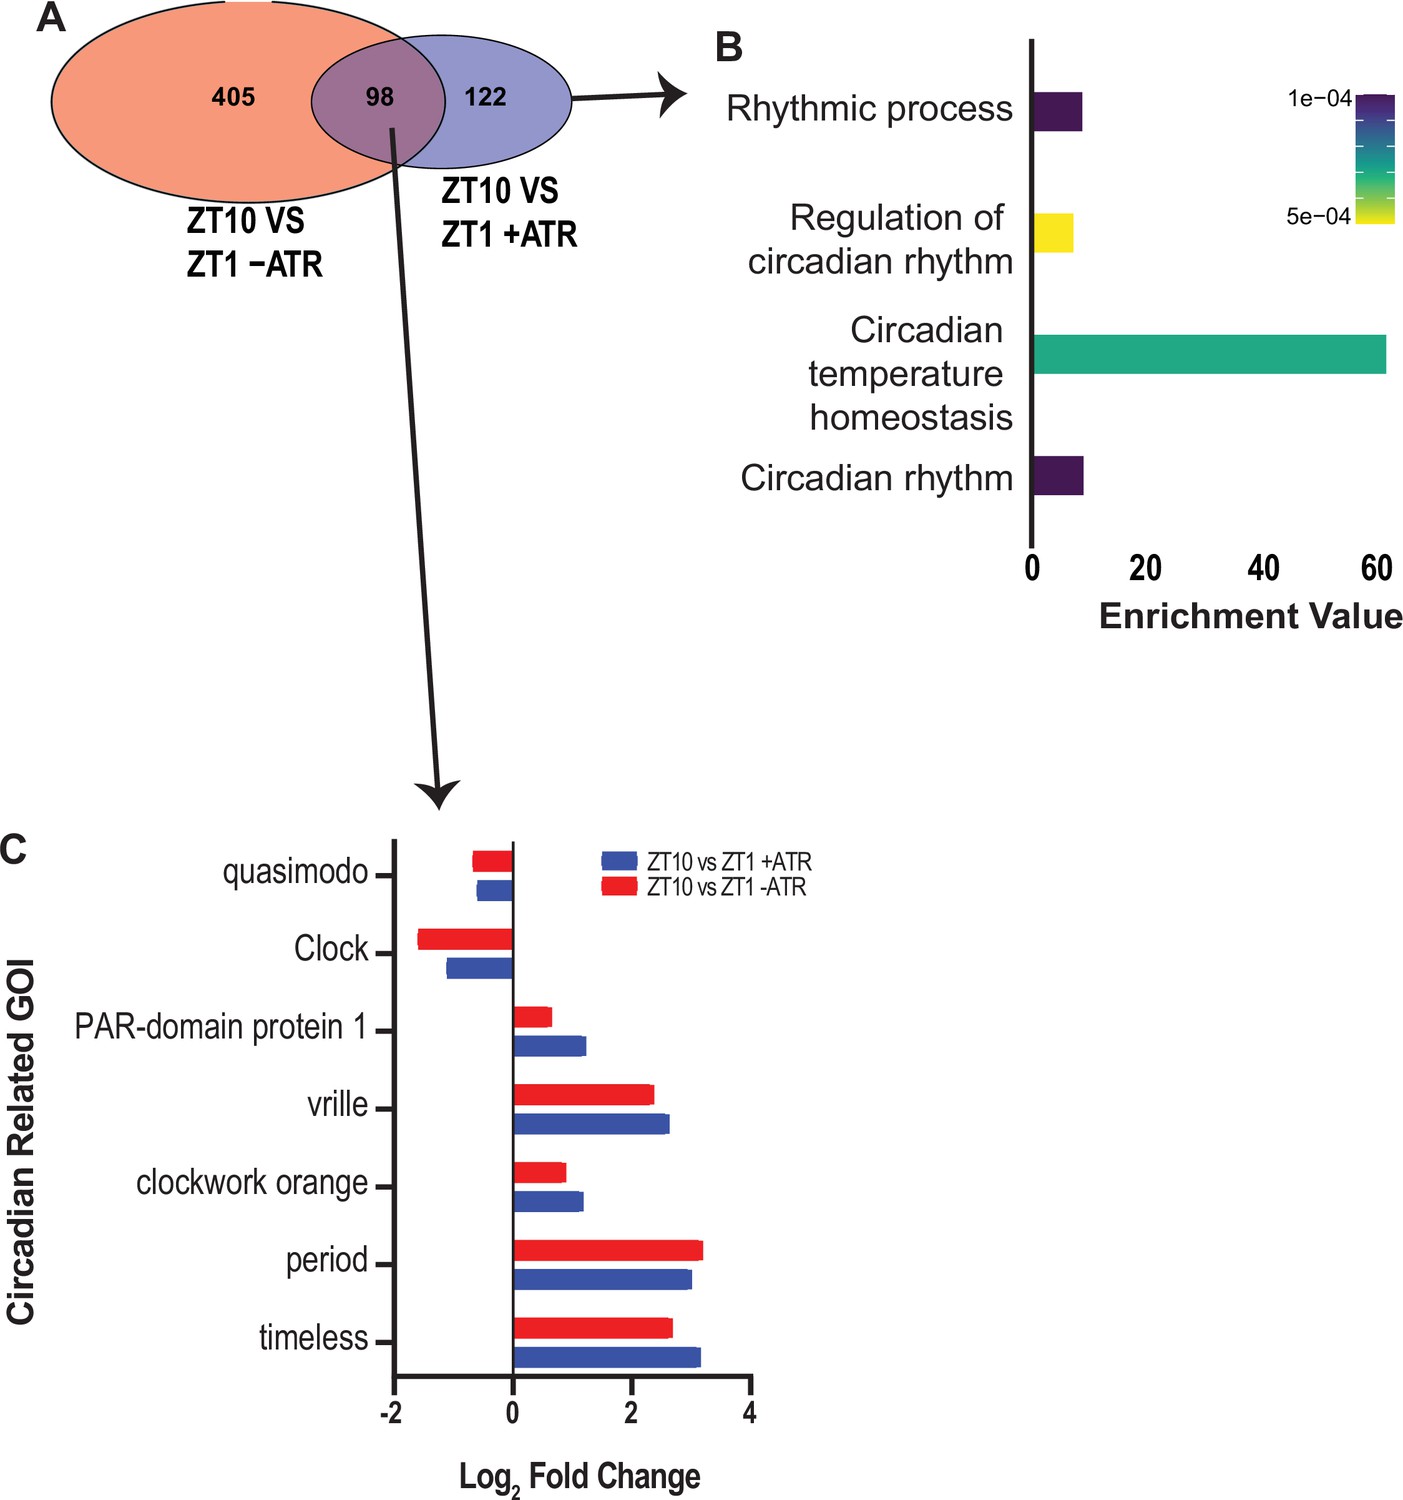
Circadian-related genes uncovered in optogenetic-sleep dataset.
(A) Zeitgeber (ZT) 10 timepoint was compared with ZT to uncover potential circadian-regulated genes in two separate datasets (-ATR and +ATR). A total of 98 genes were shared between these datasets. (B) Of the 98 shared genes, circadian-related processes were highly enriched. (C) Expression levels of seven circadian genes drawn from the two different datasets in (A).
Figure 7—figure supplement 3
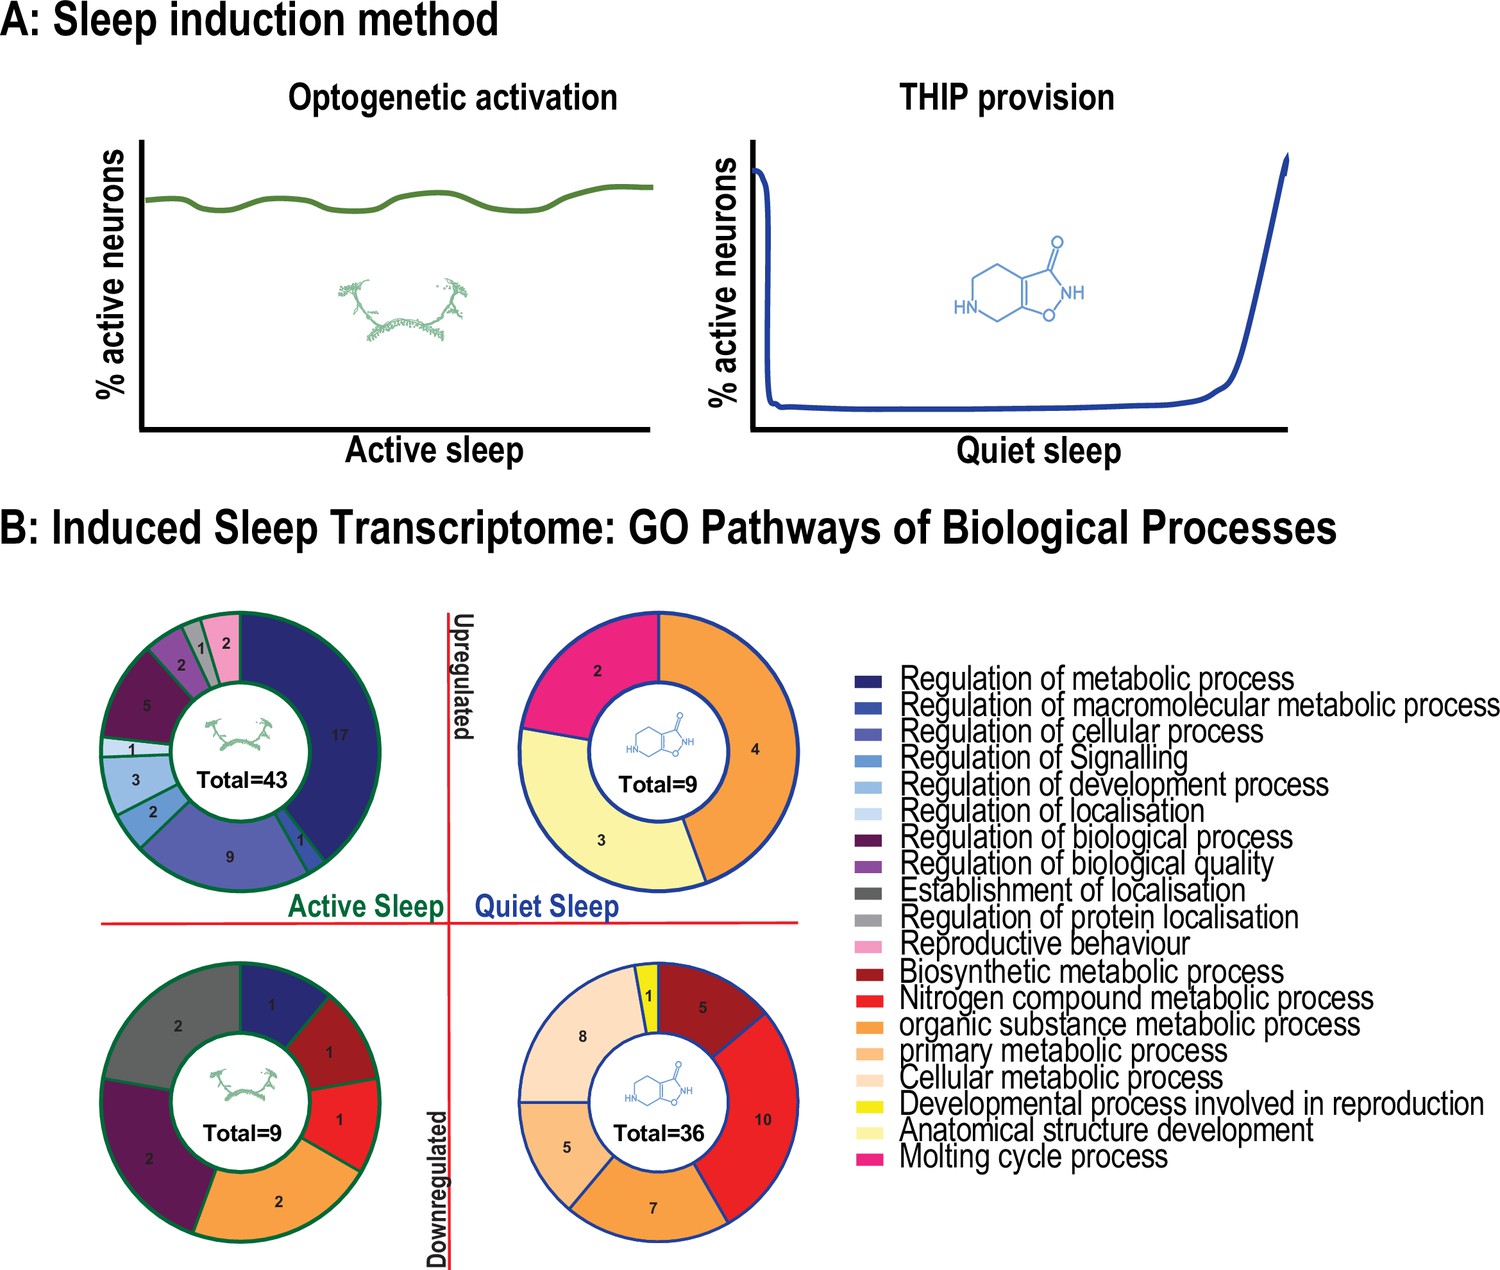
Summary of different Gene Ontology (GO) pathways engaged by optogenetic-induced sleep and 4,5,6,7-tetrahyrdoisoxazolopyridin-3-ol (THIP)-induced sleep.
(A) Either sleep induction method produces different levels of activity in the fly brain. We term optogenetic-induced sleep ‘active sleep’ because brain activity levels are not different than during wake. We term THIP-induced sleep ‘quiet sleep’ because neural activity is significant decreased already in the first 5 min. Both of these induced forms of sleep resemble sleep stages seen during spontaneous sleep in flies. (B) Number of GO pathways engaged by either induced active or quiet sleep, separated by upregulated vs. downregulated biological processes.
Figure 8 with 1 supplement
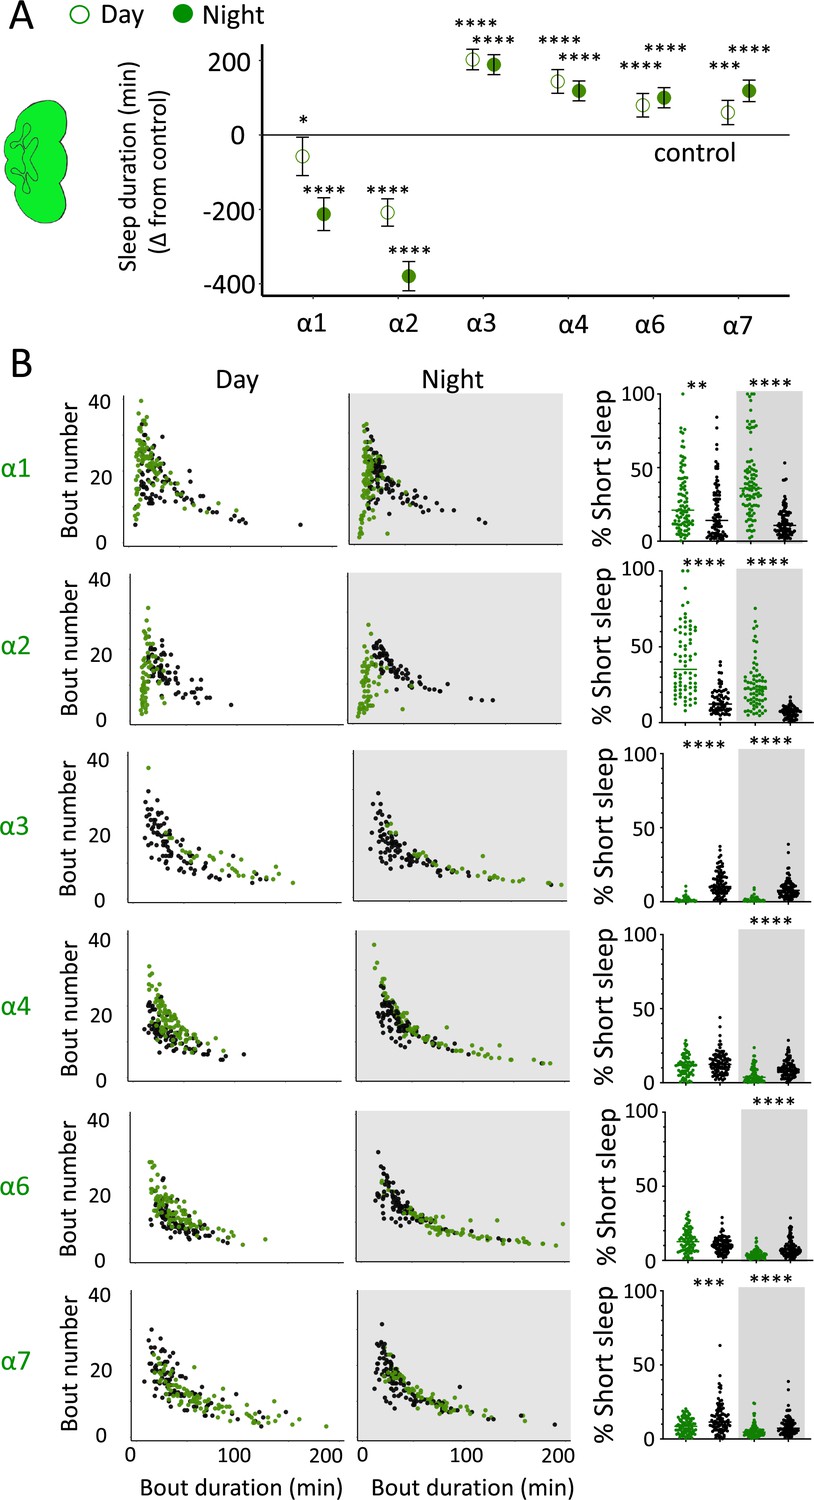
nAchRα subunit knockouts bidirectionally regulate >5 min sleep as well as short sleep.
(A) Average total day and night sleep duration (minutes ± 95% confidence intervals) in nAchRα knockout mutants, expressed as difference to their respective background controls (see ‘Materials and methods’). α1, N = 91; contro1 (X59w1118) = 93; α2, N = 70; control (w1118ActinCas9) = 65; α3, N = 43; (ActinCas9) = 91; α4, N = 87; (w1118ActinCas9) = 98; α6, N = 91; (w1118ActinCas9) = 91; α7, N = 94; (ActinCas9) = 95. *p<0.05, ***p<0.001, ****p<0.0001 by t-test adjusted for multiple comparisons. (B) Left two panels: sleep architecture for the same six knockout strains as in (A) (green), shown against their respective controls (black). Each datapoint is a fly. Right panels: cumulative short sleep (1–5 min) expressed as a percentage of total sleep duration. Data are from the same experiment as in (A, B). Each datapoint is a fly. **p<0.01, ***p<0.001, ****p<0.0001 Mann–Whitney U test. All data were collected over 3 days and 3 nights and averaged.
Figure 8—figure supplement 1
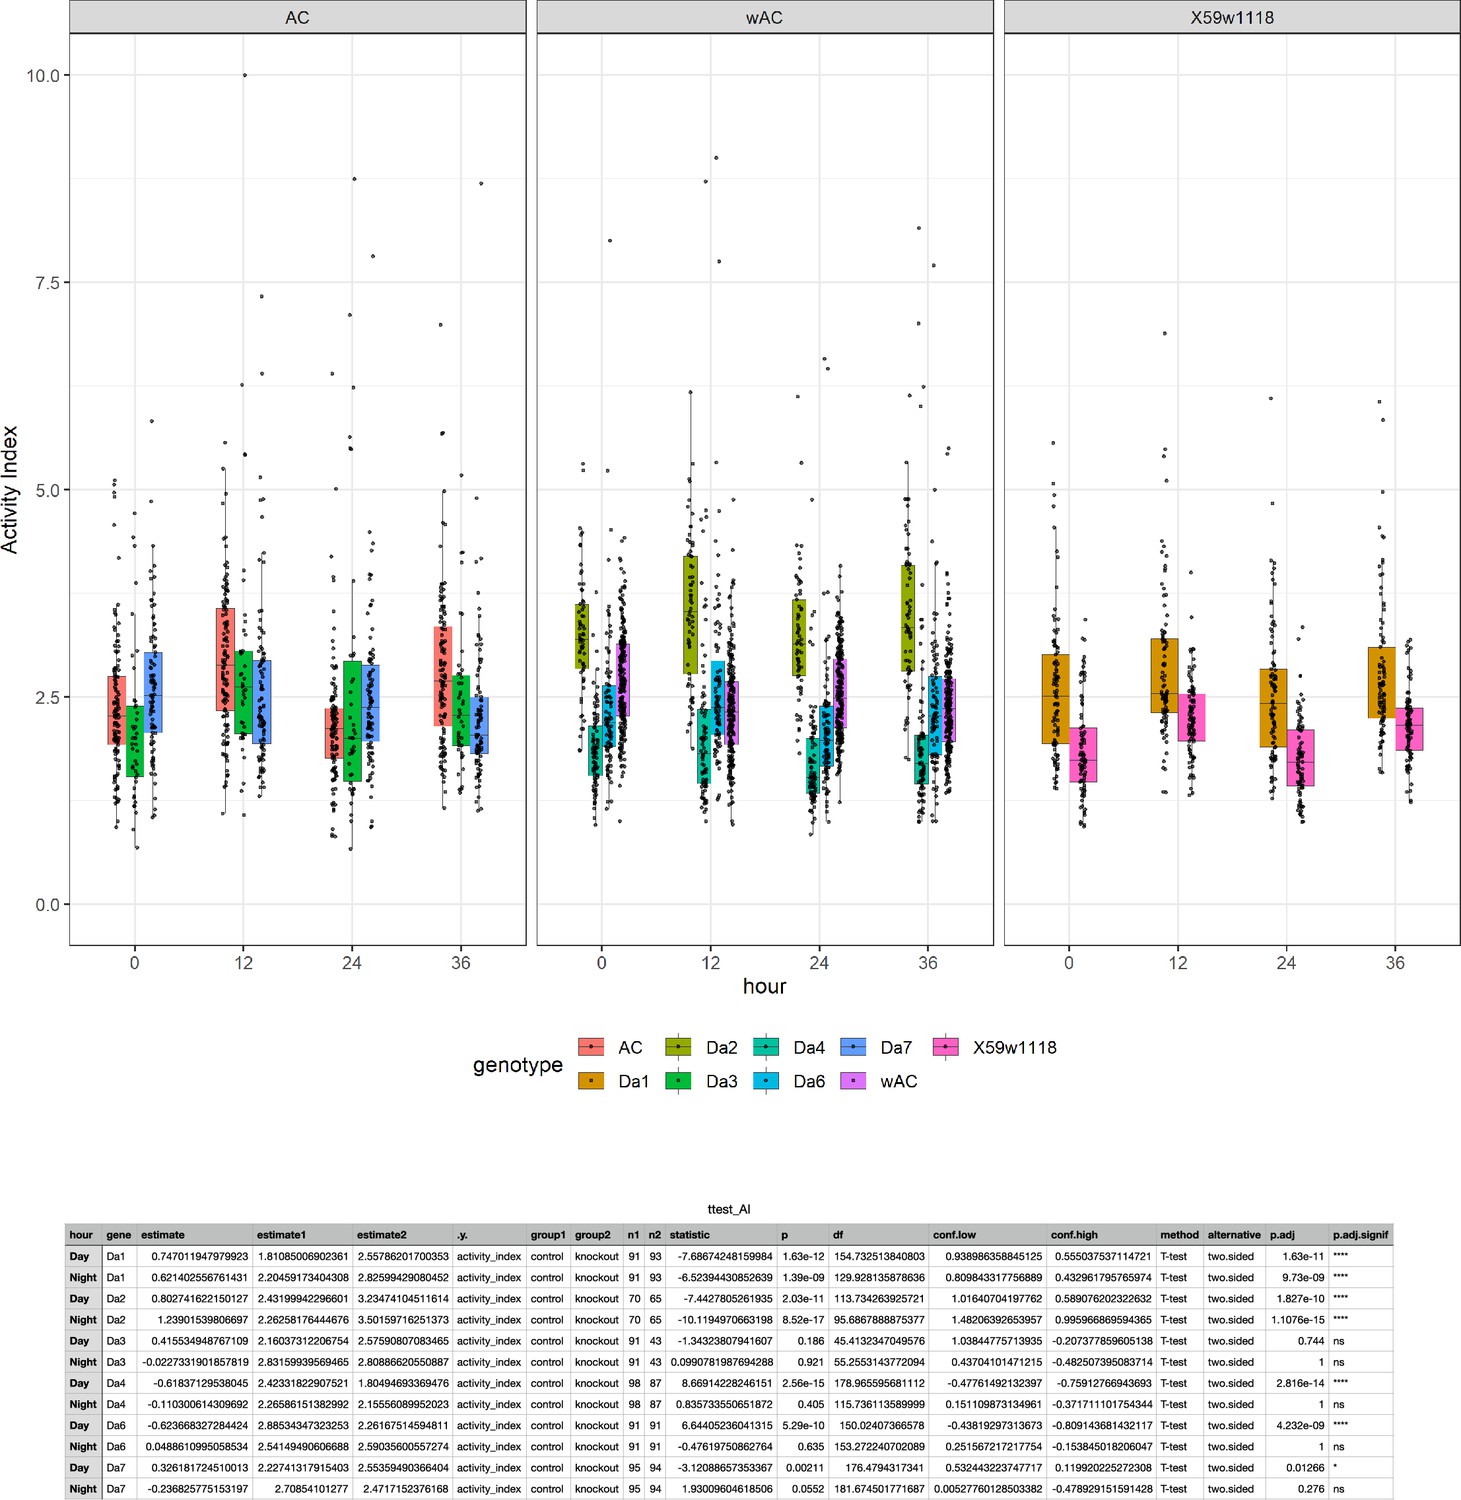
Waking activity levels of nAchRα knockout mutants.
Top: mutants are compared to their genetic background strain. Da1−7 = nAchRα1–7. Bottom: statistical tests for waking activity levels in each knockout compared to its genetic control, during both day and night.
Figure 9
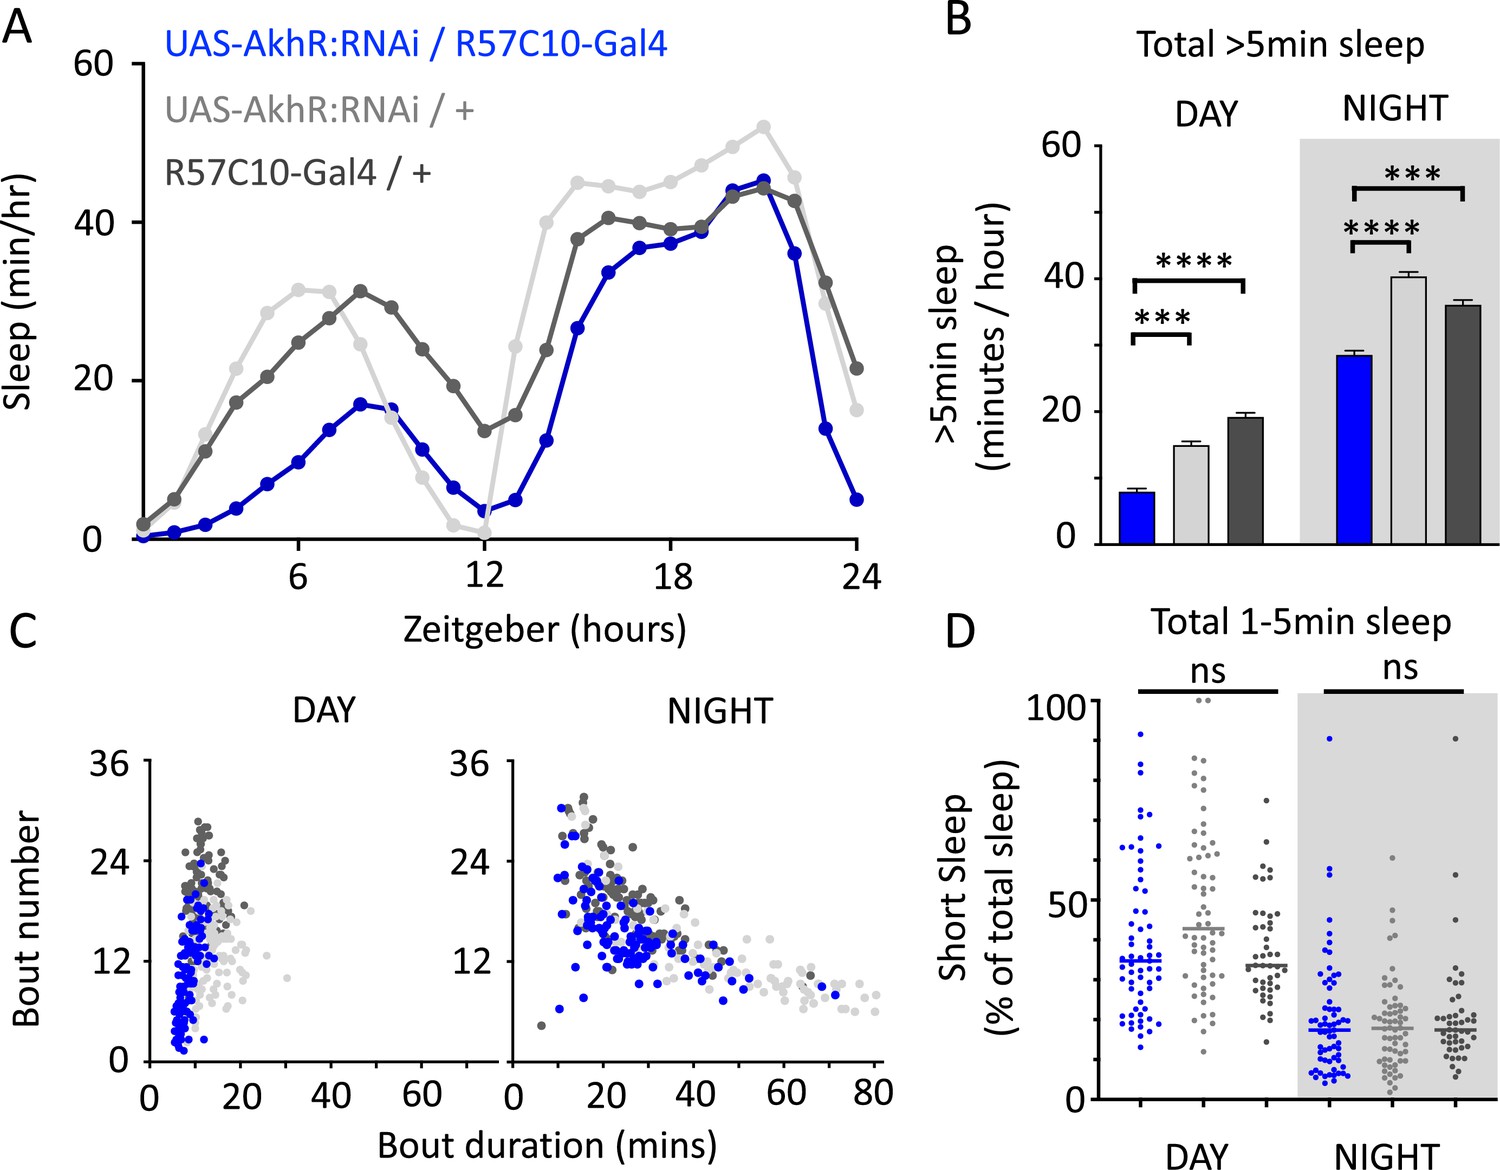
AkhR knockdown decreases >5 min sleep but not short sleep.
(A, B) Total sleep (>5 min) in UAS-AkhR:RNAi/R57C10-Gal4 flies (blue, N = 126) compared to genetic controls (light gray: UAS-AkhR:RNAi/+, N = 124; dark gray: R57C10-Gal4/+, N = 120). (C) Sleep architecture (average bout duration vs. bout number per fly) in data from (A, B). (D) Cumulative short sleep (1–5 min, expressed as a % of total sleep) in UAS-AkhR:RNAi/R57C10-Gal4 flies (blue) compared to genetic controls (light gray: UAS-AkhR:RNAi/+; dark gray: R57C10-Gal4/+). Wild-type background (+) is Canton-S(w1118). Each datapoint is a fly. ***p<0.001, ****p<0.0001 Mann–Whitney U test. ns, not significant. All data were collected over 2 days and 2 nights and averaged.
Figure 10
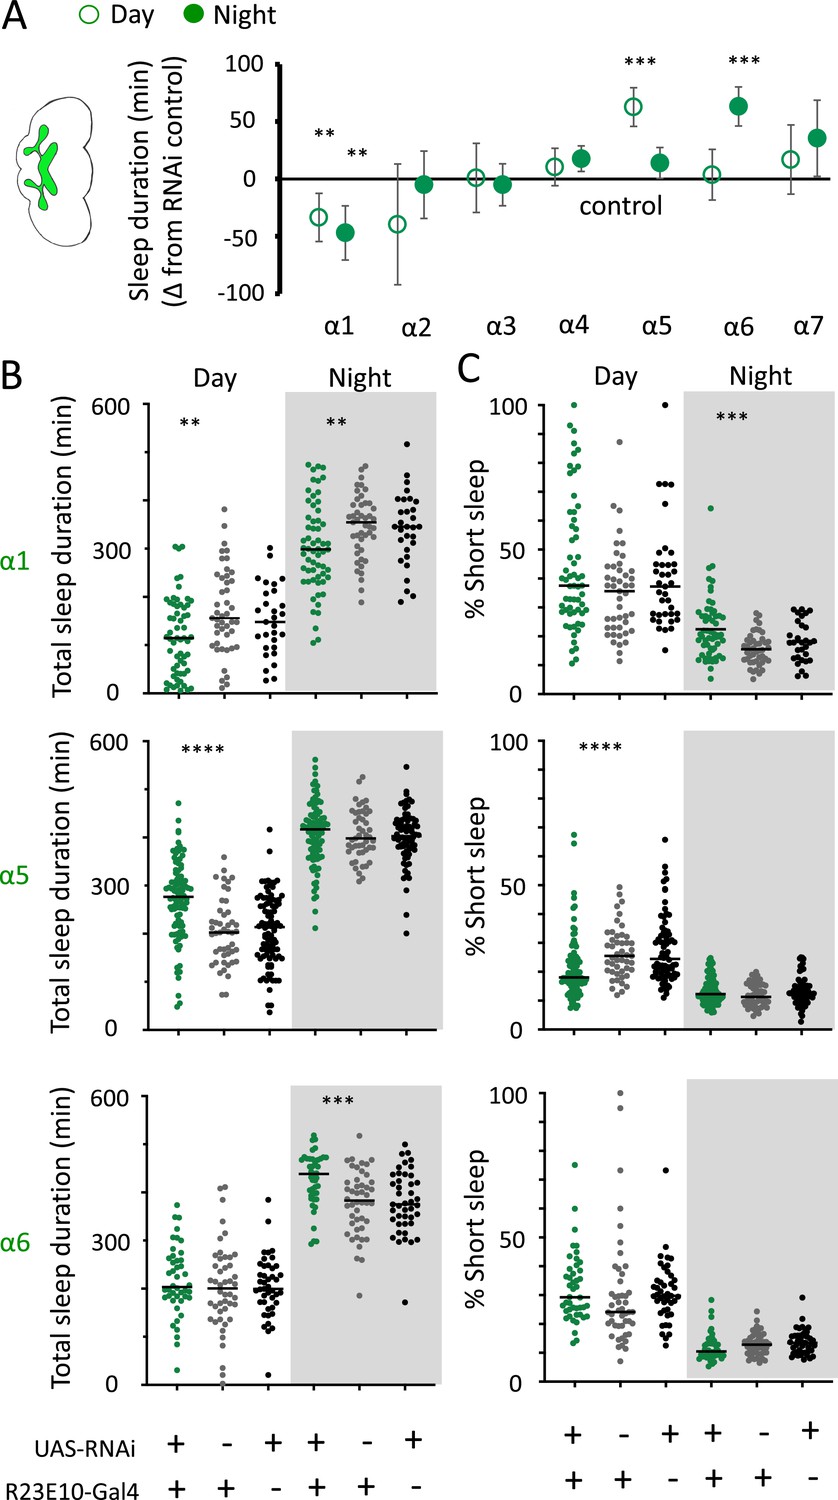
nAchRα subunit knockdowns in sleep-promoting neurons.
(A) Average total day and night sleep duration (minutes ± 95% confidence intervals) in UAS-nAchRα RNAi/R23E10-Gal4 flies, expressed as difference to RNAi/+controls (all were also compared Gal4/+controls, not shown). α1 N = 60, Gal4 N = 45, RNAi N = 37; α2 N = 21, Gal4 N = 24, RNAi N = 50; α3 N = 33, Gal4 N = 50, RNAi N = 59; α4 N = 92, Gal4 N = 90, RNAi N = 80; α5 N = 94, Gal4 N = 47, RNAi N = 74; α6 N = 44, Gal4 N = 47, RNAi N = 43; α7 N = 32, Gal4 N = 57, RNAi N = 44. **p<0.01, ***p<0.001 by t-test adjusted for multiple comparisons. (B) Total >5 min sleep duration data for significant knockdowns in (A). (C) Cumulative short sleep (1–5 min) expressed as a percentage of total sleep duration. Data are from the same experiment as in (A, B). Each datapoint is a fly. ***p<0.001, ****p<0.0001 Mann–Whitney U test. All data were collected over 2 days and 2 nights and averaged.
Author response image 1

Short sleep in optogenetic experiments.
A. Average baseline ( ± SEM) 1-5min sleep across a day and night. B. Average ( ± SEM) 1-5min sleep in optogenenetically-activated flies, across a day and night.
Author response image 2

Flies were fed blue dye in their food while being sleep deprived (SD), or while being induced to sleep with 0.
1mg/ml THIP in their food, or both. Dye consumption was measured in triplicate for pooled groups of 16 flies. Average absorbance at 625nm (±stan dev) is shown. Experiments were not significantly different (ANOVA of means).
Author response image 3

THIP-induced sleep resembles quiet spontaneous sleep.
A. Calcium imaging data from spontaneously sleeping flies, taken from Tainton-Heap et al, 2021. Left, percent neurons active; right, mean degree, a measure connectivity among active neurons. Both measures decrease during later stages of sleep. B. Calcium imaging data from flies induced to sleep with 5min of 0.2mg/ml THIP perfusion (this study). Left, percent neurons active; right, mean degree. Both measures are significantly decreased, resembling the later stages of spontaneous sleep, which we have termed ‘quiet sleep. Hence THIP-induced sleep resembles quiet sleep. Note that the genetic background is different in A and B, hence the different baseline activity levels.
Author response image 4
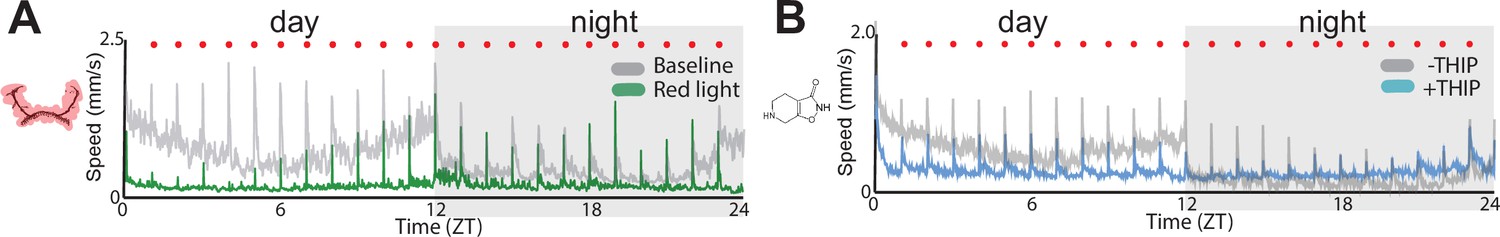
Responsiveness to mechanical stimuli.
(A) The average speed of baseline (grey) and optogenetically-activated flies (green) across 24 hours. Red dots indicate vibration stimulus times. (B) The average speed of control (grey) and THIP-fed flies (blue) across 24 hours. Flies are all R23E10/Chrimson. N = 87 for optogenetic, n = 88 for -THIP, n = 85 for +THIP.
Author response image 5

Data from THIP feeding experiment (Figure 2B) in manuscript, separated into 3 successive days and nights, with THIP-fed flies (blue) compared to controls (white).
Averages ± SD are shown, samples sizes are the same as in Figure 2D. No THIP data was significantly different across days and nights (ANOVA of means).
Additional files
-
Supplementary file 1
A comparison of sleep duration profiles (min/hr) during optogenetic and THIP-induced sleep.
Tested with two-way ANOVA with Tukey’s multiple-comparison test.
- https://cdn.elifesciences.org/articles/88198/elife-88198-supp1-v1.docx
-
Supplementary file 2
Raw data and statistics for RT-qPCR experiments.
- https://cdn.elifesciences.org/articles/88198/elife-88198-supp2-v1.xlsx
-
Supplementary file 3
Primer list for RT-qPCR validation experiments.
- https://cdn.elifesciences.org/articles/88198/elife-88198-supp3-v1.xlsx
-
Supplementary file 4
Readme file explaining how to access various components in the datasets made available.
- https://cdn.elifesciences.org/articles/88198/elife-88198-supp4-v1.docx
Download links
A two-part list of links to download the article, or parts of the article, in various formats.
Downloads (link to download the article as PDF)
Open citations (links to open the citations from this article in various online reference manager services)
Cite this article (links to download the citations from this article in formats compatible with various reference manager tools)
Experimentally induced active and quiet sleep engage non-overlapping transcriptional programs in Drosophila
eLife 12:RP88198.
https://doi.org/10.7554/eLife.88198.3


