Cell-type-specific control of secondary cell wall formation by Musashi-type translational regulators in Arabidopsis
- Laboratoire Génome et Développement des Plantes, Université de Perpignan via Domitia, CNRS, UMR5096, France
- Laboratoire de Recherche en Sciences Végétales, Université de Toulouse III, CNRS, INP, UMR5546, France
- FRAIB-CNRS Plateforme Imagerie, France
- Biopolymères Interactions Assemblages, UR1268 BIA, INRAE, France
- PROBE research infrastructure, BIBS Facility, INRAE, France
- Plateforme Protéomique Strasbourg Esplanade de CNRS, Université de Strasbourg, France
- Université Grenoble Alpes, INSERM, UA13 BGE, CNRS, CEA, FR2048, France
- Institut de Biologie Moléculaire des Plantes, IBMP, CNRS, Université de Strasbourg, France
Figures
Figure 1 with 3 supplements
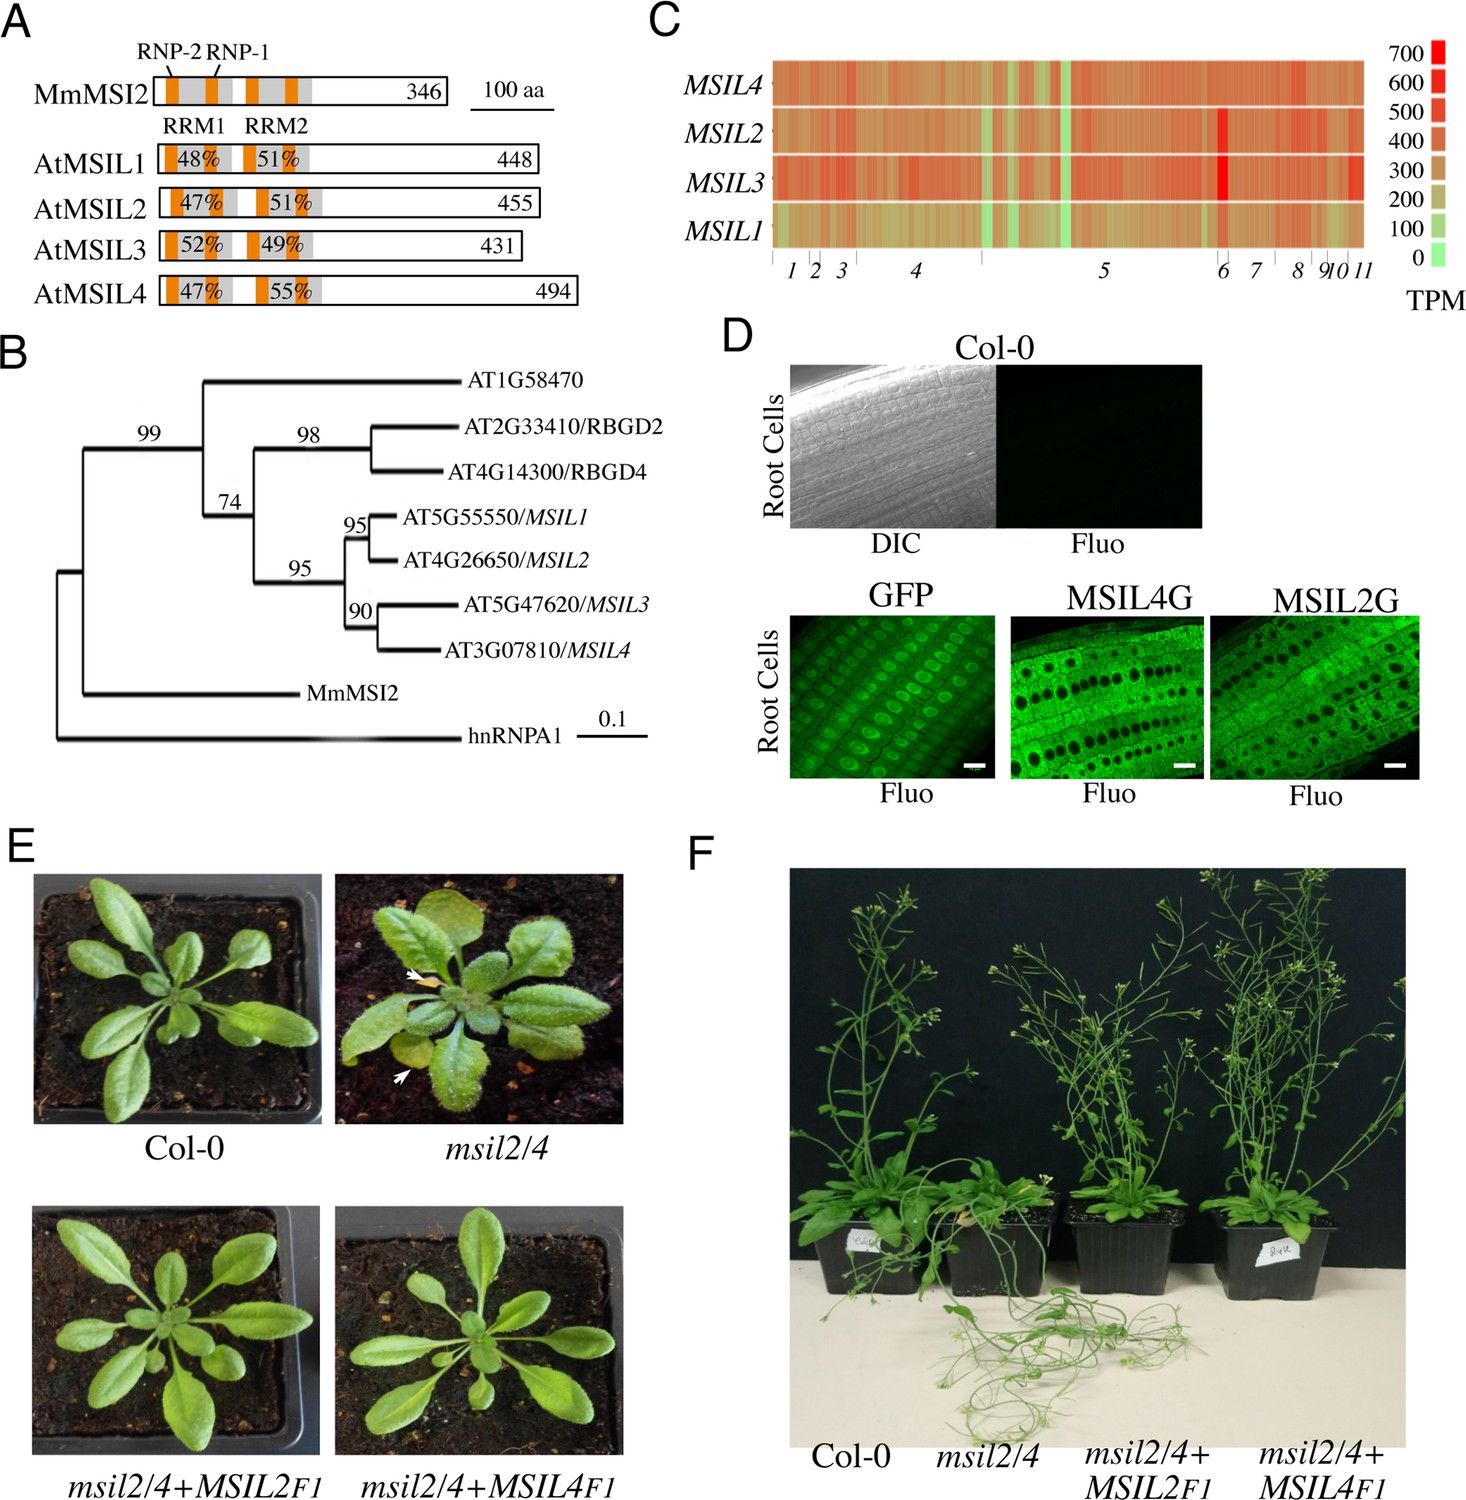
∣ Musashi-like MSIL2/4 proteins redundantly control development in Arabidopsis.
(A) Schematic representation of the Musashi-like (MSIL) protein family in Arabidopsis thaliana. The invariant RNP1 and RNP2 motifs within the conserved RRM domains are indicated. Numbers refer to amino acid identities between the Mouse Musashi/MSI RRM1/2 domains and the corresponding domains in Arabidopsis MSIL homologs. (B) Evolutionary relationships between MSILs and related RNA-binding proteins. The scale bar indicates the rate of evolutionary change expressed as number of amino acid substitutions per site. (C) RNA-seq expression map of MSIL genes extracted from ARAPORT11. Shading is a log2 scale of transcripts per million (TPM). (D) General overview of the roots of 6-day-old wild type Arabidopsis seedlings (Col-0) or transgenic seedlings expressing either a free GFP protein or GFP-tagged versions of MSIL2/MSIL2G and MSIL4/MSIL4G. Scale bar, 10 μm. (E) Photographs of representative rosettes of Col-0, msil2/4, msil2/4-MSIL2F1 and msil2/4-MSIL4F1 plants. (F) Photographs of representative inflorescence stems of Col-0, msil2/4, msil2/4-MSIL2F1 and msil2/4-MSIL4F1 plants. Abbreviations: Mus musculus Musashi2 (MmMsi2); human heterogeneous nuclear ribonucleoprotein A1 (hnRNPA1).
Figure 1—figure supplement 1
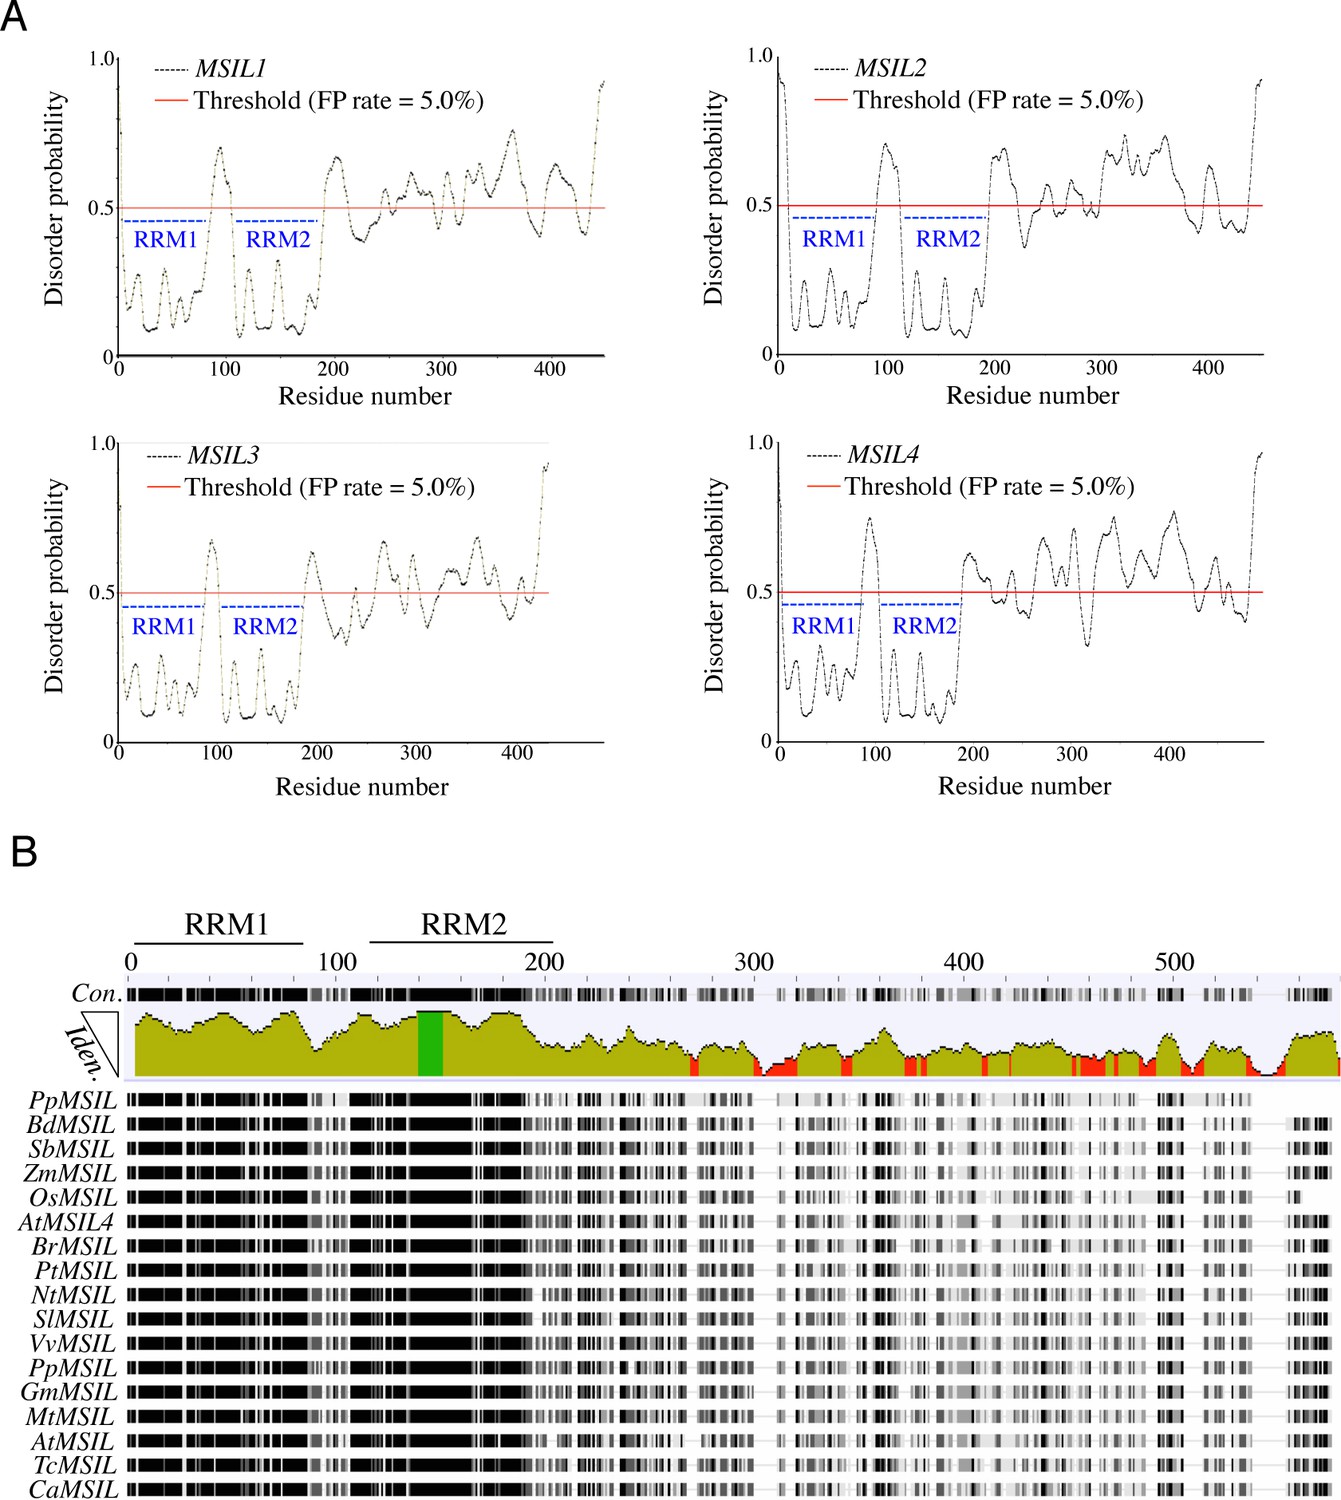
Organization et sequence conservation of plant MSIL proteins.
(A) Protein disorder prediction of MSIL family members. Residues above/below the threshold probability of 0.5 (red line) are classified as disordered/structured with a false positive rate of 5.0%. The position of the RRM motifs is indicated with dashed blue bars. (B) Conservation tracks from the MUSCLE software for MSIL orthologs. Abbreviations: Prunus persica (Pp); Brachypodium distachyon (Bd); Sorghum bicolor (Sb); Zea mays (Zm); Oryza sativa (Os); Brassica rapa (Br); Populus trichocarpa (Pt); Nicotiana tabacum (Nt), Solanum lycopersicum (Sl); Vitis vinifera (Vv); Physcomitrium patens (Pp); Glycine max (Gm); Medicago truncatula (Mt); Amborella trichopoda (At); Theobroma cacao (Tc); Coffea arabica (Ca).
Figure 1—figure supplement 2
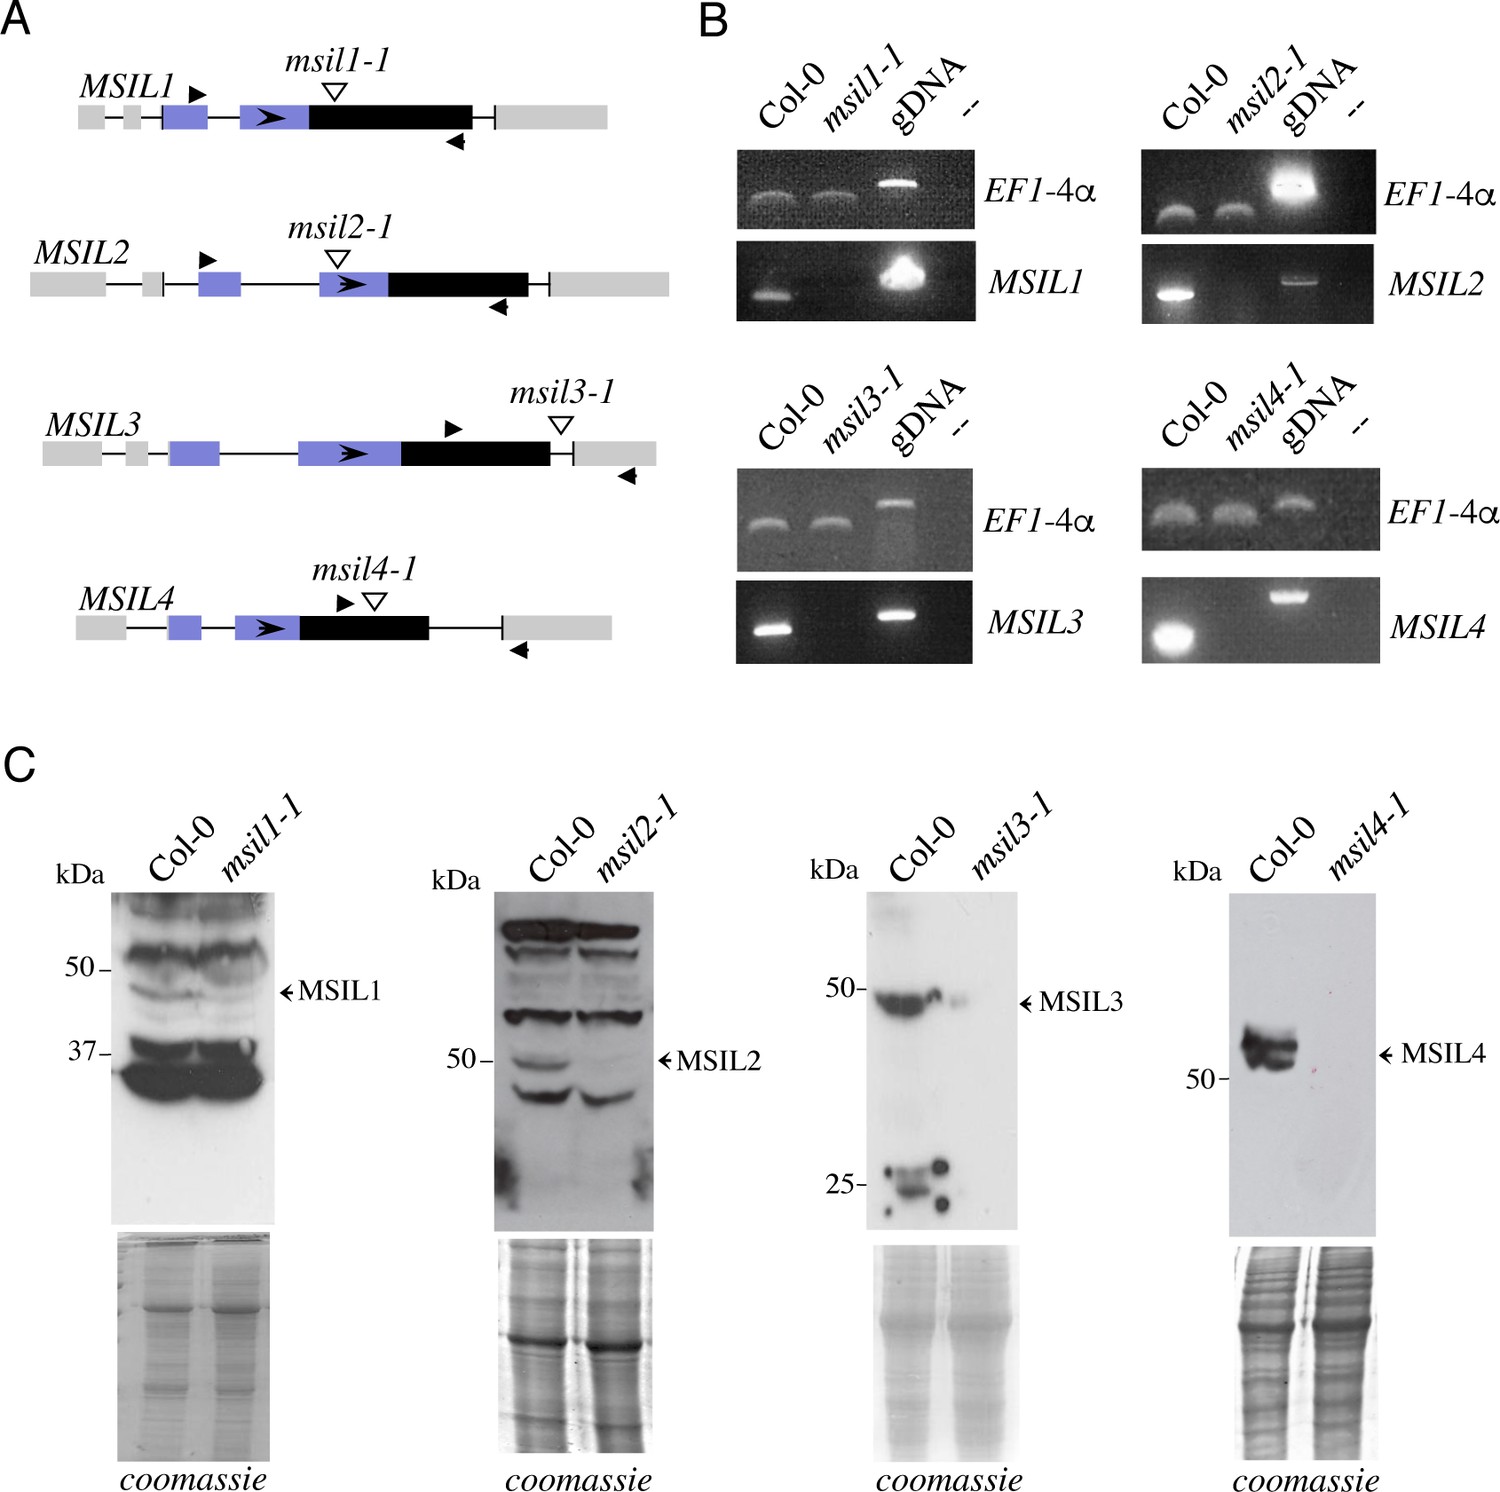
Identification of msil mutant lines.
(A) Schematic representations of the MSIL loci and their associated T-DNA insertion lines. Exons are represented as boxes and introns as lines. Vertical arrowheads indicate T-DNA insertions and horizontal filled arrowheads the positions of primers used for RT-PCR analysis. (B) RT-PCR performed to characterize msil insertion mutants. No full-length MSIL transcripts are accumulated in mutants as revealed by amplification with specific primers. Expression of EF1-4α is shown as a loading control. gDNA represents genomic DNA as a template. (C) Western blots of total proteins from inflorescences of indicated genotypes performed with specific antibodies as indicated on the right. Coomassie blue staining are used as protein loading controls.
-
Figure 1—figure supplement 2—source data 1
Uncropped gel of semi-quantitative RT-PCR performed to characterize the msil insertion mutants.
MSIL1,2,3,4 specific primers were used to characterize and validate the nature of the insertion lines. Primers corresponding to EF1-4α gene were used to confirm the equilibration.
- https://cdn.elifesciences.org/articles/88207/elife-88207-fig1-figsupp2-data1-v1.zip
-
Figure 1—figure supplement 2—source data 2
Uncropped western gel of MSILs from either wild-type or corresponding insertion mutant.
Anti MSIL1,2,3,4 antibodies were used for the immunoblotting analysis.
- https://cdn.elifesciences.org/articles/88207/elife-88207-fig1-figsupp2-data2-v1.zip
Figure 1—figure supplement 3
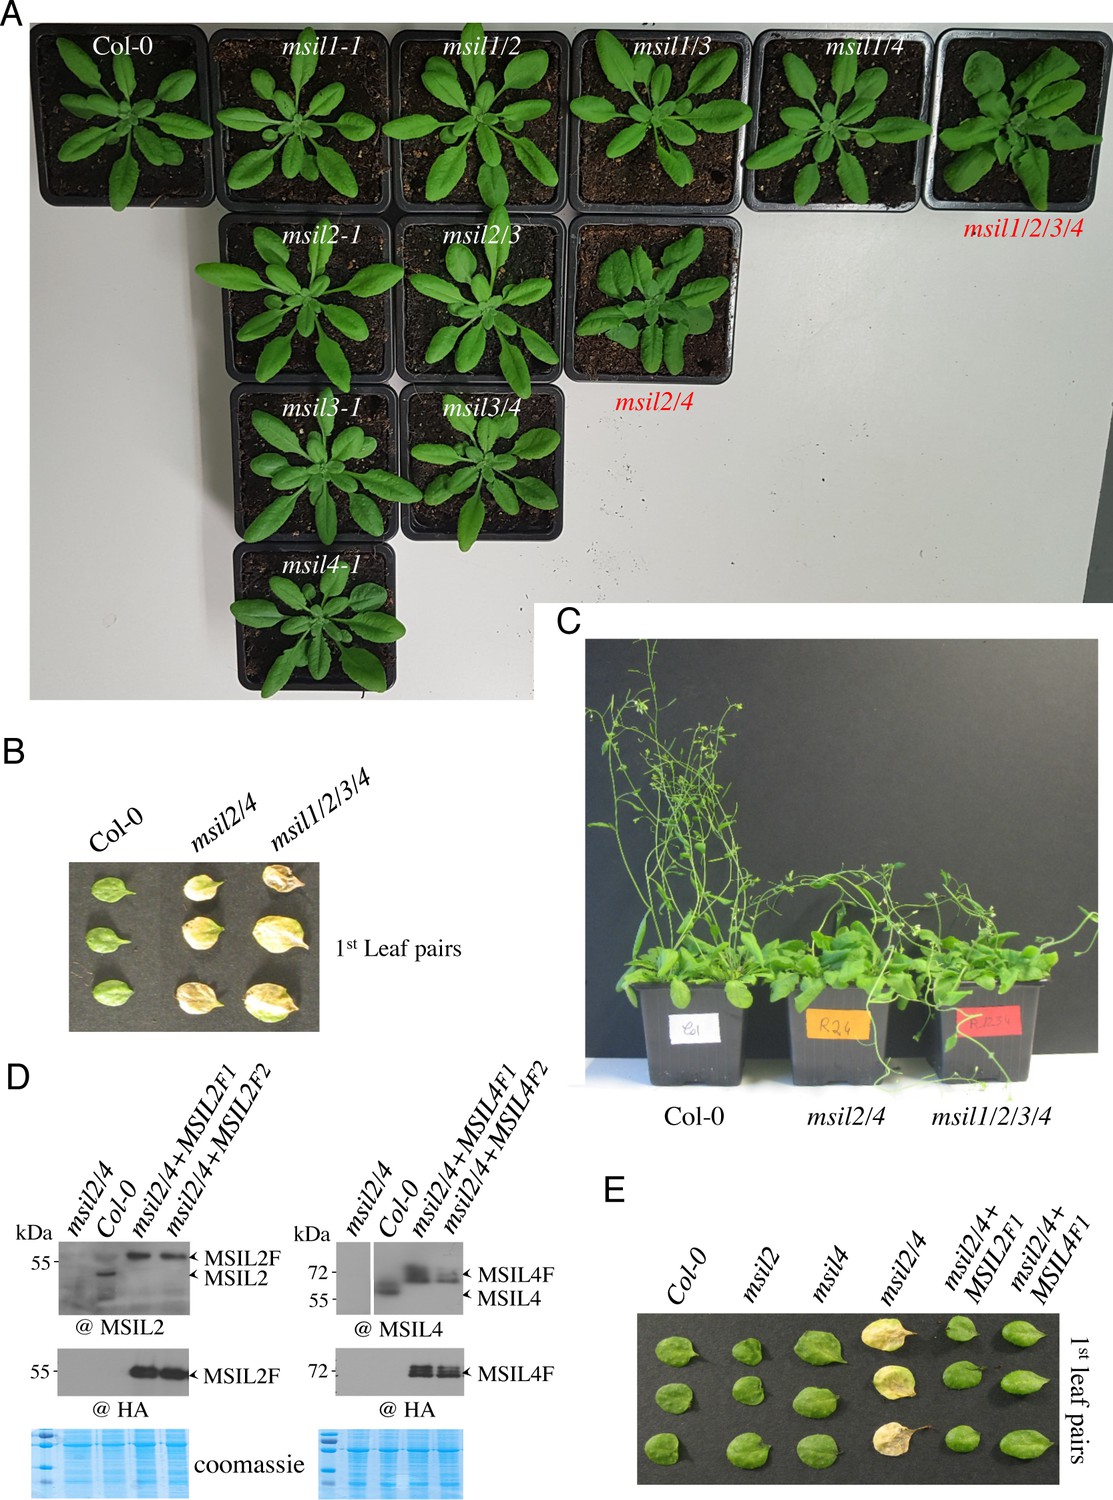
MSIL2/4 proteins redundantly control specific Arabidopsis development processes.
(A) Three-week-old seedlings of wild type, msil1-1//msil2-2//msil3-1//msil4-1 single mutants, msil1/2//msil1/3//msil1/4//msil2/3//msil2/4//msil3/4 double mutants, and the quadruple mutant msil1/2/3/4. The msil2/4 and msil1/2/3/4 mutants are highlighted in red. (B). Phenotypes of the first leaf pairs of 29-day-old Col-0, msil2/4 and msil1/2/3/4 mutant plants. (C) Photographs of representative 70-day-old Col-0, msil2/4 and msil1/2/3/4 mutant plants. (D) Western blot analysis of Col-0, msil2/4 mutant, and complemented msil2/4 double mutant plants expressing Flag-HA-tagged versions of MSIL2 (MSIL2F1 and MSIL2F2) or MSIL4 (MSIL4F1 and MSIL4F2) proteins. Western blots were performed using either endogenous MSIL4 (top) or anti-HA (bottom) antibodies. Coomassie blue staining is used as protein loading controls. (E) Phenotypes of the first leaf pairs of 45 days-old Col-0, msil2-1, msil4-1, msil2/4, msil2/4-MSIL2F1, and msil2/4-MSIL4F1 plants.
-
Figure 1—figure supplement 3—source data 1
Uncropped western gel of Col-0, msil2/4, and complemented msil2/4 mutant expressing Flag-tagged versions of MSIL2 and MSIL4 proteins.
Western blots were performed using either endogenous MSIL4 (top) or anti-HA (bottom) antibodies. Coomassie gels are used as protein loading controls.
- https://cdn.elifesciences.org/articles/88207/elife-88207-fig1-figsupp3-data1-v1.zip
Figure 2 with 2 supplements
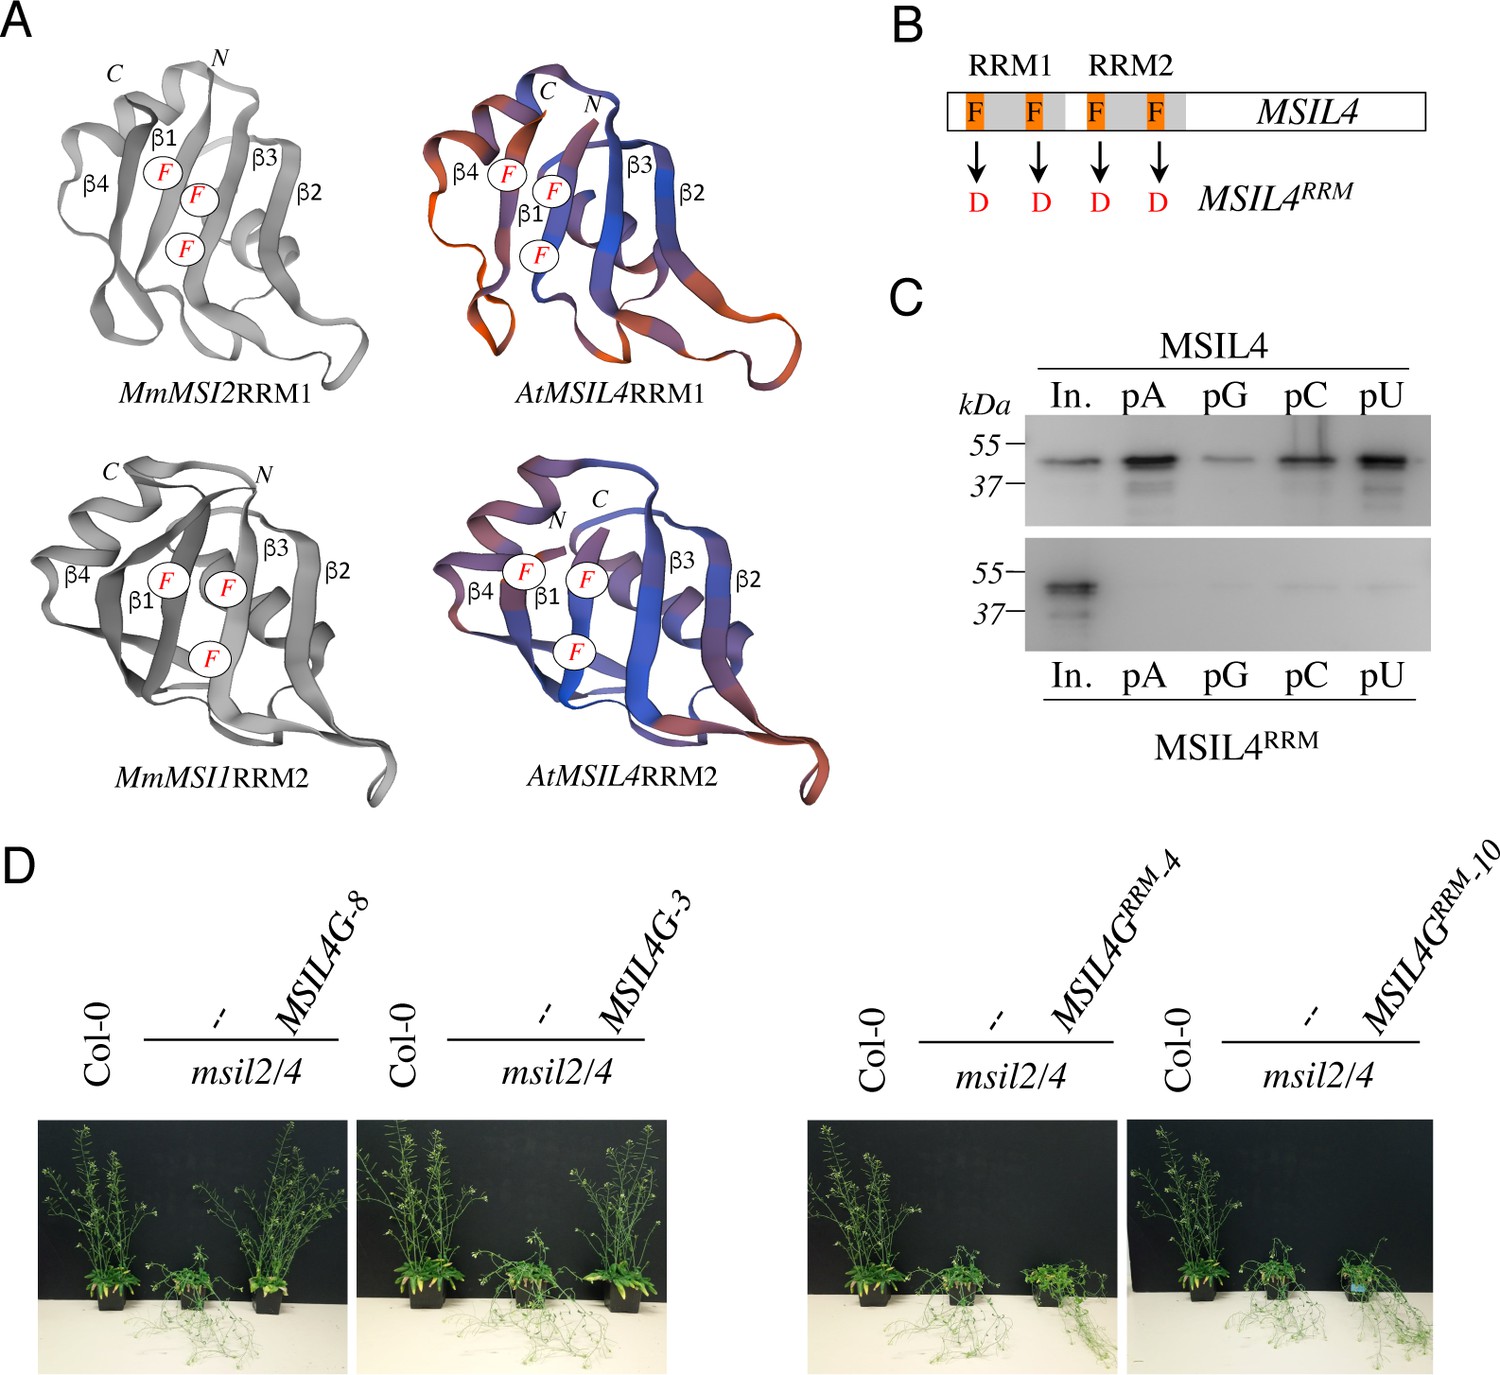
∣ RRM-dependent RNA-binding activity is essential for MSIL function in planta.
(A) Experimentally determined structures of the RRM1 domain of MmMSI2 (PDB ID: 6C8U) and the RRM2 domain of MmMSI1 (PDB ID: 5x3 y), and models of the RRM domains of MSIL4 generated using the homology-modeling server SWISS-MODEL. The α-helices and β-sheets of RRM domain as well as the phenylalanine residues that contact RNA bases are highlighted. (B) Schematic representation of the mutations introduced in the RRM domains of MSIL4. (C) Binding assays of MSIL4 RRM domains on ssRNA homopolymers in vitro. Single-stranded polyA (pA), polyG (pG), polyC (pC), or polyU (pU) RNAs were subjected to binding with the His-tagged recombinant RRM domains from MSIL4 (upper part) or its mutated version (MSIL4RRM, lower part). An anti-His antibody was used for detection. In. represents the input fraction. (D) RRM-dependent RNA-binding activity is essential for MSIL2/4 function in stem. Photographs of representative inflorescence stems of Col-0 and msil2/4 mutants complemented or not with a WT version of MSIL4 (MSIL4G-8 and 3) or an rrm mutant (MSIL4GRRM-3 and 10).
-
Figure 2—source data 1
Uncropped Western gels of the binding assays of His-tagged recombinant Wild-type and mutant RRM domains.
Western blots were performed using anti-His antibodies.
- https://cdn.elifesciences.org/articles/88207/elife-88207-fig2-data1-v1.zip
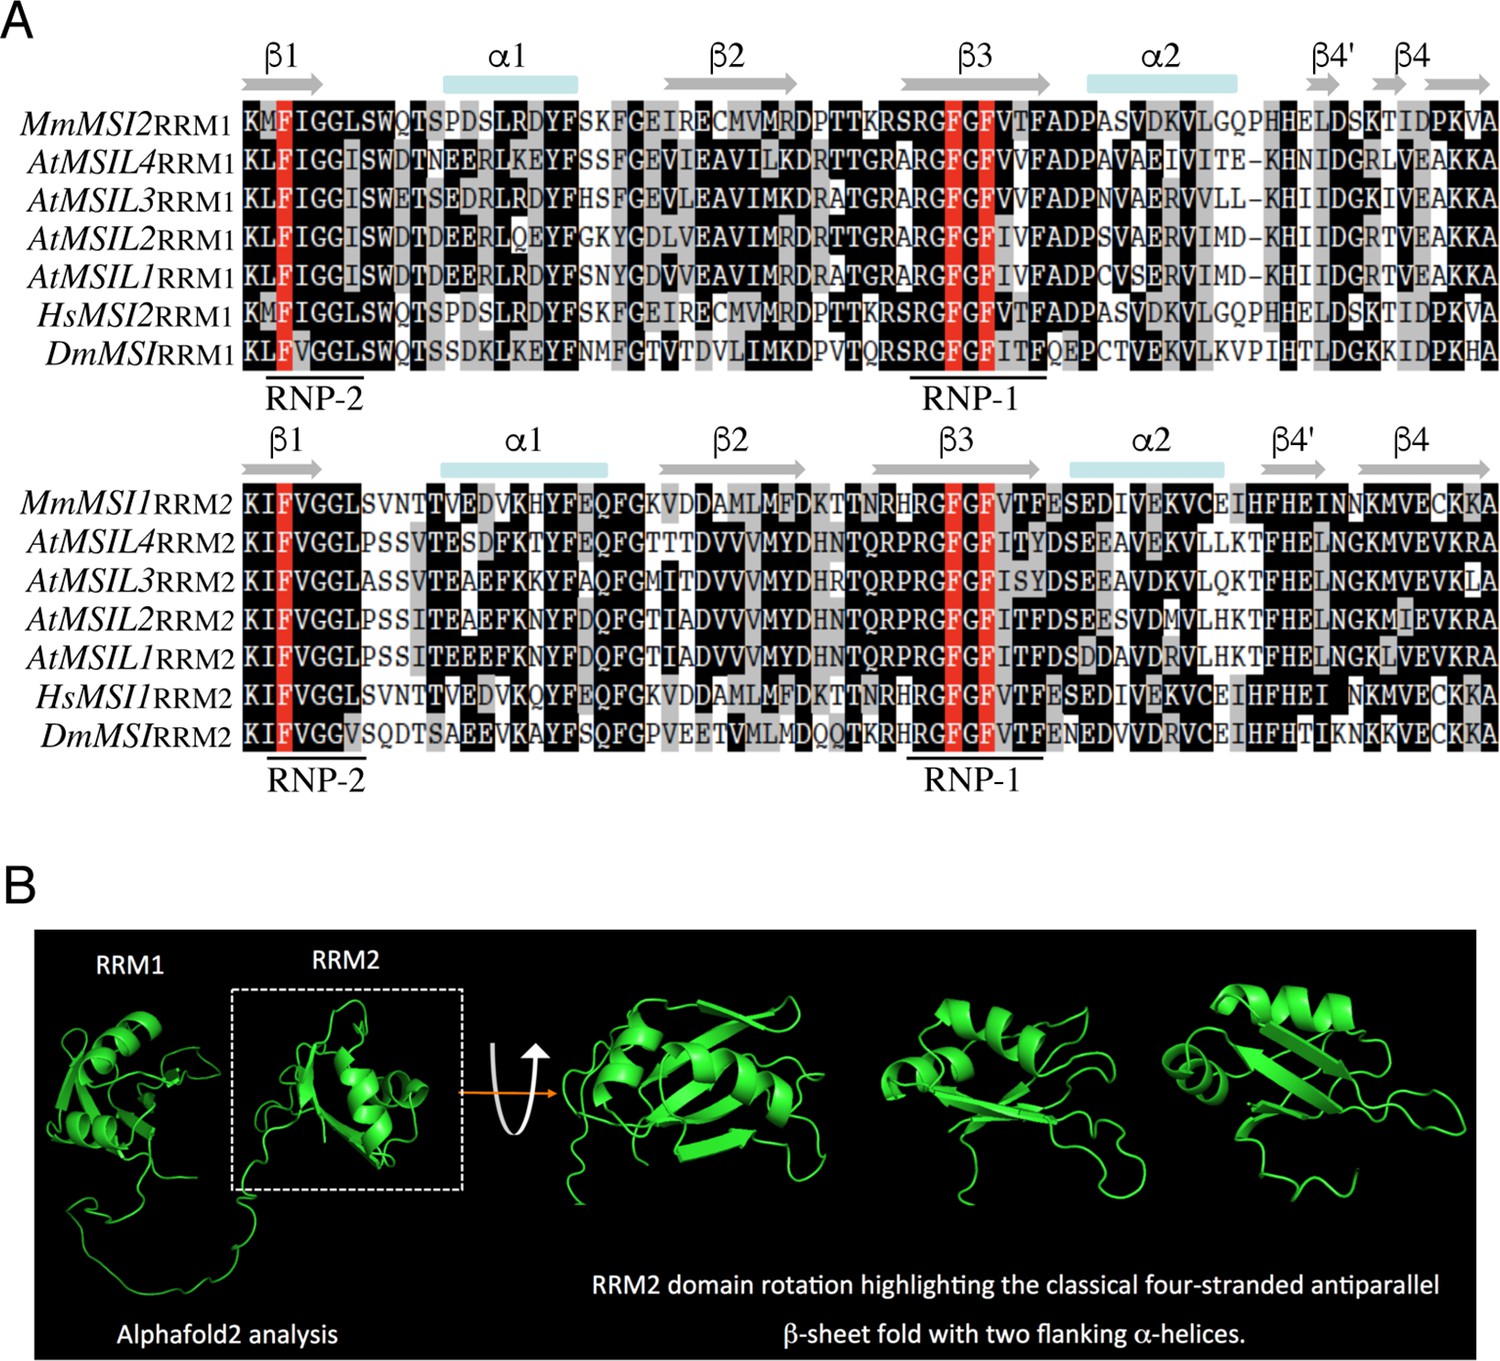
Figure 2—figure supplement 1
Arabidopsis lines expressing either wild-type or RRM-mutated forms of MSIL4 in the msil2/4 mutant background.
(A) Multiple sequence alignment of the RRM1 and RRM2 domains of MSILs and related proteins. The phenylalanine residues that interact with RNA bases in RNP2 and RNP1 regions are highlighted in red. (B) Alphafold 2 prediction of MSIL4 RRM domains. Only the RRM domains (1–175 amino acids) region was submitted to structure prediction.
Figure 2—figure supplement 2
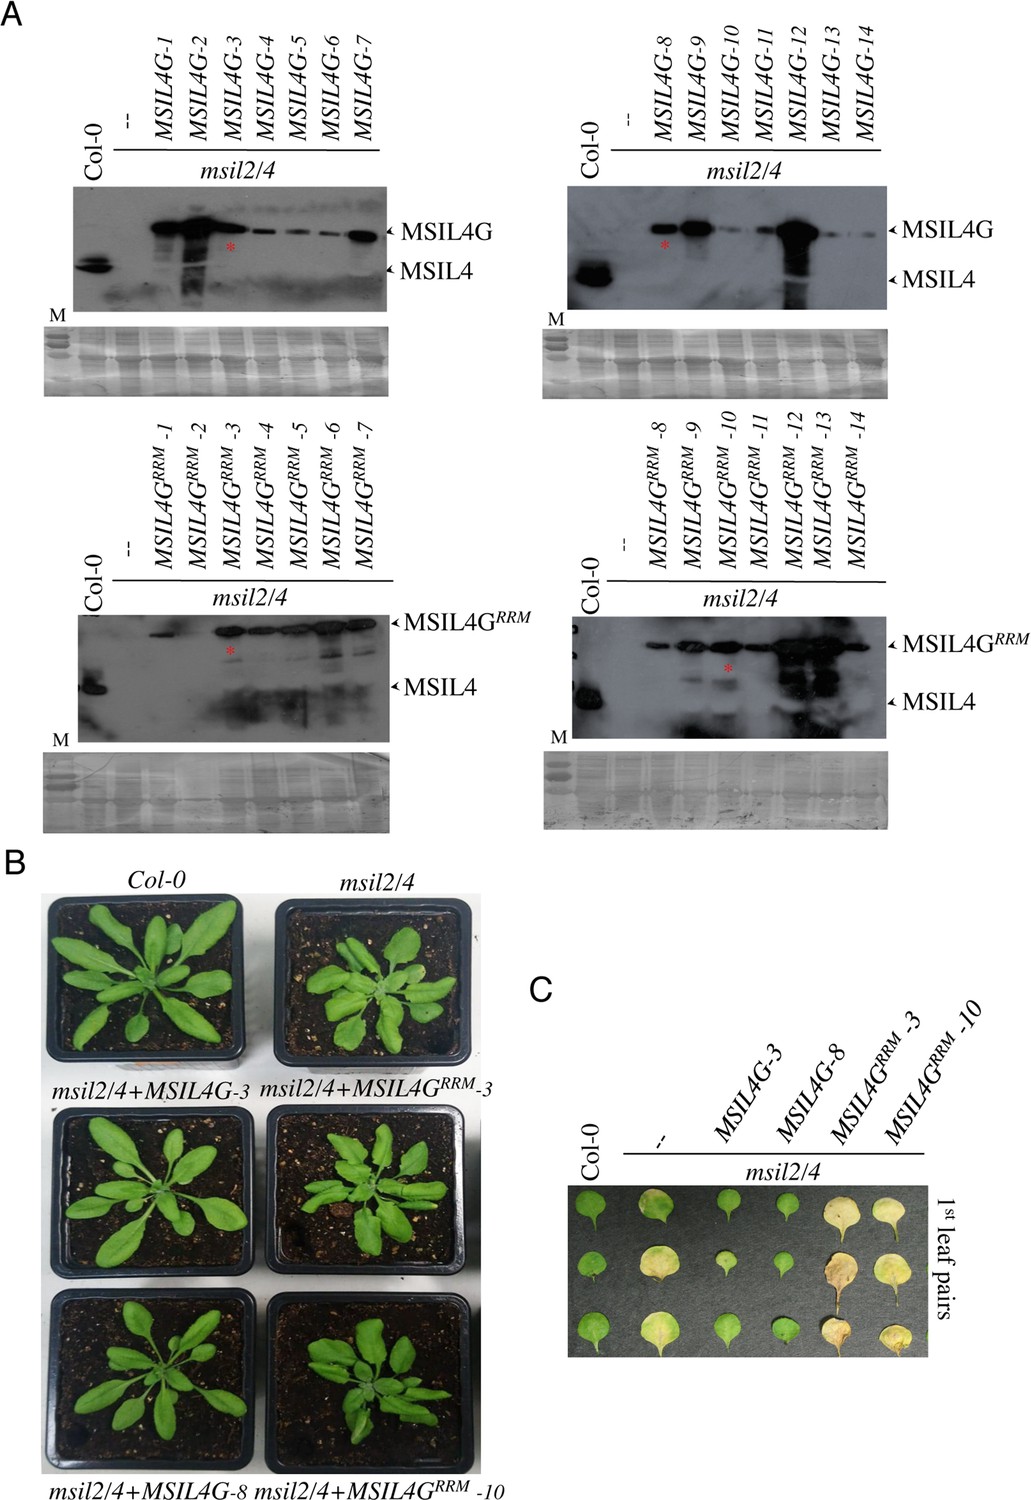
RRM-dependent RNA-binding activity is essential for MSIL function in vivo.
(A) Analysis of transgenic msil2/4 mutant lines expressing either a wild type (MSIL4G, top panel) or a rrm-mutated version (MSIL4Gr; bottom panel) of MSIL4 protein. Expression of the GFP-tagged or endogenous forms of MSIL4 protein was analyzed by western blotting using anti-MSIL4 antibodies. The wild-type (MSIL4G-3, and MSIL4G-8) and RRM mutated (MSIL4GRRM-3, and MSIL4GRRM-10) MSIL4 lines further selected for analysis are marked with a red asterisk. (B) The wild-type (MSIL4G-3, and MSIL4G-8), but not the RRM domain mutated versions of MSIL4G (MSIL4GRRM-3, and MSIL4GRRM-10), are able to rescue the rosette and the (C) early senescence developmental phenotypes.
Figure 3 with 1 supplement
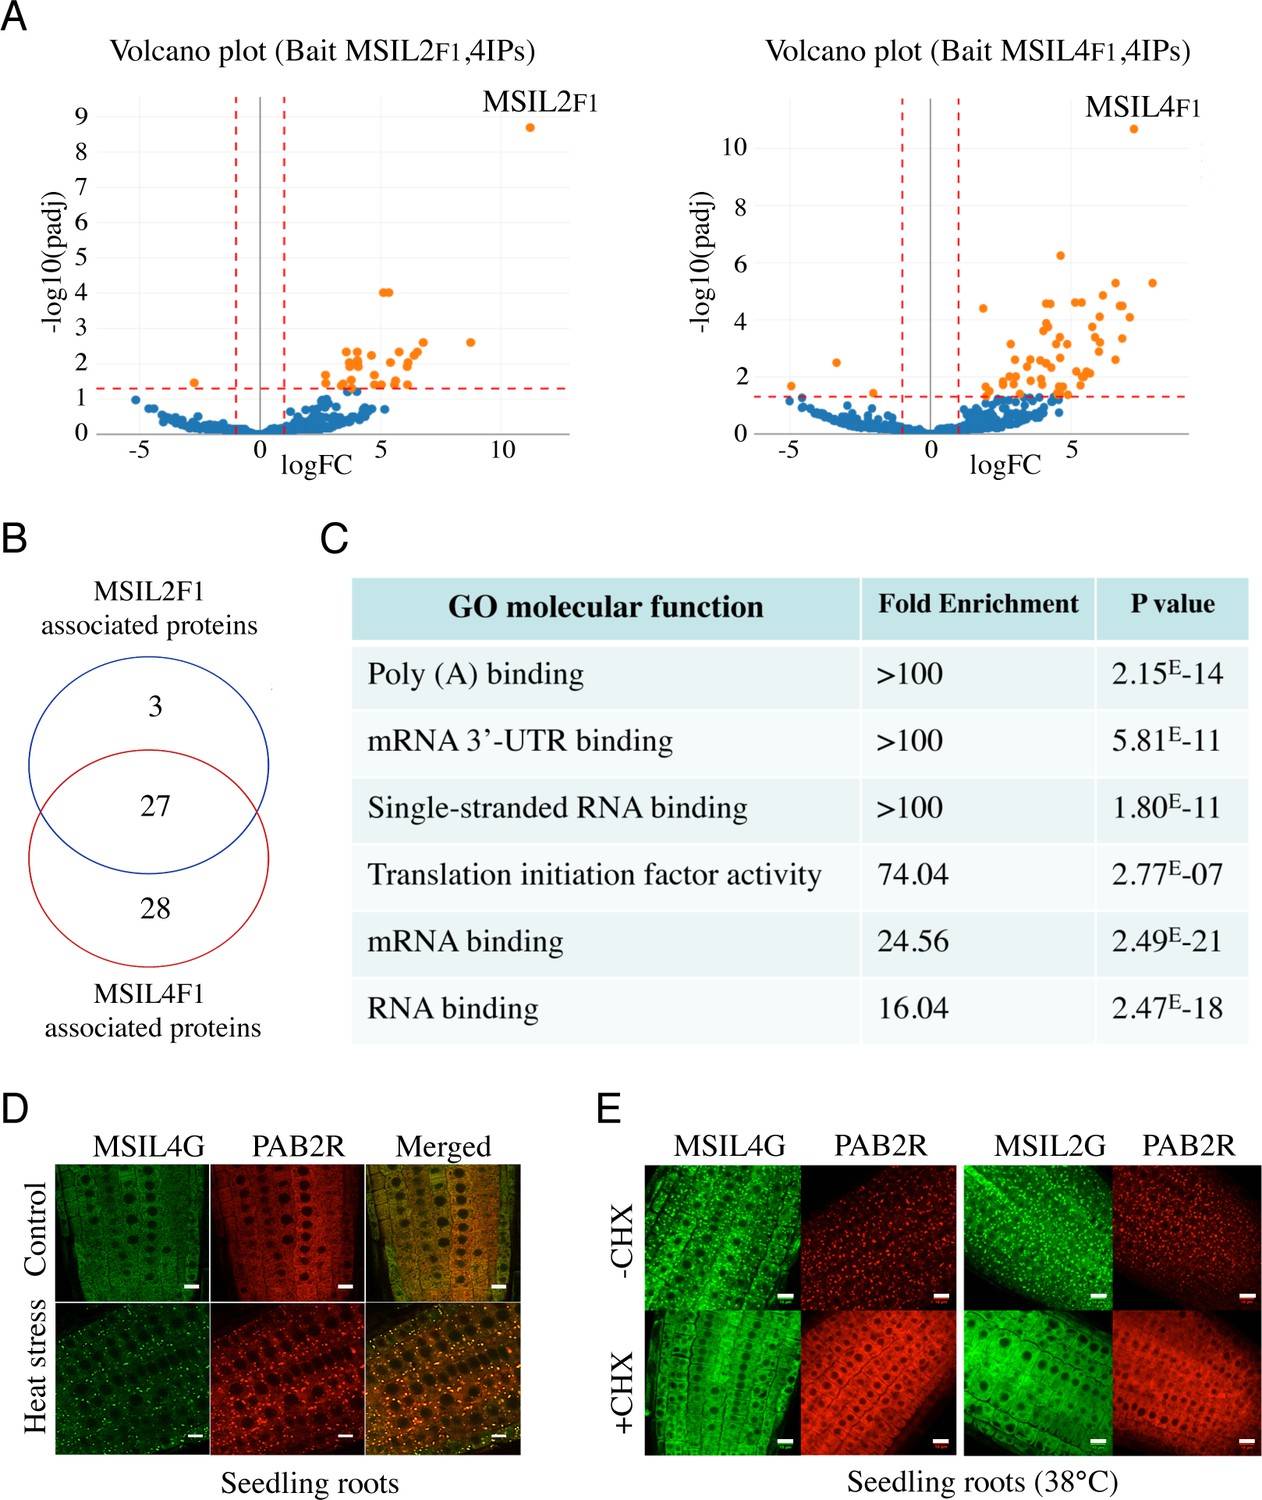
∣ MSIL2/4 protein interactomes are enriched in proteins involved in 3’-UTR binding and translation regulation.
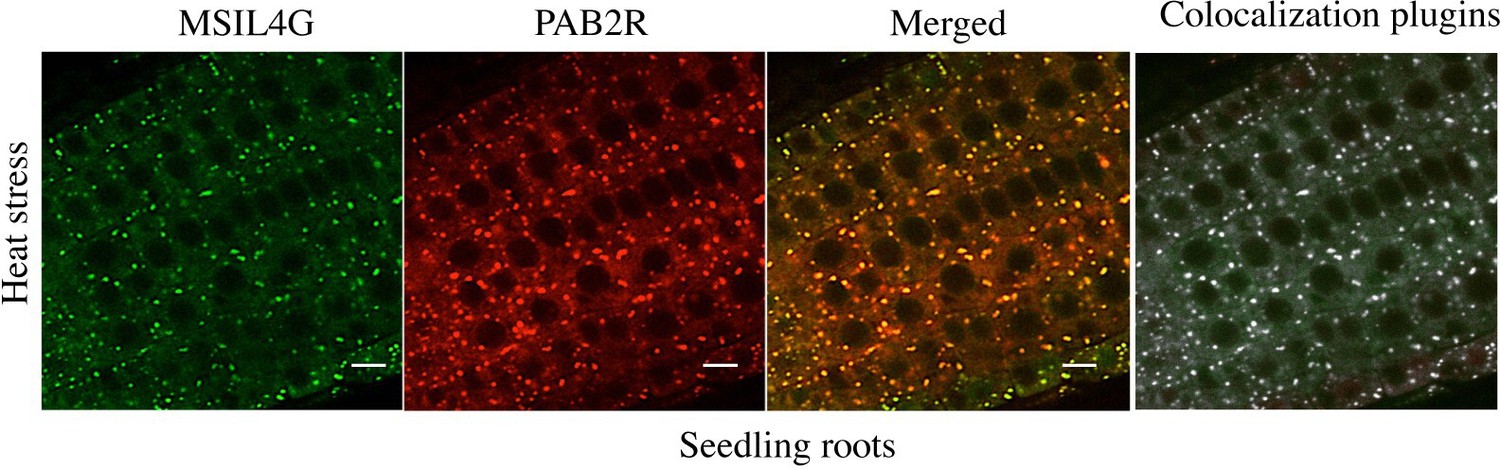
(A) The semi-volcano plots show the enrichment of proteins co-purified with MSIL2F1 and MSIL4F1 as compared with control IPs. Y- and X-axis display adjusted p-values and fold changes, respectively. The dashed lines indicate the threshold above which proteins are significantly enriched/depleted (fold change >2; adjP <0.05). (B) Venn diagram showing the overlap between the MSIL2 and the MSIL4 interactomes. (C) PANTHER-based classification of the GO molecular function that are overrepresented among the MSIL-interacting proteins. (D) Confocal monitoring of the colocalization of MSIL2G, MSIL4G and PAB2R in root tips of 8-d-old seedlings were monitored after 30 min of exposure to 38 °C (heat stress) or 20 °C for control treatment. (E) Cycloheximide treatment inhibits the formation of MSILG and PAB2R cytosolic foci. The transgenic plants expressing the stress granule marker PAB2R was used as a control. Root of 7-day-old seedlings expressing either MSIL4G, MSIL2G, or PAB2R were monitored after 1 hr of exposure to 38 °C in the presence of DMSO control treatment (DMSO) or in the presence of cycloheximide inhibitor (+CHX). Scale bar, 10 μm.
Figure 3—figure supplement 1

MSILs relocate to cytoplasmic granules under heat stress.
General overview of the fluorescent images of root cells from either wild type or 35 S::GFP, MSIL2G, and MSIL4G transgenic plants experiencing heat stress (1 hr, 37 °C). While the localization of the free GFP protein remains unchanged upon heat stress, the MSILG proteins aggregate into cytosolic foci. Scale bar, 10 μm.
Figure 4 with 1 supplement
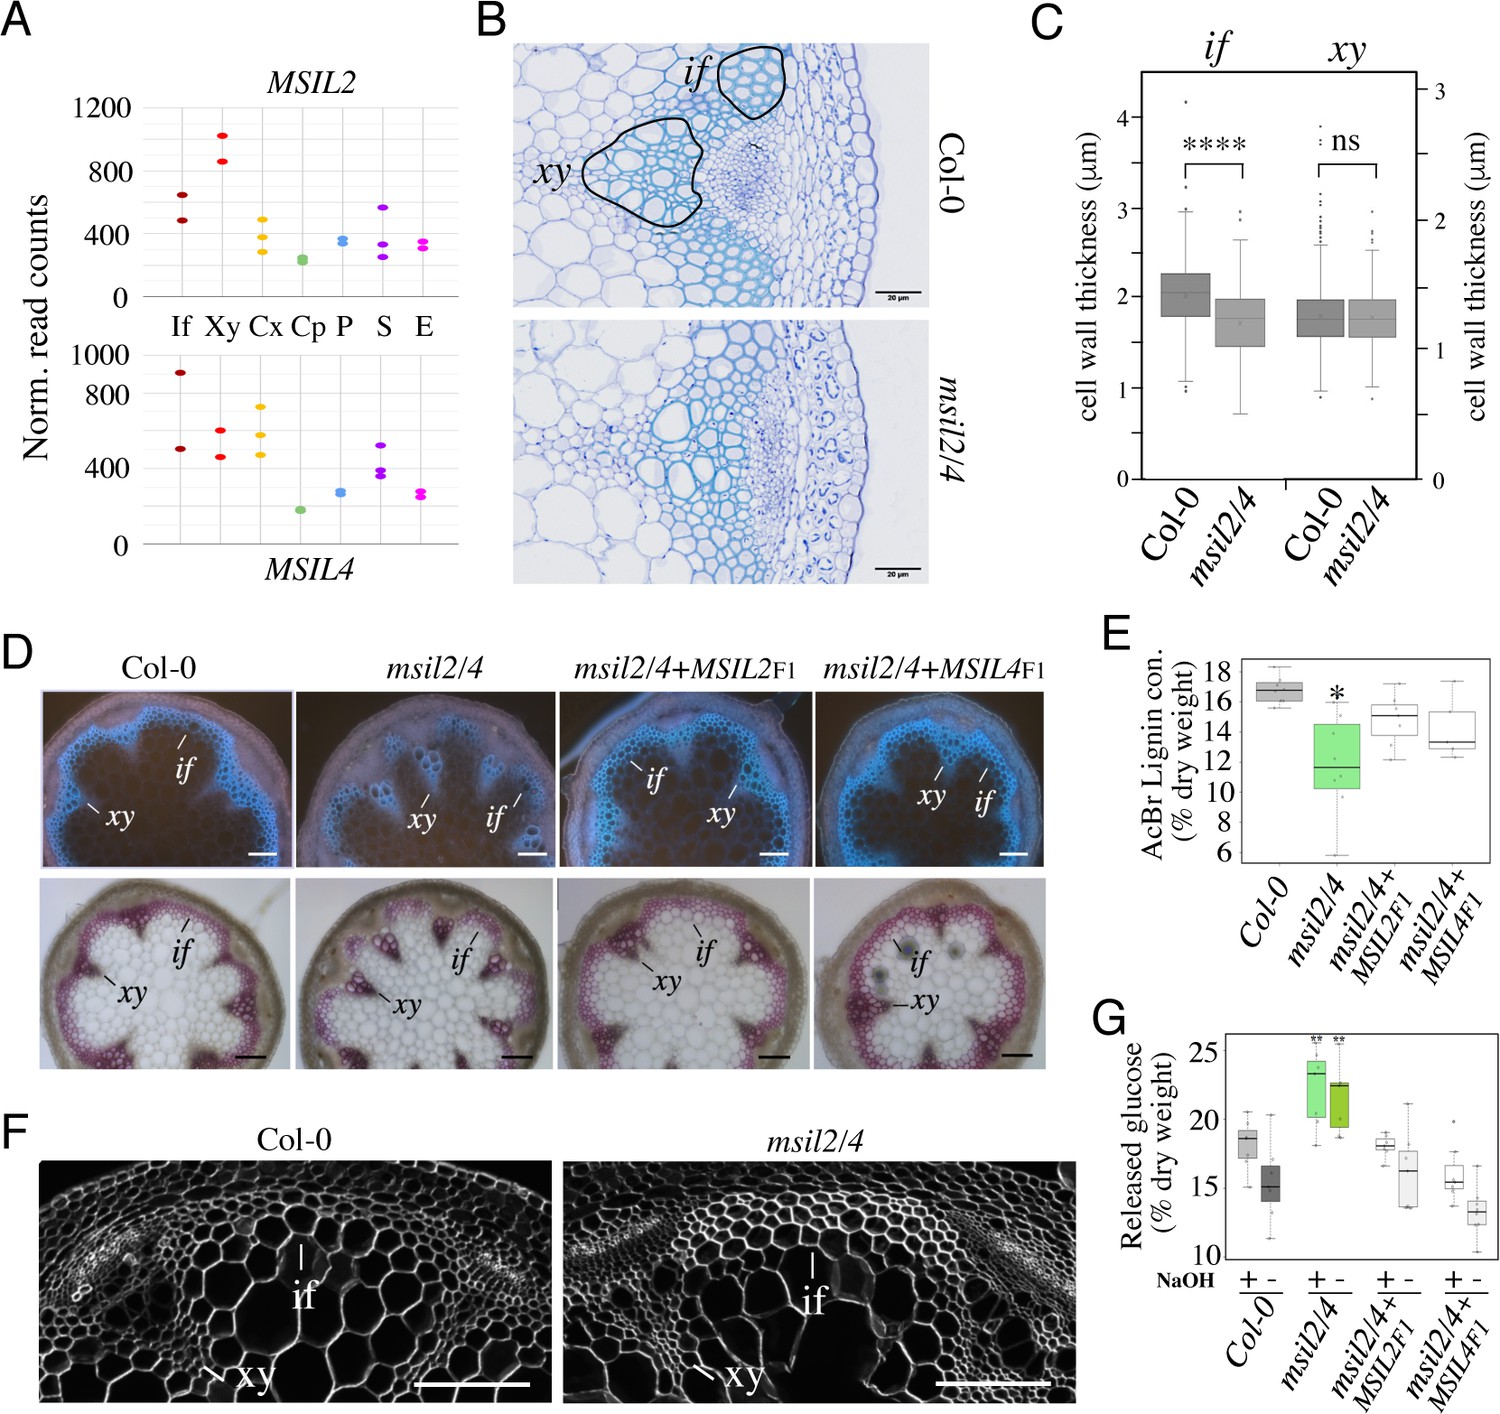
MSIL proteins regulate the molecular architecture of SCW in Arabidopsis fibers.
(A) Expression profiles of the MSIL2 and MSIL4 genes in the inflorescence stem tissues as retrieved from the Arabidopsis inflorescence stem tissue-specific transcriptome database (https://arabidopsis-stem.cos.uni-heidelberg.de/). The results of two replicates are shown. F, fibers; X, xylem vessels; Cx Cambium (xylem side); Cp, Cambium (Phloem side); P, Phloem; S, Starch sheath; E, Epidermis. (B) Cross-sections of Col-0 and msil2/4 stems showing vascular bundle (xy) and interfascicular fiber (if) cells stained with Toluidine blue. Representative fiber and xylary areas analyzed in the panel 4C are outlined. (C) Measurements of the SCW thickness of xylary fiber and interfascicular fiber cells. Values are means (n>400) ± SEM. Data were analyzed by unpaired Student’s test. Asterisks indicate significant differences relative to Col-0; ****p<0.0001. (D) Top: lignin autofluorescence under ultraviolet (UV) using confocal microscopy in Col-0, msil2/4 mutant, and complemented msil2/4-MSIL2F1 and msil2/4-MSIL4F1 plant stem sections. xy: xylem fibers; if: interfascicular fibers. Bottom: Phloroglucinol-HCl staining of Col-0, msil2/4, and complemented msil2/4-MSIL2F1 and msil2/4-MSIL4F1 plant stem sections. Scale bar, 100 μm. (E) Boxplots represent acetyl bromide lignin content, expressed as % of dry weight. Lignin content was measured in the bottom section of mature stems (3 biological replicates per line). Significant differences between Col-0, msil2/4+MSIL2 F1, msil2/4+MSIL4 F1, and msil2/4 plant lines are indicated by asterisks*, p-value <0.01 according to Student’s t test (n=6–10). (F) Confocal microscopy of Calcofluor-white staining of cross sections of Col-0 and msil2/4 mutant inflorescence stems. Scale bar, 100 μm. (G) Boxplots represent the glucose yield after incubation of Col-0 and msil2/4 lignocellulosic material with cellulases either without pre-treatment (-), or after pre-treatment (+) with sodium hydroxide (NaOH).
Figure 4—figure supplement 1
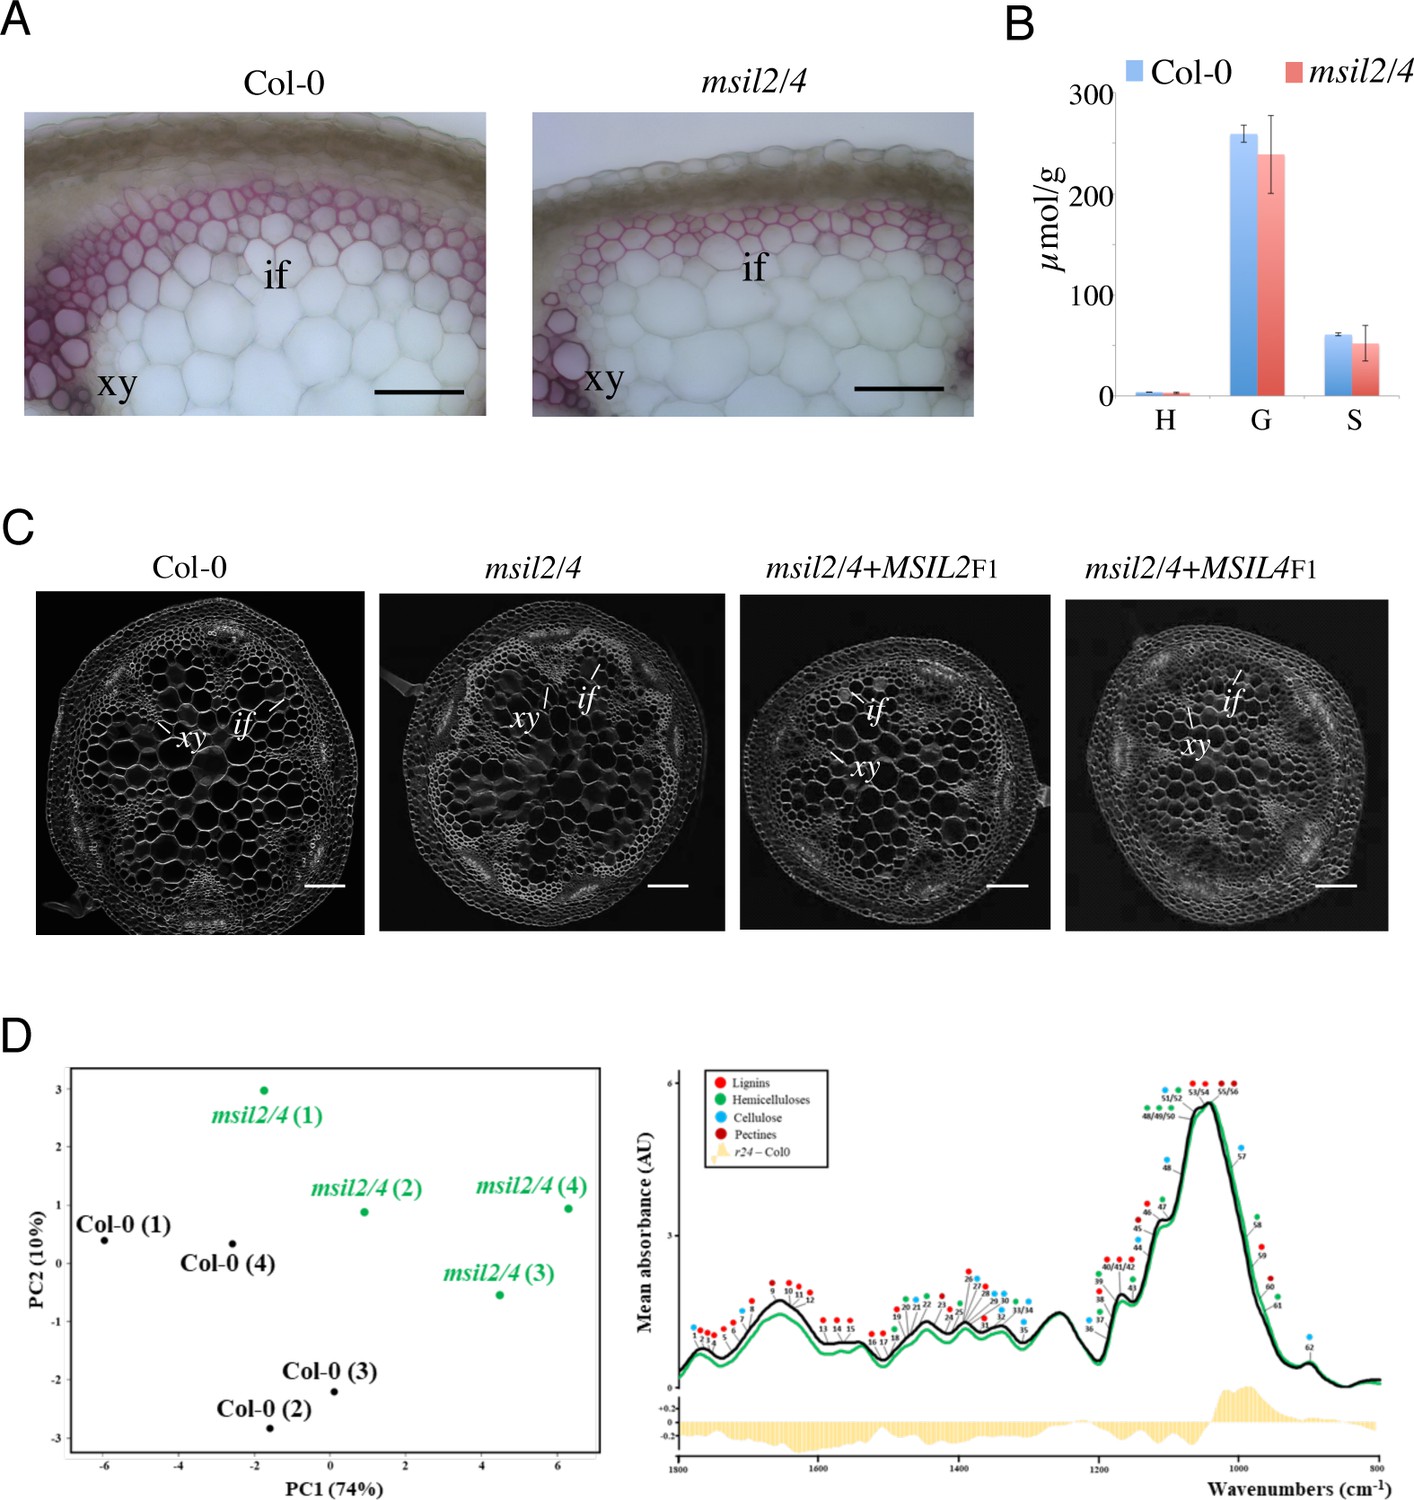
MSIL proteins regulate the molecular architecture and composition of SCW in Arabidopsis inflorescence stem.
(A) Phloroglucinol-HCl staining of cross sections of Col-0 and msil2/4 mutant inflorescence stems. Scale bar, 50 μm. if, fibers; xy, xylem vessels. (B) Lignin composition of Arabidopsis Col-0 and msil2/4 double mutant stems as measured by thioacidolysis. Means were calculated from three plants per lines. (C) Calcofluor-white staining of Col-0, msil2/4, msil2/4-MSIL2F1 and msil2/4-MSIL4F1 plant stem sections. Scale bar, 100 μm. if, fibers; xy, xylem vessels. (D) Left panel: Comparison between FT-IR spectra obtained from Col-0 and msil2/4 mutant lines. Partial least square analysis (PLS-DA) was performed using the normalized values of Fourier-Transformed Infra-Red (FT-IR) absorption spectra (Wave Numbers, WN, 2000–800 cm−1). The first two components (PC1 and PC2) explain 84% of total variability and separate Col-0 controls (black dots) from msil2/4 mutants (green dots). Right panel: FT-IR absorption spectra of Col-0 (black) and msil2/4 (green) genotypes. The curves were drawn using the median of control and mutant line absorption values. A survey of literature allowed identifying 62 FT-IR WN associated to cell wall compounds absorption: red, green, blue and brown dots were associated to lignins, hemicelluloses, celluloses and pectins, respectively. Histograms represent the difference between msil2/4 and wild type spectra values.
Figure 5 with 2 supplements
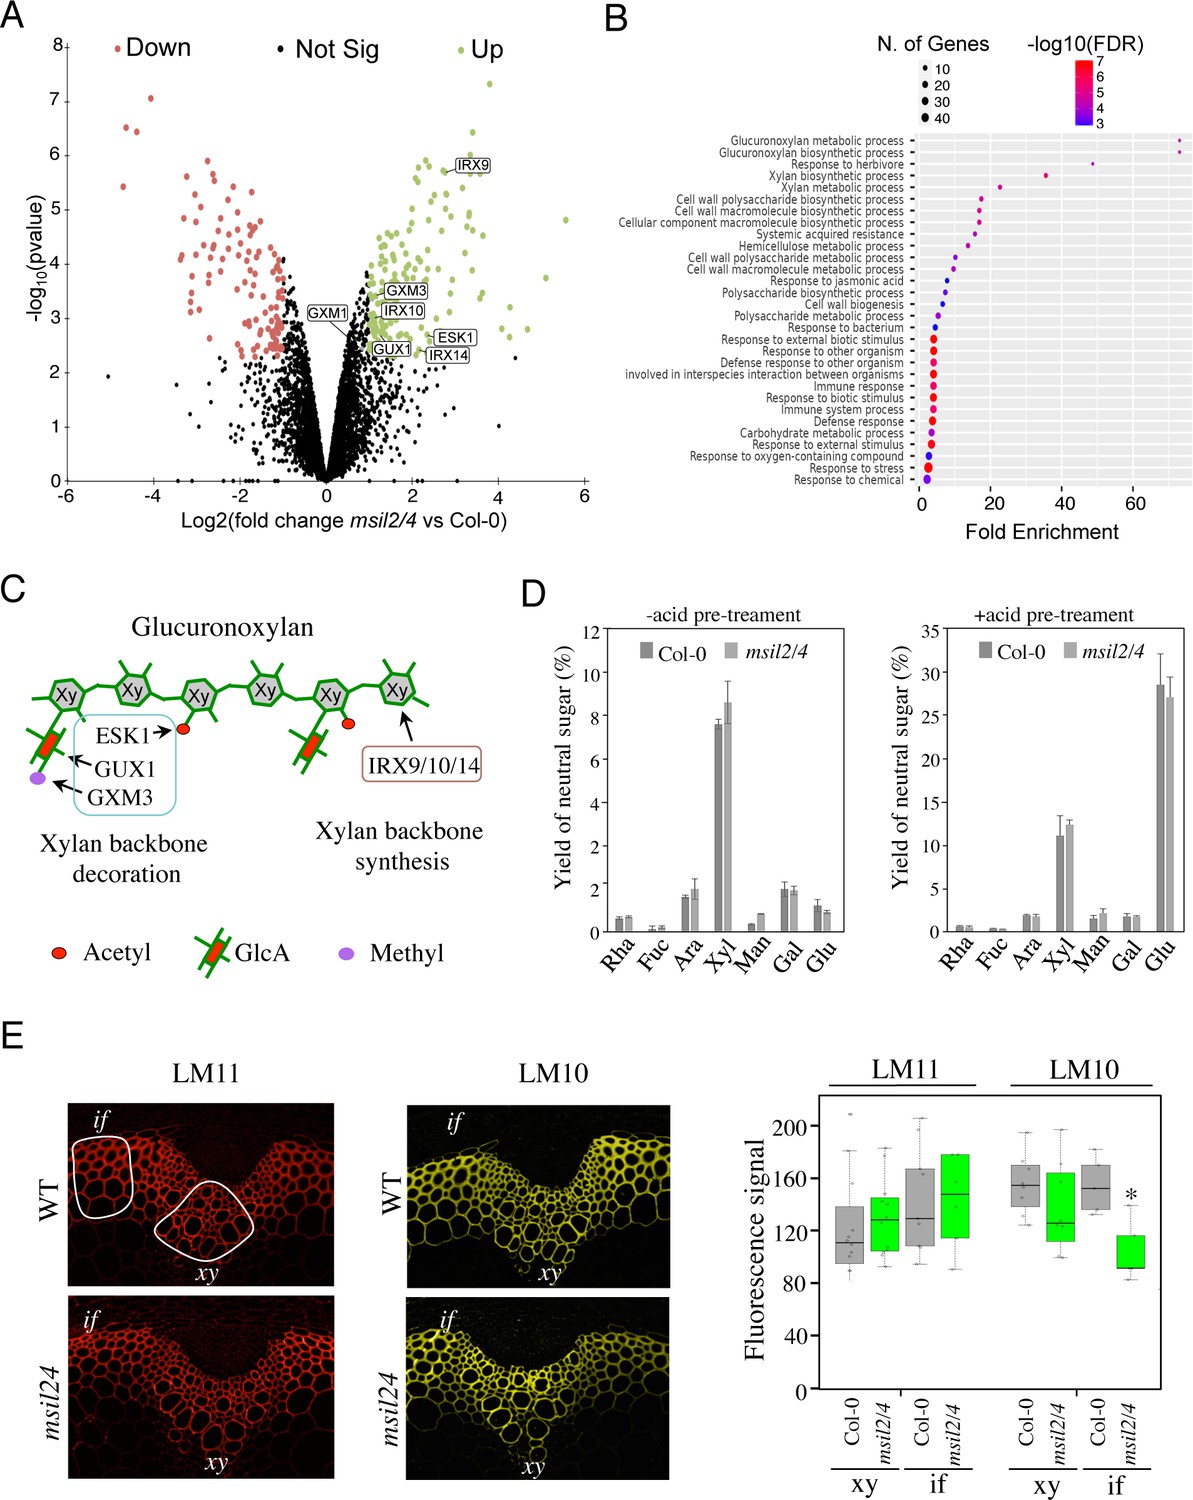
∣The accumulation and activity of the glucuronoxylan decoration machinery are altered in msil2/4 mutant.
(A) MS-based quantitative comparison of Col-0 and msil2/4 inflorescence stem proteomes. Volcano plot displaying the differential abundance of proteins in Col-0 and msil2/4 cells analyzed by MS-based label-free quantitative proteomics. The volcano plot represents the -log10 (limma p-value) on y axis plotted against the log2 (Fold Change msil2/4 vs Col-0) on x axis for each quantified protein. Green and red dots represent proteins found significantly enriched respectively in msil2/4 and Col-0 Arabidopsis stems (log2(Fold Change)≥1 and -log10(p-value)≥2.29, leading to a Benjamini-Hochberg FDR = 1.01 %). The up-regulated proteins involved the glucuronoxylan biosynthetic pathways are indicated. (B) Gene Ontology (GO) analysis of the proteins that are significantly up-regulated in the msil2/4 mutant. The gene ontology analysis of DEGs was performed using ShinyGO v0.76 software. Lollipop diagrams provide information about GO fold enrichment, significance (FDR in log10), and number of genes in each pathway. (C) Schematic model of glucuronoxylan substitution patterns in Arabidopsis and the enzymes involved. IRX9/10/14, glycosyltransferases involved in the synthesis of xylan (Xy) backbone. ESK1, eskimo1. GUX1, glucuronic acid substitution of xylan1; GXM3, glucuronoxylan methyltransferase3 are involved in the glucuronoxylan decoration. (D) Neutral monosaccharide composition of alcohol insoluble residue (AIR) extracted from inflorescence stems of wild-type and msil2/4 mutant plants that have been pre-hydrolyzed or not with acid. Rha, rhamnose; Fuc, fucose; Ara, arabinose; Xyl, xylose; Man, mannose; Gal, galactose; Glc, glucose. (E) Left: Immunofluorescence labeling of transverse sections of Col-0 and msil2/4 stems with the LM10 and LM11 antixylan antibodies. Representative fiber and xylary regions analyzed by immunofluorescence are outlined. Xy, xylem fibers; if, interfascicular fibers. Right: Quantification of the fluorescence was done using ImageJ software and processed according to Supplementary file 5. Significant differences are indicated by asterisks*, p-value <0.01 according to Student’s t test (n=5–12).
Figure 5—figure supplement 1
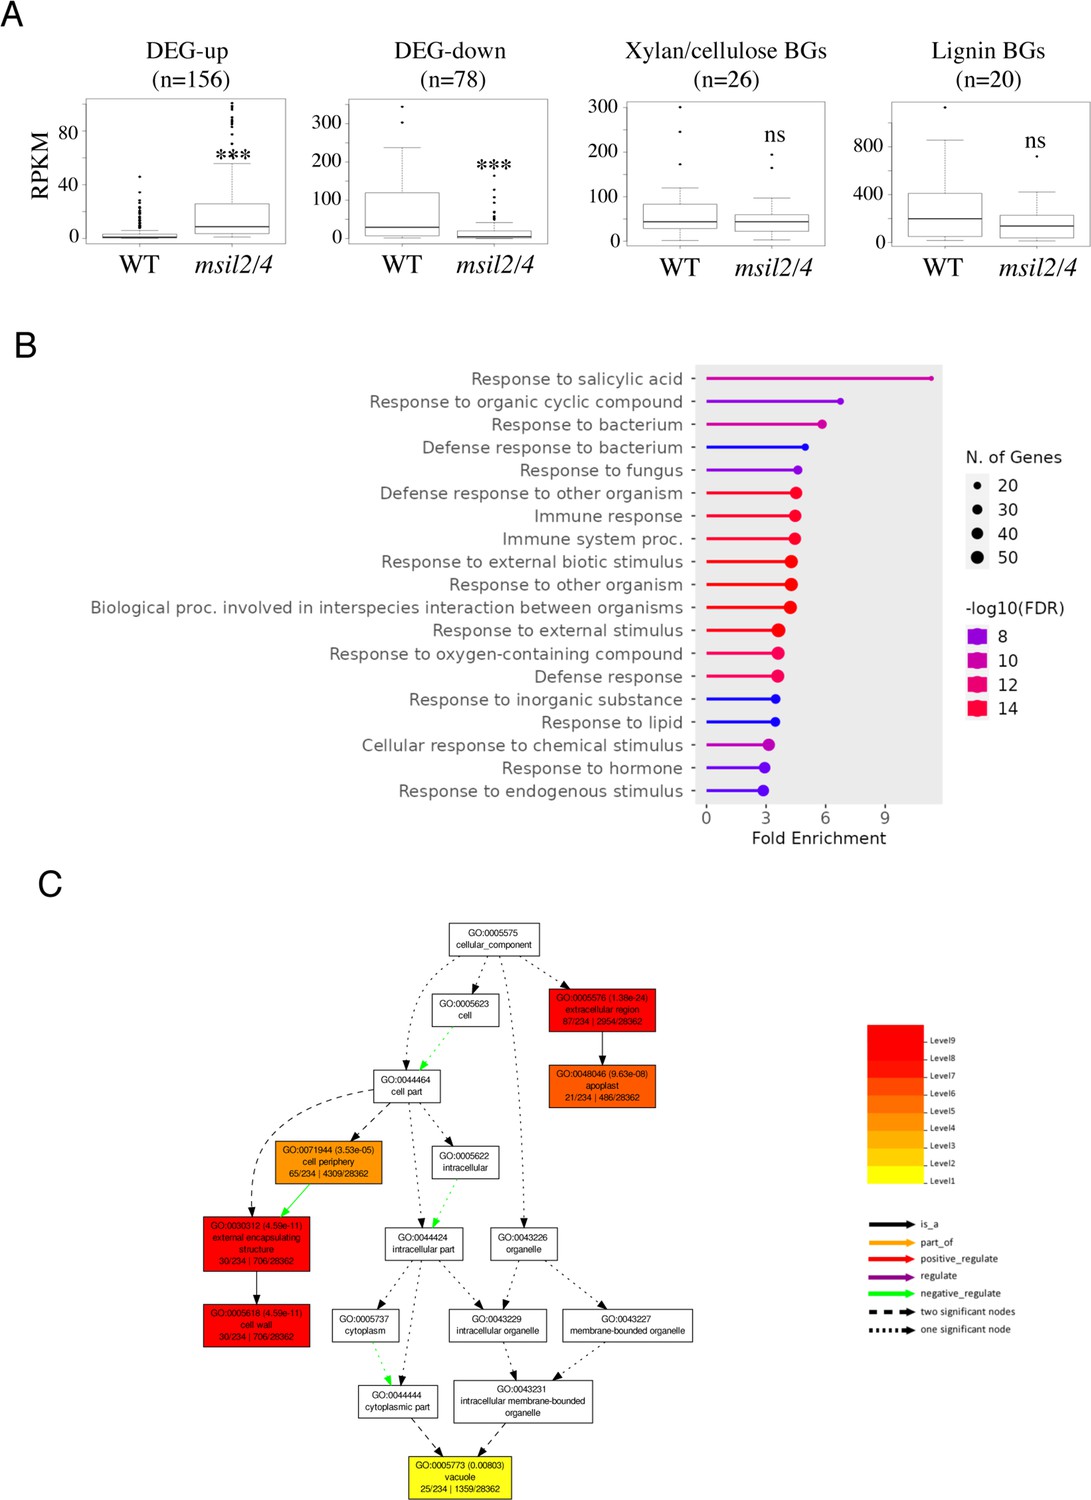
GO analysis of the msil2/4 DEGs reveals molecular functions associated to plant defense and response to biotic and abiotic stresses.
(A) Boxplots showing the read counts corresponding to the up- and down-regulated genes as well as the genes involved in the xylan/cellulose and lignin biosynthesis pathways in Col-0 and msil2/4. ns, not significant; ***p<0.001; t test. (B) The gene ontology analysis of DEGs was performed using ShinyGO v0.76 software. Lollipop diagrams provide information about GO fold enrichment, significance (FDR in log10), and number of genes in each pathway. (C) The DEG products are preferentially targeted to the extracellular region and the cell wall.
Figure 5—figure supplement 2
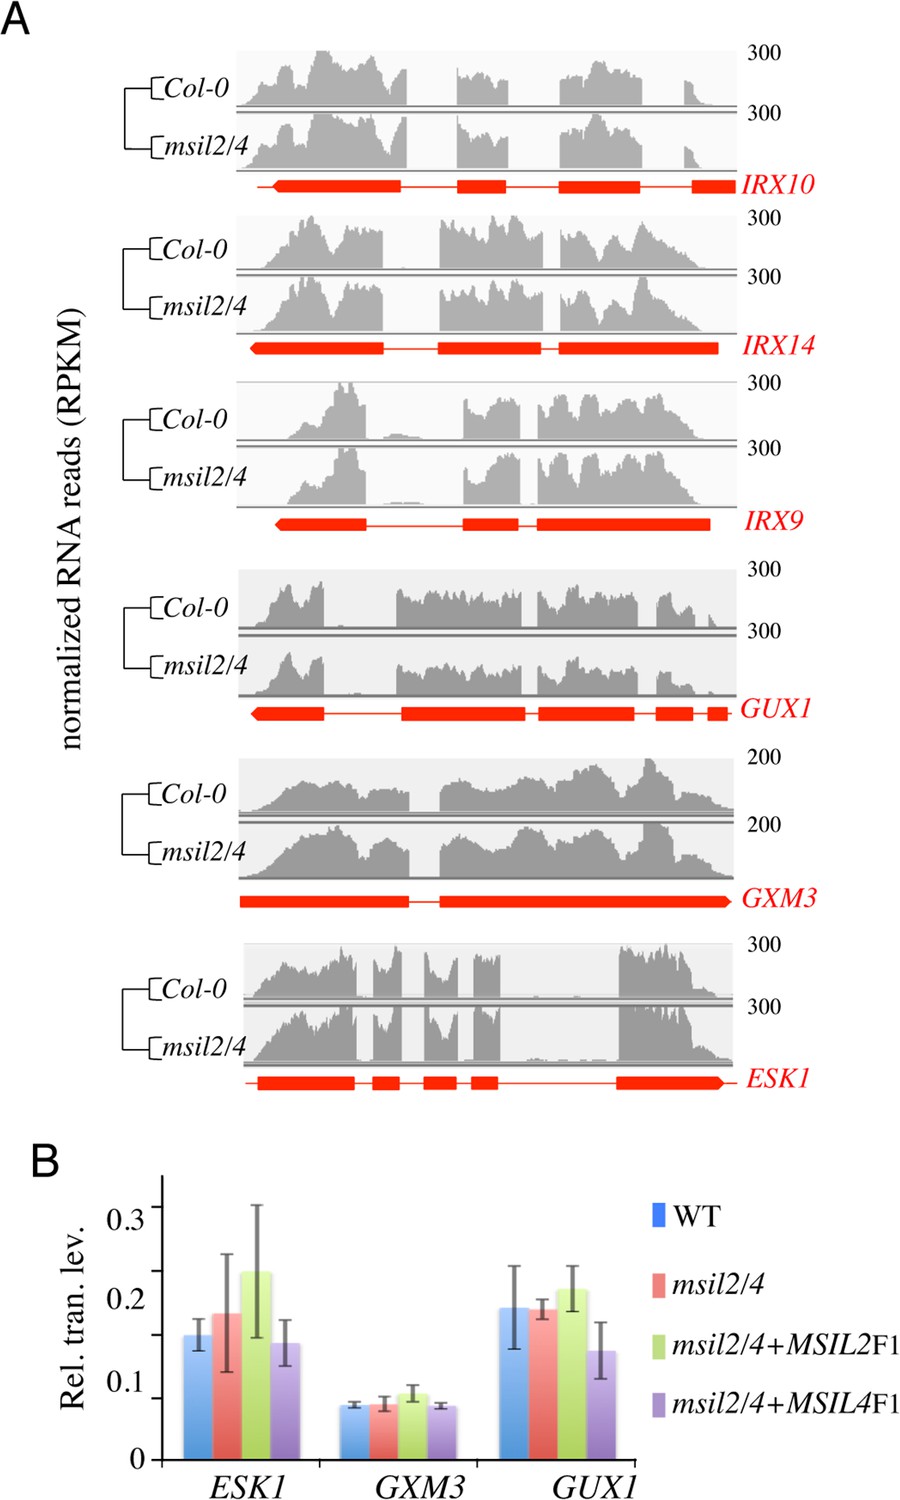
Gene expression of glucuronoxylan-related genes in Col-0 versus msil2/4 mutant plants.
(A) RNA-seq profiles of the glucuronoxylan-related biosynthetic genes identified in the mass spectrometry analysis. Data tracks show polyA +RNA reads detected in the Col-0 and msil2/4 mutant backgrounds. Read counts are normalized by total mapped reads and the fold change is indicated. Gene exons and UTRs are shown with red thick bars. (B) Quantitative RT-PCR analysis of genes involved in glucuronoxylan decoration in Col-0, msil2/4, and msil2/4+MSIL2 F1 and msi2/4+MSIL4 F1 plants. Data represent the means of 6 experiments and errors bars the corresponding SD values.
Figure 6 with 1 supplement
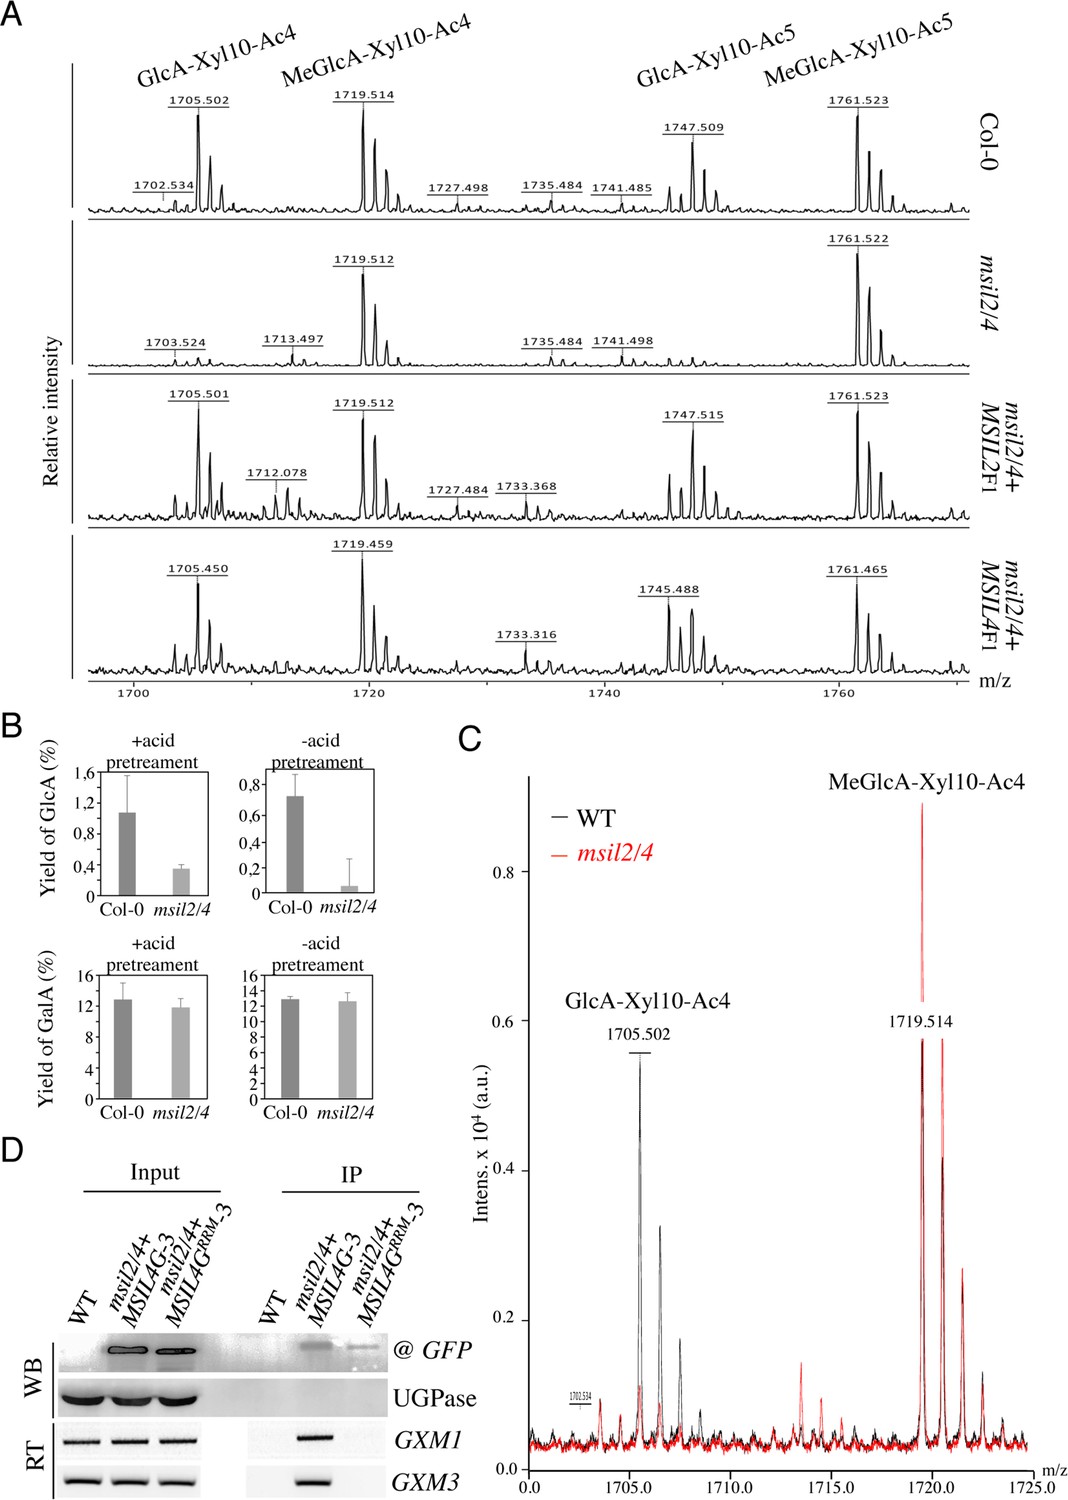
∣MSILs restrain the degree of 4-O-methylation of glucuroxylan in Arabidopsis inflorescence stem.
(A) MALDI-TOF mass spectra of xylooligosaccharides generated by xylanase digestion of xylan from Col-0, msil2/4, and complemented msil2/4-MSIL2F1 and msil2/4-MSIL4F1 inflorescence stem materials. The ions at m/z 1705/1747 and 1719/1761 correspond to acetylated xylo-decapolysaccharides bearing a GlcA residu (GlcA-Xyl10-Ac4//GlcA-Xyl10-Ac5) or a methylated GlcA residue (MeGlcA-Xyl10-Ac4//MeGlca-Xyl10-Ac5). (B) Acidic monosaccharide composition of alcohol insoluble residue (AIR) extracted from inflorescence stems of wild-type and msil2/4 mutant plants that have been pre-hydrolyzed or not with acid. GalA, galacturonic acid; GlcA, glucuronic acid. (C) Relative changes in unmethylated/methylated GlcA decapolysaccharide ratio in Col-0 (black) and msil2/4 mutant (red) as controlled by the addition of external spike-in control corresponding to a pentaacetyl-chitopentaose. (D) GFP-based RNA-IP assays. Top panel (WB): western blots performed using antiGFP or antiUGPase antibodies on protein fractions from inputs or antiGFP immunoprecipitates from WT and the msil2/4 mutant plants expressing the WT (MSIL4G-3) or RRM mutant (MSIL4GRRM-3) MSIL4-GFP fusions. Bottom panel (RT): Corresponding RT-PCR using GXM1 or GXM3 specific primers on RNA fractions.
-
Figure 6—source data 1
Uncropped Western gels of MSIL4-GFP, MSIL4-GFPRRM and UGP proteins from inputs or antiGFP immunoprecipitates.
Western blots were performed using either the antiGFP or antiUGPase antibodies.
- https://cdn.elifesciences.org/articles/88207/elife-88207-fig6-data1-v1.zip
-
Figure 6—source data 2
Uncropped gel of semi-quantitative RT-PCR performed on inputs or antiGFP immunoprecipitates.
GXM1 and GXM3-specific primers were used on the various RNA fractions.
- https://cdn.elifesciences.org/articles/88207/elife-88207-fig6-data2-v1.zip
Figure 6—figure supplement 1
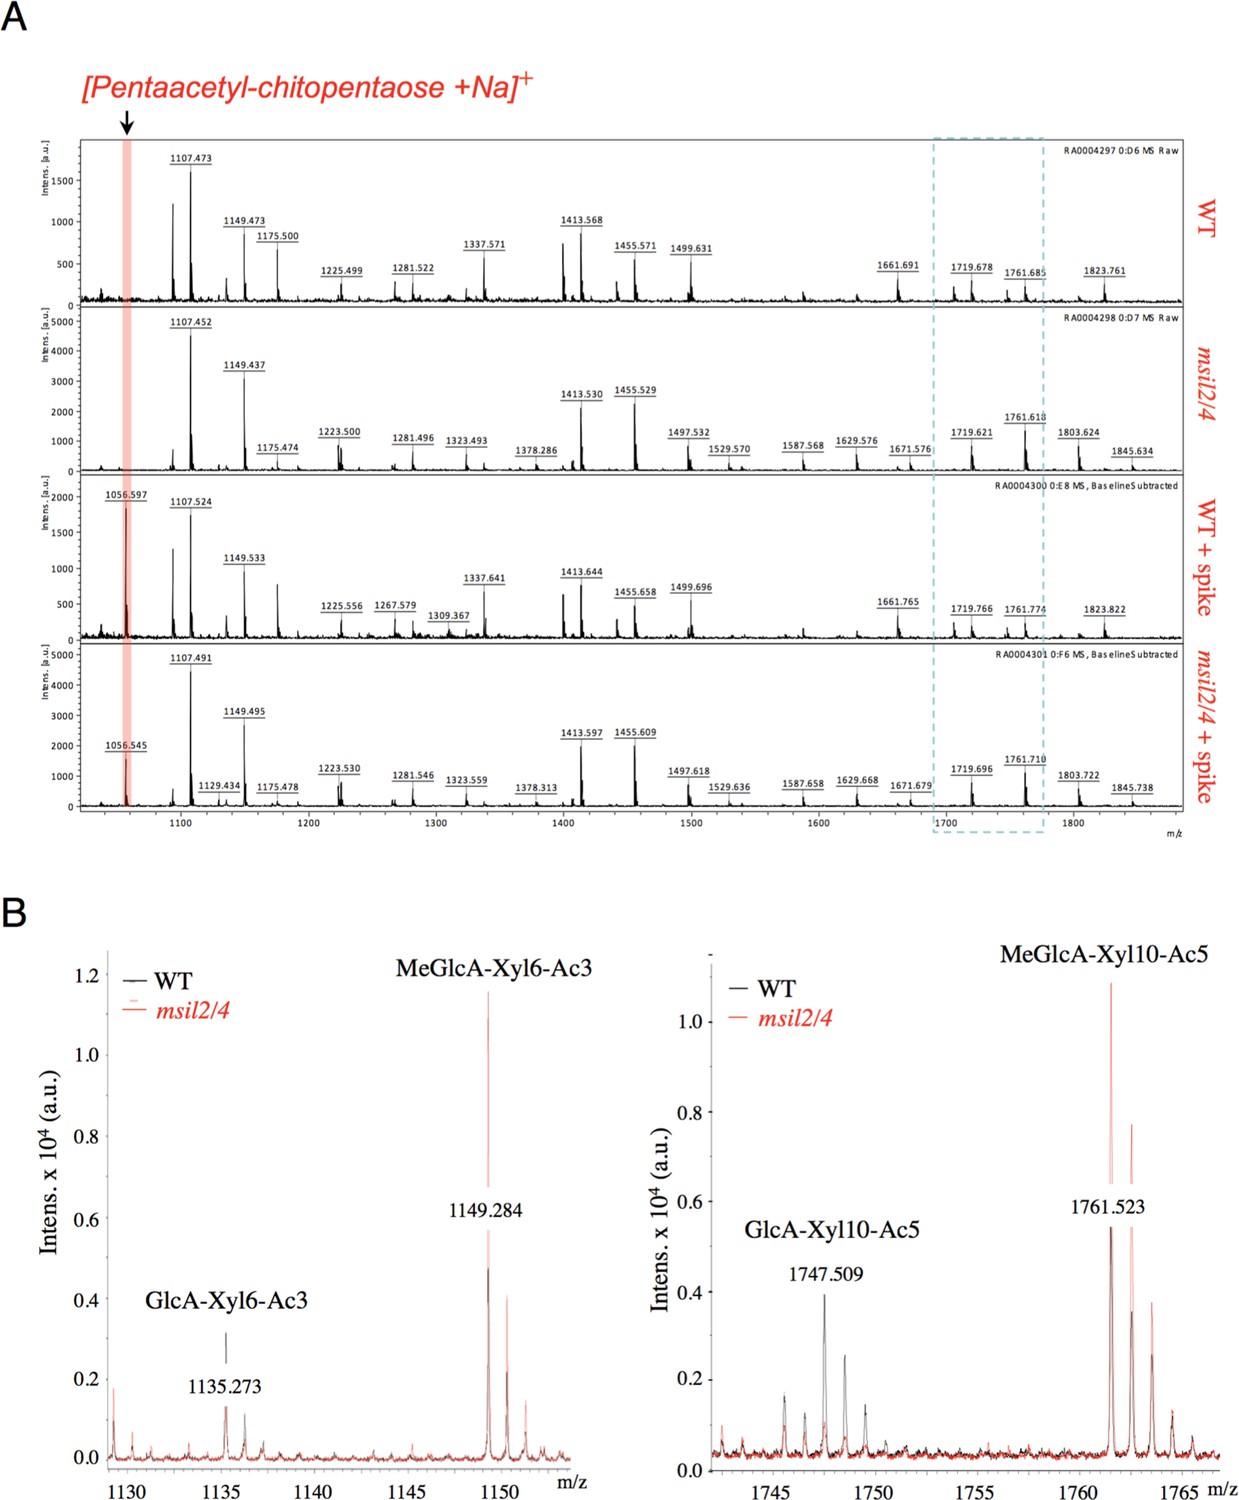
MALDI-TOF mass spectra analysis of glucuronoxylan digestion products of Col-0, msil2/4, msil2/4+MSIL2 F1 and msil2/4+MSIL4 F1 plants.
(A) Zoom out of the full MALDI-TOF spectra of xylopolysaccharides generated by xylanase digestion from Col-0 and msil2/4 mutant extracts with or without spike-in control. (B) Relative changes in unmethylated/methylated GlcA xylopolysaccharide ratio in Col-0 (black) and msil2/4 double mutant (red) as controlled by the addition of a spike-in control.
Figure 7
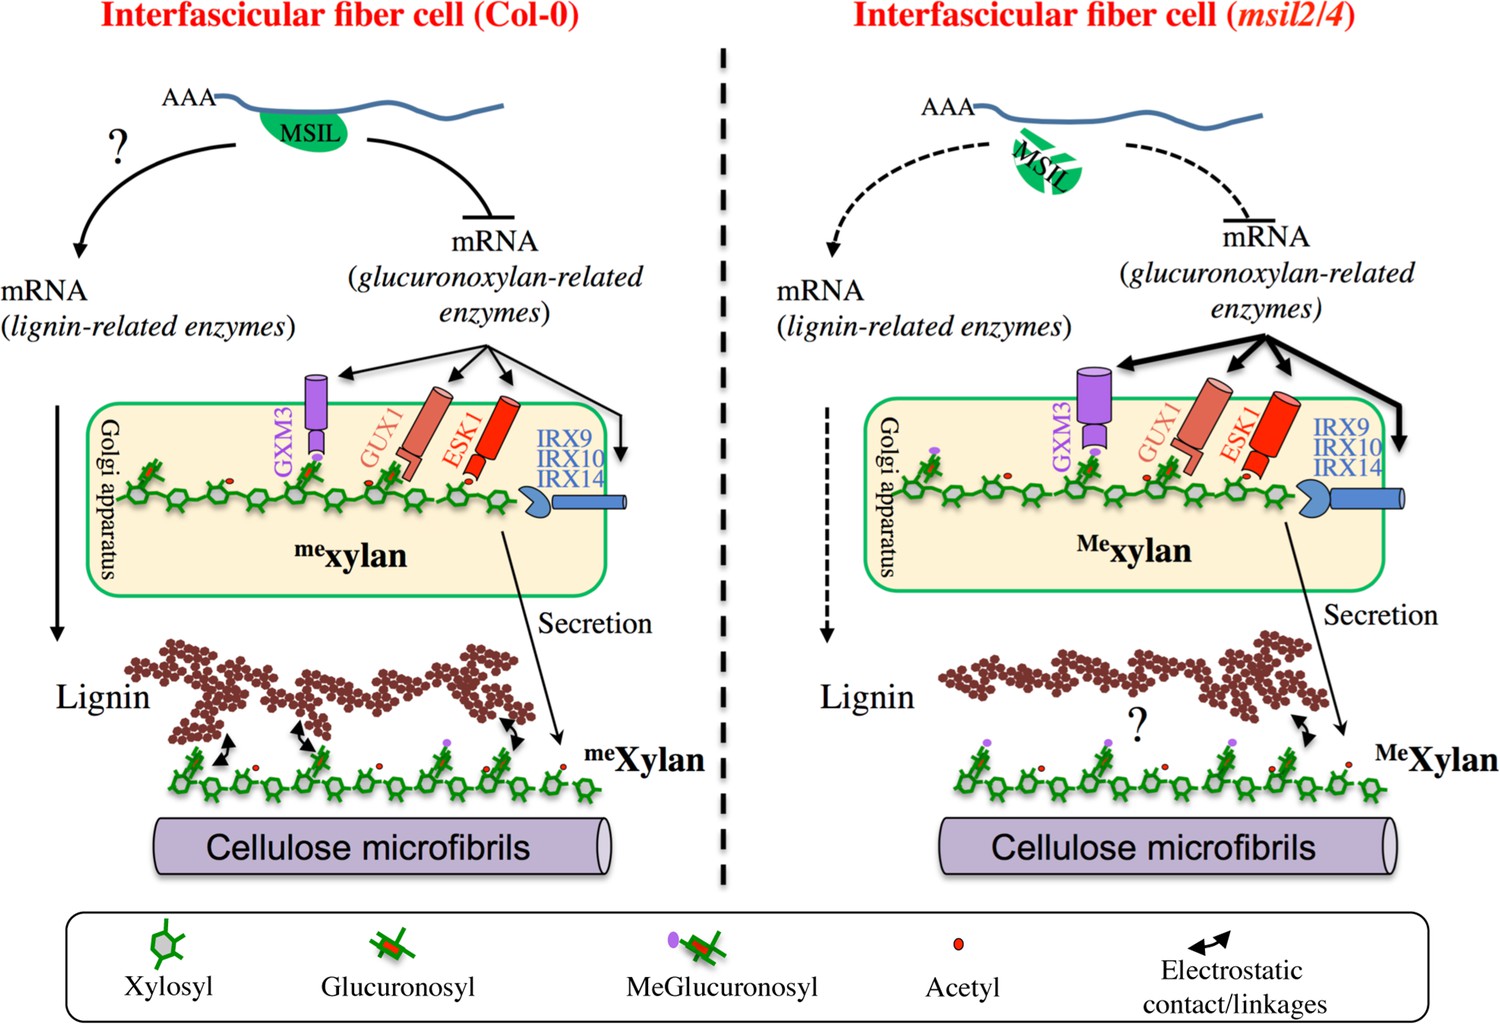
∣ Model of MSIL-dependent control of glucuronoxylan methylation in Arabidopsis and its consequence for SCW architecture.
In the interfascicular fiber cells of Col-0, MSIL2/4 restrain the translation of the glucuronoxylan biosynthesis enzymes, including the rate-limiting GXM3 enzyme. This activity would keep the level of glucuronoxylan methylation at an intermediate level, therefore providing a biochemical environment that favors the interactions between the glucuronoxylan and lignin polymers. In the interfascicular fiber cells of msil2/4 mutant, the translation of the glucuronoxylan biosynthesis machinery, including GXM3, is increased, leading to the deposition of an over-methylated form of glucuronoxylan that would be less prone to interact with lignin and establish SCW formation. In a non exclusive manner, MSIL2/4 could also have a positive role in lignin synthesis, whose defect in msil2/4 would lead to a decrease in lignin content. The model was inspired from Grantham et al., 2017.
Author response image 1
Additional files
-
Supplementary file 1
Affinity Purification - Mass spectrometry (AP-MS) - based proteomic analyses.
- https://cdn.elifesciences.org/articles/88207/elife-88207-supp1-v1.xls
-
Supplementary file 2
Wave numbers from FT-IR absorption spectra and their related compounds reported in literature.
- https://cdn.elifesciences.org/articles/88207/elife-88207-supp2-v1.xlsx
-
Supplementary file 3
Genes down-regulated in msil2/4.
- https://cdn.elifesciences.org/articles/88207/elife-88207-supp3-v1.xls
-
Supplementary file 4
MS-based label-free quantitative proteomic analysis of Col-0 (WT) and msil2/4 (mutant).
- https://cdn.elifesciences.org/articles/88207/elife-88207-supp4-v1.xls
-
Supplementary file 5
Quantification of the LM10 and LM11 fluorescence signals from the xylem cells from Col-0 and msil2/4 mutant inflorescence stems.
- https://cdn.elifesciences.org/articles/88207/elife-88207-supp5-v1.xlsx
-
Supplementary file 6
Normalization of Col-0 and msil2/4 xylan MALDI-TOF MS peak intensities using an internal standard (pentaacetyl-chitopentaose).
- https://cdn.elifesciences.org/articles/88207/elife-88207-supp6-v1.doc
-
Supplementary file 7
Primers used in this work.
- https://cdn.elifesciences.org/articles/88207/elife-88207-supp7-v1.xls
-
MDAR checklist
- https://cdn.elifesciences.org/articles/88207/elife-88207-mdarchecklist1-v1.docx
Download links
A two-part list of links to download the article, or parts of the article, in various formats.
Downloads (link to download the article as PDF)
Open citations (links to open the citations from this article in various online reference manager services)
Cite this article (links to download the citations from this article in formats compatible with various reference manager tools)
Cell-type-specific control of secondary cell wall formation by Musashi-type translational regulators in Arabidopsis
eLife 12:RP88207.
https://doi.org/10.7554/eLife.88207.3


