Intrinsic protein disorder is insufficient to drive subnuclear clustering in embryonic transcription factors
- Howard Hughes Medical Institute, University of California, United States
Figures
Figure 1
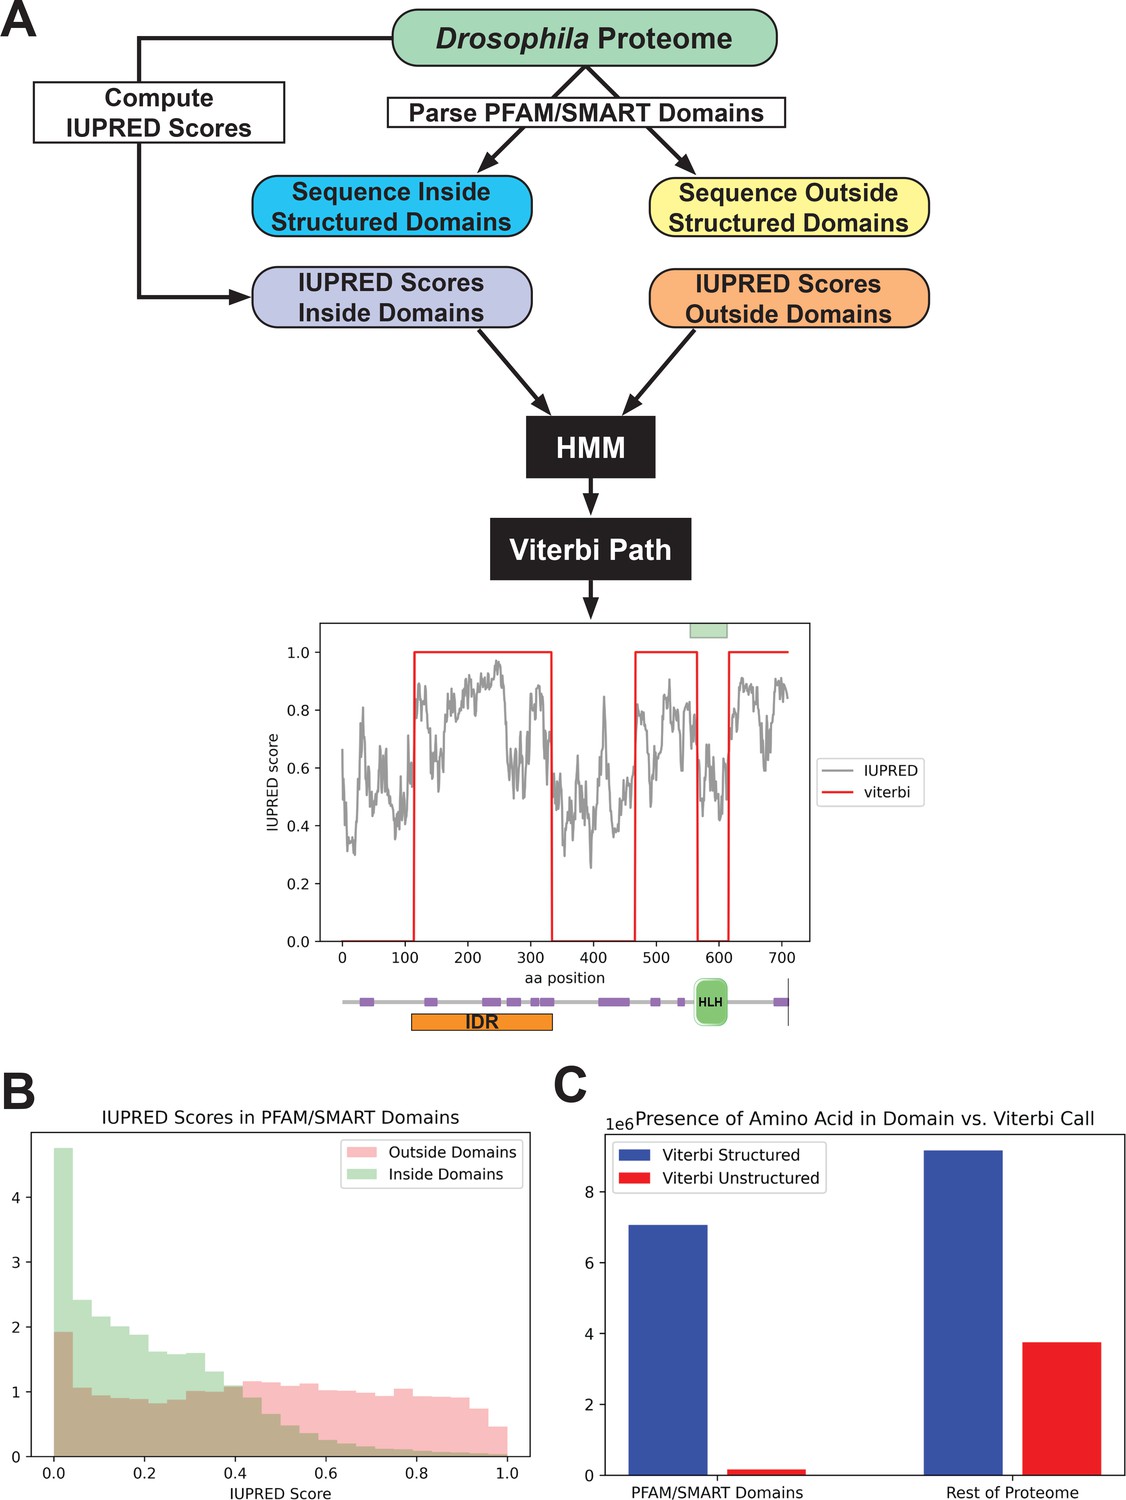
Predicting disorder from the proteome.
(A) A summary of the workflow of the intrinsically disordered region (IDR) prediction algorithm. IUPred scores were computed for the entire proteome, and the output was parsed into scores for sequences inside annotated structured domains, or in unannotated regions of the proteome. These two sets of IUPred scores were used to train a hidden Markov model (HMM) to assign sequences in the proteome to ‘structured’ and ‘unstructured’ states. A Viterbi path was computed from the HMM to provide a binary output of the predictions. The plot shows the output of the algorithm for the daughterless transcription factor (TF). The IUPred ‘long’ scores are plotted in black, and the Viterbi path from our HMM is shown in red. The green box at the top of the figure denotes the annotated structured domain from SMART, extracted from the FlyBase GFF file, for this protein. Beneath the figure is a schematic of the linear protein structure (modified from SMART; Letunic et al., 2015; Schultz et al., 1998), with IDRs indicated in purple and a helix-loop-helix binding domain in green. The IDR isolated for this study is shown in orange. (B) Histogram showing the distribution of IUPred ‘long’ scores in regions of the proteome annotated as structured domains by Pfam and/or SMART (green) vs. regions outside of known domains (red). (C) The number of amino acids from the proteome that are classified as structured (blue) vs. unstructured (red) by our HMM Viterbi call in annotated Pfam/SMART domains and in regions of the proteome outside of known domains.
Figure 2
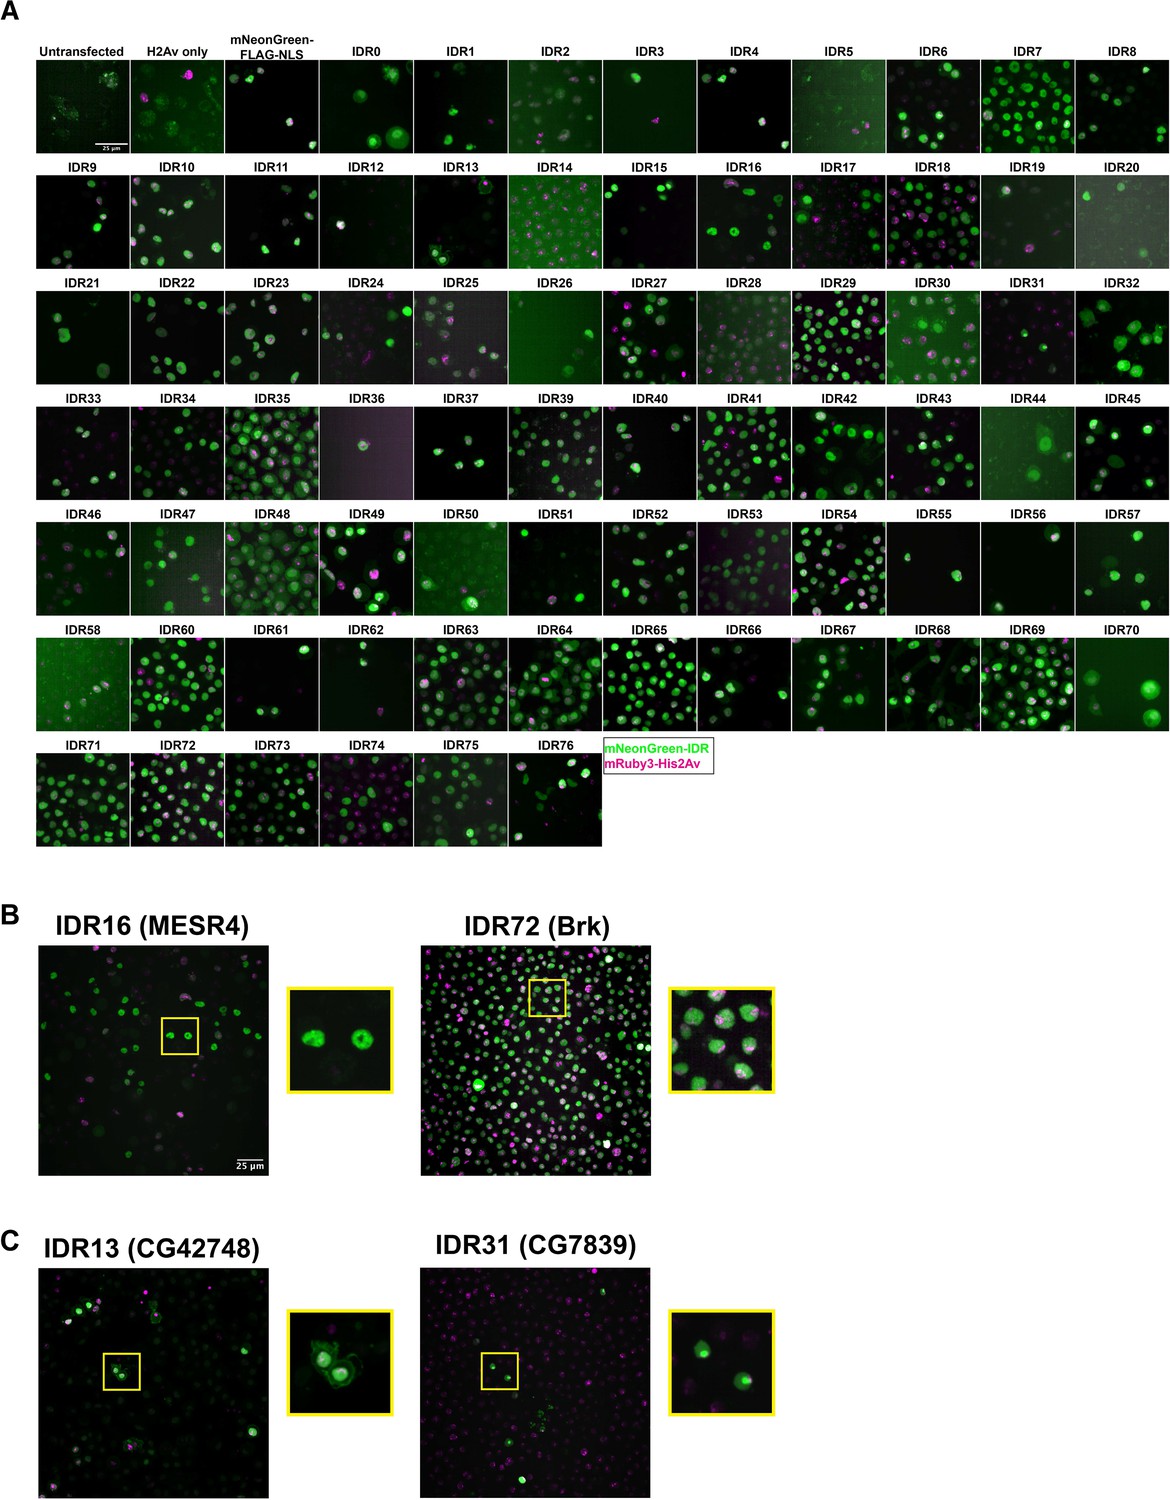
Intrinsically disordered region (IDR) imaging screen.
(A) Representative images from each Schneider-2 (S2) cell line in the imaging screen. Untransfected controls were transfected with the p8HCO methotrexate resistance plasmid and maintained alongside experimental cell lines. His2Av only was transfected with p8CHO and pCopia-mRuby3-His2Av. All other cell lines were transfected with the pCopia-mNeonGreen-tagged IDR indicated + p8 CHO + pCopia-mRuby3-His2Av. The mNeonGreen-FLAG-NLS line is expressing the pCopia-mNeonGreen construct with no IDR inserted. Images were cropped to ~70 µm2 for display. (B) Enlarged images from panel (A) for the IDRs from MESR4 and Brk, both of which show subnuclear clustering. (C) Enlarged images from panel (A) for the IDRs from CG42748, which localizes to both the nucleus and the plasma membrane, and CG7839 which localizes to the nucleolus and is present throughout the rest of the nucleus.
Figure 3 with 1 supplement
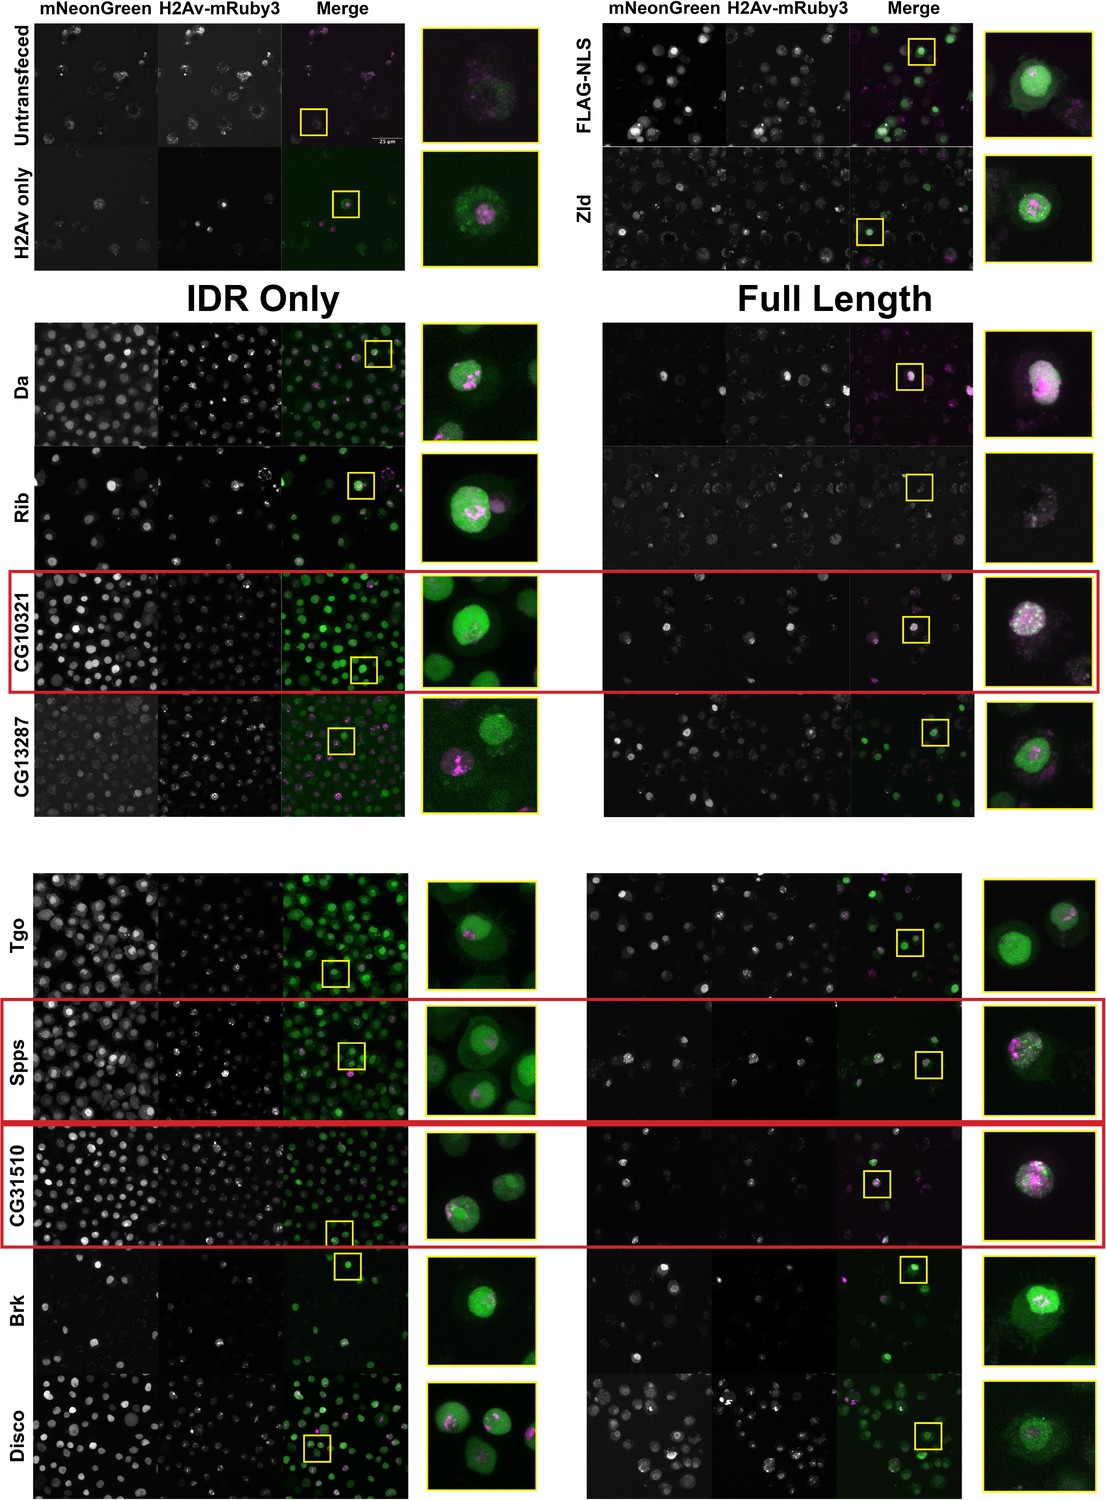
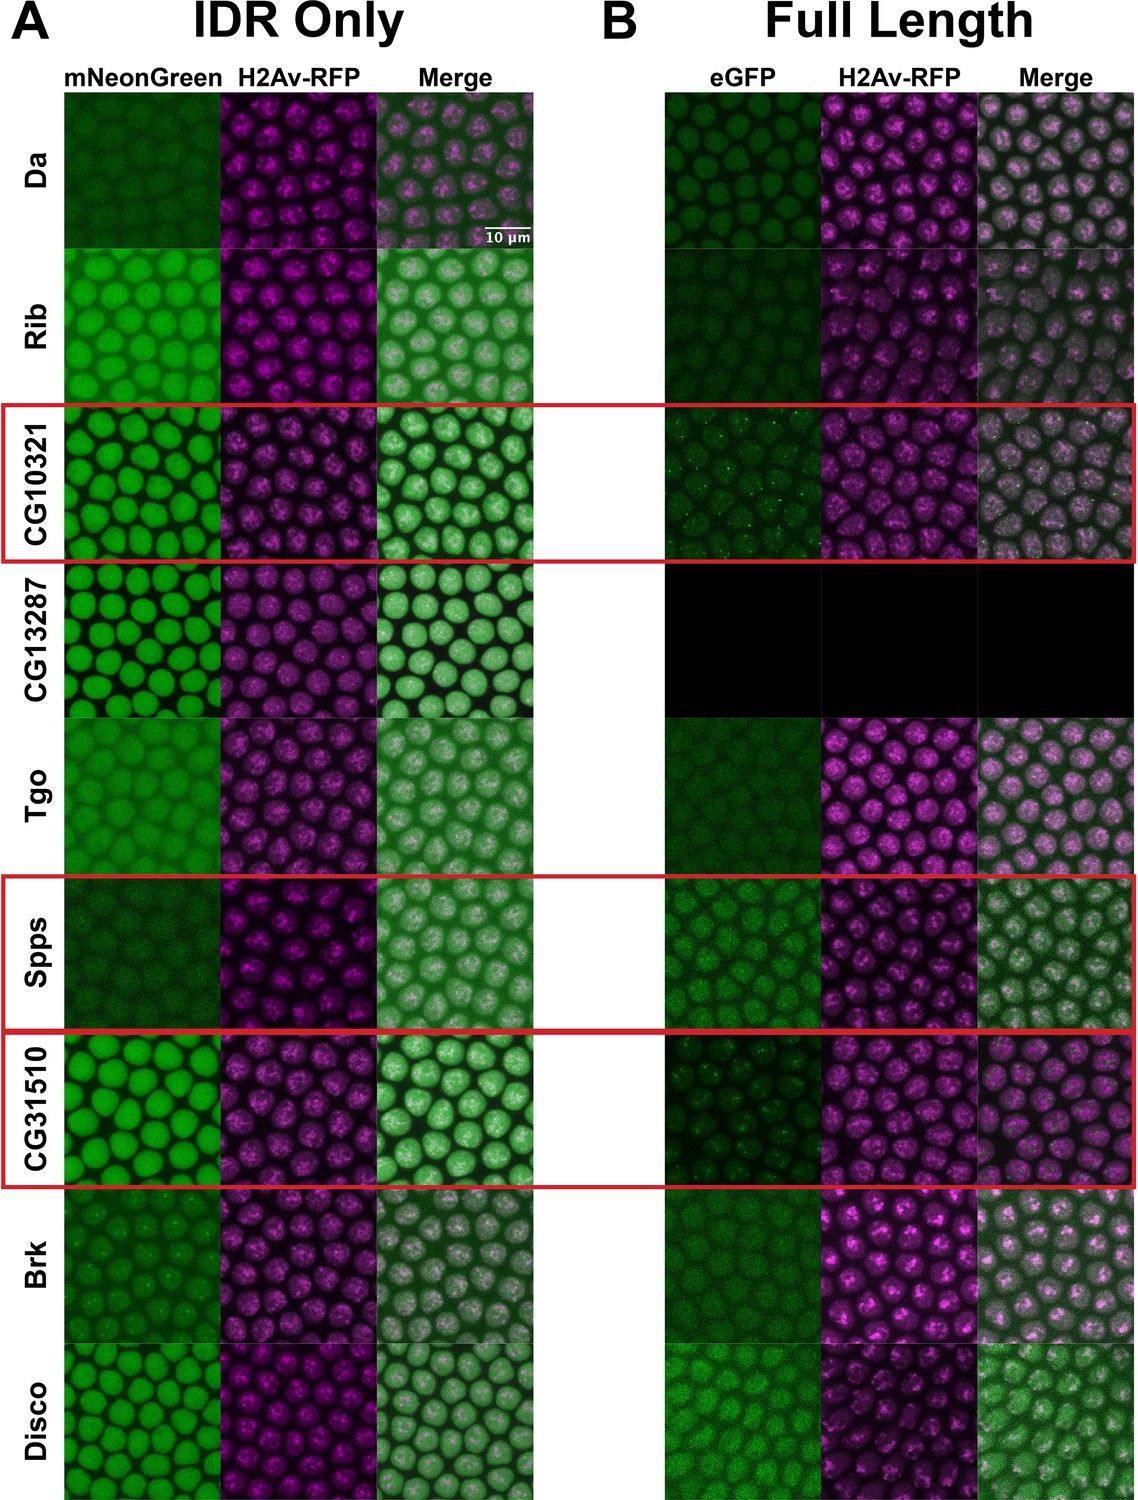
A subset a full-length transcription factors (TFs) cluster in Schneider-2 (S2) cells.
S2 cell lines expressing mNeonGreen-tagged intrinsically disordered regions (IDRs) or full-length proteins and mRuby3-tagged His2Av. The top four panels indicate control cell lines. IDRs and their full-length counterparts are shown in the remaining panels. The name of the TF is indicated at the far left. IDRs alone are shown in the panels on the left and full-length proteins on the right. The TFs that show the strongest clustering are indicated with red boxes. No positively transfected cells were identified for the full-length Rib expression construct. Images are maximum intensity z-projections, and contrast was adjusted uniformly across the entire image for display.
Figure 3—figure supplement 1
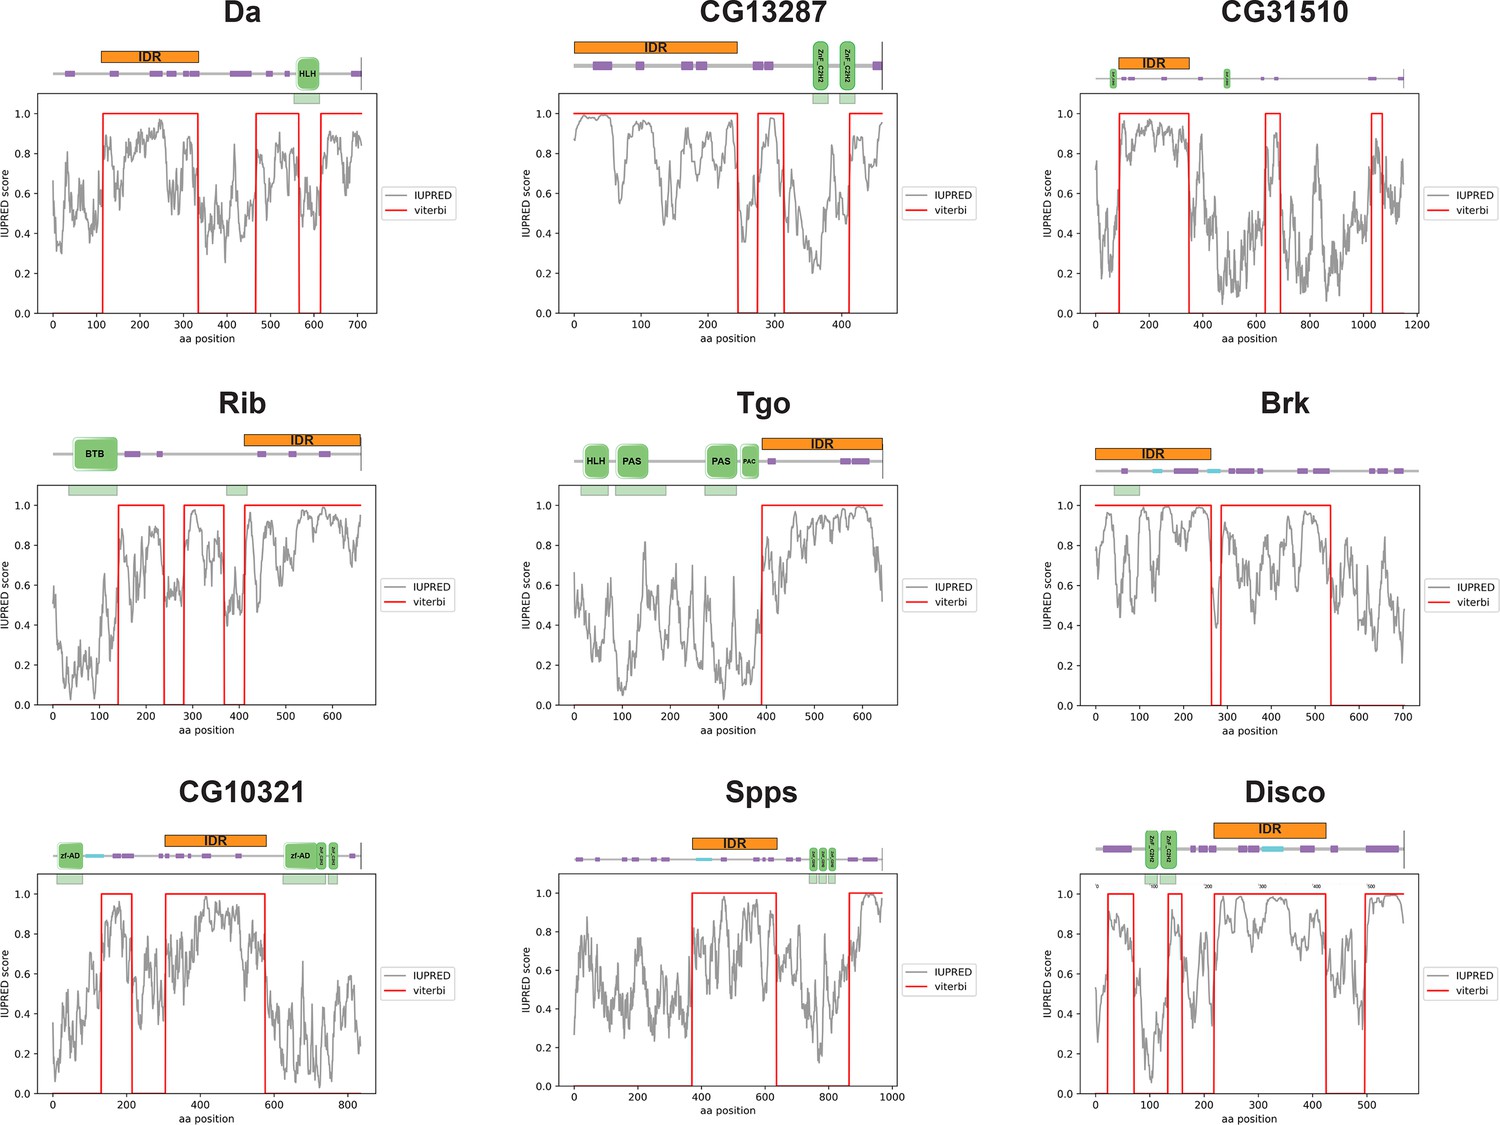
Viterbi plots for candidate transcription factors (TFs).
Plots showing the output of the intrinsically disordered region (IDR) prediction hidden Markov model (HMM) for each of the TFs in our data set. Schematics of the linear structure of each protein (modified from SMART) are shown above the plot. SMART domains are shown in green, low complexity sequences as identified by SMART are shown in purple, and coiled-coil domains are shown in teal.
Figure 4 with 1 supplement
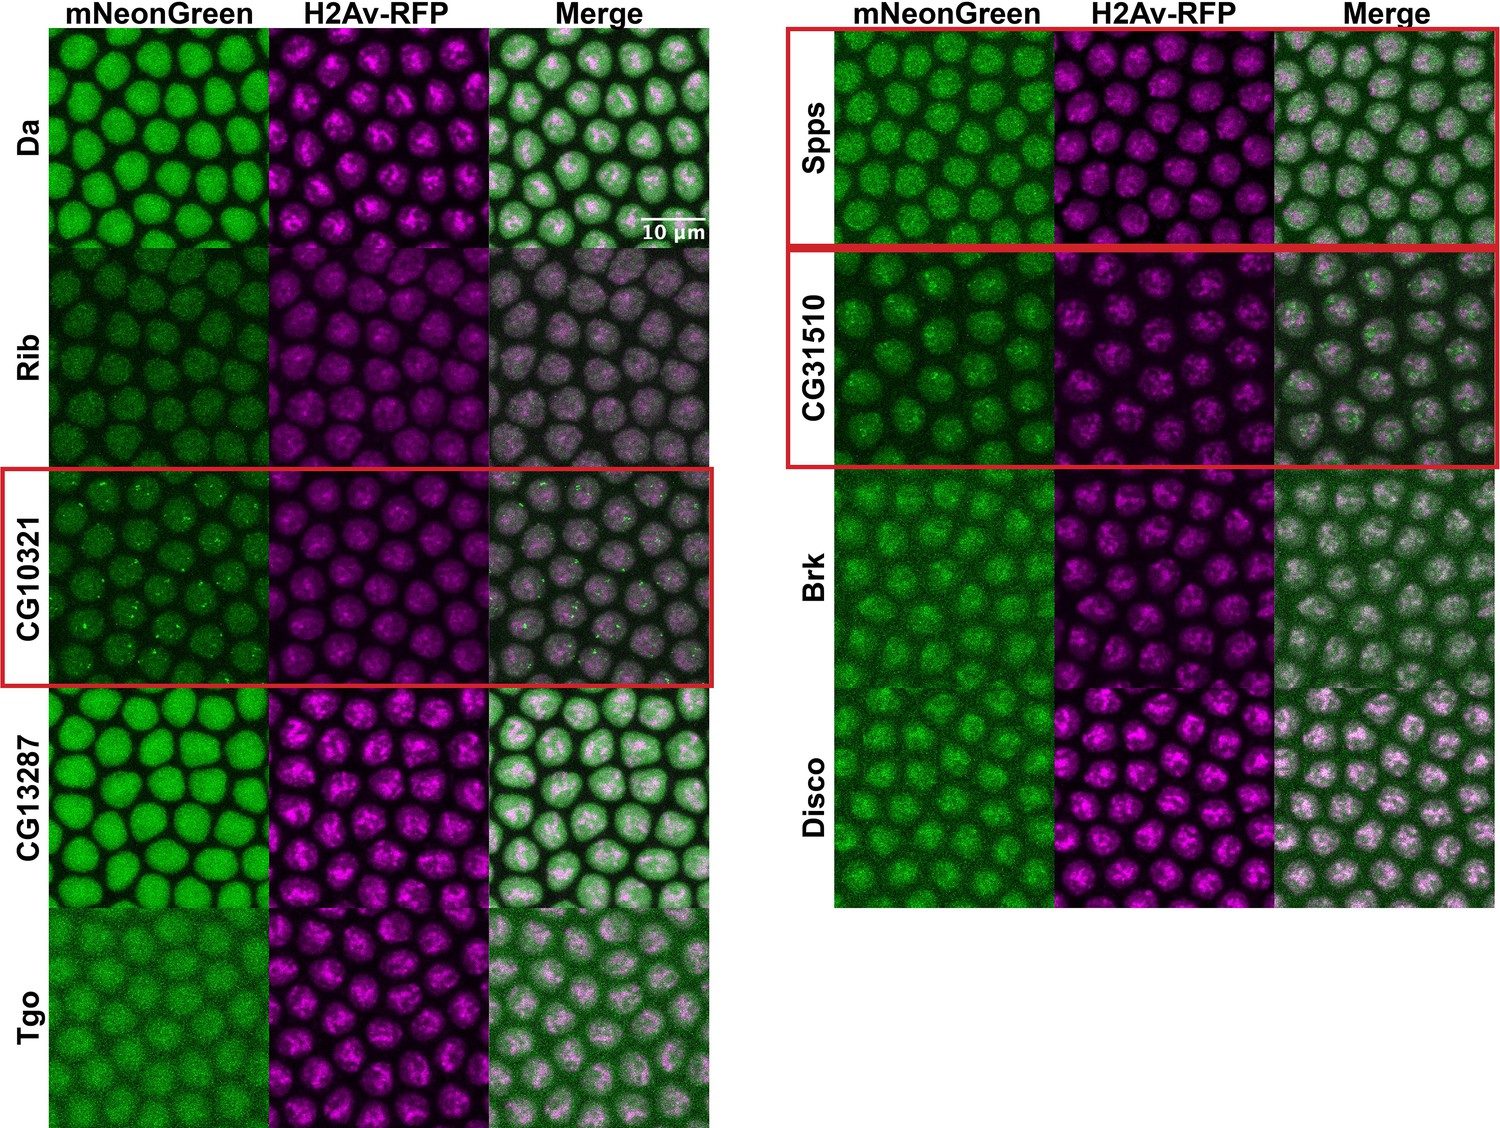
Intrinsically disordered regions (IDRs) vs full-length transcription factors (TFs) in embryos.
Expression of transgenic mNeonGreen-tagged IDRs (A) or full-length TFs tagged at the endogenous locus with eGFP (B) and His2Av-RFP in nuclear cycle 14 (NC14) embryos. The name of the TF is indicated at the far left. The TFs that show the strongest clustering are indicated with red boxes. No full-length CG13287 expression was observed in embryos. Images are maximum intensity z-projections, and contrast was adjusted uniformly across the entire image for display.
Figure 4—figure supplement 1

Brk localizes to the histone locus body.
Nuclei from a nuclear cycle 14 (NC14) embryo expressing a transgenic mNeonGreen-tagged Brk intrinsically disordered region (IDR) and Mxc tagged at the endogenous locus with mRuby3. The image is a maximum intensity z-projection, and contrast was adjusted uniformly across the entire image for display.
Figure 5 with 1 supplement
Transgenic full-length transcription factors (TFs).
Nuclear cycle 14 (NC14) embryos expressing transgenic mNeonGreen-tagged full-length TFs and His2Av-RFP. The name of the TF is indicated at the far left. Images are maximum intensity z-projections, and contrast was adjusted uniformly across the entire image for display.
Figure 5—figure supplement 1
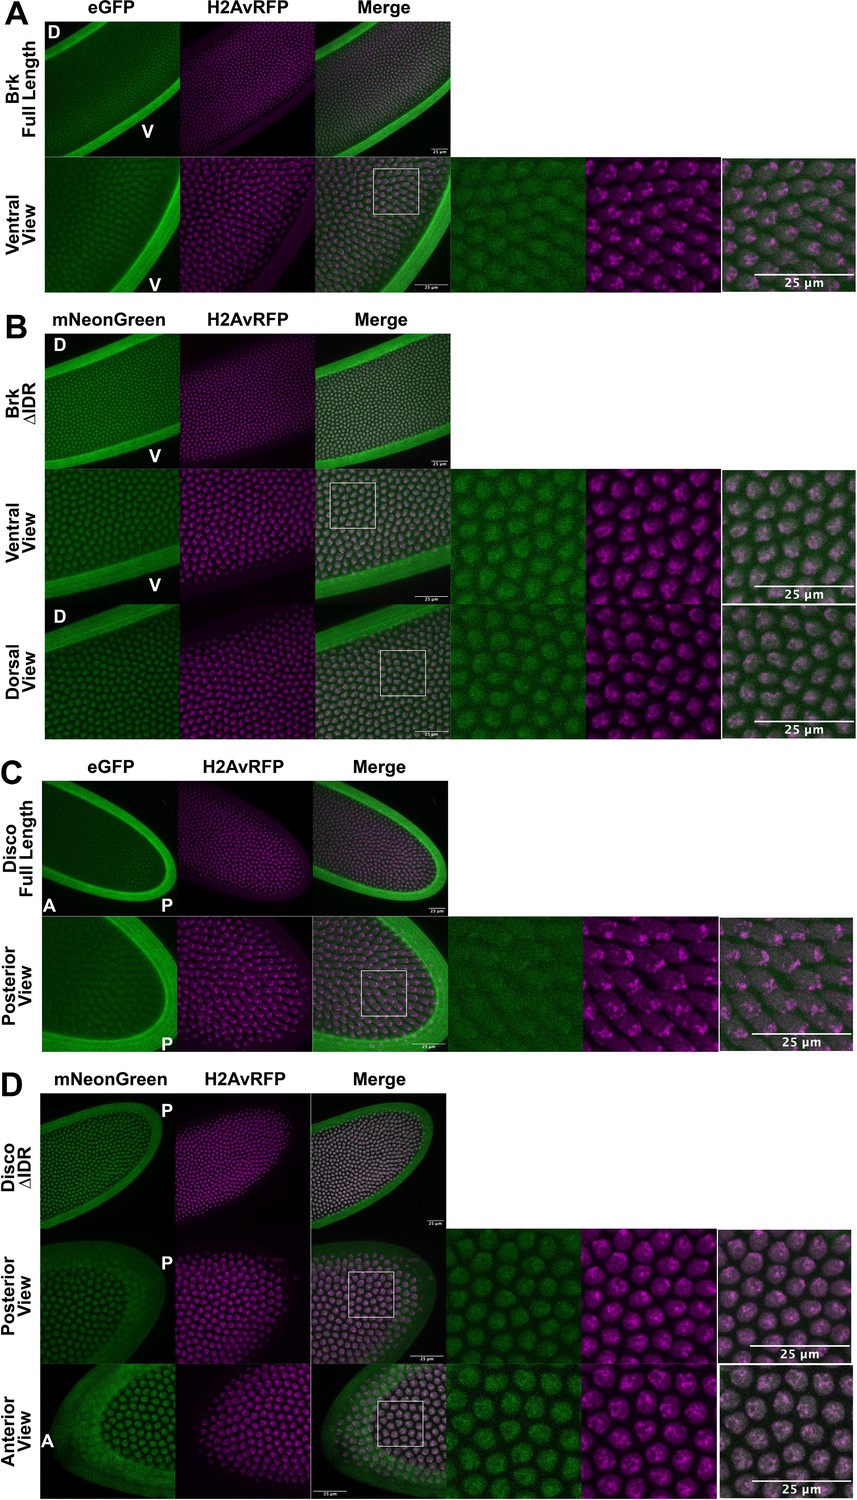
Subnuclear localization patterns of intrinsically disordered region (IDR) deletion constructs are uniform across the embryo.
(A) Brk tagged at the endogenous locus with eGFP. The labeled protein is expressed at low levels in nuclei on the ventral side of the embryo. The ventral view panel shows a 2× zoom of the same embryo above. D and V denote dorsal and ventral sides of the embryo, respectively. (B) Expression of a transgenic mNeonGreen-tagged Brk with the IDR deleted. The transgenic protein is expressed uniformly throughout the embryo. Ventral and dorsal views show 2× zoom in two different regions of the embryo above. (C) Disco tagged at the endogenous locus with eGFP. The labeled protein is expressed late in nuclear cycle 14 (NC14) at very low levels in nuclei at the posterior of the embryo. The posterior view panel shows a 2× zoom of the same embryo above. A and P denote anterior and posterior sides of the embryo, respectively. (D) Expression of a transgenic mNeonGreen-tagged Disco with the IDR deleted. The transgenic protein is expressed uniformly throughout the embryo. Posterior and anterior views show 2× zoom in two different regions of the embryo above. All images are maximum intensity z-projections, and in each panel, contrast was adjusted uniformly across the entire image for display.
Figure 6
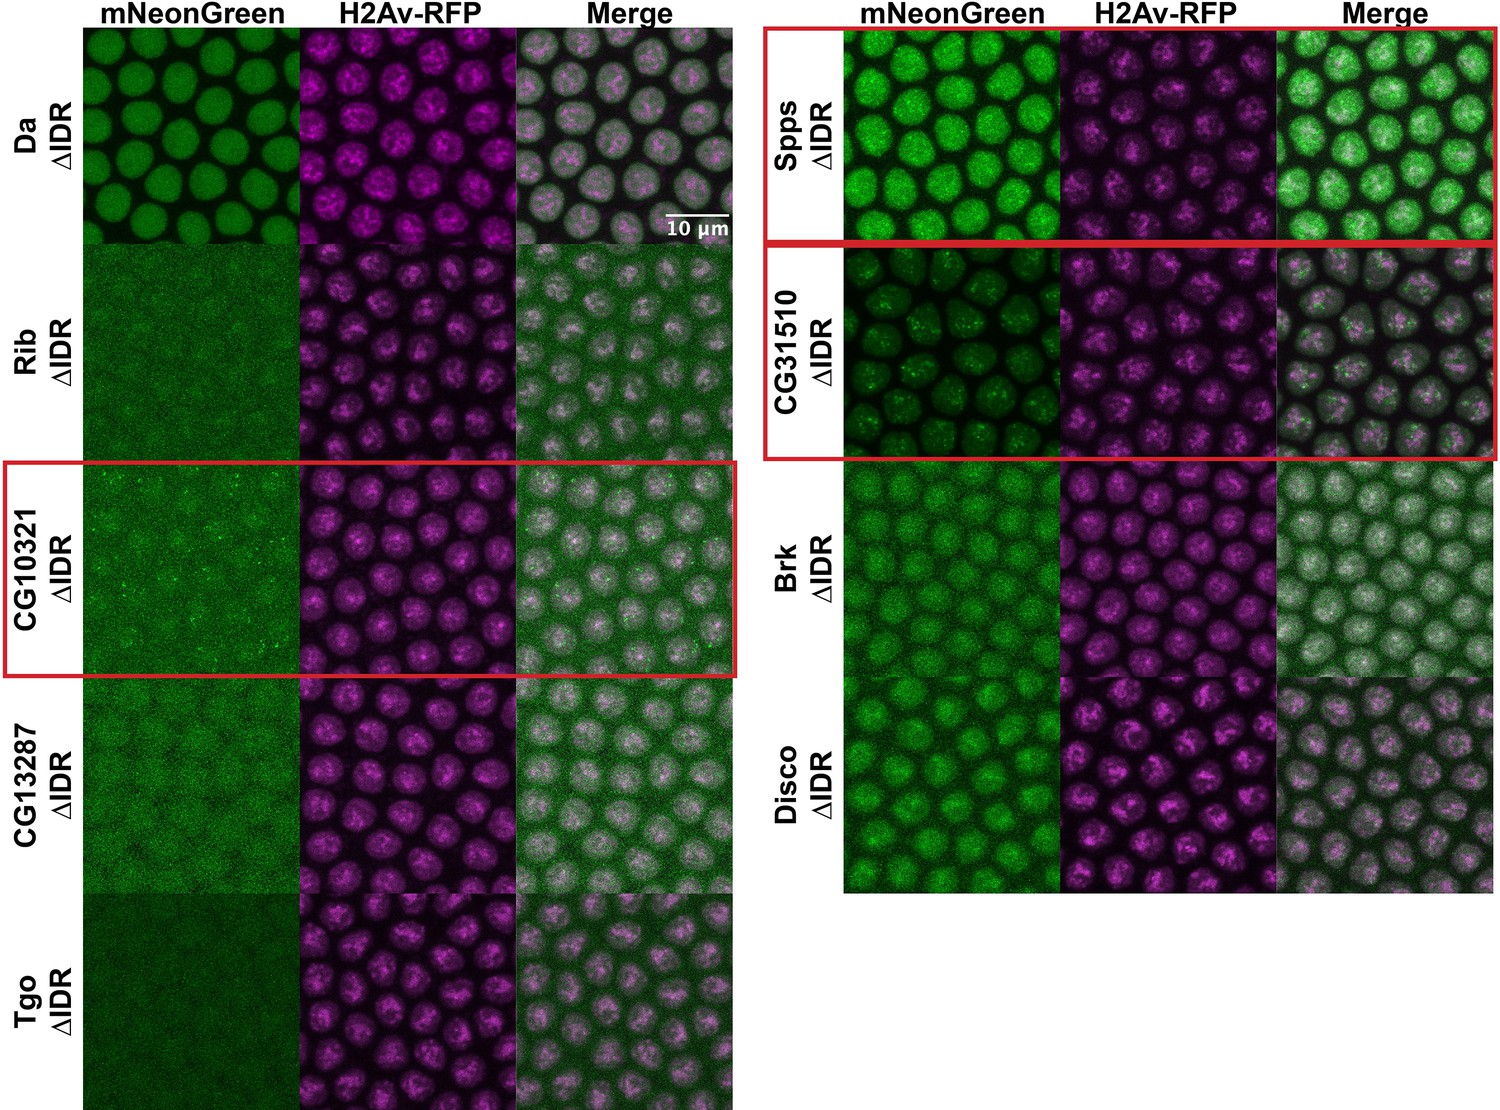
Intrinsically disordered region (IDR) deletions do not affect transcription factor (TF) localization.
Nuclear cycle 14 (NC14) embryos expressing transgenic mNeonGreen-tagged TFs with IDR deletions and His2Av-RFP. The name of the TF is indicated at the far left. Images are maximum intensity z-projections, and contrast was adjusted uniformly across the entire image for display.
Tables
Table 1
Panel of transcription factors (TFs) chosen for full-length expression constructs in Schneider-2 (S2) cells and Drosophila embryos.
| IDR # | FlyBase ID | TF name | IDR length (AAs) | Full length | IDR start | IDR end |
|---|---|---|---|---|---|---|
| 6 | FBpp0304504 | Da | 219 | 710 | 116 | 334 |
| 17 | FBpp0303090 | Rib | 249 | 661 | 413 | 661 |
| 18 | FBpp0071577 | CG10321 | 270 | 835 | 307 | 576 |
| 26 | FBpp0076735 | CG13287 | 245 | 461 | 1 | 246 |
| 44 | FBpp0081483 | Tgo | 251 | 642 | 392 | 642 |
| 64 | FBpp0083950 | Spps | 265 | 968 | 372 | 636 |
| 65 | FBpp0084158 | CG31510 | 260 | 1150 | 90 | 349 |
| 72 | FBpp0071007 | Brk | 264 | 704 | 1 | 264 |
| 76 | FBpp0074028 | Disco | 206 | 568 | 220 | 425 |
Additional files
-
Source code 1
Python code used to generate the HMM IDR predictions, provided as a Jupyter Notebook.
- https://cdn.elifesciences.org/articles/88221/elife-88221-code1-v1.zip
-
Supplementary file 1
It contains identifying information, amino acid, and DNA sequences of all intrinsically disordered regions (IDRs) expressed in Schneider-2 (S2) cells in Figure 2.
- https://cdn.elifesciences.org/articles/88221/elife-88221-supp1-v1.xlsx
-
Supplementary file 2
It contains sequences of primers used to generate transgenic Drosophila lines expressing intrinsically disordered regions (IDRs) or full-length transcription factors (TFs) in Figures 4—6.
- https://cdn.elifesciences.org/articles/88221/elife-88221-supp2-v1.xlsx
-
Supplementary file 3
It contains sequences of primers used to generate CRISPR tagging constructs, sgRNA sequences, screening primers to identify CRISPR insertions, and a list of injected fly lines to produce the endogenously tagged transcription factors (TFs) shown in Figure 4 and Figure 4—figure supplement 1.
- https://cdn.elifesciences.org/articles/88221/elife-88221-supp3-v1.xlsx
-
MDAR checklist
- https://cdn.elifesciences.org/articles/88221/elife-88221-mdarchecklist1-v1.pdf
Download links
A two-part list of links to download the article, or parts of the article, in various formats.
Downloads (link to download the article as PDF)
Open citations (links to open the citations from this article in various online reference manager services)
Cite this article (links to download the citations from this article in formats compatible with various reference manager tools)
Intrinsic protein disorder is insufficient to drive subnuclear clustering in embryonic transcription factors
eLife 12:RP88221.
https://doi.org/10.7554/eLife.88221.2


