Retinal input integration in excitatory and inhibitory neurons in the mouse superior colliculus in vivo
- Neuroscience Research Center, Charité-Universitätsmedizin Berlin, Germany
- Bernstein Center for Computational Neuroscience Berlin, Germany
- Institute for Theoretical Biology, Humboldt-Universität zu Berlin, Germany
- Einstein Center for Neurosciences Berlin, Germany
Figures
Figure 1 with 2 supplements
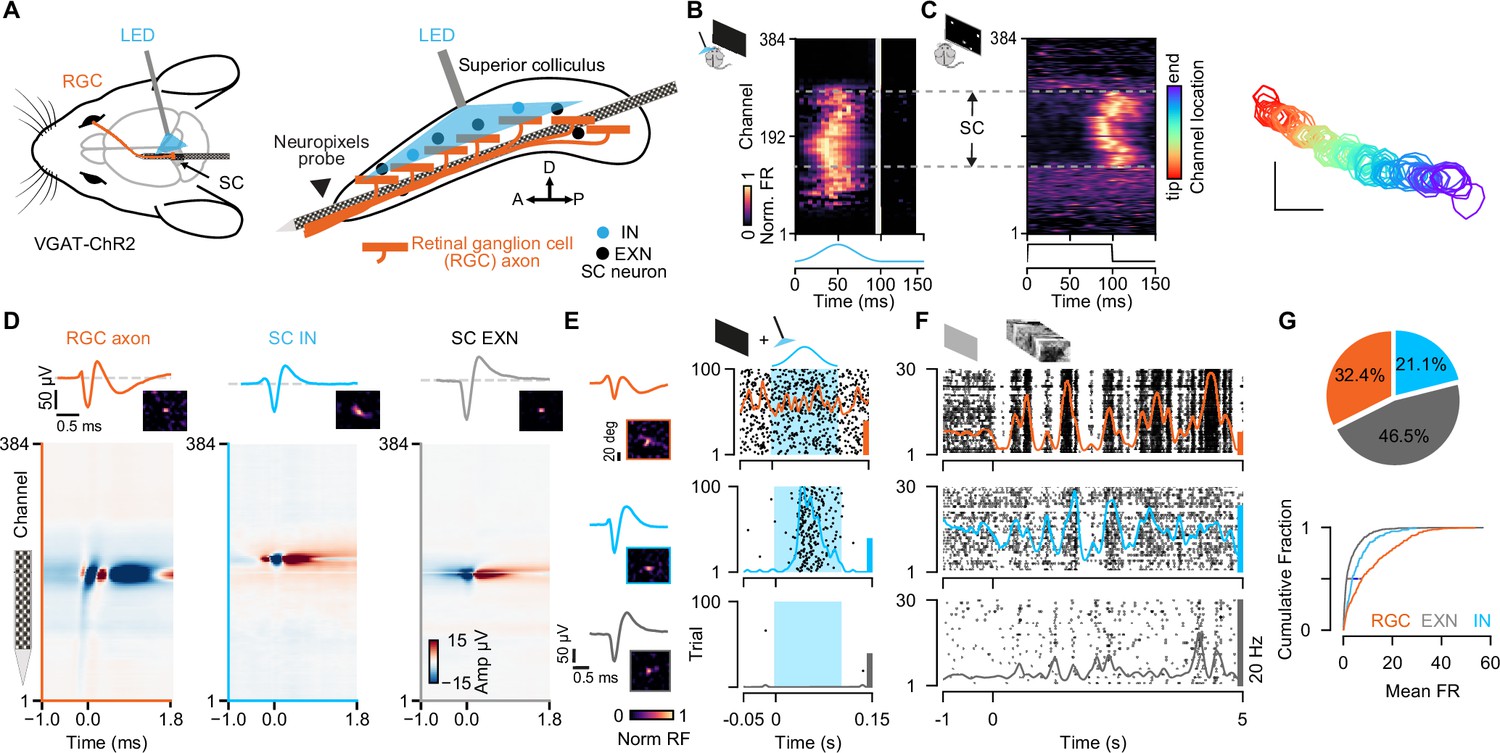
Simultaneous extracellular recordings of retinal ganglion cell (RGC) axons and superior colliculus (SC) neurons combined with optotagging identifies GABAergic neurons in VGAT-ChR2 mice.
(A) Recording configuration for tangential electrode insertion and optotagging in the visual layers of mouse SC. The optogenetic fiber is inserted perpendicularly to the Neuropixels probe to activate GABAergic cells in VGAT-ChR2 mice. RGC afferents (orange) project onto GABAergic (blue) and non-GABAergic (black) neurons in SC. (B) Multi-unit response (MUA) to optogenetic stimulation along the 384 recording sites during the presentation of a black screen. The large spatial extent of the optogenetic activation is evident. Gray vertical bar = light artifacts induced by the LED stimulation. (C) Visually evoked MUA during the presentation of a sparse noise stimulus along the recording sites. Receptive field contours of recording sites with high signal-to-noise ratio. The color code reflects the location within the SC. Scale bar represents 10°. (D) Spatiotemporal waveform profiles. Single channel waveforms identified at the peak channel (top) and multi-channel waveforms (bottom) for RGC axon (left, orange) and inhibitory (middle, blue) and excitatory (right, gray) SC neurons. Receptive fields (RFs) indicate visually responsive neurons. (E) Identification of SC cell types via optotagging. Raster plots and peri-stimulus time histograms (PSTHs) for single-neuron responses to blue light pulses (100 ms) presented under baseline conditions. Excitatory SC neurons (EXNs, bottom) and RGCs (top) do not respond to the LED pulse, while GABAergic SC neurons respond to the light pulse with an increase in spiking response (middle). Optogenetic stimulation period is highlighted in blue. The colored scale bars on the right represent 20 Hz firing rate. (F) PSTHs and raster plots for different cell types shown in (E) in response to a natural movie stimulus (10 s, 30 trials). Note the high firing rate in RGCs. (G) Top: Proportion of identified GABAergic (INs, blue), non-GABAergic (EXNs, gray) SC neurons and retinal axons (RGCs, orange) populations. Note that around one third of the captured SC neurons are GABAergic (n=326 RGCs, n=468 EXNs, n=212 INs). Bottom: Cumulative distribution of mean firing rates in response to a natural movie stimulus presented for 10 s, 30 trials. Two-sided Wilcoxon rank-sum test.
-
Figure 1—source code 1
Code to plot Figure 1D–G.
- https://cdn.elifesciences.org/articles/88289/elife-88289-fig1-code1-v1.zip
-
Figure 1—source data 1
Data for Figure 1G: mean firing rates.
- https://cdn.elifesciences.org/articles/88289/elife-88289-fig1-data1-v1.xlsx
Figure 1—figure supplement 1
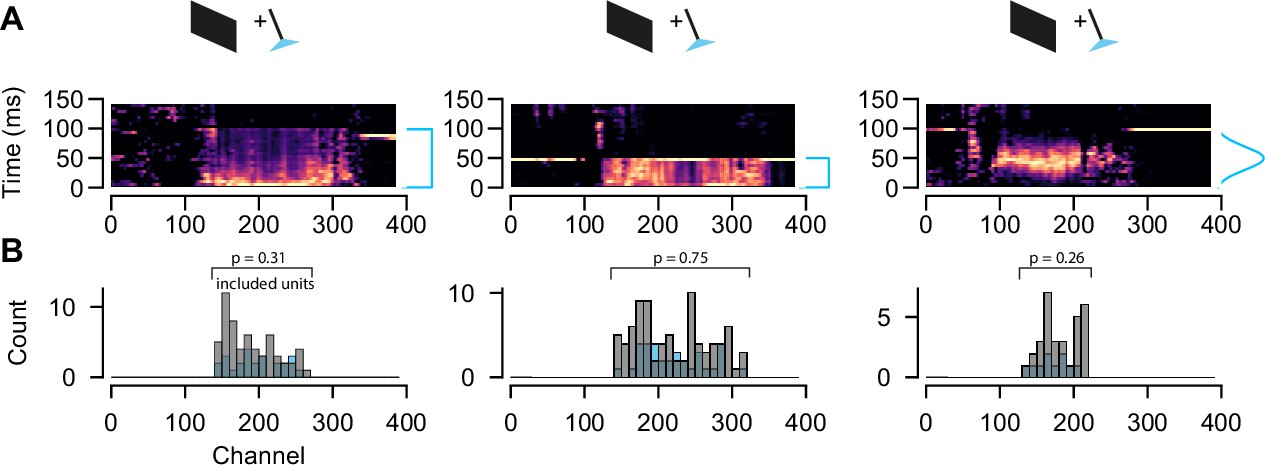
Optogenetic response and spatial distribution of excitatory and inhibitory superior colliculus (SC) neurons.
(A) Multi-unit activity in response to optogenetic stimulation (100 or 50 ms) using a square wave pulse or a Gaussian-shaped LED pulse for three individual recordings. (B) Spatial distribution of included excitatory and inhibitory SC single units within the range of channels that are activated via LED stimulation. Both cell types are equally distributed. Two-sided Wilcoxon rank-sum test.
Figure 1—figure supplement 2

Spike waveform features analysis for GABAergic and non-GABAergic neuron populations in the superior colliculus (SC).
(A) Top: Illustration of features extracted from single-channel waveforms (magenta circles indicate the trough and peak). Middle and bottom: Single-channel mean waveforms for non-GABAergic (gray; n=468) and GABAergic (blue, n=212, n=9 mice) SC populations (mean ± SEM). (B–D) Distribution of waveform features extracted from single-channel waveforms for inhibitory and excitatory SC populations. Peak-to-trough duration represents the time between trough and peak (p=4.05 × 10⁻¹⁰). Peak-to-trough ratio represents the ratio between amplitudes of peak and trough (p=4.45 × 10⁻⁹). Amplitude is the absolute difference between trough and peak (p=1.38 × 10⁻⁹). (E) Distribution of waveform spread along the probe extracted from multichannel waveforms for GABAergic and non-GABAergic SC populations (p=1.58 × 10⁻⁴, n=468 excitatory neurons [EXNs], n=212 inhibitory neurons [INs], two-sided Wilcoxon rank-sum test).
Figure 2
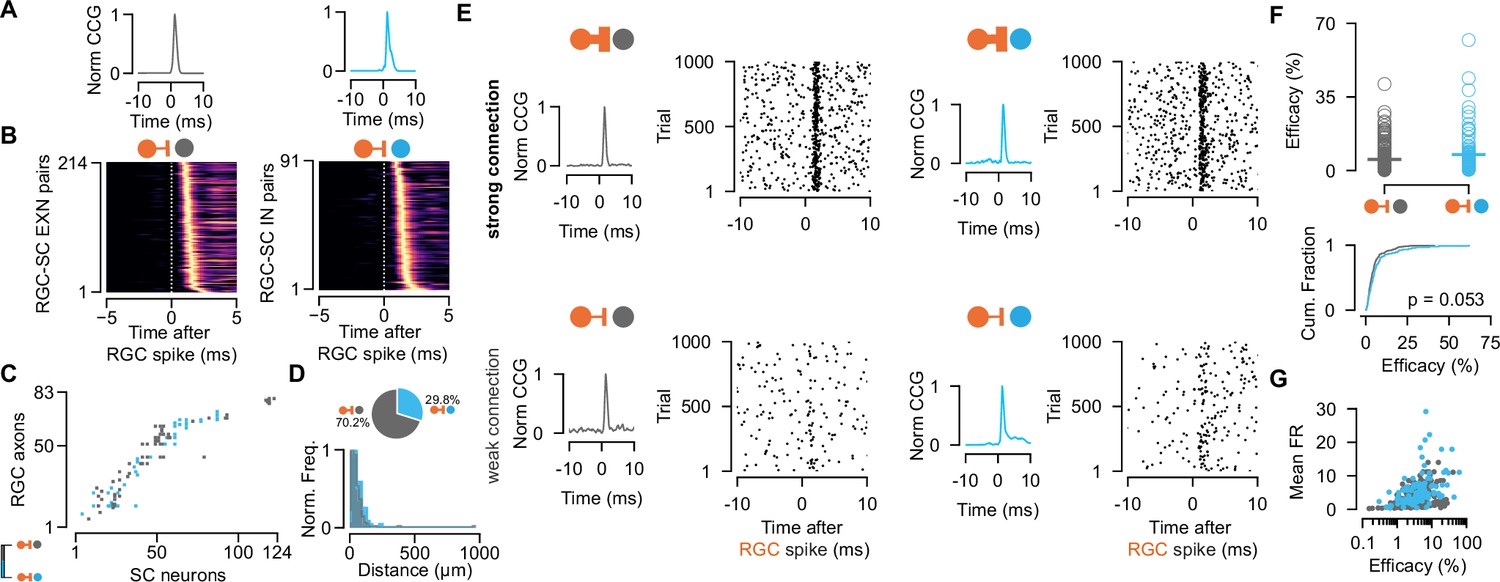
Retinal innervation is similarly strong to excitatory and inhibitory superior colliculus (SC) neurons.
(A) Monosynaptically connected retinal ganglion cell (RGC)-SC excitatory neuron (EXN) (gray) and RGC-SC inhibitory neuron (IN) (blue) pairs are identified via cross-correlogram (CCG) analysis. (B) CCGs of connected RGC-SC EXN and RGC-SC IN pairs sorted by their peak latency (n=214 RGC-SC EXN, n=91 RGC-SC IN, n=11 recordings). (C) Connectivity matrix from a single recording. Gray marks indicate connections onto excitatory SC neurons, blue marks indicate connections onto inhibitory SC neurons. RGC axons and SC neurons are sorted by their peak channel along the electrode. (D) Distribution of peak channel distances between RGC axons and connected SC neurons (p=0.0328, two-sided Wilcoxon rank-sum test). Inset shows pie chart of identified RGC-SC IN and RGC-SC EXN pairs. (E) Elicited SC spiking in response to firing of a presynaptically connected retinal ganglion cell (RGC). Raster plot shows SC firing to 1000 randomly selected RGC spikes. Both SC cell types show robust activation upon RGC spiking (top) but also weaker connections can be found (bottom). (F) Scatter plot and cumulative distribution of synaptic efficacy as a measure for connection strength for RGC-SC EXN and RGC-SC IN connected pairs (p=0.053, n=214 RGC-SC EXN, n=91 RGC-SC IN). (G) Efficacy as a function of mean firing rate (FR) during the entire recording session (RGC-SC EXN r=0.42685; p<0.0005; RGC-SC IN: r=0.43543, p=0.00002). Two-sided Wilcoxon rank-sum test.
-
Figure 2—source code 1
Code to plot Figure 2D, F, G.
- https://cdn.elifesciences.org/articles/88289/elife-88289-fig2-code1-v1.zip
-
Figure 2—source data 1
Data for Figure 2D describing the distance between retinal ganglion cell (RGC) axon and superior colliculus (SC) neuron on the electrode probe; and Figure 2F, G efficacy values.
- https://cdn.elifesciences.org/articles/88289/elife-88289-fig2-data1-v1.xlsx
Figure 3

Characterization of functional similarity between retinocollicular connected pairs.
(A) Top: Spatiotemporal receptive fields (STRF) evoked by dark (SD) and light (SL) sparse noise stimuli for retinal ganglion cell (RGC)-superior colliculus (SC) excitatory neuron (EXN) and RGC-SC inhibitory neuron (IN) connected pairs. Bottom: Visually evoked activity in response to a natural movie (NM), phase scrambled movie (PSM), and dense noise (Chk) stimulus. The functional similarity of the RGC axon and the postsynaptic SC neuron is characterized by the correlation coefficient during the different stimuli conditions (rSD, rSL, rNM, rPSM, rChk). (B) The overall functional similarity between the presynaptic RGC and the postsynaptic SC neurons is reflected in the similarity index calculated from the averaged correlation coefficients (rSL + rSD + rNM + rPSM + rChk)/5 (p=0.118, two-sided Wilcoxon rank-sum test, n=85 RGC-SC EXN pairs, n=29 RGC-SC IN pairs). Scatter plot (top) and cumulative distribution (bottom) of similarity index. (C) Relationship between similarity index and connection efficacy (Pearson correlation coefficient; n=85 RGC-SC EXN pairs, n=29 RGC-SC IN pairs).
-
Figure 3—source code 1
Code to plot Figure 3B, C.
- https://cdn.elifesciences.org/articles/88289/elife-88289-fig3-code1-v1.zip
-
Figure 3—source data 1
Data for Figure 3B: similarity index and Figure 3C: efficacy values.
- https://cdn.elifesciences.org/articles/88289/elife-88289-fig3-data1-v1.xlsx
Figure 4
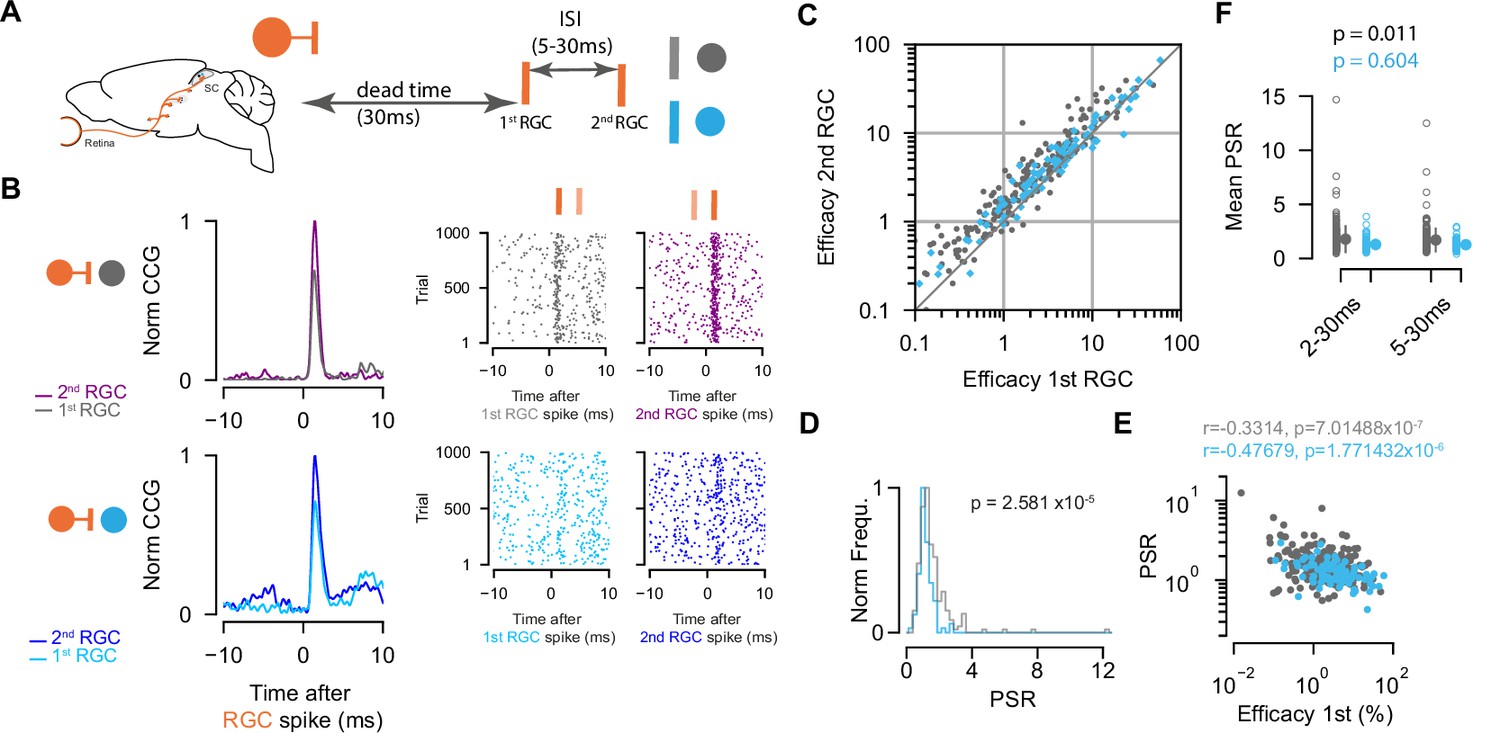
Paired-spike dynamics: Second retinal spikes are more efficient in driving superior colliculus (SC) response.
(A) Schematic illustrating the temporal dynamics between two successive retinal ganglion cell (RGC) spikes. Pairs of RGC spikes with a minimum inter-spike interval (ISI) of 5 ms and maximum ISI of 30 ms were included if there were no preceding spikes before the first RGC for a dead time of at least 30 ms. (B) Cross-correlograms (CCGs) of example RGC-SC excitatory neuron (EXN) and RGC-SC inhibitory neuron (IN) pairs calculated from spike trains selected for first and second RGCs and the corresponding raster plots to 1000 trials triggered on RGC spikes. (C) Scatter plot of efficacies for first versus second retinal spikes. The majority of connected pairs (185/214 RGC-SC EXN pairs; 73/91 RGC-SC IN pairs) showed paired-spike enhancement in response to second RGC spikes. (D) Distribution of paired-spike ratio (PSR) for RGC-SC EXN and RGC-SC IN connected pairs. The paired-spike enhancement is stronger in SC-EXNs (n=214 RGC-SC EXN; n=91 RGC-SC IN, p=2.581 × 10⁻⁵, two-sided Wilcoxon rank-sum test). (E) Correlation of first RGC efficacy with the PSR for connected pairs (r=0.3314 for n=214 RGC-SC EXN pairs and r=0.4767 for n=91 RGC-SC IN pairs; logarithmic values; Pearson correlation coefficient test). (F) Change in mean PSR depending on ISI for different groups of ISI (2–3 ms and 5–30 ms). The 2–30 ms group ensures to include high-firing RGCs (RGC-SC EXN pairs 2–30 vs. 5–30 ms p=0.011; RGC-SC IN pairs 2–30 vs. 5–30 ms p=0.604; Wilcoxon signed-rank test).
-
Figure 4—source code 1
Code to plot Figure 4C–F.
- https://cdn.elifesciences.org/articles/88289/elife-88289-fig4-code1-v1.zip
-
Figure 4—source data 1
Data for Figure 4C: efficacy values in response to first and second retinal ganglion cell (RGC) spikes, Figure 4D, E: paired-spike ratio (PSR) values, and Figure 4F: PSR values for different groups.
- https://cdn.elifesciences.org/articles/88289/elife-88289-fig4-data1-v1.xlsx
Figure 5 with 1 supplement

Connection contribution is higher in connected retinal ganglion cell (RGC)-superior colliculus (SC) excitatory neuron (EXN) pairs.
(A) Example cross-correlograms (CCGs) of monosynaptically connected RGC-SC EXN (left) and RGC-SC inhibitory neuron (IN) (right) pairs. Connected pairs were identified by their peaks in the CCGs (left). Raster plots of RGC spiking activity triggered on 1000 SC spikes (right). (B) Scatter plot and cumulative distribution of contribution values for RGC-SC EXN and RGC-SC IN pairs (n=214 RGC-SC EXN pairs, n=91 RGC-SC IN pairs, p=0.0003, two-sided Wilcoxon rank-sum test). (C) Relationship between functional similarity index and connection contribution (Pearson correlation coefficient test; n=85 RGC-SC EXN pairs, n=29 RGC-SC IN pairs). (D) Correlation of mean firing rate (to natural movie stimulus) and contribution for RGC-SC EXN and RGC-SC IN pairs (Pearson correlation coefficient, two-sided Wilcoxon rank-sum test, n=214 RGC-EXN and n=91 RGC-IN connected pairs; n=11 penetrations from nine mice).
-
Figure 5—source code 1
Code to plot Figure 5B–D.
- https://cdn.elifesciences.org/articles/88289/elife-88289-fig5-code1-v1.zip
-
Figure 5—source data 1
Data for Figure 5B, C, and D: contribution values, mean firing rates, and similarity index.
- https://cdn.elifesciences.org/articles/88289/elife-88289-fig5-data1-v1.xlsx
Figure 5—figure supplement 1

Contribution as a function of firing rate during different stimulus conditions.
Relationships between contribution and the conditions during natural movie (NM), phase scrambled movie (PSM), gray background (Bkg), and checkerboard (Chk) for retinal ganglion cell (RGC) superior colliculus (SC) excitatory neuron (EXN) and RGC-SC inhibitory neuron (IN) pairs. RGC-SC EXN n=214 pairs, RGC-SC INH n=91 pairs, two-sided Wilcoxon rank-sum test.
Author response image 1

Efficacy measure of connected RGC-SC pairs as a function of the mean firing rate during different stimulus conditions: during spontaneous activity (gray screen, left) and throughout the entire recording session (right).
Author response image 2

RGC-SC connectivity.
Cross-correlograms showing 4 connected RGC-SC pairs (top) with two RGCs connecting onto the same SC neuron. Raster plots of SC neuron spiking activity in response to firing of the presynaptically connected RGC. The same SC neuron can receive both strong and weak RGC inputs.
Author response image 3

Change of mean paired-spike ratio (PSR) depending on ISI.
(Left) Comparison of PSR between two groups of different ISIs. The 2-30 ms group ensures to include high-firing RGCs (excitatory pairs 2-30 vs 5-30 ms p = 0.011; inhibitory pairs 2-30 vs 5-30 ms p = 0.604, Wilcoxon signed-rank). (Right) PSR for groups of different ISI intervals. Mean PSR ± SEM for excitatory groups: 2.0±0.09, 1.75±0.09, 1.51±0.05, 1.31±0.05, 1.2±0.05; inhibitory groups: 1.35±0.06, 1.51±0.09, 1.5±0.1,1.22±0.06, 1.21±0.07. p E vs I (within group): 1.55±10-5, 9.55±10-2, 4.21±10-1, 3.74±10-1, 6.22 ±10-1, Wilcoxon rank-sum test.
Author response image 4

Relationship between efficacy to 1st RGC and PSR visualized on linear scale using a hyperbolic fitting approach .
Author response image 5

Relationship between RF size and connectivity measures (efficacy and contribution) for RGC-SC EXN and RGC-SC IN pairs (two-sided Wilcoxon rank-sum test).
Author response image 6

Mean firing rate (left) and RF size (right) as a function of peak-to-trough (PT) duration for excitatory and inhibitory SC neurons.
Both measures are not correlated to the PT duration (Pearson correlation coefficient, two-sided Wilcoxon rank-sum test).
Author response image 7

Functional estimation of probe location.
DiI staining of Neuropixels probe (middle) and multi-unit activity across channels in response to visual stimulation (bottom). The white dashed lines in the middle and bottom panels mark the rough boundaries of the visual SC layers.
Author response image 8

Optotagging approach.
Example traces of a single stimulation pulse and protocol used for optogenetic stimulation. Evoked activity in response to LED stimulation (100ms, 100 trials) for six example SC IN neurons.
Additional files
Download links
A two-part list of links to download the article, or parts of the article, in various formats.
Downloads (link to download the article as PDF)
Open citations (links to open the citations from this article in various online reference manager services)
Cite this article (links to download the citations from this article in formats compatible with various reference manager tools)
Retinal input integration in excitatory and inhibitory neurons in the mouse superior colliculus in vivo
eLife 12:RP88289.
https://doi.org/10.7554/eLife.88289.3


