Mechanism of stepwise electron transfer in six-transmembrane epithelial antigen of the prostate (STEAP) 1 and 2
Figures
Figure 1

The structures of NADPH oxidases (NOX), dual oxidases (DUOX), and six-transmembrane epithelial antigen of the prostate (STEAPs).
The crystal structures of the transmembrane domain (TMD) and oxidoreductase domain (OxRD) of NOX5 (from Cylindrospermum stagnale) are plotted together (PDB codes: TMD, 5o0t; OxRD, 5o0x). The cryo-electron microscopy (cryo-EM) structure of human DUOX1 (PDB code: 7d3f) shows dimeric oligomerization (green and cyan) complexed with DUOX auxiliary protein A1 (DUOXA1, wheat and yellow). The cryo-EM structures of STEAPs are homotrimers (green, cyan, and wheat. PDB codes: STEAP1, 6y9b; STEAP4, 6hcy; STEAP2, 7tai). In DUOX and STEAPs, only one set of cofactors and heme group are shown for clarity. Heme, red; FAD, orange; NADP+, magenta. The lines represent cell membrane (top, extracellular and bottom, intracellular).
Figure 2 with 1 supplement

Reduction of the heme on six-transmembrane epithelial antigen of the prostate 1 (STEAP1).
(A) Rapid-scan reaction of 1.1 μM STEAP1 with 4.5 μM reduced FAD (FADH-); the spectral change was monitored for 20 s. (B) The time course of A427 (black), the Soret absorbance of ferrous heme, was extracted from the rapid-scan data. Red: biphasic exponential fit with rate constants kobs of 7.7 (±0.30) and 0.67 (±0.034) s–1, respectively (n=3). The percentage of each phase is 60% and 40%, respectively. Inset, the dependence of rate constants on [FADH-]. Dot, the fast phase; triangle, the slow phase. Lines, fit with equation kobs = Vmax* [FADH-]/(KM + [FADH-]). (C) The spectral changes in the reaction of a mixture of 1.1 μM STEAP2 and 0.9 μM STEAP1 (plus 2.2 μM FAD) with 60 μM NADPH; the spectral change was monitored for 1 hr. The direction of the spectral changes is indicated by the arrows. Blue, the spectrum captured at the start of the reaction; red, the spectrum after 1 hr reaction. Inset, the resolved spectral species by deconvolution and the conversion rate constant. Black, ferric STEAP and red, ferrous STEAP.
Figure 2—figure supplement 1
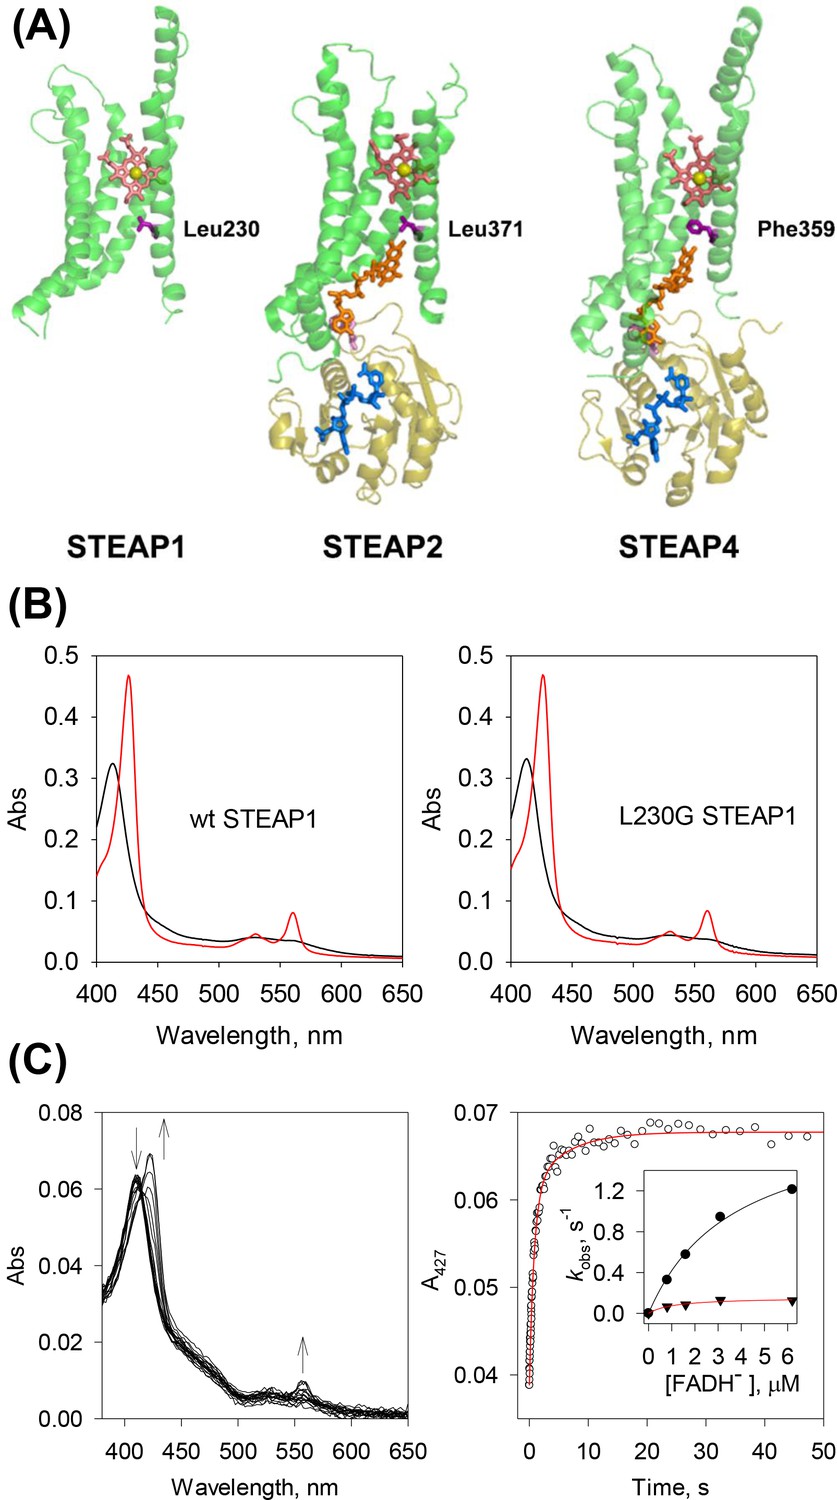
Electron transfer in six-transmembrane epithelial antigen of the prostate (STEAPs) may be mediated by a bulky side chain.
(A) FAD (orange) binds both STEAP2 and STEAP4 in an extended conformation (PDB codes: STEAP2, 7tai; STEAP4, 6hcy). Its isoalloxazine ring protrudes deeply into the transmembrane domain (TMD) (green) and the adenosine ring stacks with Trp152 or Trp140 (pink) in STEAP2 and STEAP4, respectively, from the oxidoreductase domain (OxRD) of a neighboring protomer (olive). Leu371 or Phe359 (purple), in STEAP2 and STEAP4, respectively, lies halfway between the isoalloxazine ring and heme (salmon, iron atom in yellow). NADP+ is represented in blue. In STEAP1 (PDB code: 6y9b), Leu230 (purple) is similarly positioned versus the heme. (B) The UV-Vis spectra of ferric (black) and ferrous (red) wild-type (WT) STEAP1 (left panel) and L230G STEAP1 (right panel). The ferrous proteins were prepared by photoreduction for 10 min. (C) Rapid-scan reaction of 0.4 μM L230G STEAP1 with 6.2 μM reduced FAD (FADH-); the spectral change was monitored for 50 s (left panel). The arrows represent the direction of spectral changes. Right panel, the time course of A427 extracted from the rapid-scan data. Red: biphasic exponential fit with rate constants kobs of 1.2 (±0.13) and 9.6×10⁻³ (±4.3 × 10⁻²) s–1, respectively (n=3). The percentage of each phase is 79% and 21%, respectively. Inset, the dependence of rate constants on [FADH-]. Dot, the fast phase; triangle, the slow phase. Lines, fit with equation kobs = Vmax * [FADH-]/(KM + [FADH-]).
Figure 3 with 2 supplements

Reduction of six-transmembrane epithelial antigen of the prostate 1 (STEAP1) by cytochrome b5 reductase (b5R).
(A) The rapid-scan reaction of 1.5 μM STEAP1 and 1.5 μM cytochrome b5R with 10 μM NADH; the spectral change was monitored for 20 s. The arrows indicate the direction of the spectral change. Inset: the resolved spectral species and the conversion rate constants. Black, ferric STEAP1 with b5R, red, a spectral intermediate, and green, ferrous STEAP1 with fully reduced b5R. (B) L230G STEAP1 and b5R were reacted with 10 μM NADH; the spectral change was monitored for 50 s. The direction of spectral change is indicated by the arrows. Inset, the resolved spectral species by deconvolution and the rate constants. Inset: black, ferric L230G STEAP1 with b5R, red, a spectral intermediate, and green, ferrous L230G STEAP1 with fully reduced b5R.
Figure 3—figure supplement 1
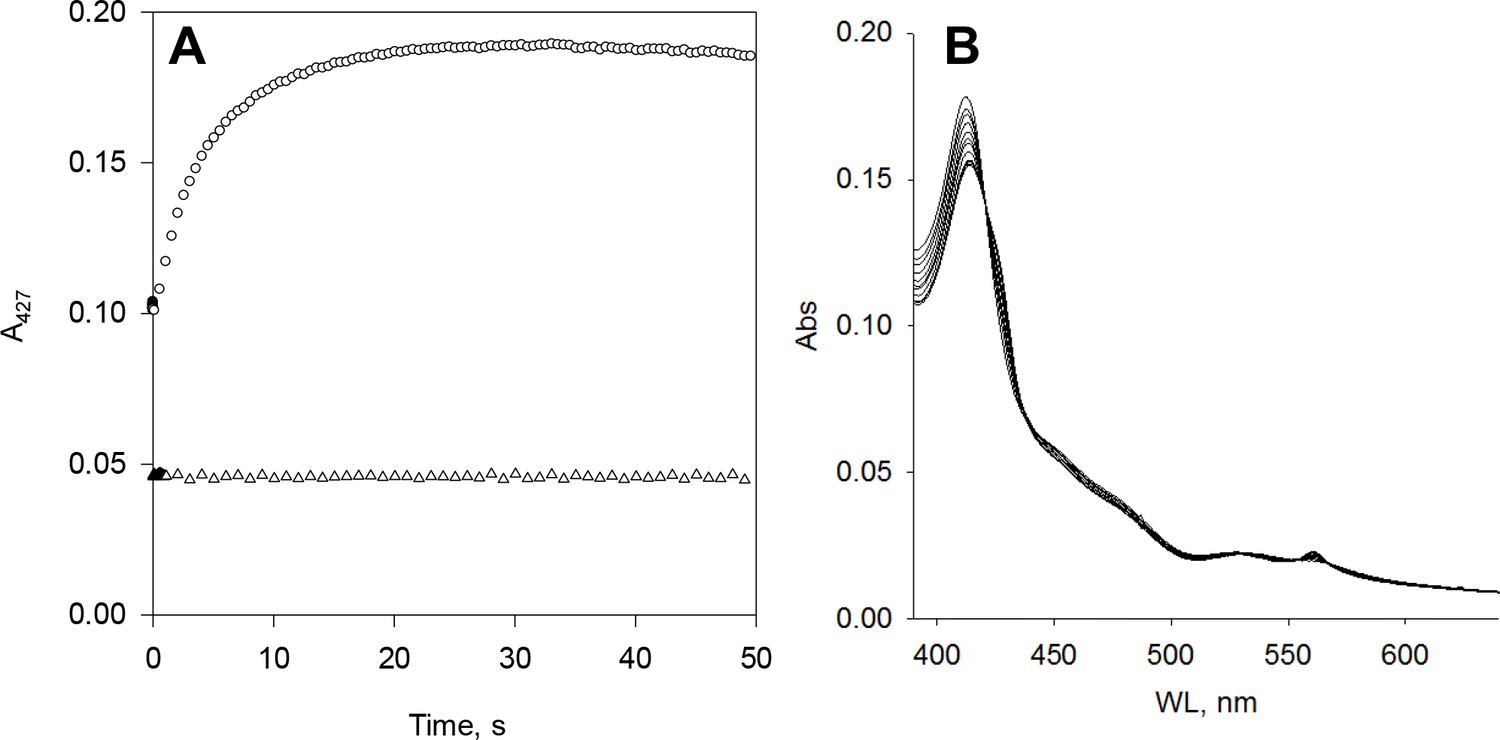
Six-transmembrane epithelial antigen of the prostate 1 (STEAP1) in the presence of FAD and/or NAD(P)H.
(A) No reaction was observed when anaerobic 0.8 μM STEAP1 was mixed with 50 μM NADH (triangle). STEAP1 reduction was observed reacting anaerobic 1.7 μM STEAP1 pre-incubated with 1.3 μM cytochrome b5 reductase (b5R) with 1.3 μM NADH (circle). (B) Anaerobic STEAP1 plus FAD was incubated with NADPH for 1 hr.
Figure 3—figure supplement 2
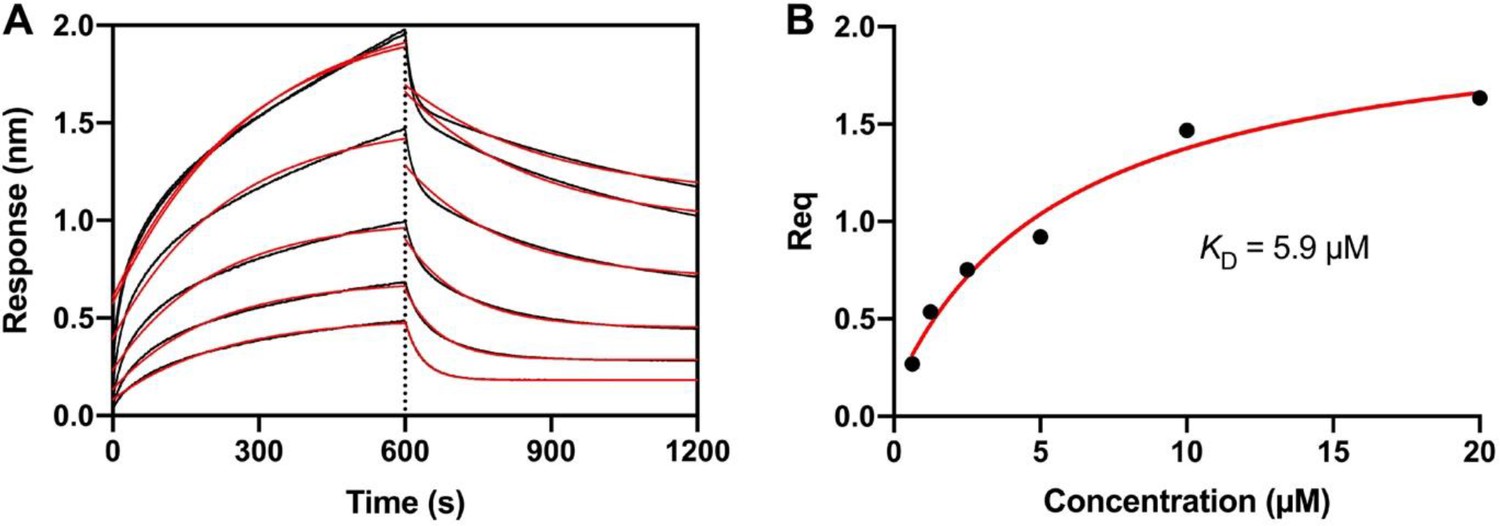
Binding of cytochrome b5 reductase (b5R) to six-transmembrane epithelial antigen of the prostate 1 (STEAP1).
(A) The Octet bio-layer interferometry (BLI) sensorgram of various concentrations of b5R binding to immobilized STEAP1. The original binding traces (black) were fitted with mono-exponential function (red). (B) Dose-response curve of the equilibrium response (Req) during association versus the concentration of b5R. The dissociation constant KD was calculated from the fit (red line) to data (black dot). The KD is 5.9 µM (2.4–15.5 with 95% confidence interval).
Figure 4 with 1 supplement

Characterization of purified human six-transmembrane epithelial antigen of the prostate 2 (hSTEAP2).
(A) SDS-PAGE analysis and size exclusion chromatography of purified hSTEAP2. The UV-Vis (B) and magnetic circular dichroism (MCD) (C) spectra of hSTEAP2 are plotted with absorbance in mM–1 cm–1 and MCD in M–1 cm–1 Tesla–1, respectively. STEAP2 was purified in the ferric state (black) and the ferrous STEAP2(red) was prepared by dithionite reduction.
Figure 4—figure supplement 1
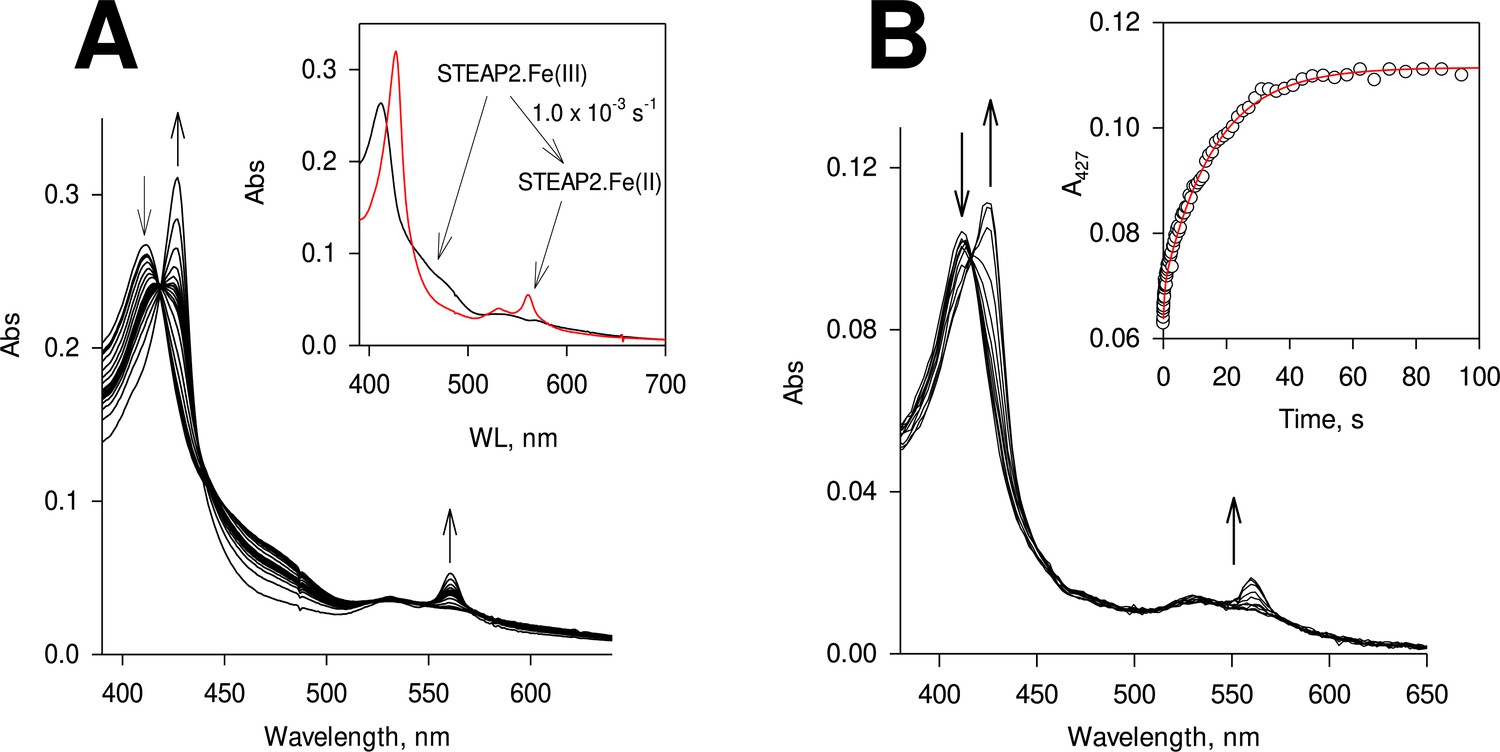
Reduction of the heme on six-transmembrane epithelial antigen of the prostate 2 (STEAP2).
(A) STEAP2, 2.3 μM, was pre-incubated with 2.5 μM FAD and reacted anaerobically with 45 μM NADPH; the spectral change was monitored for 1230 s. Inset, the resolved spectral species by deconvolution together with the conversion rate constant. Black: the ferric STEAP2 with FAD and red, the ferrous STEAP2 with reduced FAD. (B) Rapid-scan reaction of 1.1 μM STEAP2 with 4.5 μM reduced FAD; the spectral change was monitored for 100 s. Inset, the time course of A427, the Soret absorbance of ferrous heme, extracted from the rapid-scan data. Red: biphasic exponential fit with rate constants of 2.9 (±0.80) and 0.069 (±3.3 × 10⁻³) s–1, respectively (n=6). The percentage of each phase is 16% and 84%, respectively.
Figure 5
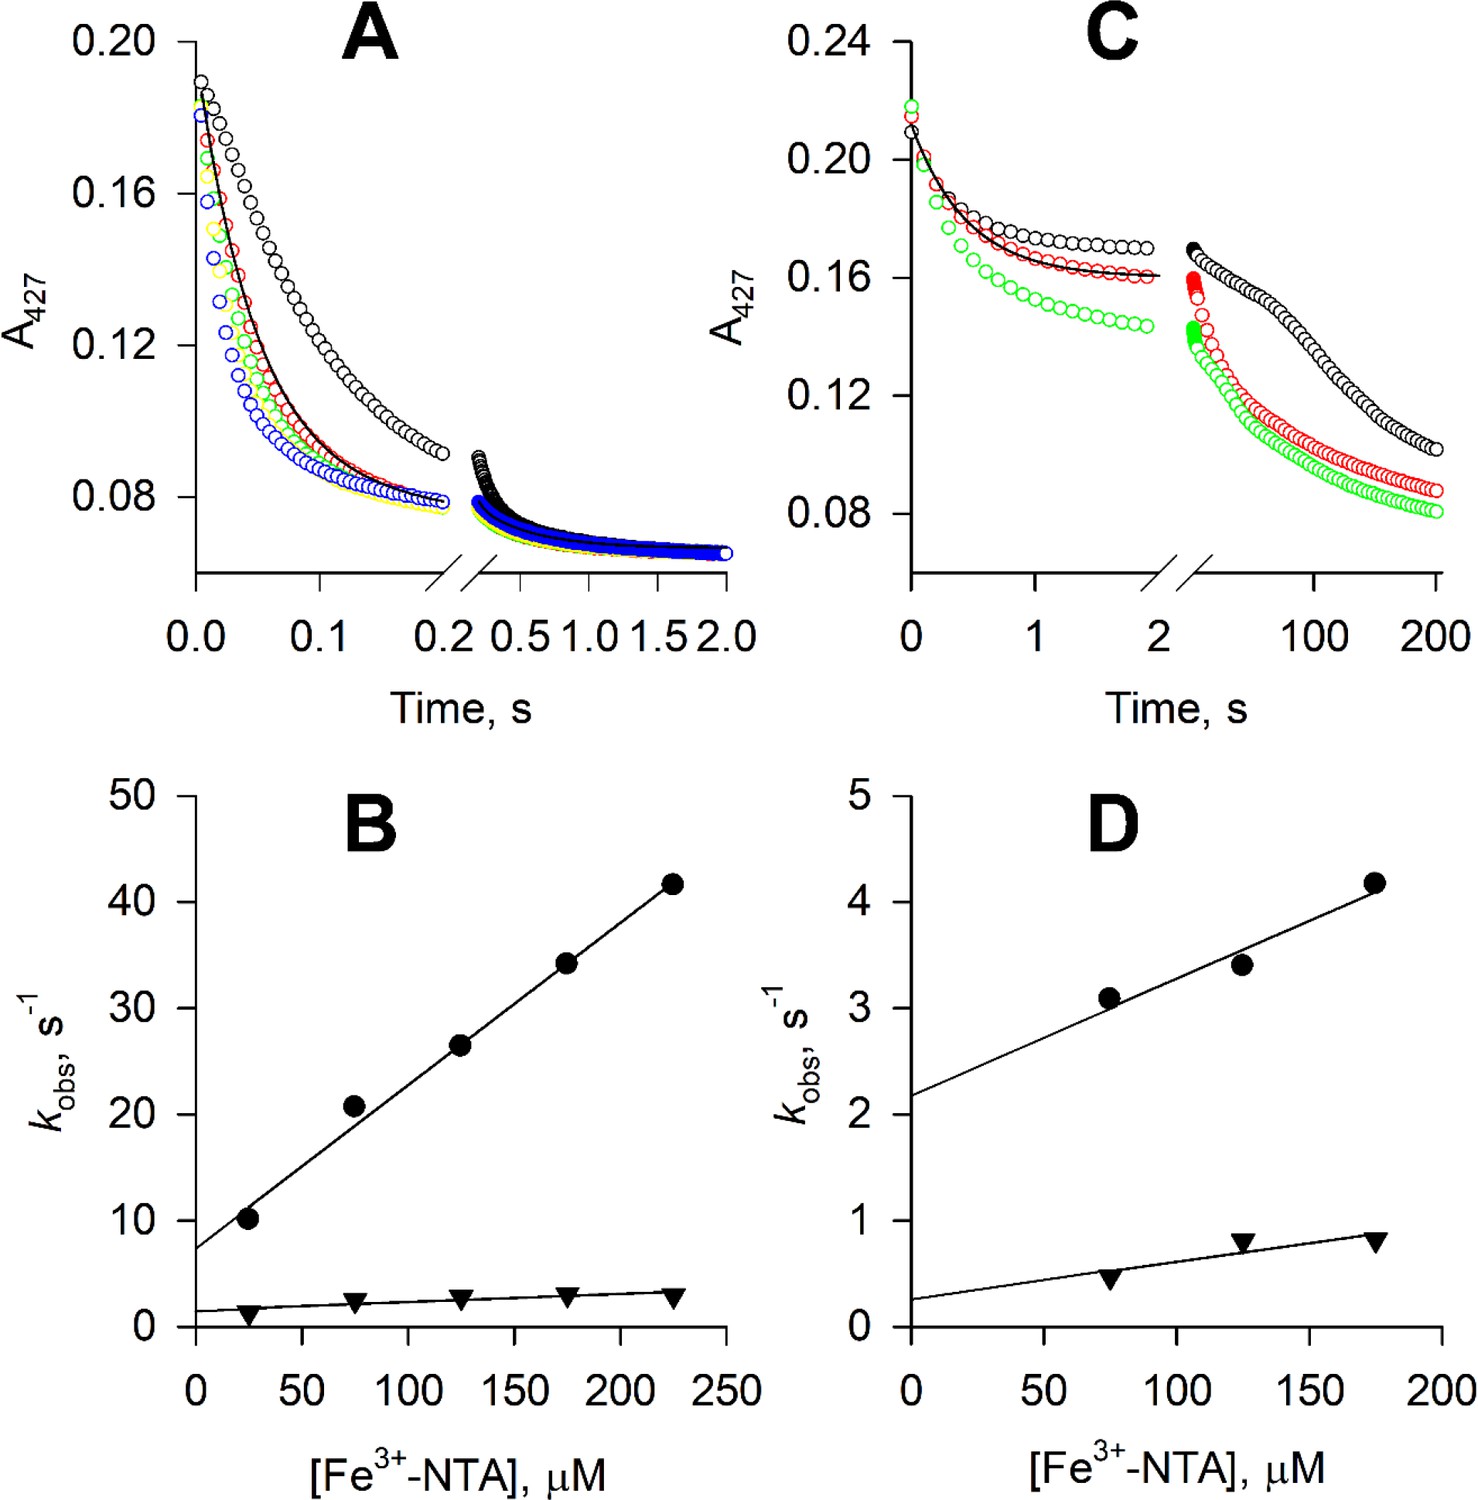
Reduction of ferric nitrilotriacetic acid (Fe3+-NTA) by ferrous six-transmembrane epithelial antigen of the prostate 1 (STEAP1) and STEAP2.
(A) The time courses of A427 in the reactions of 1.1 μM ferrous STEAP1 with 25 (black), 75 (red), 125 (green), 175 (yellow), and 175 μM Fe3+-NTA (blue). The rate constants, kobs, are estimated by biphasic exponential fit to the time courses. One of such fits is shown by the black line. (B) Dependence of the rate constants kobs on [Fe3+-NTA]. Circles, kobs of the fast phase of the A427 time courses; triangles, kobs of the slow phase. (C) The time courses of A427 in the reactions of 1.1 μM ferrous STEAP2 with 75 (black), 125 (red), and 175 μM Fe3+-NTA (green). The time courses in the initial 2 s of the reactions are fitted with a biphasic exponential function, and one such fit is shown by the black line. (D) The rate constants estimated for the initial 2 s, kobs, are plotted versus [Fe3+-NTA]. Circles, kobs of the fast phase of the A427 time courses; triangles, kobs of the slow phase. At reaction time longer than 2 s, the time courses in (C) show more complicated kinetics and no clear dependence on [Fe3+-NTA].
Figure 6 with 2 supplements
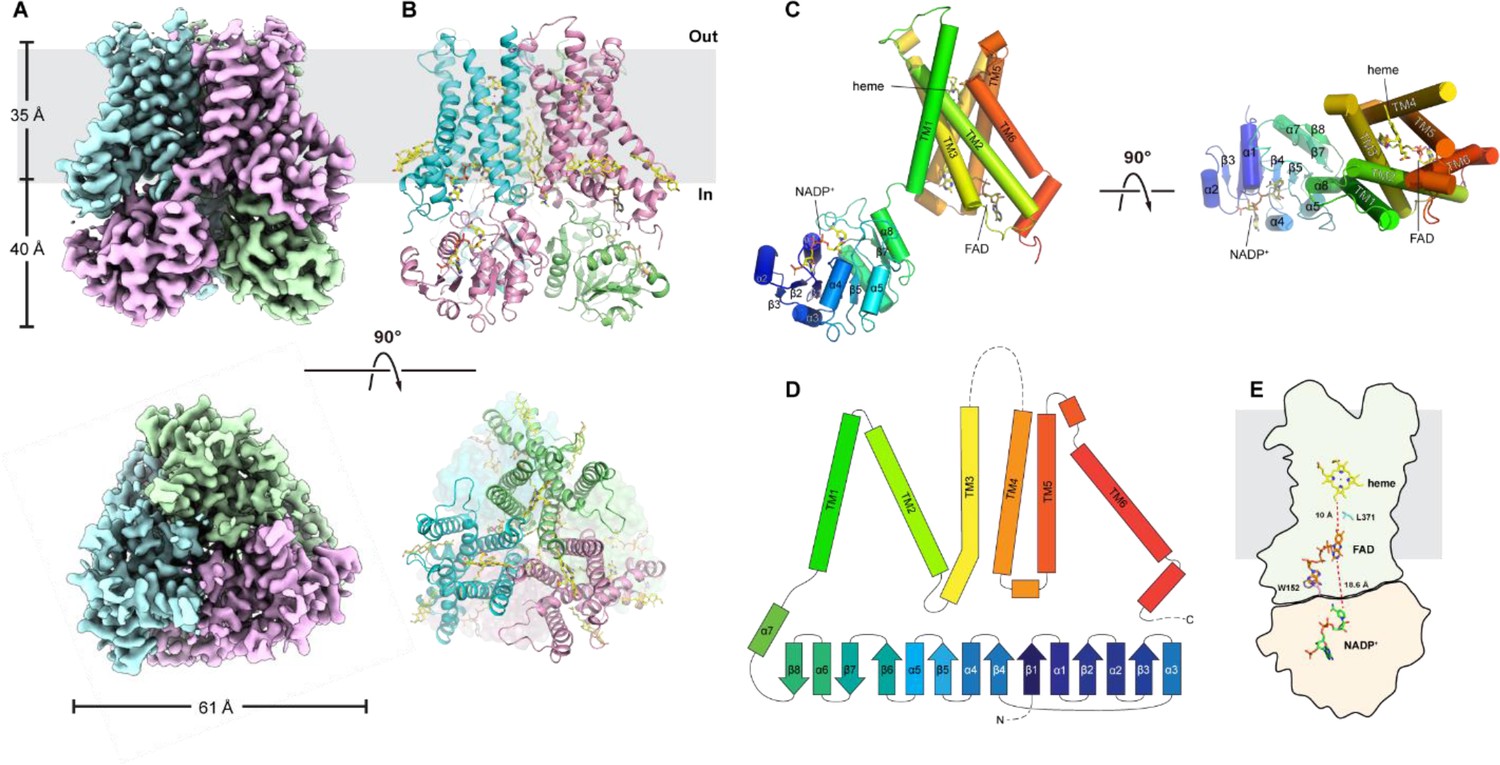
Cryo-electron microscopy (cryo-EM) structure of six-transmembrane epithelial antigen of the prostate 2 (STEAP2).
The sharpened density map (A) and cartoon presentation (B) for STEAP2 homotrimer. Top, the side view of STEAP2 homotrimer, and the gray bar represents the membrane; ‘in’, the intracellular side and ‘out’, the extracellular side. Bottom, the top view of STEAP2 homotrimer from the extracellular side. (C) The structure of one STEAP2 protomer (cartoon) with the prosthetic group heme and the cofactors FAD and NADP+ (sticks). Left, side view and right, top view from the extracellular side. (D) The topographic representation of the secondary structural elements. The α helices and β strands are represented by bars and arrows respectively. Dashed lines represent the unresolved segments. (E) The schematic representation of the spatial relationship of NADP+, FAD, and heme, shown as sticks. Trp152 and Leu371 are also shown as sticks. Transmembrane domain (TMD) is represented as the outline with gray shade and the oxidoreductase domain (OxRD) with pink shade.
Figure 6—figure supplement 1
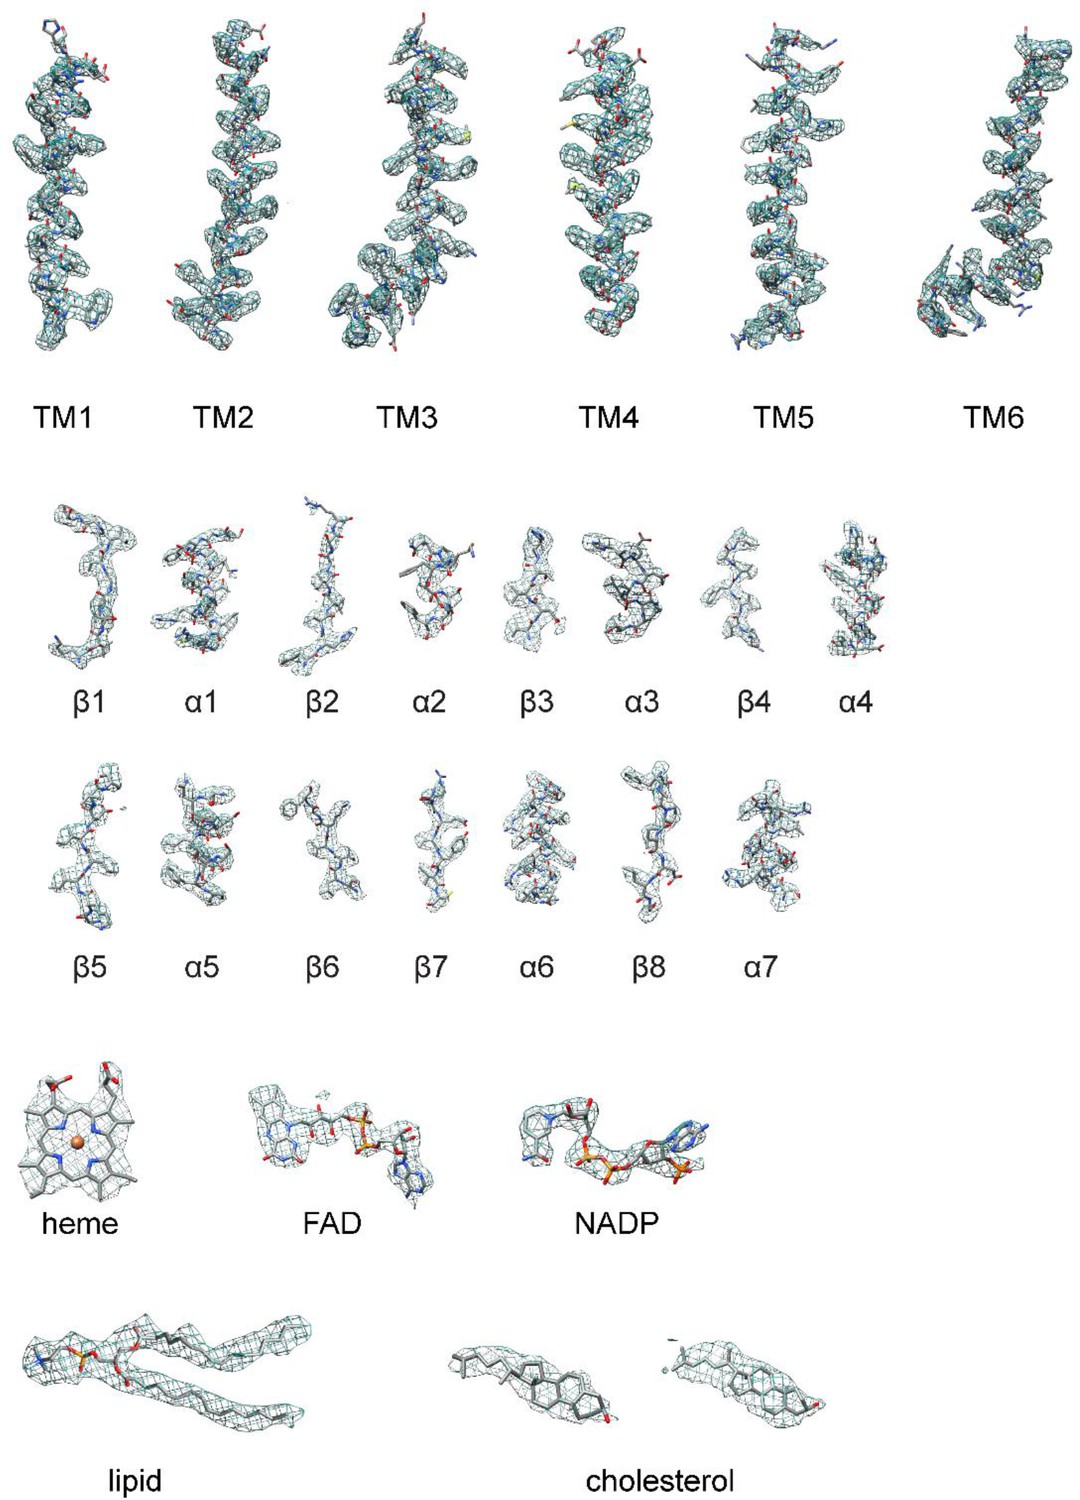
Density maps of the structural elements, heme, FAD, NADP+, and lipids in the cryo-electron microscopy (cryo-EM) of hSTEAP2.
Figure 6—figure supplement 2
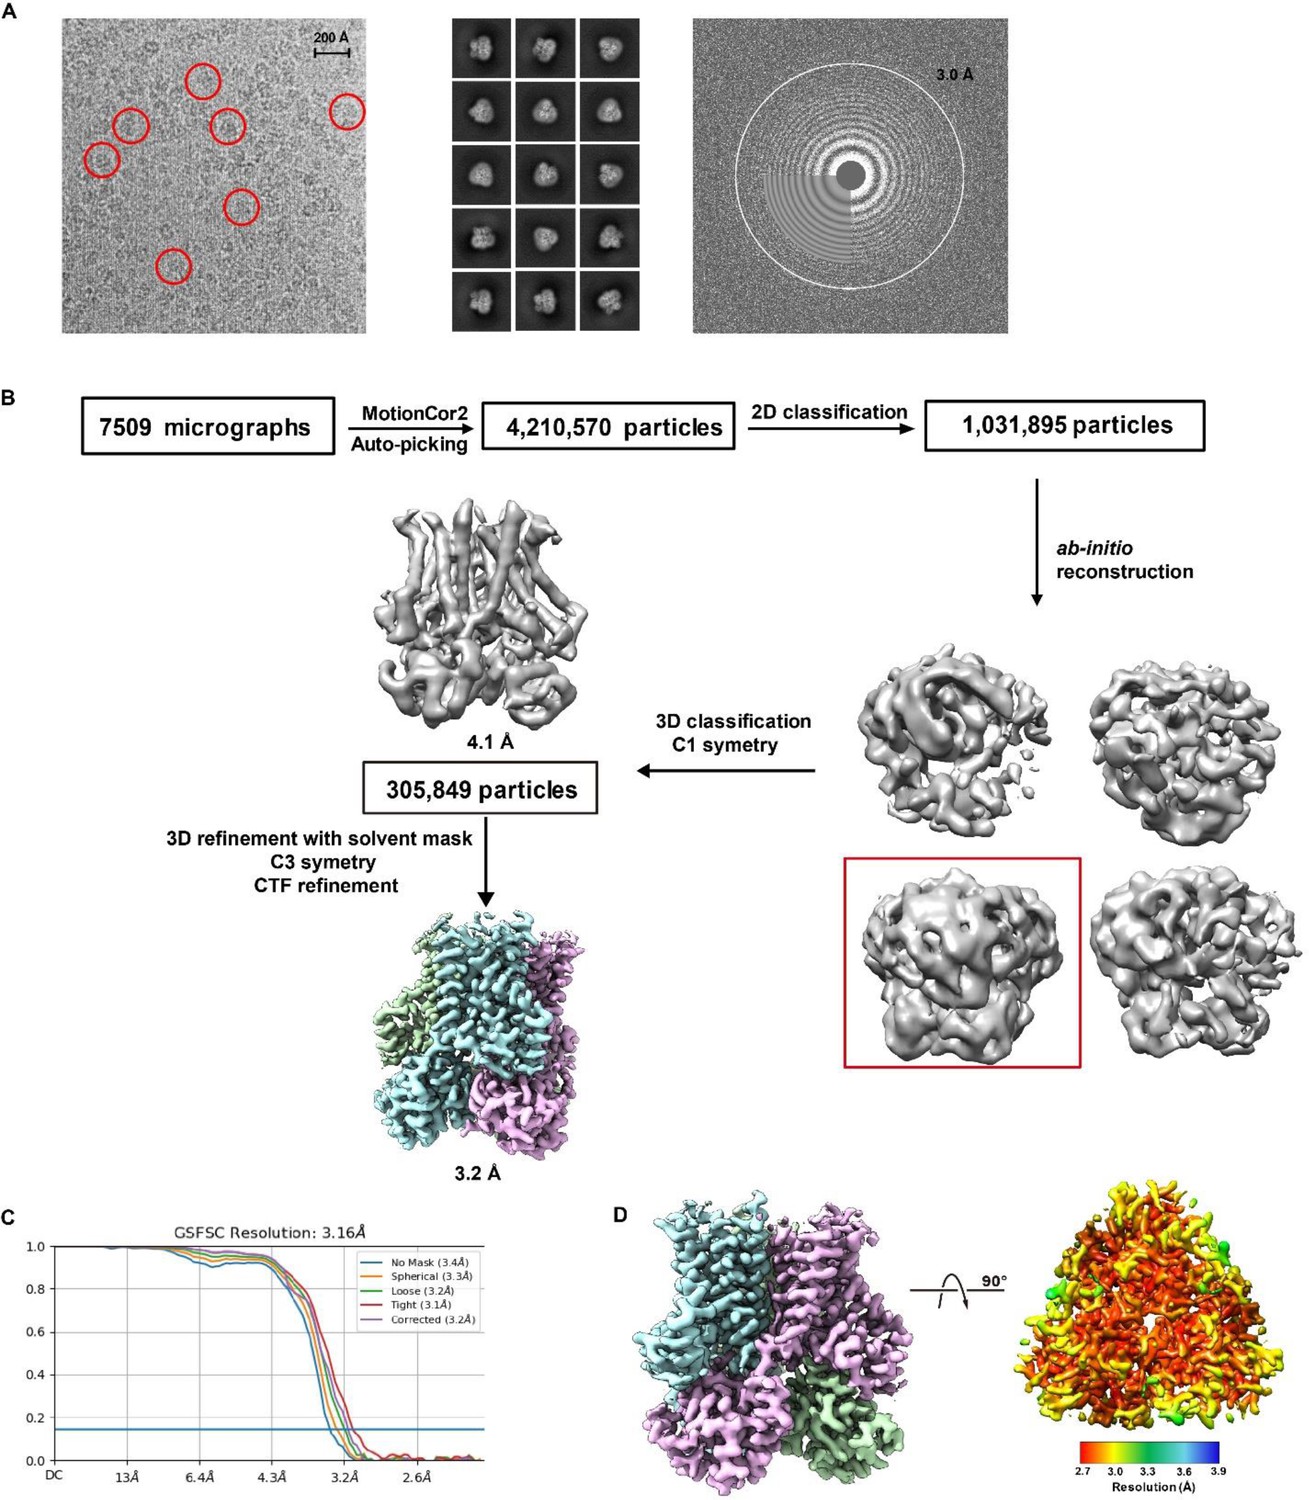
The images (A) and processing (B–D) of the electron microscopy (EM) data of hSTEAP2.
Figure 7

Electron transfer in six-transmembrane epithelial antigen of the prostate 1 (STEAP1) and STEAP2.
NADPH (blue) and FAD (orange) bind to the oxidoreductase domain (OxRD) in STEAP2 (A, olive shade) with the nicotinamide ring of NADPH aligned with the isoalloxazine ring of FAD for hydride transfer (B). The reduced FAD adopts the extended conformation with its isoalloxazine ring bound deep in the transmembrane domain (TMD) of STEAP2 (C, teal shade) or dissociates from the OxRD to bind STEAP1 (D → E, cyan shade) and transfers electrons to heme (salmon). NADP(H) and FAD(H2) are cofactors that associate with and dissociate from the STEAP protein in each redox cycle while the heme, as a prosthetic group, stays bound to the protein. Cytochrome b5 reductase (F, sand shade) docks on STEAP1 from the intracellular side, forming a complex for electron transfer (G). The FAD-to-heme electron transfer in STEAP is likely mediated through a bulky side chain (purple), Leu230 in STEAP1 and Leu371 in STEAP2, respectively.
Tables
Table 1
The rate constants of the reduction of ferric substrates by ferrous six-transmembrane epithelial antigen of the prostate 1 (STEAP1) and STEAP2.
| Substrates | First phase | Second phase | |||
|---|---|---|---|---|---|
| kon, M–1 s–1/koff, s–1 | KD, μM* | kon, M–1 s–1/koff, s–1 | KD, μM* | ||
| STEAP1† | Fe3+-EDTA | 2.7×10⁵/4.8 | 17.8 | 4.0×10⁴/1.4 | 35 |
| STEAP1† | Fe3+-citrate | 1.6×10⁵/15.5 | 97 | – | – |
| STEAP1 ‡ | Fe3+-NTA | 1.5×10⁵/7.5 | 50 | 7.6×10³/0.2 | 26.3 |
| STEAP2 ‡, § | Fe3+-NTA | 1.1×10⁴/2.2 | 200 | 3.5×10³/0.3 | 85.7 |
-
*
: KD = koff/kon.
-
†
From Kim, K. et al, Biochemistry (2016) 55, 6673–6684.
-
‡
This study.
-
§
The third phase is not included.
Table 2
The data collection, refinement, and validation statistics of six-transmembrane epithelial antigen of the prostate 2 (STEAP2) cryo-electron microscopy (cryo-EM).
| Data collection and processing | |
|---|---|
| Magnification | FEI Titan Krios |
| Voltage (kV) | 300 |
| Electron exposure (e– Å–2) | 50 |
| Defocus range (μm) | –0.8 to –2.5 |
| Pixel size (Å) | 1.08 |
| Symmetry imposed | C3 |
| Number of initial particle images | 4,210,570 |
| Number of final particle images | 117,053 |
| Map resolution (Å) | 3.16 |
| FSC threshold | 0.143 |
| Map resolution range (Å) | 3.2 |
| Refinement | |
| Initial model used | PDB 6hcy |
| Model resolution (Å) | 3.2 |
| FSC threshold | 0.5 |
| Map sharpening B factor (Å2) | –100 |
| Model composition | |
| Non-hydrogen atoms | 11,109 |
| Protein residues | 1260 |
| Ligands | 18 |
| B factors (Å2) | |
| Protein | 41.92 |
| Ligand | 32.76 |
| R.m.s. deviations | |
| Bond lengths (Å) | 0.003 |
| Bond angles (°) | 0.567 |
| Validation | |
| MolProbity score | 1.6 |
| Clashscore | 10.54 |
| Poor rotamers (%) | 0.09 |
| Ramachandran plot | |
| Favored (%) | 97.8 |
| Allowed (%) | 2.2 |
| Disallowed (%) | 0 |
Additional files
Download links
A two-part list of links to download the article, or parts of the article, in various formats.
Downloads (link to download the article as PDF)
Open citations (links to open the citations from this article in various online reference manager services)
Cite this article (links to download the citations from this article in formats compatible with various reference manager tools)
Mechanism of stepwise electron transfer in six-transmembrane epithelial antigen of the prostate (STEAP) 1 and 2
eLife 12:RP88299.
https://doi.org/10.7554/eLife.88299.3


