Coordinated regulation of gene expression in Plasmodium female gametocytes by two transcription factors
- Department of Medical Zoology, Mie University School of Medicine, Japan
- Department of Molecular Protozoology, Research Center for Infectious Disease Control, Japan
Figures
Figure 1 with 1 supplement

PFG is a target gene of AP2-G and is expressed in female gametocytes.
(A) Schematic diagram of PFG from P. berghei and its homologs in apicomplexan parasites. Regions homologous to regions 1 and 2, which are highly conserved among Plasmodium species, are shown as yellow and blue rectangles, respectively. Nuclear localization signals were predicted using the cNLS mapper. The gene IDs of P. berghei PFG, P. falciparum PFG, and their homologs in Toxoplasma gondii, Eimeria tenella, and Vitrella brassicaformis are PBANKA_0902300, PF3D7_1146800, TGGT1_239670, ETH2_1252400, and Vbra_10234, respectively. (B) Alignment of amino acid sequences of regions 1 and 2 from P. berghei and P. falciparum PFGs was performed using the ClustalW program (https://www.genome.jp/tools-bin/clustalw). (C) The amino acid sequences of regions 1 and 2 from P. berghei PFG and its homologs from other apicomplexan parasites in (A) were aligned using the ClustalW program in MEGA X. The positions at which all these sequences have identical amino acids are indicated by two asterisks, and positions with amino acid residues possessing the same properties are indicated by one asterisk. (D) Expression of PFG in mature male and female gametocytes of PFG::GFP parasites. Nuclei were stained with Hoechst 33342. Scale bars: 5 μm. (E) Integrative Genomics Viewer (IGV) images from the ChIP-seq data of AP2-G and AP2-FG in the upstream region of PFG. Data were obtained from previous papers (Yuda et al., 2021; Yuda et al., 2019). The purple and red bars indicate the binding motifs of AP2-G and AP2-FG in the peak region. (F) Time-course observations of PFG expression during gametocyte development using PFG::GFP parasites. Parasites were observed every 2 hr from 12 hpi onwards. Nuclei were stained with Hoechst 33342. Scale bar: 5 μm.
Figure 1—figure supplement 1
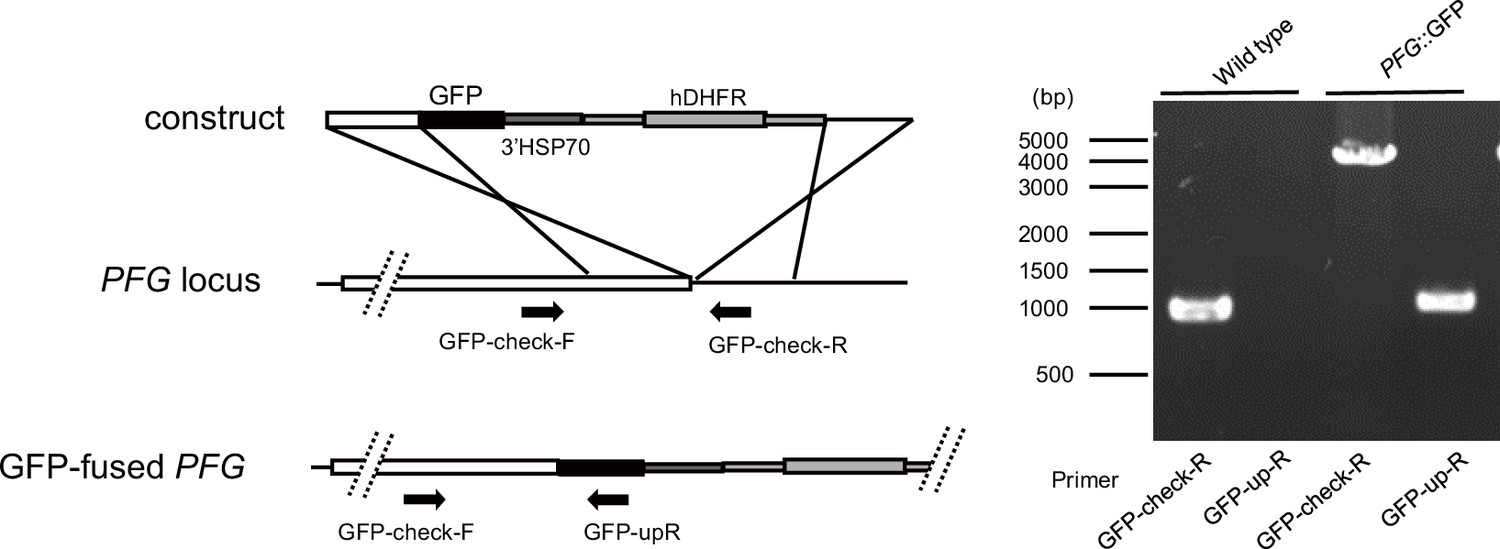
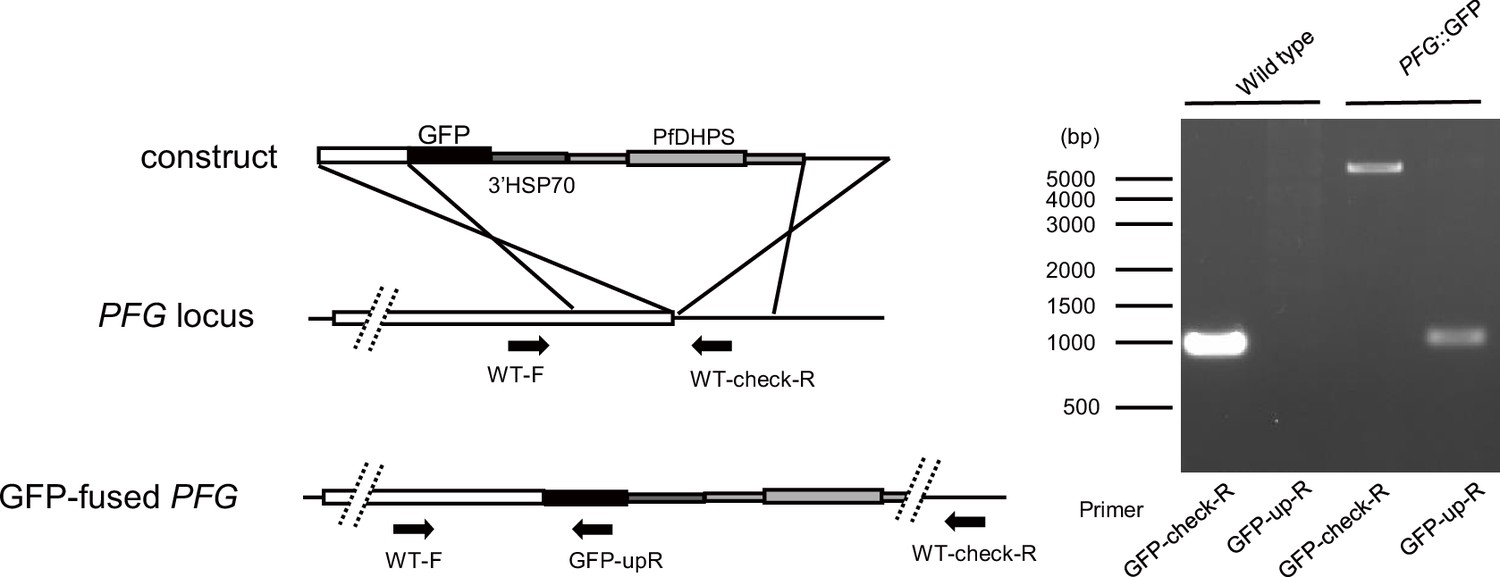
Preparation of PFG::GFP parasites.
-
Figure 1—figure supplement 1—source data 1
Original gel image for Figure 1—figure supplement 1.
- https://cdn.elifesciences.org/articles/88317/elife-88317-fig1-figsupp1-data1-v1.pdf
Figure 2 with 1 supplement
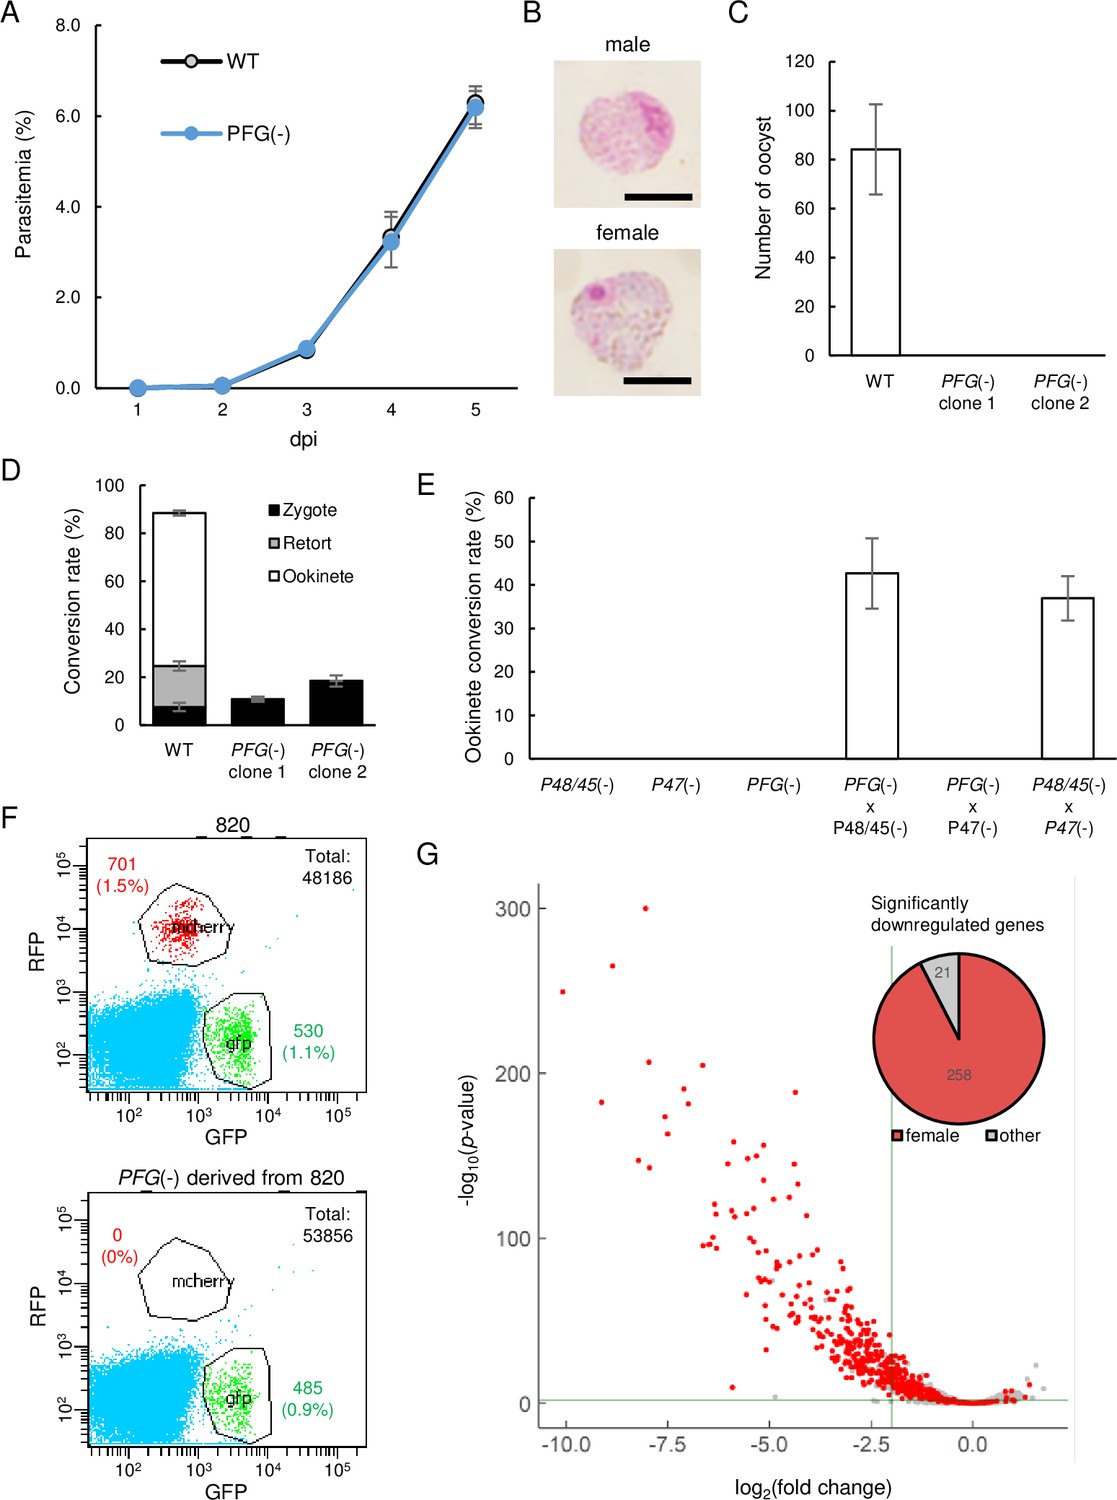
Development of female gametocytes was impaired in PFG(-)parasites.
(A) Proliferation of blood-stage parasites in wild-type and PFG(−) parasites. Parasitemia was calculated by counting infected red blood cells using Giemsa staining of blood smears. Three biologically independent experiments were performed. Data are means ± SEM. (B) Giemsa-stained images of mature male and female gametocytes in PFG(-) parasites. Scale bars: 5 µm. (C) Number of oocysts in the mosquito midgut 14 d after infective blood meal of wild-type and PFG(-) parasites. Twenty mosquitoes were used to determine oocyst number. Data are means ± SEM. (D) Ookinete cultures of wild-type and PFG(-) parasites. Ratios of zygotes, retort-form, and banana-shaped ookinetes to all female-derived cells are shown in black, gray, and white, respectively. Data are means ± SEM from three biologically independent experiments. (E) A cross-fertilization experiment was performed between PFG(-), P48/45(-) (males are infertile), and P47(-) (females are infertile) parasites. The rate of conversion of females to mature ookinetes is shown. Data are means ± SEM from three biologically independent experiments. (F) Flow cytometry analysis of 820 parasites and PFG(-) parasites derived from 820 parasites. (G) Volcano plot showing differential expression of genes in PFG(-) compared to wild-type parasites. Red dots represent female-enriched genes, and horizontal and vertical lines indicate p-value of 0.001 and log2(fold change) of –2, respectively. A pie graph on the top right of the plot area shows the number of female-enriched genes among the significantly downregulated genes.
Figure 2—figure supplement 1
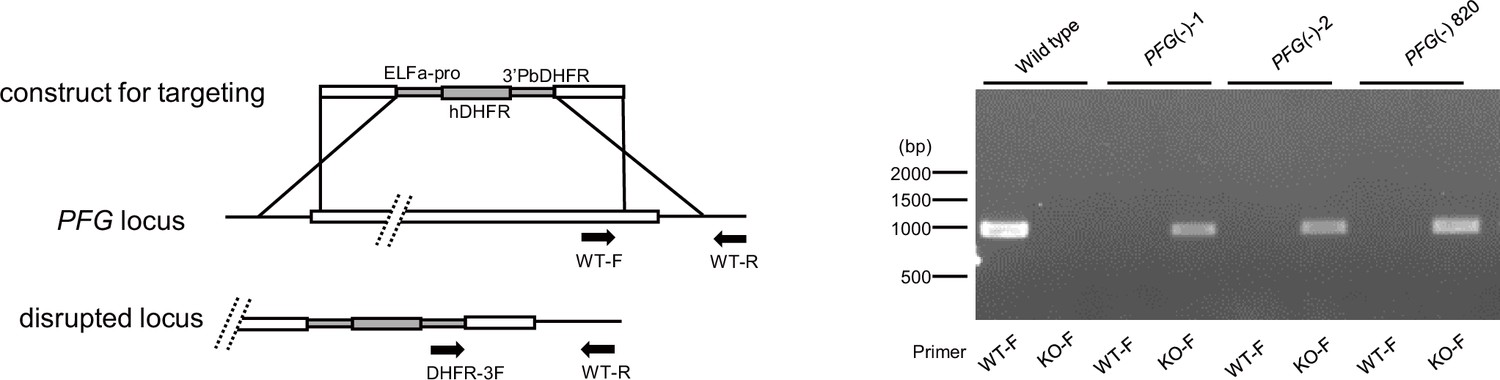
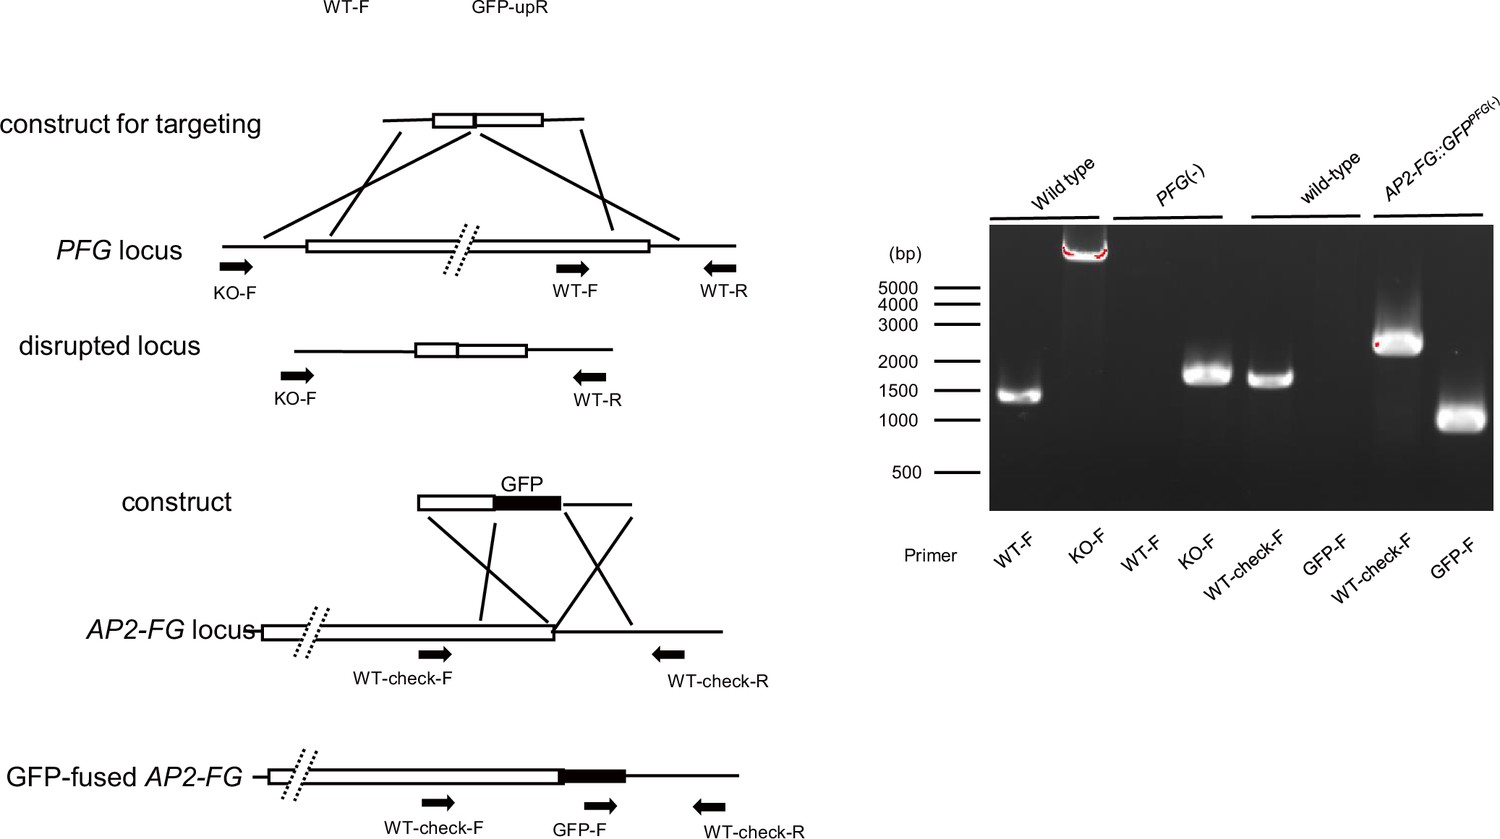
Preparation of PFG(-) and PFG(-)820 parasites.
-
Figure 2—figure supplement 1—source data 1
Original gel image for Figure 2—figure supplement 1.
- https://cdn.elifesciences.org/articles/88317/elife-88317-fig2-figsupp1-data1-v1.pdf
Figure 3

PFG is co-localized with AP2-FG.
(A) IGV images from ChIP-seq experiments 1 and 2 of PFG on chromosome 14. Histograms show row read coverage in the ChIP data at each base. The Venn diagram on the right shows the number of peaks common in ChIP-seq experiments 1 and 2. Peaks were regarded as common when their summits were within 150 bp. (B) Representative peak images of PFG and AP2-FG upstream of genes that were significantly downregulated in PFG(-) parasites. Positions of ten-base motifs are indicated by red bars. ChIP-seq data for AP2-FG were obtained from a previous paper (Yuda et al., 2019). (C) The ten-base motif was enriched around the PFG peaks. Sequence logos were constructed using WebLogo 3 (http://weblogo.threeplusone.com/create.cgi). (D) Heat maps showing coverage in ChIP-seq of PFG (left) and AP-FG (right) with positioning summits of PFG peaks at the center. (E) IGV images of ChIP-seq peaks of AP2-FG that lacked the corresponding PFG peak. Histograms show the row read coverage in the ChIP data at each base.
Figure 4 with 2 supplements
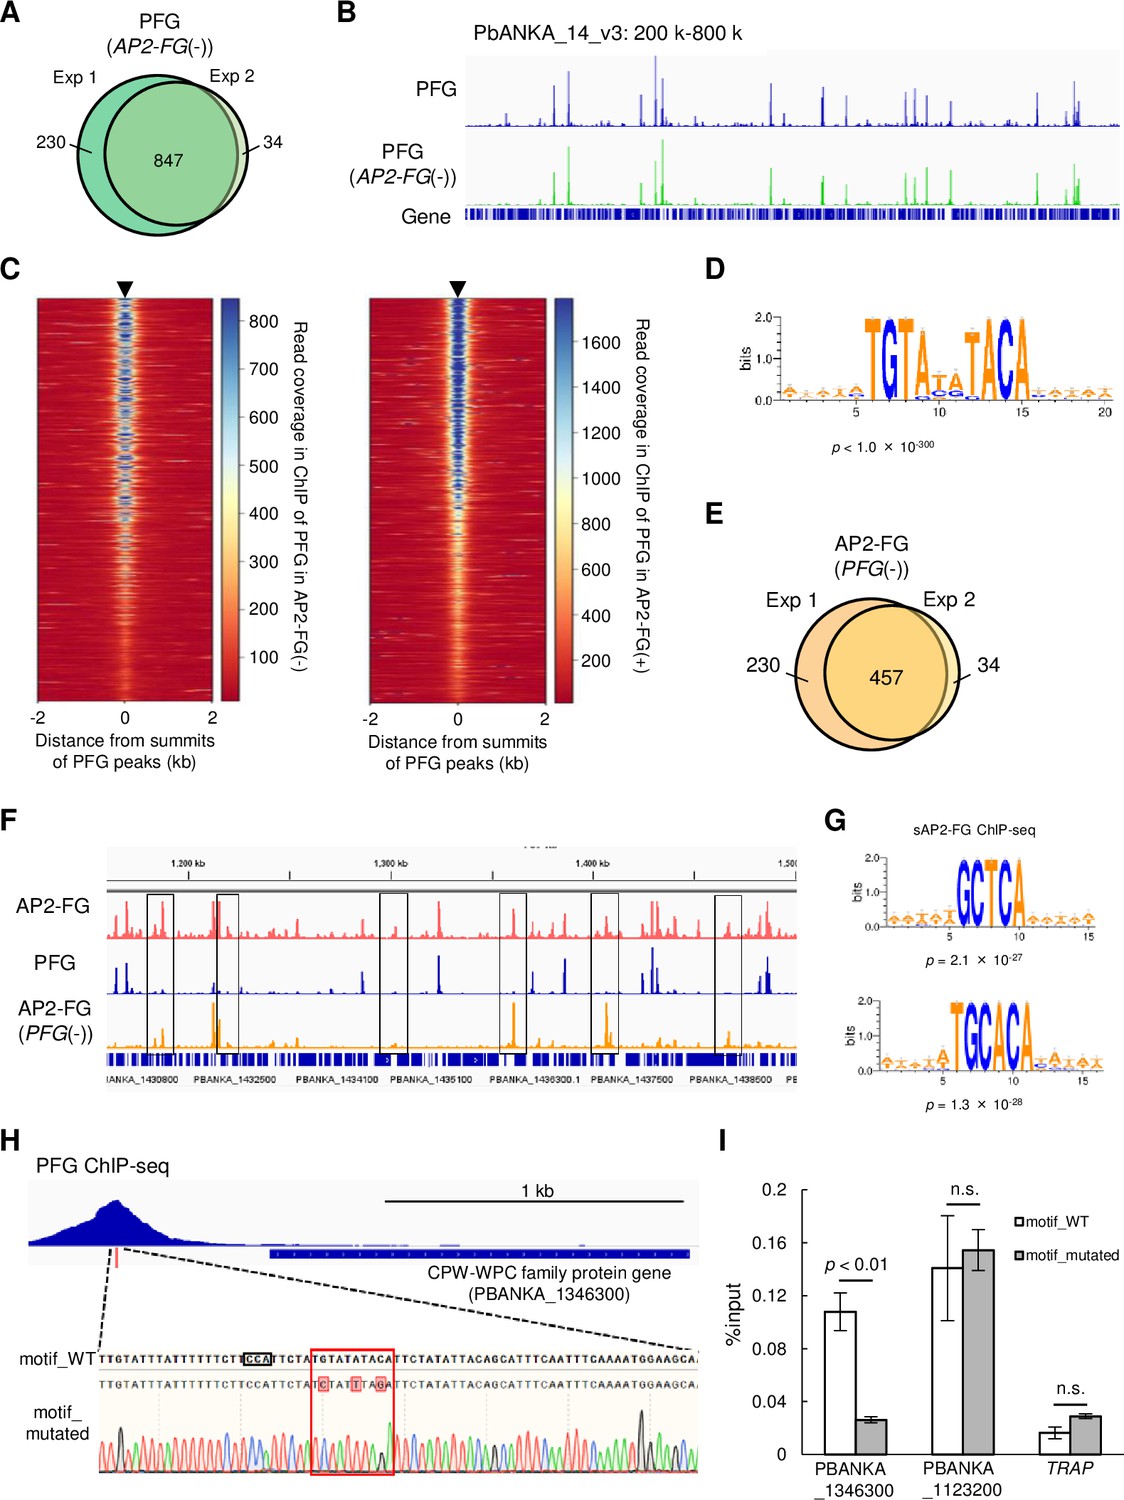
PFG mediates AP2-FG binding to the ten-base motif.
(A) Venn diagram showing the number of common peaks between experiments 1 and 2 in ChIP-seq of PFG using PFG::GFPAP2-FG(-) parasites. Peaks were regarded as common when their summits were within 150 bp. (B) IGV images from the ChIP-seq peaks of PFG on part of chromosome 14. The top panel shows the ChIP peaks using PFG::GFP parasites, and the bottom panel shows those using PFG::GFPAP2-FG(-) parasites. Histograms show row read coverage in the ChIP data at each base. (C) Heat maps showing coverage in ChIP-seq of PFG using PFG::GFP parasites (left) and PFG using PFG::GFPAP2-FG(-) parasites, with positioning summits of peaks obtained in the other ChIP-seq at the center. (D) Motifs enriched around the summits of peaks identified in ChIP-seq of PFG using PFG::GFPAP2-FG(-) parasites. The sequence logo was depicted using WebLogo 3. (E) Venn diagram showing the number of common peaks between experiments 1 and 2 in ChIP-seq of AP2-FG using AP2-FG::GFPPFG(-) parasites. Peaks were regarded as common when their summits were within 150 bp. (F) IGV images of ChIP-seq peaks of AP2-FG and PFG in a region on which several AP2-FG peaks lack the corresponding PFG peak (chromosome 14:1,150–1500 kb). The top panel shows ChIP peaks of AP2-FG using AP2-FG::GFP. The middle and bottom panels show the ChIP-seq peaks of PFG using PFG::GFP and the ChIP peaks of AP2-FG using AP2-FG::GFPPFG(-) parasites, respectively. The AP2-FG peaks lacking their corresponding PFG peaks are highlighted by rectangles. Histograms show row read coverage in the ChIP data at each base. (G) Motifs enriched around the summits of peaks identified in the ChIP-seq of AP2-FG using AP2-FG::GFPPFG(-) parasites. Sequence logos are depicted using WebLogo 3. (H) Peak image of PFG and the ten-base motif under the summit upstream of a CPW-WPC family protein gene (PBANKA_1346300). The motif was mutated using the CRISPR/Cas9 system, and the mutation was confirmed by Sanger sequencing (the lowest panel; mutated nucleic acid residues are highlighted). The protospacer adjacent motif (PAM) sequence used for targeting is also highlighted by a rectangle. (I) ChIP-qPCR analysis of PFG in the upstream region of PBANKA_1346300. Gray and white bars indicate the results using wild-type and motif-mutated parasites, respectively. Three independent biological experiments were performed. The results are shown as a percentage input. Error bars indicate standard error. Experiments with another CPW-WPC family protein gene (PBANKA_1123200) and TRAP were performed as positive and negative controls, respectively.
Figure 4—figure supplement 1
Preparation of PFG::GFPAP2-FG(-) parasites.
PFG::GFPAP2-FG(-) parasites were prepared from AP2-FG(-) parasites using the sulfadiazine-resistant dihydropteroate synthase (DHPS) gene as a selectable marker gene.
-
Figure 4—figure supplement 1—source data 1
Original gel image for Figure 4—figure supplement 1.
- https://cdn.elifesciences.org/articles/88317/elife-88317-fig4-figsupp1-data1-v1.pdf
Figure 4—figure supplement 2
Preparation of AP2-FG::GFPPFG(-) parasites.
AP2-FG::GFPPFG(-) parasites were prepared using CRISPR/Cas9 in two steps. First, PFG was disrupted in pbcas9, and then GFP was fused to the 3’-portion of the AP2-FG gene.
-
Figure 4—figure supplement 2—source data 1
Original gel image for Figure 4—figure supplement 2.
- https://cdn.elifesciences.org/articles/88317/elife-88317-fig4-figsupp2-data1-v1.pdf
Figure 5
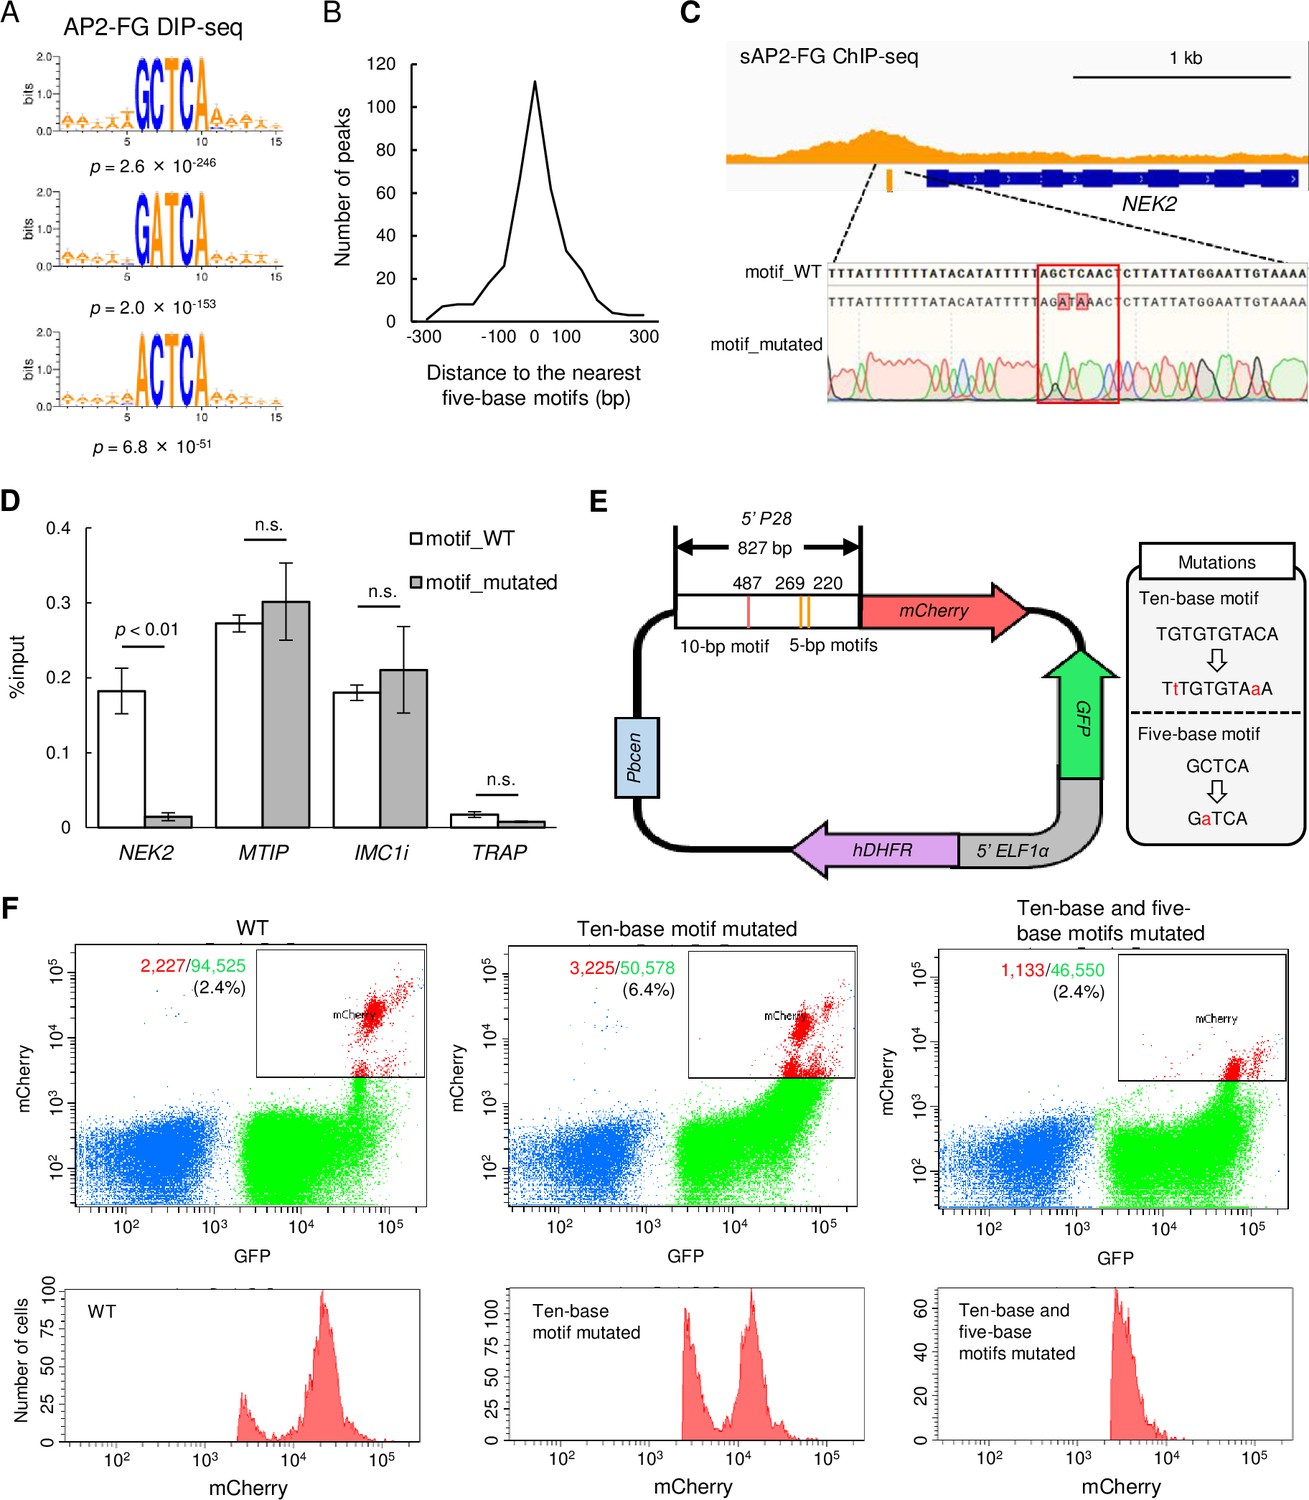
sAP2-FG binds to five-base motifs that function as a cis-acting element independent of the ten-base motif.
(A) Motifs enriched around peaks identified in DIP-seq of the AP2 domain of AP2-FG. Sequence logos are depicted using WebLogo 3. (B) Histogram showing the distance between the peak summit and the nearest five-base motifs in (A) for each ChIP peak of sAP2-FG. (C) Peak image of sAP2-FG upstream of NEK2 and the five-base motif under the summit. The motif was mutated, and the sequence was confirmed by Sanger sequencing (lowest panel). The protospacer adjacent motif (PAM) sequence used for targeting is highlighted by a rectangle. Mutated nucleic acid residues have also been highlighted. (D) ChIP-qPCR analysis of sAP2-FG in the upstream region of NEK2. Gray and white bars indicate the results obtained for wild-type and motif-mutated parasites, respectively. The results are shown as mean %input values from three biologically independent experiments. Error bars indicate standard error. Experiments with MTIP and IMC1i were performed as positive controls, and that in TRAP as a negative control. Statistical significance was determined using paired Student’s t-test. (E) Schematic diagram of a Plasmodium centromere plasmid used to assessing promoter activity of P28. Mutations introduced into the ten-base and five-base motifs of the P28 promoter are described in a gray box. Pbcen, a sequence of the P. berghei chromosome 5 centromere, 5’-ELF1α, a bidirectional promoter of the elongation 1α gene for conferring constitutive expression. (F) FACS analysis of parasites harboring the P28-reporter plasmid (E). Parasites were gated on forward-scatter and staining with Hoechst 33342, and then on GFP. The percentages of mCherry-positive parasites in all gated cells are shown on the left panel. The histogram on the right shows the number of mCherry-positive parasites at different signal strengths.
Figure 6

Target genes of PFG (cAP2-FG) and sAP2-FG contain different sets of genes.
(A) Functional classification of the PFG target genes (cAP2-FG) (572 annotated genes in total). In this graph, different subgroups related to female gametocyte-specific functions are collectively shown as a group ‘female-specific functions’ (see also Supplementary file 3a). Hypothetical protein genes were not included. The number of members in each group is shown in the chart. (B) Functional classification of the target genes of sAP2-FG (240 annotated genes in total). Hypothetical protein genes were not included. (C) Venn diagram showing an overlap between the target genes of sAP2-FG and PFG (cAP2-FG). The target genes in ‘female-specific functions’ are written according to their belongings: unique to sAP2-FG, common, and unique to cAP2-FG. The assignment of these genes into each subgroup was based on functional annotation in PlasmoDB and the following references (Rao et al., 2016; Reininger et al., 2009; Nishi et al., 2022; Tremp et al., 2013; Bergman et al., 2003; Kariu et al., 2006; Andreadaki et al., 2020; Talman et al., 2011; Olivieri et al., 2015; Nishi et al., 2023; Ecker et al., 2008; Ukegbu et al., 2021; Sansam and Pezza, 2015; Pezza et al., 2007; Jenwithisuk et al., 2018; Kangwanrangsan et al., 2013; Dessens et al., 2011; Tremp et al., 2020; Santos et al., 2016; Santos et al., 2015; Wetzel et al., 2015; Saeed et al., 2020). (D) IGV images from the ChIP-seq data of AP2-G, PFG, and sAP2-FG in the upstream region of PFG. The data of the ChIP-seq peaks for AP2-G were obtained from a previous study (Yuda et al., 2021). The peak region’s binding motifs of AP2-G, ten-base and five-base motifs are indicated by purple, red, and orange bars. (E) A putative cascade of transcription factors (TFs) starting from AP2-G is suggested in this and previous studies. (F) Box-and-whisker plots showing log2(fold change) for target genes unique to sAP2-FG and PFG (cAP2-FG) and common for both. Cross marks in the boxes indicate the average values. Statistical significance was determined using paired Student’s t-test. (G) A model of transcriptional regulation during female development. Female-specific genes harbor either or both of the female-specific cis-activating elements, five-base and ten-base elements in the upstream. In early female gametocytes, AP2-FG binds to a five-base cis-activating element via its AP2 domain and activates genes for gametocyte development and some genes for zygote/ookinete development. In the later stage, when PFG is highly expressed, AP2-FG is predominantly recruited to the PFG on the ten-base cis-activating element, and the AP2-FG/PFG complex activates a full repertoire of genes for zygote/ookinete development.
Author response image 1

Legged: The Venn diagram shows the number of common peaks between these ChIP seq experiments (distance of peak summits < 150).
Author response image 2
Additional files
-
Supplementary file 1
Differential expression analysis between wild-type and PFG(-) parasites.
- https://cdn.elifesciences.org/articles/88317/elife-88317-supp1-v1.xlsx
-
Supplementary file 2
Peaks identified in ChIP-seq experiments and their nearest genes.
(a) Peaks identified in ChIP-seq of PFG with their nearest genes (experiment 1). (b) Peaks identified in ChIP-seq of PFG (experiment 2). (c) Peaks identified in ChIP-seq of PFG using AP2-FG(-) parasites (experiment 1). (d) Peaks identified in ChIP-seq of PFG using AP2-FG(-) parasites (experiment 2). (e) Peaks identified in ChIP-seq of sAP2-FG (experiment 1). (f) Peaks identified in ChIP-seq of sAP2-FG (experiment 2). (g) Peaks identified in DIP-seq using recombinant AP2 domain of AP2-FG and P. berghei genomic DNA.
- https://cdn.elifesciences.org/articles/88317/elife-88317-supp2-v1.xlsx
-
Supplementary file 3
Target genes predicted from ChIP-seq peaks.
(a) PFG target genes predicted from ChIP-seq peaks. (b) sAP2-FG target genes predicted from ChIP-seq peaks.
- https://cdn.elifesciences.org/articles/88317/elife-88317-supp3-v1.xlsx
-
Supplementary file 4
List of primers used in this study.
- https://cdn.elifesciences.org/articles/88317/elife-88317-supp4-v1.xlsx
-
MDAR checklist
- https://cdn.elifesciences.org/articles/88317/elife-88317-mdarchecklist1-v1.docx
Download links
A two-part list of links to download the article, or parts of the article, in various formats.
Downloads (link to download the article as PDF)
Open citations (links to open the citations from this article in various online reference manager services)
Cite this article (links to download the citations from this article in formats compatible with various reference manager tools)
Coordinated regulation of gene expression in Plasmodium female gametocytes by two transcription factors
eLife 12:RP88317.
https://doi.org/10.7554/eLife.88317.3


