Recursive self-embedded vocal motifs in wild orangutans
- Department of Psychology, University of Warwick, United Kingdom
- Independent Researcher, United Kingdom
- Comparative Bioacoustics Group, Max Planck Institute for Psycholinguistics, Netherlands
- Center for Music in the Brain, Department of Clinical Medicine, Aarhus University & The Royal Academy of Music Aarhus/Aalborg, Denmark
- Department of Human Neurosciences, Sapienza University of Rome, Italy
- Department of Life Sciences and Systems Biology, University of Turino, Italy
Figures
Figure 1
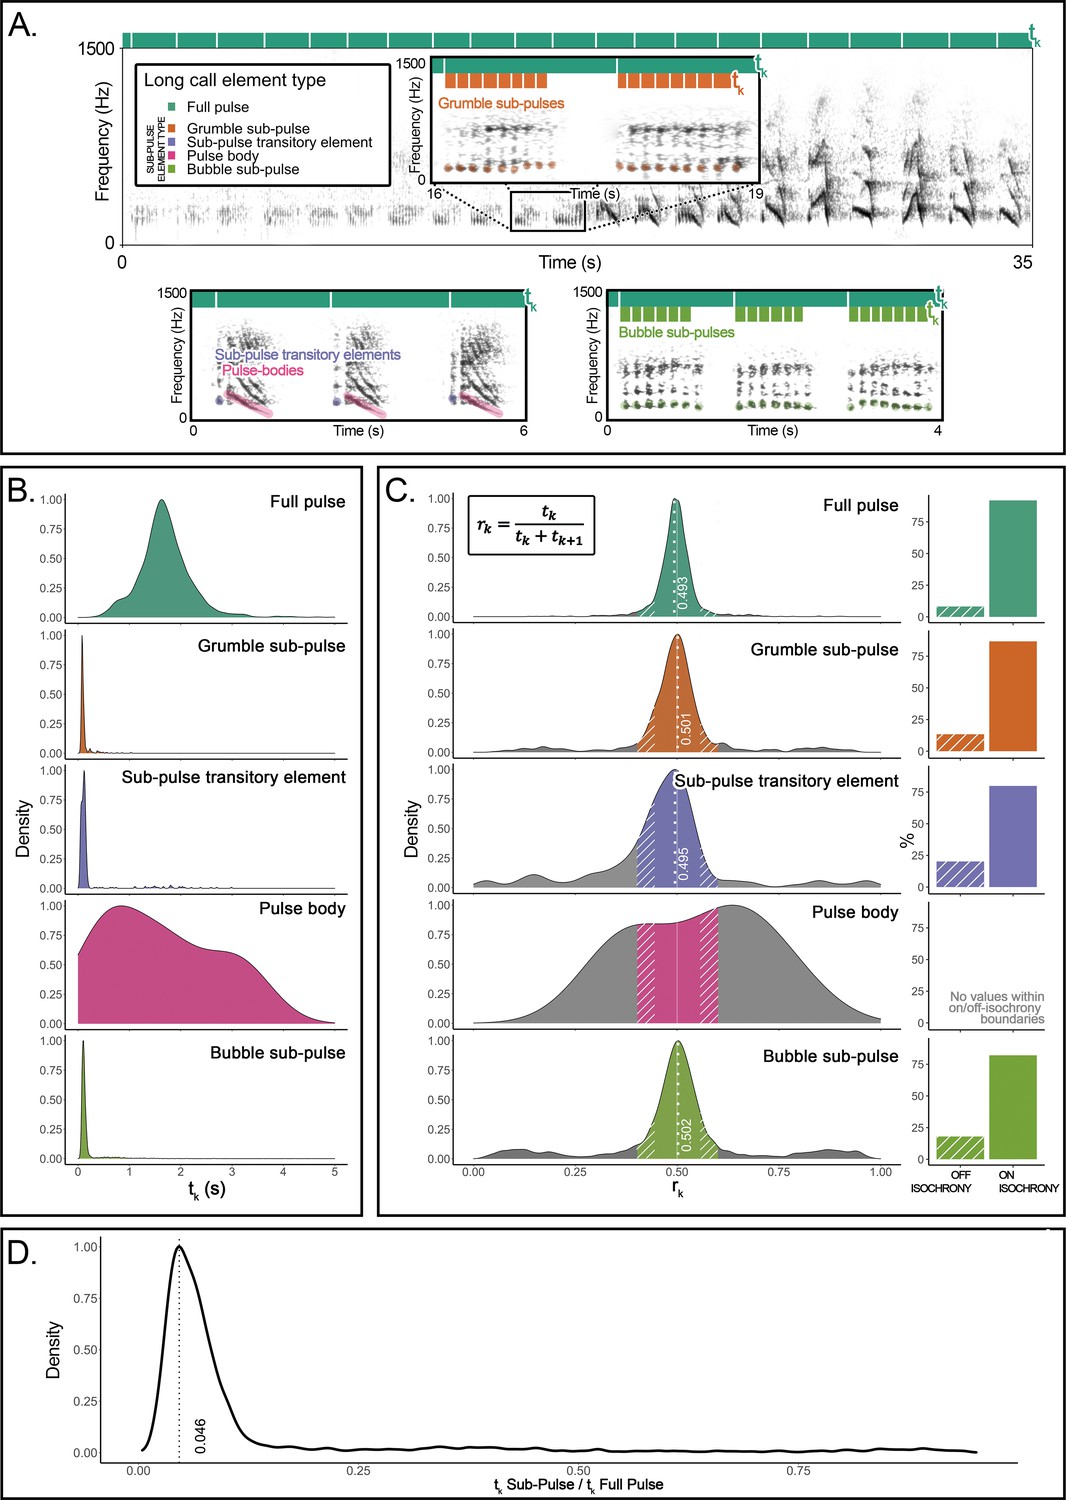
Organization and rhythmic features of orangutans’ long calls.
(A) Top: the spectrogram of a full pulse and its organization in sub-pulses (e.g., grumble sub-pulses). Below are the spectrograms of the three other sub-element types: sub-pulse transitory elements, pulse bodies, and bubble sub-pulses. Bars on the top of each spectrogram schematically quantify the durations of inter-onset intervals (tk): dark green denotes the higher level of organization (full pulse). Orange (in the inset) and light green (bottom right) denote the lower-level organization (sub-pulse element types). (B) Probability density function showing the distributions of the inter-onset intervals (tk) for each of the long call element types. (C) The distributions on the left show rhythm ratios (rk) per element type as calculated on 12 flanged males for a total of 1915 full pulses and 5309 sub-pulses. Solid sections of the curves indicate on-isochrony rk values; striped sections indicate off-isochrony rk values. A solid white line indicates the 0.5 rk value corresponding to isochrony. White dotted lines denote the on-isochrony peak value extracted from the probability density function. Right: a bar plot per each element type shows the percentage of observations (rk) falling into the on-isochrony boundaries (solid bars) or on off-isochrony boundaries (striped bars). The number of on-isochrony rk is significantly larger (GLMM, full vs null: Chisq = 2717.543, p<0.001) than the number of off-isochrony rk for all long call element types (full pulse: t-ratio = −25.164, p<0.001; bubble sub-pulse: t-ratio = –30.694, p<0.001; grumble sub-pulse: t-ratio = −14.526, p<0.001; sub-pulse transitory element: t-ratio = −3.148, p<0.001). Pulse body showed no rk values falling within the on-off-isochrony boundaries. (D) Distribution of a variable calculated as the ratio between the tk of a sub-pulse and the tk of the corresponding higher level of organization, the full pulse. We report the peak value of the curve (0.046) and tested the significance of the extent of the central quartiles, which was significantly smaller than peripheral quartiles (Wilcoxon signed-rank test: W = 2272, p<0.001).
Figure 2
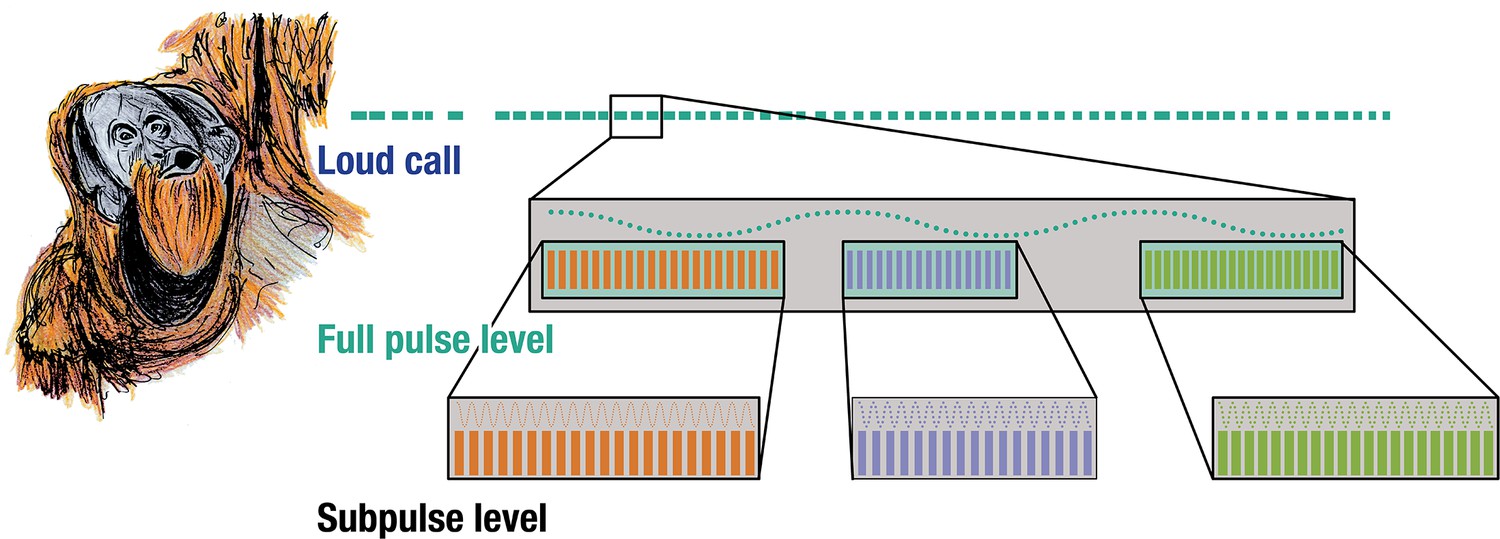
Isochrony nested within isochrony.
Three acoustically distinct sub-pulse calls occurring at three distinct tempi nested within the same pulse-level tempo in wild flanged male orangutan long calls.
Additional files
-
Supplementary file 1
GLMM statistical details.
- https://cdn.elifesciences.org/articles/88348/elife-88348-supp1-v1.docx
-
Supplementary file 2
Example set of male orangutan grumbles.
- https://cdn.elifesciences.org/articles/88348/elife-88348-supp2-v1.wav
-
Supplementary file 3
Example set of male orangutan transitory elements and pulse body.
- https://cdn.elifesciences.org/articles/88348/elife-88348-supp3-v1.wav
-
Supplementary file 4
Example set of male orangutan full pulses.
- https://cdn.elifesciences.org/articles/88348/elife-88348-supp4-v1.wav
-
Supplementary file 5
Example set of male orangutan bubbles.
- https://cdn.elifesciences.org/articles/88348/elife-88348-supp5-v1.wav
-
MDAR checklist
- https://cdn.elifesciences.org/articles/88348/elife-88348-mdarchecklist1-v1.pdf
Download links
A two-part list of links to download the article, or parts of the article, in various formats.
Downloads (link to download the article as PDF)
Open citations (links to open the citations from this article in various online reference manager services)
Cite this article (links to download the citations from this article in formats compatible with various reference manager tools)
Recursive self-embedded vocal motifs in wild orangutans
eLife 12:RP88348.
https://doi.org/10.7554/eLife.88348.3


