Event-related modulation of alpha rhythm explains the auditory P300-evoked response in EEG
- Department of Neurology, Max Planck Institute for Human Cognitive and Brain Sciences, Germany
- Max Planck School of Cognition, Germany
- Bernstein Center for Computational Neuroscience, Charité – Universitätsmedizin Berlin, Germany
- Roche Pharma Research and Early Development, Neuroscience and Rare Diseases, Roche Innovation Center Basel, F. Hoffmann–La Roche Ltd., Switzerland
- LIFE – Leipzig Research Center for Civilization Diseases, University of Leipzig, Germany
- Department of Psychology, IU International University of Applied Sciences, Germany
- Department of Psychiatry and Psychotherapy, University of Leipzig Medical Center, Germany
- Department of Psychiatry, Psychosomatics and Psychotherapy, Goethe University Frankfurt, Germany
- Institute for Medical Informatics, Statistics and Epidemiology (IMISE), University of Leipzig, Germany
- Clinic for Cognitive Neurology, University Hospital Leipzig, Germany
- Bernstein Center for Computational Neuroscience Berlin, Germany
Figures
Figure 1
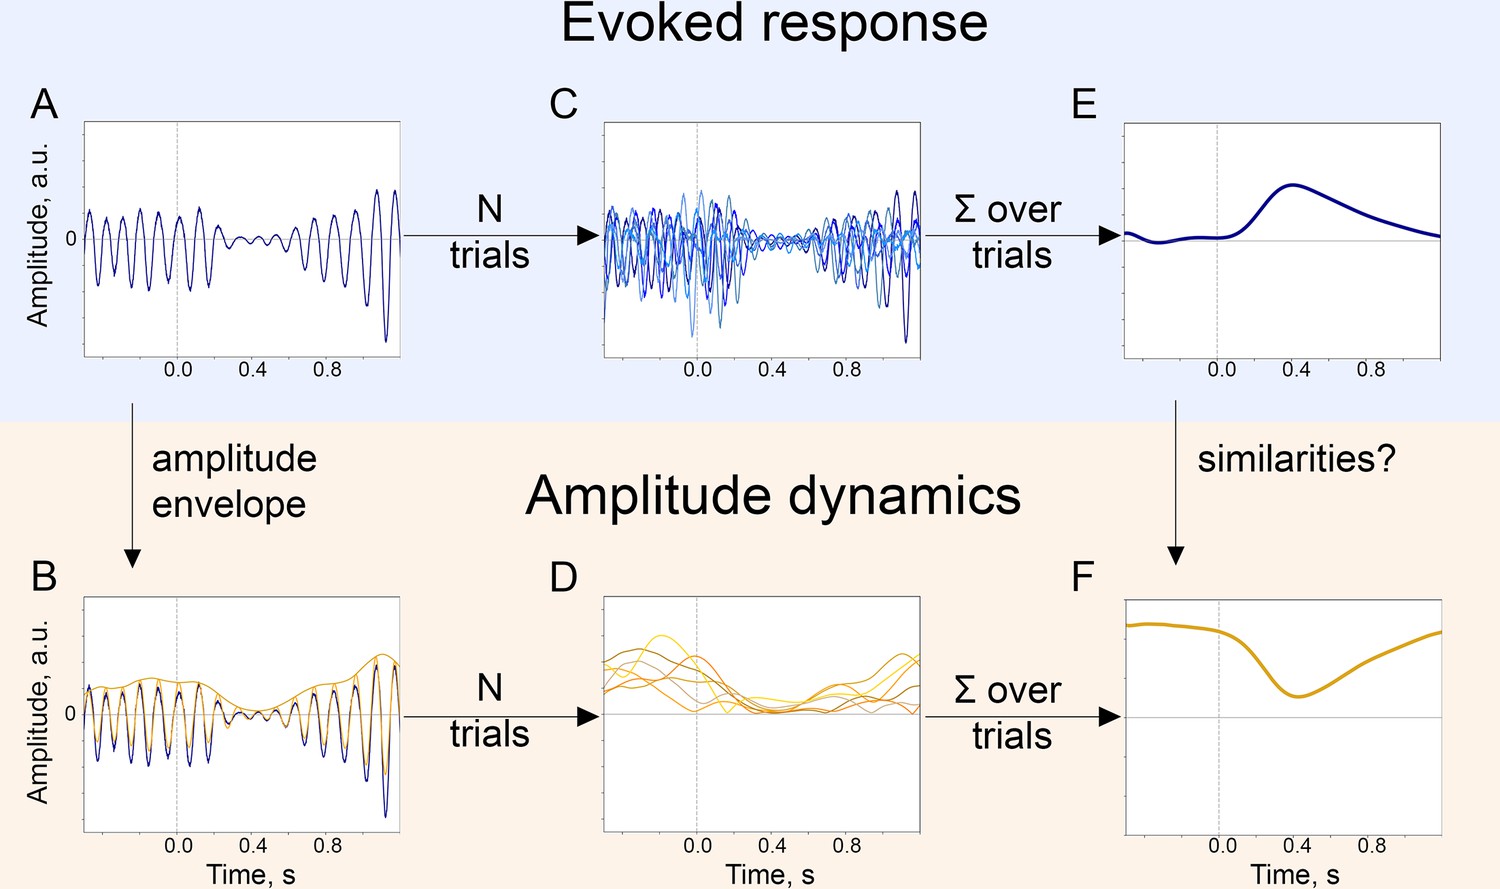
The baseline-shift mechanism (BSM) of evoked response (ER) generation.
For a particular ER, probing the agreement with BSM would involve extracting both the ER and the oscillatory amplitude envelope. (A). The single-trial broadband signal. (B). The amplitude envelope of oscillations is extracted from a broadband signal of each trial. (C). To get a high signal-to-noise ER, usually multiple trials are acquired. Note that since oscillations have a negative mean, their attenuation would lead to the generation of an ER with a positive polarity (shown in E.). (D). Similarly, for each trial, the amplitude envelope is extracted. (E). Trials are averaged and, optionally, low-pass filtered to obtain an ER.( F). Amplitude envelopes over trials are also averaged to obtain an estimate of the change in oscillatory amplitude in the poststimulus window. Here, we simulated the example of negative-mean oscillations giving rise to a positive-polarity ER.
Figure 2 with 1 supplement
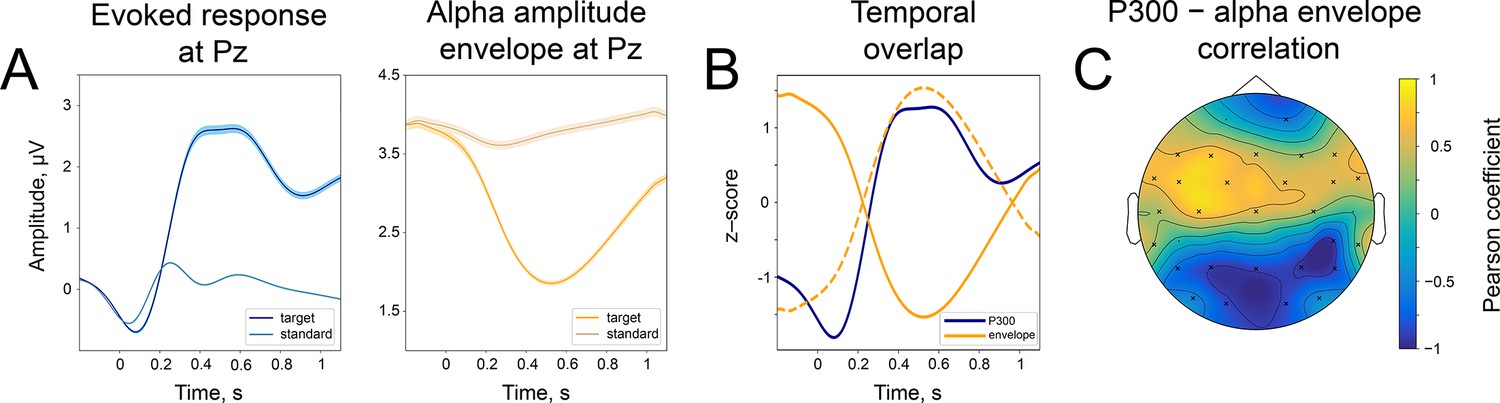
Temporal similarity between P300 and the alpha amplitude envelope.
(A). Left panel—time course of P300 at the Pz electrode elicited by the target stimulus and ER after a standard stimulus (sER) both averaged across participants. Right panel—alpha amplitude envelope at Pz electrode averaged across participants for target and standard stimulus. Shaded areas display the standard error of the mean. Sample size is 2230. (B). Temporal overlap in signals. The time courses of P300 and alpha amplitude display similarities in initial slope and peak latency. Amplitude values are z-scores to aid visual comparison. Dashed line—alpha amplitude envelope multiplied by –1. (C). A correlation between P300 and alpha amplitude. For grand averages at each electrode, the correlation between P300 and alpha envelope was computed with the Pearson correlation coefficient. Electrodes marked with ‘x’ had significant correlation coefficients. The p-value was set at the Bonferroni corrected value of . Note the positive correlation between the low-frequency signal and the alpha amplitude envelope over central sites. Due to the negative polarity of ER over the fronto-central sites, such correlation may still indicate a temporal relationship between the P300 process and oscillatory amplitude envelope dynamics (due to the use of a common average reference). However, it cannot be entirely excluded that additional lateralised response-related activity contributes to this positive correlation (Salisbury et al., 2001).
Figure 2—figure supplement 1

Time-space evolution of P300 and alpha amplitude envelope.
(A). P300 grand average over participants. (B). Alpha amplitude grand average over participants.
Figure 3 with 2 supplements
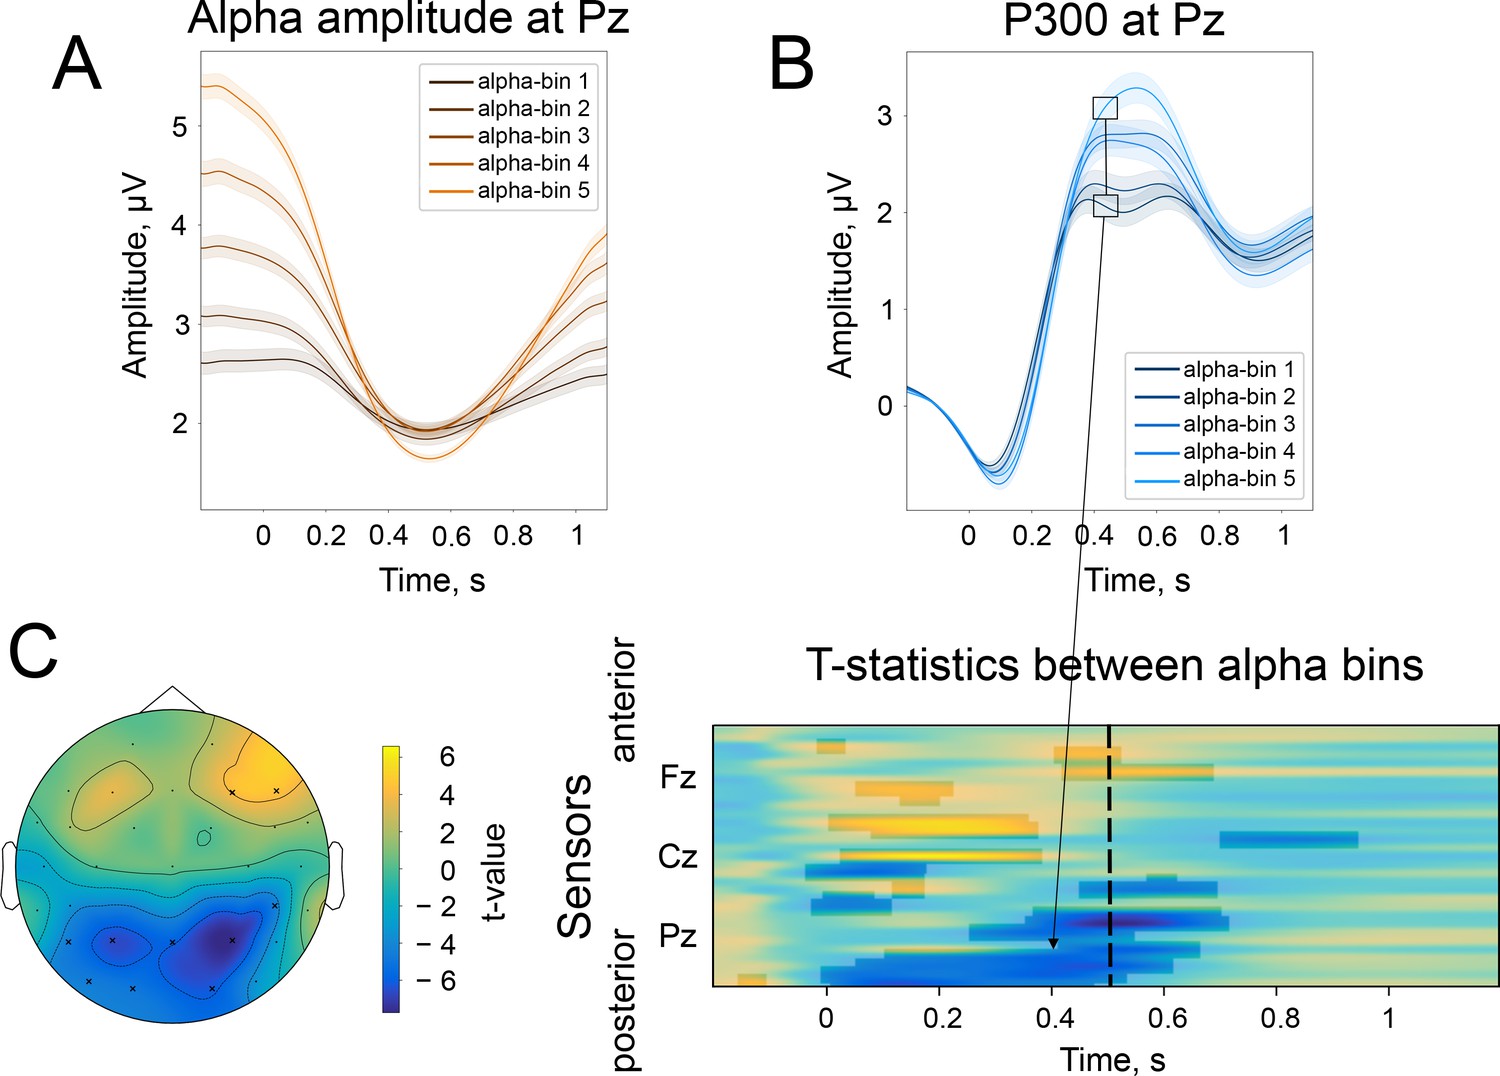
The difference in the strength of alpha amplitude modulation correlates with the difference in P300 amplitude.
(A). Alpha amplitude envelope sorted into 5 bins according to the depth of modulation in the poststimulus window. The bins were the following: (66, –25), (–25,–37), (–37,–47), (–47,–58), (–58,–89)% change. Here, –100% corresponds to the deepest modulation, and 0% to the absence of a change in the amplitude. (B). P300 responses are sorted into the corresponding bins. Shaded areas display the standard error of the mean. Total sample size is 2230, sample size in each bin is 446. (C). The spatio-temporal t-test reveals clusters of significant differences between the two most extreme bins—bin 1 and bin 5. The topography of t-statistics is sampled at 500ms (dashed line). The significant electrodes at this time point are marked with “x”.
Figure 3—figure supplement 1

The difference in the strength of alpha amplitude modulation correlates with the difference in early ER, but only for broadband data.
(A). The spatio-temporal t-test between the two most extreme bins—bin 1 and bin 5 of alpha amplitude change (see main text, Figure 3A)—reveals a cluster of a significant difference at 100ms (corresponding to N100) for the broadband ER (0.1–45 Hz). The significant electrodes at this time point are marked with an ‘x’. (B). The same test but for high-pass filtered ER (4–45 Hz). In this case, a large cluster of significant differences disappears. It means that the difference is driven by a low-frequency component, which presumably is a baseline shift created by an emerging decrease in alpha rhythm amplitude.
Figure 3—figure supplement 2

The synchronisation in the population of neurons generating alpha rhythm affects the amplitude of the alpha rhythm but not the evoked response.
Similarly as in Studenova et al., 2022, we performed simulations with evoked response and alpha rhythm resembling P300 and alpha amplitude envelope obtained from real recordings. The synchronisation strength was manipulated by the starting distribution of phases. The kappa parameter characterises the peakiness of phase distribution—with kappa = 5 the distribution has a peak and with kappa = 0.01 the distribution is close to uniform. In the real EEG data, the synchronisation of the underlying population is unknown. Therefore, a direct correspondence between the amplitude of the evoked response and the amplitude envelope of the alpha rhythm can be only approximately evaluated (for instance, with the baseline-shift index, BSI).
Figure 4
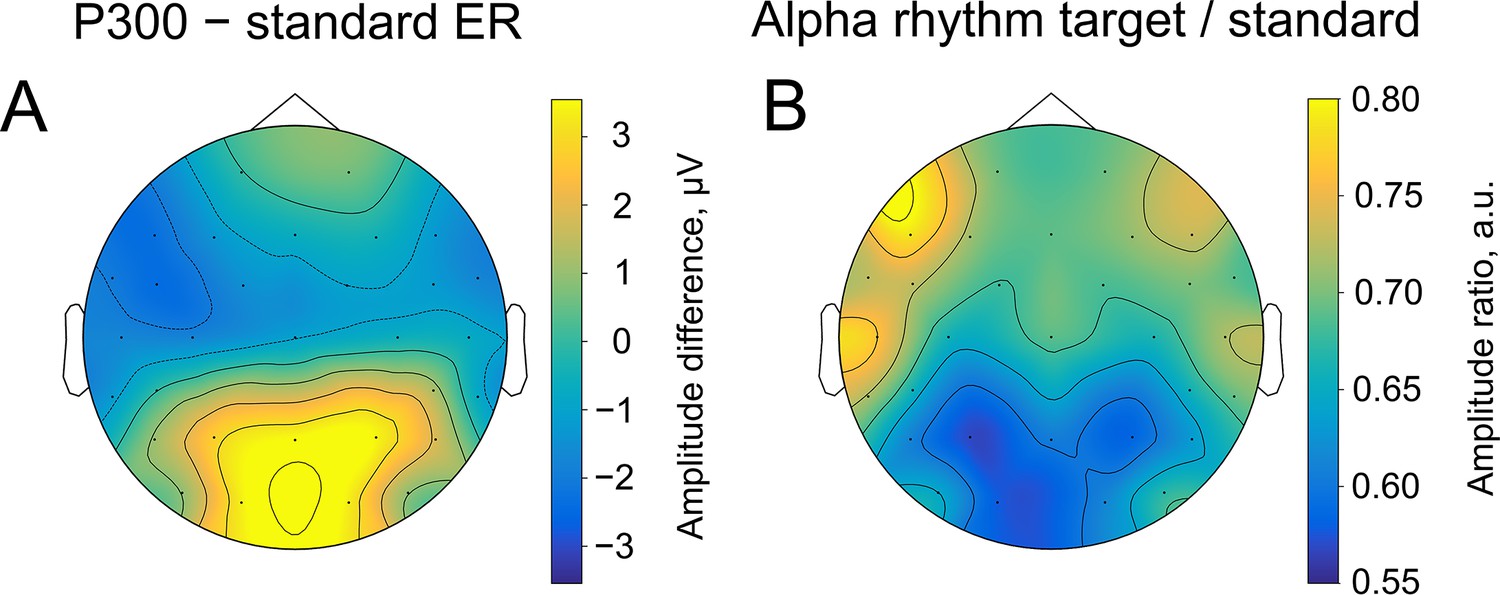
Spatial similarity of topographies of P300 (A) and alpha amplitude (B) contrasted between the target and standard stimulus.
The topographies are shown at the peak amplitude of P300, which was estimated from the averaged over trials ER for each participant within the time window of 200–1000ms poststimulus at the Pz electrode (on average 509±171ms). For ER, the contrast was built by subtracting the sER amplitude from the P300 amplitude. For alpha amplitude, the contrast was built by dividing values of the amplitude after the target stimulus onto values after the standard stimulus.
Figure 5
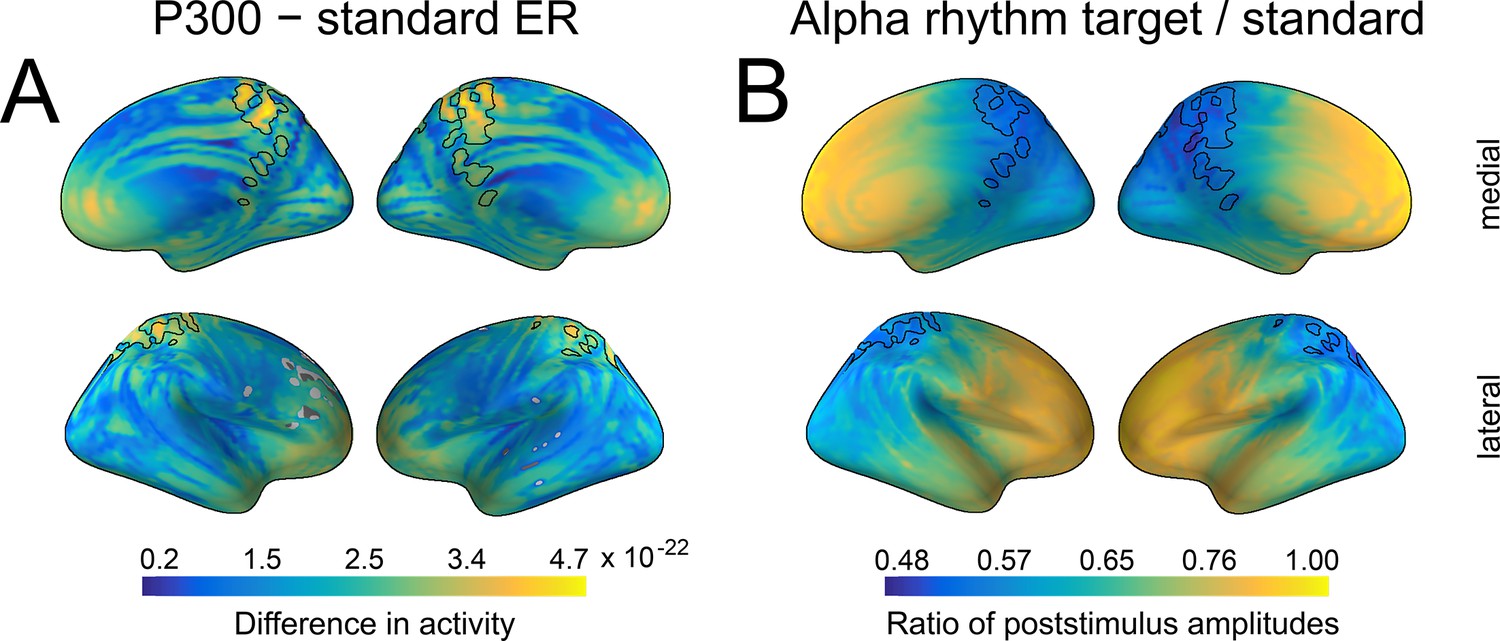
Spatial similarity between P300 and alpha amplitude in a source space.
(A) The difference between P300 and sER, after correction for multiple comparisons. The difference was estimated as the subtraction of averaged sER power from averaged P300 power in the time window of 300–700ms. The colorbar thus indicates the difference in power. The black line outlines an overlap that is common for both P300 (top 10% of activity) and alpha amplitude (top 10% of activity). (B). The difference in alpha amplitude envelope after standard and target stimuli with a correction for multiple comparisons (all dipole locations are significant). The difference was estimated as the target poststimulus alpha amplitude divided by the standard alpha amplitude. The poststimulus window was the same as for P300: 300–700ms.
Figure 6
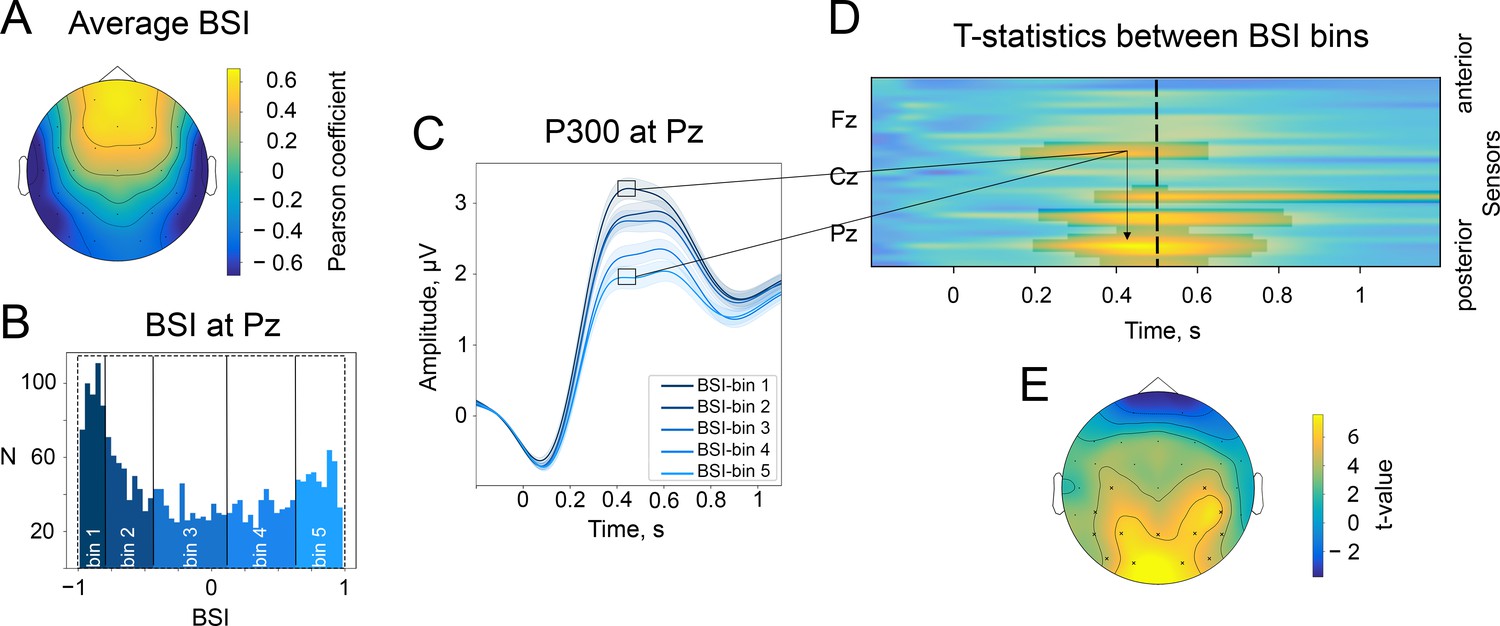
The baseline-shift index (BSI) explains the direction of ER based on the direction of alpha amplitude change.
(A). The average values of BSI at each electrode estimated from the resting-state data. Here, BSI is computed as the Pearson correlation coefficient (see Methods/The baseline-shift index). BSI serves as a proxy for the relation between ER polarity and the direction of alpha amplitude change (Nikulin et al., 2010). Here, we observe predominantly negative BSIs (and thus negative mean oscillations) at posterior sites, which indicates the inverted relation between P300 and alpha amplitude change. Indeed, in the task data, a positive deflection of P300 at posterior sites coincides with a decrease in alpha amplitude. (B). BSIs at Pz were binned into 5 bins. The BSI bins were the following: (−0.99,–0.81), (−0.81,–0.46), (−0.46, 0.09), (0.09, 0.62), (0.62, 0.98). According to predictions of BSM, if BSI (and the oscillatory mean) was negative, then the attenuation of oscillations would lead to the upward direction of ER. (C). P300 was binned into bins according to BSI. For bins with negative BSI, the amplitude of P300 is higher in comparison to bins with positive BSI. Shaded areas display the standard error of the mean. Total sample size is 2230, sample size in each bin is 446. (D). The evolution of the statistical difference between the amplitude of P300 in the first and fifth BSI-bins across time and space. The difference is prominent over the central and parietal regions. The cluster-based permutation test revealed significant clusters in central and parietal regions with a p-value . (E). The topography of t-statistics is sampled at 500ms (at the dashed line of the upper panel). The significant electrodes at this time point are marked with ‘x’.
Figure 7
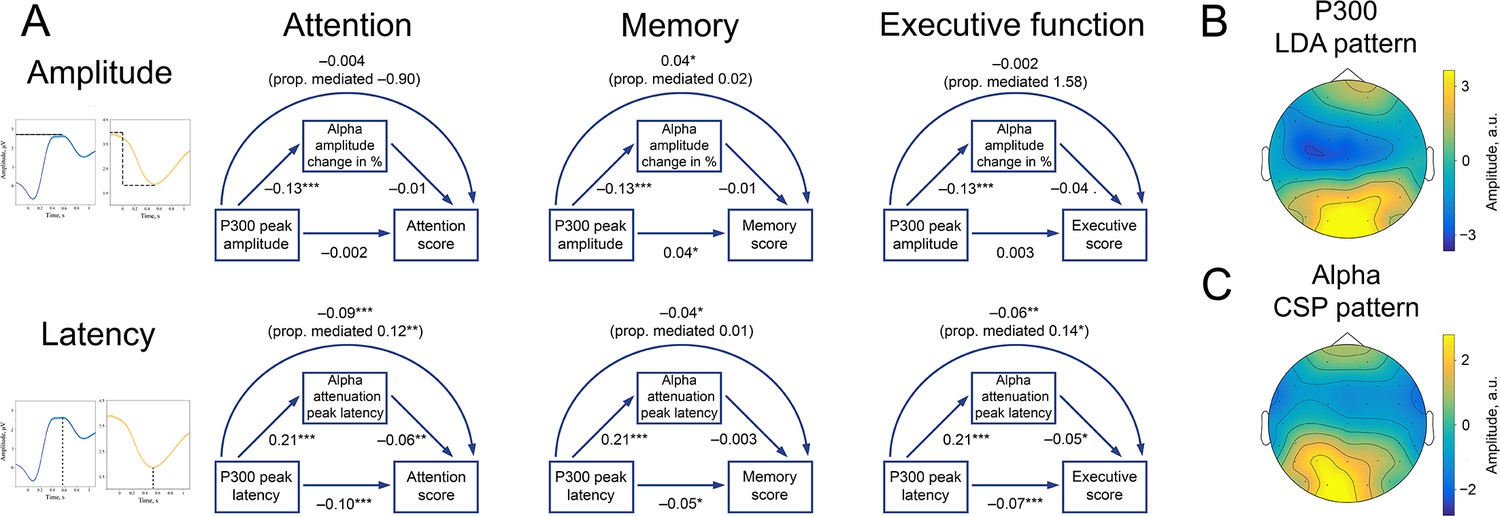
P300 and alpha oscillations showed similar correlation profiles across cognitive processes.
(A). Attention, memory, and executive function scores correlate with P300 and the alpha envelope. Attention scores were computed from TMT-A time-to-complete and Stroop-neutral time-to-complete. Memory scores were computed from the CERAD word list (combined delayed recall, recognition, and figure delayed recall). Executive function scores were computed from TMT-B time-to-complete and Stroop-incongruent time-to-complete. P300 amplitude and latency were evaluated after spatial filtering with LDA. Alpha amplitude change and latency were evaluated after spatial filtering with CSP (see Methods/Spatial filtering). Beta values were estimated with linear regression having age as a covariate variable. Sample size for this analysis is 1549. ˙p-value <0.1, * p-value <0.05, ** p-value <0.01, *** p-value <0.001. Note that the alpha amplitude change direction is such that a lower negative value would correspond to a higher decrease. (B). A spatial pattern corresponding to the LDA spatial filter that was applied to obtain high signal-to-noise P300. (C). A spatial pattern corresponding to the CSP filter that was applied to obtain alpha oscillations.
Figure 8
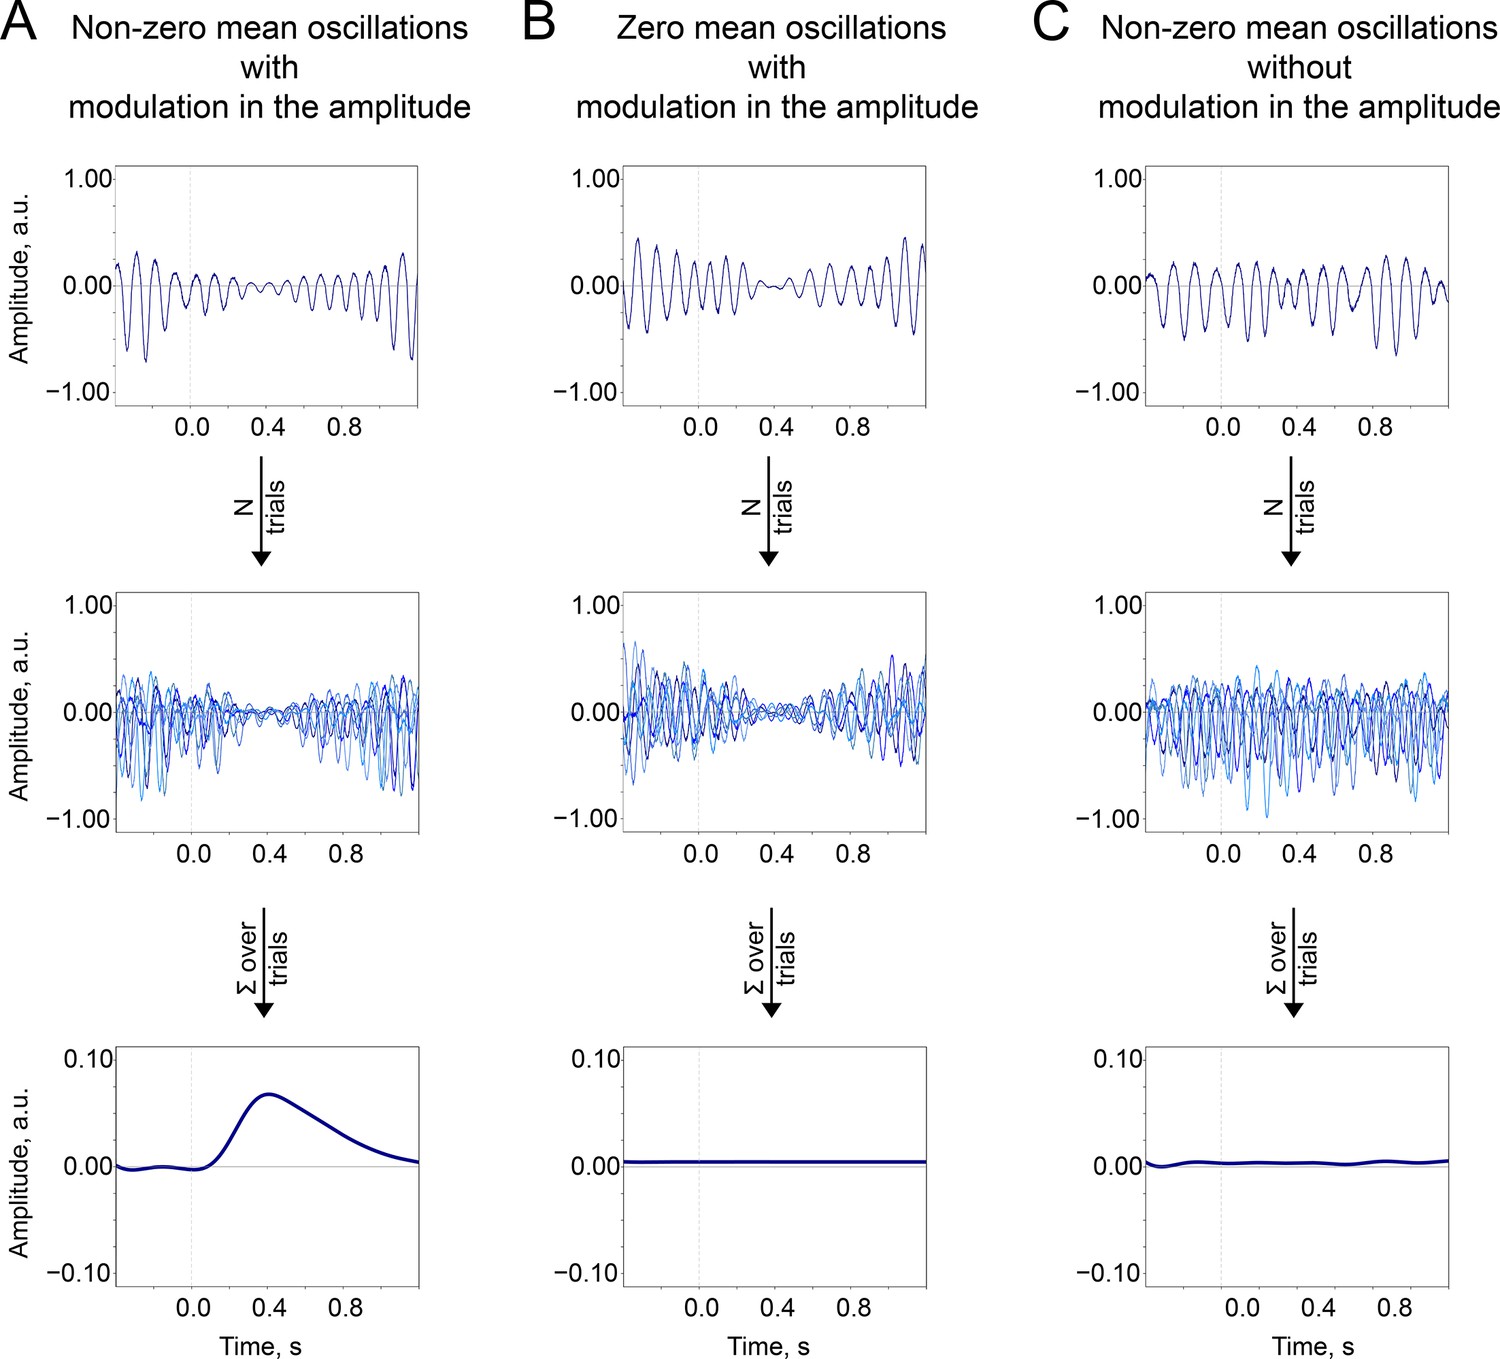
The baseline-shift mechanism (BSM) summary.
Two important prerequisites of the BSM—non-zero mean and amplitude modulation —should occur together so the ER would be generated. (A). Non-zero mean oscillations when modulated in amplitude generate an ER. (B). If oscillations have a zero mean, then no ER is generated. (C). If oscillations have a non-zero mean but do not systematically (trial-by-trial) experience modulation, then no ER is generated.
Author response image 1

The difference in the strength of alpha amplitude modulation correlates with the difference in P300 amplitude.
A. The alpha rhythm amplitude was binned according to the percentage of change. The bins were the following: (66, –25), (–25, –37), (–37, –47), (–47, –58), (–58,–89) % change. A is identical to Figure 3A, main text. B. The alpha rhythm amplitude is multiplied by –1 and evened within the prestimulus window. This may be an approximation for baseline shifts in the low-frequency signal. C. P300 responses are sorted into the corresponding bins. The C is identical to Figure 3B, main text. D. P300 are obtained without applying a baseline correction and are sorted into the corresponding bins. The difference in peak amplitude of P300 remains visible and significant. E. P300 is baselined at 400–600 ms. As a consequence, there are significant differences in the prestimulus window.
Videos
Video 1
The demonstration of the baseline-shift mechanism for negative and positive non-zero mean oscillations that experience a stimulus-triggered increase or decrease in the amplitude.
Tables
Key resources table
| Reagent type (species) or resource | Designation | Source or reference | Identifiers | Additional information |
|---|---|---|---|---|
| Software, algorithm | MNE-Python | Gramfort et al., 2013 | ||
| Software, algorithm | Python autoreject | Jas et al., 2016; Jas et al., 2017 | ||
| Software, algorithm | Python scipy | Jones et al., 2001 | ||
| Software, algorithm | Python sklearn.discriminant_analysis | Pedregosa et al., 2011 | ||
| Software, algorithm | R lme4 | Bates et al., 2015 | ||
| Software, algorithm | R mediation | Tingley et al., 2014 |
Appendix 1—table 1
Overview of the previous findings concerning stimulus-related alpha amplitude decrease in an oddball paradigm and similar experiments.
The search for this short review was completed via Google Scholar on 21-09-2021 using keywords: “evoked response”, “erp”, “erf”, “erd”, “ers”, and on 03-10-2021 using keywords: “P300”, “erd”, “ers”, “eeg”, “meg”. We picked only research or review papers written in the English language.
| Reference | Experimental paradigm | P300 localisation | P300 latency | Alpha amplitude localization | Alpha amplitude latency |
|---|---|---|---|---|---|
| Kolev et al., 2001 | passive auditory oddball task | Pz | 300–500ms | Pz | 300–800ms |
| Yordanova et al., 2001 | active and passive auditory oddball task | Fz, Cz, Pz | average 347ms | Fz, Cz, Pz | average 680ms |
| Kamarajan et al., 2004 | Go-Nogo task | Pz | 400–800ms | no alpha | - |
| Kamarajan et al., 2006 | Go-Nogo task | Cz | 300–600ms | Cz | 300–1000ms |
| Cooper et al., 2008 | passive auditory oddball task | Cz | 280–450ms | all over the cortex | 150–650ms |
| Digiacomo et al., 2008 | visual stimuli, validly and invalidly cued | Fz, FCz, Cz, Pz | 300–500ms | Fz, FCz, Cz, Pz, P3, O2 | 300–800ms |
| Ishii et al., 2009 | auditory oddball task | central, non-dipolar pattern (MEG) | 300–400ms | increase in the amplitude over prefrontal cortex (bilateral superior frontal gyrus), decrease in amplitude over sensorimotor cortex (bilateral postcentral gyrus) | 200–600ms |
| Krämer et al., 2011 | Eriksen flanker task | Fz, Cz, Pz | 300–700ms | C3, C4 | 200–800ms |
| Peng et al., 2012 | auditory oddball task paired with somatosensory stimuli | Pz | 300–800ms | parietal region | 300–600ms |
| Barutchu et al., 2013 | audiovisual discrimination task | Oz, O1, O2 | 250–500ms | O1, O2 | 200–800ms |
| Chen et al., 2013 | hand mental rotation task | Cz, Pz | 300–600ms | CP3 | 300–600ms |
| Deiber et al., 2013 | visual attention network test | Pz | 300–600ms | P3, P4, Pz | 300–2000ms |
| Kayser et al., 2014 | auditory novelty oddball task | Pz | 250–700ms | CP2 | 400–800ms |
| Shou and Ding, 2015 | Stroop-task-switching paradigm | Pz | 300–500ms | Pz | 300–500ms |
| Zarka et al., 2014 | video stimuli with animation | O1, O2, P3, P4 | 250–500ms | O1, O2, P3, P4 | starts at 300ms |
| Deiber et al., 2015 | 2-back working memory task | Cz, Pz | 400–1000ms | O2 | 400–800ms |
| Dong et al., 2015 | Modified Digit Span task | Pz | 300–800ms | parietal region (P3, Pz, P4) | 350–1100ms |
| Tang et al., 2015 | color-word flanker task | centro-parietal region | 300–600ms | ccipito-parietal region | 300–600ms |
| Wu et al., 2015 | Stroop-task-switching paradigm | parieto-central region | 300–800ms | fronto-central region | 300–1000ms |
| Tamura et al., 2016 | auditory presentation of subject׳s own name and other names | midline | 300–700ms | C4 | 200–600ms |
| Fabi and Leuthold, 2017 | categorization of pictures with painful and non-painful stimuli | Pz | 400–800ms | sensorimotor cortex | 300–1000ms |
| Lee et al., 2017 | affective images presentation | posterior region | 300–400ms | posterior region | 100–500ms |
| Leroy et al., 2017 | visual task involving presentation of 2D and 3D images | O2 | 300–600ms | O2 | 100–500ms |
| López-Caneda et al., 2017 | Go-Nogo task | Fz, Cz, Pz | 300–700ms | Pz | 400–600ms |
| Vilà-Balló et al., 2017 | auditory novelty oddball task | Pz | 300–800ms | Pz | 300–800ms |
| Delval et al., 2018 | visual stimuli following gate initiation | Pz | 400–700ms | Cz | no change in the amplitude |
| Fabi and Leuthold, 2018 | categorization of pictures with painful and non-painful stimuli | Pz | 400–700ms | FC1, FC2, C1, C2, C3, C4, CP1, CP2 | 300–1000ms |
| Michelini et al., 2018 | four-choice reaction time task | Pz | 300–500ms | parieto-occipital region | 300–1000ms |
| Liu et al., 2019 | arithmetic problem-solving | O1 | 200–700ms | PO4, PO8 | 200–800ms |
| Martel et al., 2019 | Go-Nogo task | centro-parietal region | 268–388ms | all channels | 200–600ms |
| Román-López et al., 2019 | delayed-match to sample task | midline | 300–700ms | midline | 200–1000ms |
| Faro et al., 2019 | Stroop colour-word test | precuneus | 250–400ms | precuneus | 200–1000ms |
| Espenhahn et al., 2020 | video viewing while passive tactile stimulation | somatosensory cortex | 270–340 ms | somatosensory cortex | 200–400ms |
| Kao et al., 2020 | n-back working memory task | Cz, CPz, Pz | 300–800ms | Fz, FCz | 200–900ms |
| Yu et al., 2020 | hand mental rotation task | Pz | 300–600ms | Pz | 200–600ms |
| Zhang et al., 2020 | change detection paradigm | ccipital region | 300–600ms | ccipital region | 300–700ms |
| Nikolin et al., 2021 | n-back working memory task with target stimuli and distractor cues | Fz | 300–500ms | Fz | 300–700ms |
| Paolicelli et al., 2021 | auditory oddball task | Pz | 280.07–342.67ms | parietal midline | 200–800ms |
Additional files
Download links
A two-part list of links to download the article, or parts of the article, in various formats.
Downloads (link to download the article as PDF)
Open citations (links to open the citations from this article in various online reference manager services)
Cite this article (links to download the citations from this article in formats compatible with various reference manager tools)
Event-related modulation of alpha rhythm explains the auditory P300-evoked response in EEG
eLife 12:RP88367.
https://doi.org/10.7554/eLife.88367.3


