Comprehensive analysis of nasal IgA antibodies induced by intranasal administration of the SARS-CoV-2 spike protein
- Laboratory of Molecular and Cellular Biology, Graduate School of Science and Engineering for Education, University of Toyama, Japan
- Department of Virology, Toyama Institute of Health, Japan
- Department of Microbiology, Toyama University Graduate School of Medicine and Pharmaceutical Sciences, Japan
- Center for Advanced Antibody Drug Development, University of Toyama, Japan
- Laboratory of Molecular and Cellular Biology, Graduate School of Innovative Life Science, University of Toyama, Japan
Figures
Figure 1 with 1 supplement

Isolation of antigen-specific IgA+ plasma cells from mice that were intranasally immunized with SpikeWuhan.
(A) Mice were inoculated intranasally with 10 μg of SpikeWuhan and 1 μg of cholera toxin as an adjuvant in 10 μl of phosphate-buffered saline (PBS), delivering the fluid dropwise into the nostril a total of three times at 3-week intervals. Nasal lavage fluid and serum were collected from the mice 1 week after the last immunization, and antibody responses were evaluated using enzyme-linked immunosorbent assay (ELISA) (n=5) (∗∗∗p<0.001) . The antibody titers are expressed as optical density (OD450) value per total protein in nasal lavage fluids or serum. (B) Fluorescence-activated cell sorting (FACS) gating strategy for the isolation of S1-specific plasma cells from mice. Plots represent the sequential gating strategy. Lymphocytes (R1 gate) were stained with anti-CD138 and ER-Tracker to enrich plasma cells (CD138+ ER-TrackerHigh fraction, R2 gate). IgA+ plasma cells gated in R3 were selected from the R2-gated plasma cell fraction by staining with anti-IgA antibody. The antigen-specific plasma cells gated in R4 were further selected from the R3-gated Ig A+ plasma cell fraction by staining with S1 domain of Wuhan severe acute respiratory syndrome coronavirus 2 (SARS-CoV-2) spike protein (S1). The numbers indicate the percentages of cells in the gated area. A total of 100,000 events were recorded. Representative data from the No. 1 mouse are shown.
Figure 1—figure supplement 1
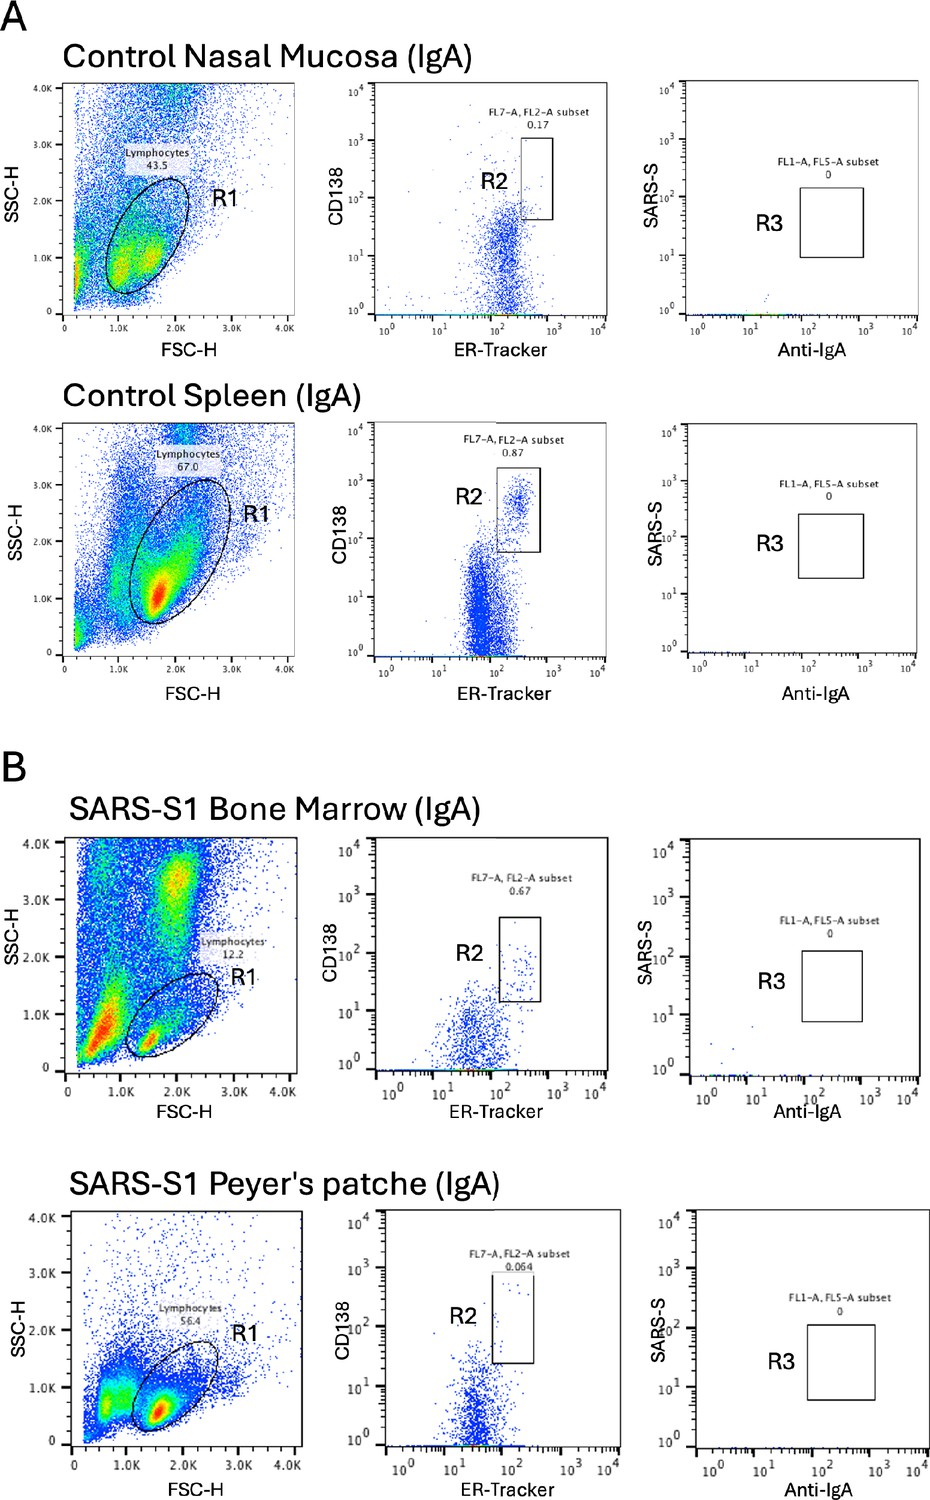
Isolation of antigen-specific IgA+ plasma cells from mice that were intranasally immunized with SpikeWuhan.
(A) The plots illustrate the sequential gating strategy used to identify SRS-S1-specific IgA-positive plasma cells in a control mouse’s nasal mucosa and spleen. (B) The plots depict the sequential gating strategy for isolating SRS-S1-specific IgA-positive plasma cells in the immunized mouse’s bone marrow and Peyer’s patches.
Figure 2 with 1 supplement
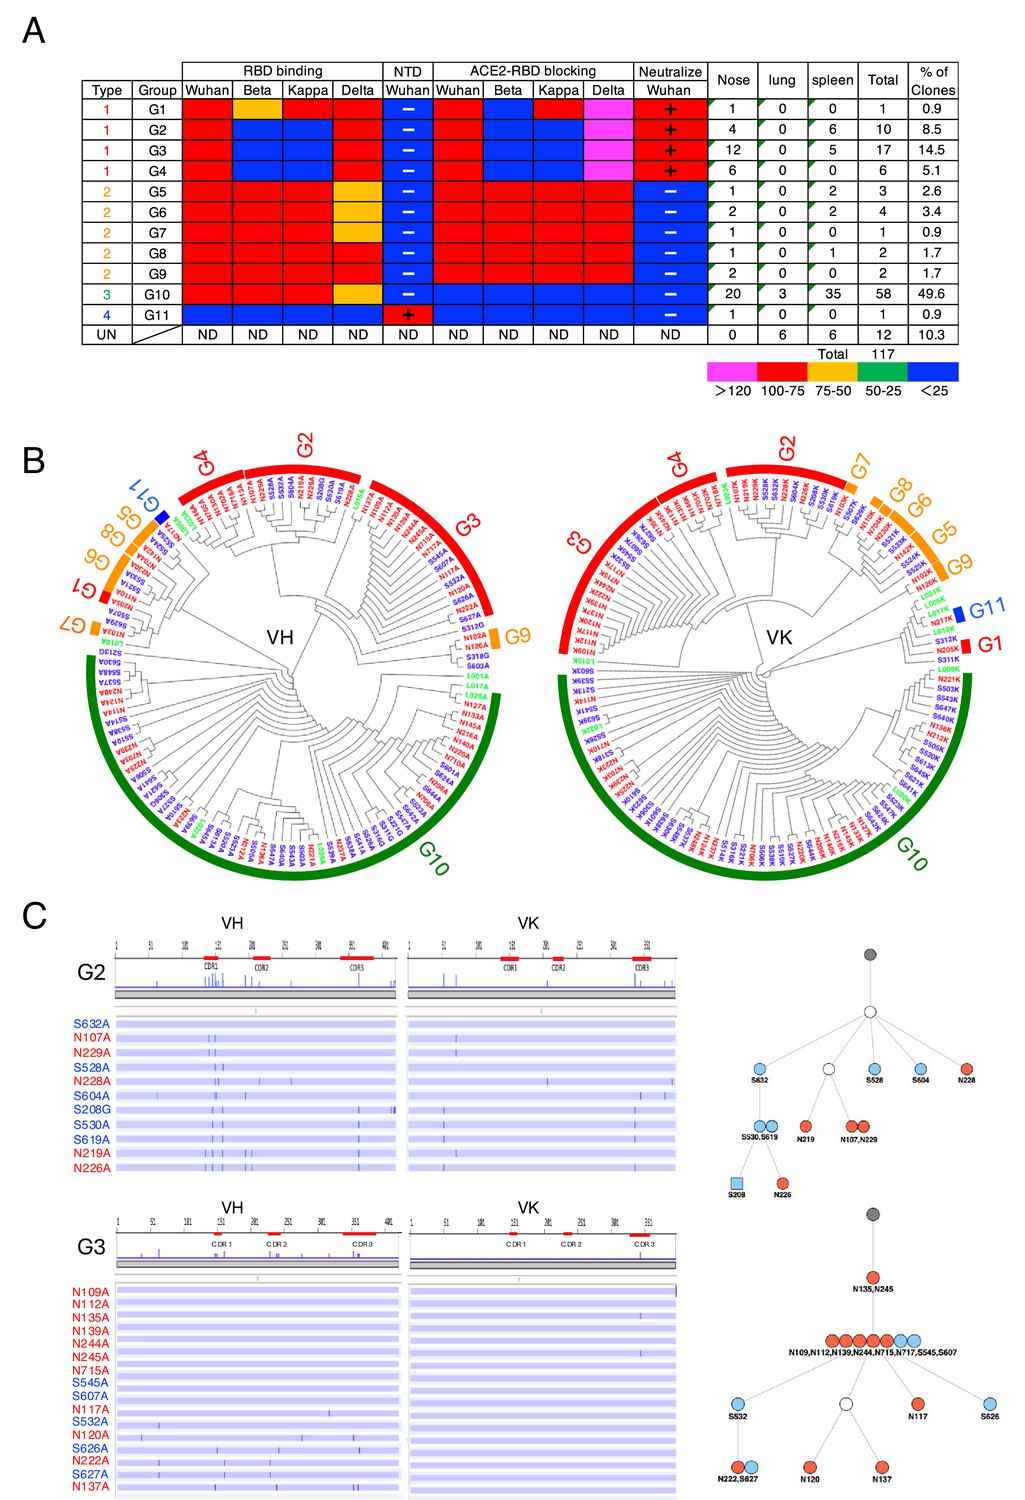
Intranasal immunization induces functionally diverse antibodies in the nasal mucosa and spleen.
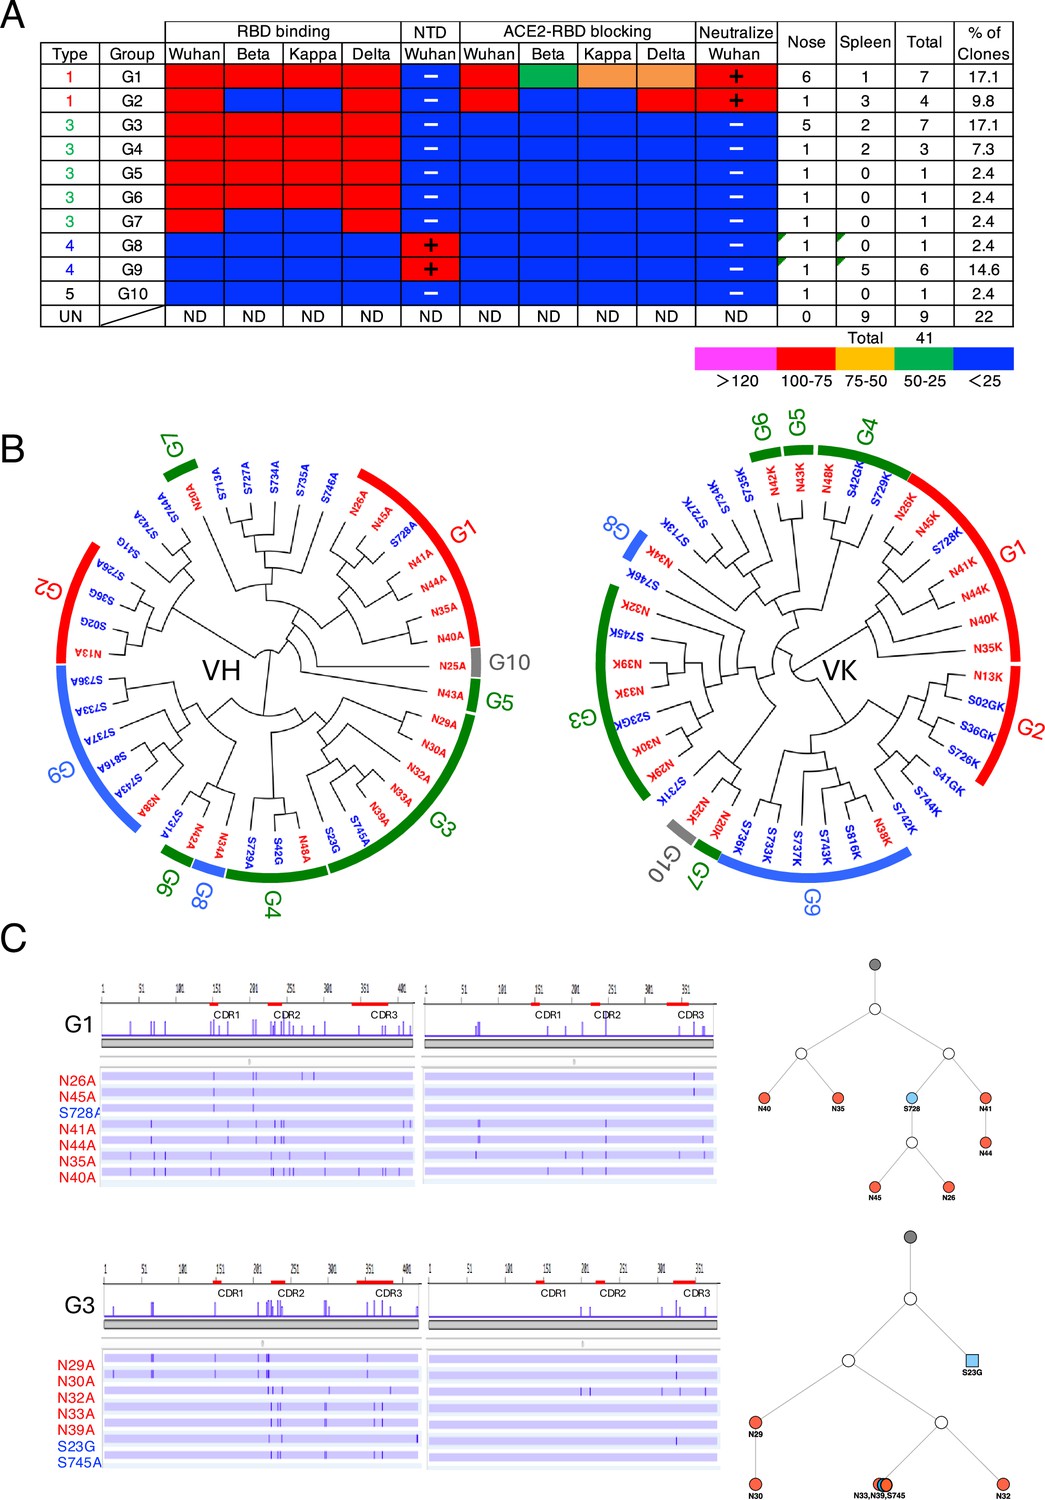
(A) Characterization of S1-specific monoclonal antibodies obtained from No. 1 mouse. The heatmap represents the relative intensity of antibody binding to receptor binding domains (RBDs) and blocking of the RBD-angiotensin-converting enzyme-2 (ACE2) interaction. Blue (0–25%), green (25–50%), orange (50–75%), and red (>75%). N-terminal domain (NTD) binding was considered positive (+) when the OD at 405 nm was >0.3 after the background was subtracted. Neutralizing activity was considered positive (+) when the antibody suppressed Wuhan pseudotyped virus infection by 50%. The figure reports values from a single experiment. UN, antibody type not determined. ND, antibody activity not determined. (B) Maximum-likelihood phylogenetic tree of the VH and VL chains of the S1-specific antibodies. Different colored fonts indicate antibodies obtained from the nose (red), spleen (blue), and lung (green). Bands on the outer ring indicate antibody groups. The color of the ring indicates antibody types: Type 1 (red), Type 2 (orange), Type 3 (green), Type 4 (blue), and Type 5 (gray). The antibody group is defined as clones using the same V-(D)-J usage and having an overall sequence identity of at least 95% from the signal peptide to framework 4 (FR4). The prefixes N, S, and L in the antibody clone numbers refer to antibodies derived from the nose, spleen, and lung, respectively. The suffixes A, G, and K in the antibody clone numbers refer to alpha, gamma, and kappa chains, respectively. (C) Nucleotide sequence alignment of VH and VL genes in the G2 and G3 antibodies from No. 1 mouse. The VH and VL sequences from the beginning of the signal peptide through the end of FR4 are shown as horizontal lines. Nucleotide changes relative to S632A and N109A are depicted as vertical bars across the horizontal lines. Different colored fonts indicate antibodies derived from the nose (red) and spleen (blue). Antibody phylogenetic trees based on VH/VK paired sequences are depicted. Gray circles represent the hypothetical germline configuration. White circles represent hypothetical ancestors. Colors indicate nasal (red) and splenic (blue) antibodies. Circles and squares indicate IgA and IgG, respectively.
Figure 2—figure supplement 1
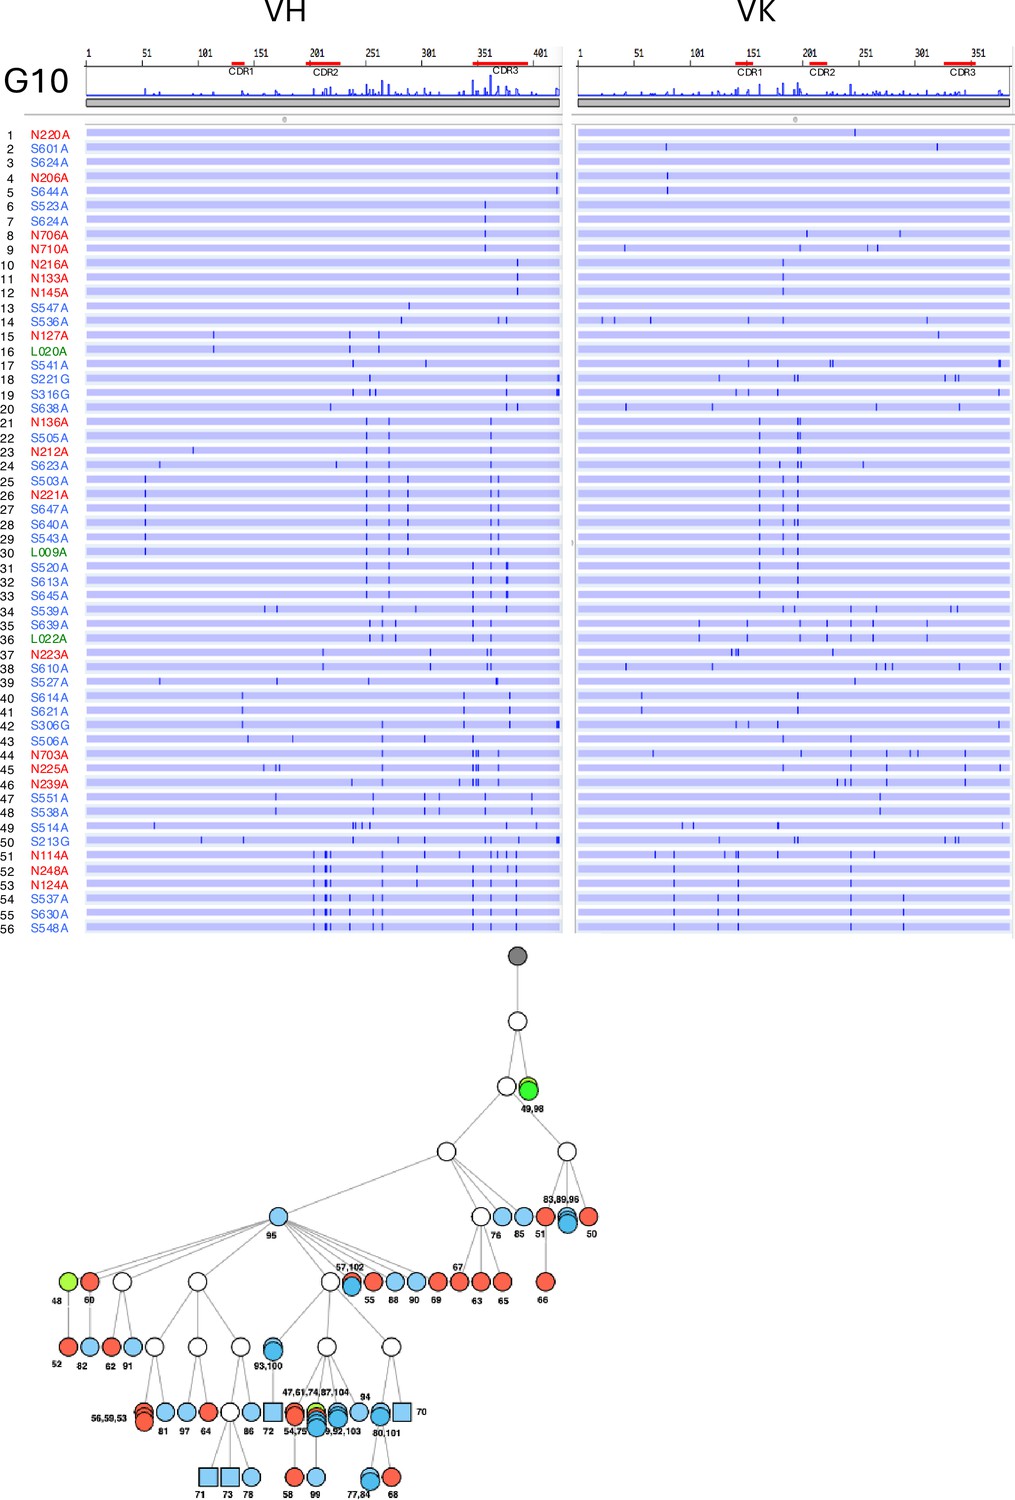
Nucleotide sequence alignment of VH and VL genes in the G10 antibodies from No. 1 mouse.
The VH and VL sequences from the beginning of the signal peptide through the end of FR4 are shown as horizontal lines. Nucleotide changes relative to N220A are depicted as vertical bars across the horizontal lines. Different colored fonts indicate antibodies derived from the nose (red) and spleen (blue). Antibody phylogenetic trees based on VH/VK paired sequences are depicted. Gray circles represent the hypothetical germline configuration. White circles represent hypothetical ancestors. Colors indicate nasal (red), splenic (blue), and lung (green) antibodies. Circles and squares indicate IgA and IgG, respectively. The antibodies in the G1-G4 clusters were categorized as Type 1. The G1 antibody appeared only once. This clone displayed potent binding to the Wuhan, Kappa, and Delta RBD, and moderately to the Beta RBD. It also blocked ACE2 binding to all RBDs except the Beta RBD. The antibodies in G2-4 clusters bound to Wuhan and Delta RBD but not Beta and Kappa RBD. They were able to block ACE2 binding to the RBD of Wuhan and Delta but not to the RBD of Beta and Kappa. The antibodies in G5-G9 clusters were categorized as Type 2, bound to all four RBD variants, and uniformly blocked ACE2 binding to the RBDs of all four strains. G10 antibodies were classified as Type 3, accounting for 38% of the nasal IgA repertoire. They bound to the RBDs of all four strains but did not prevent ACE2 binding to the RBDs of any of the strains. The G11 antibody, classified as Type 4, was an anti-NTD antibody that did not prevent ACE2 binding to the RBDs of any strains.
Figure 3 with 2 supplements
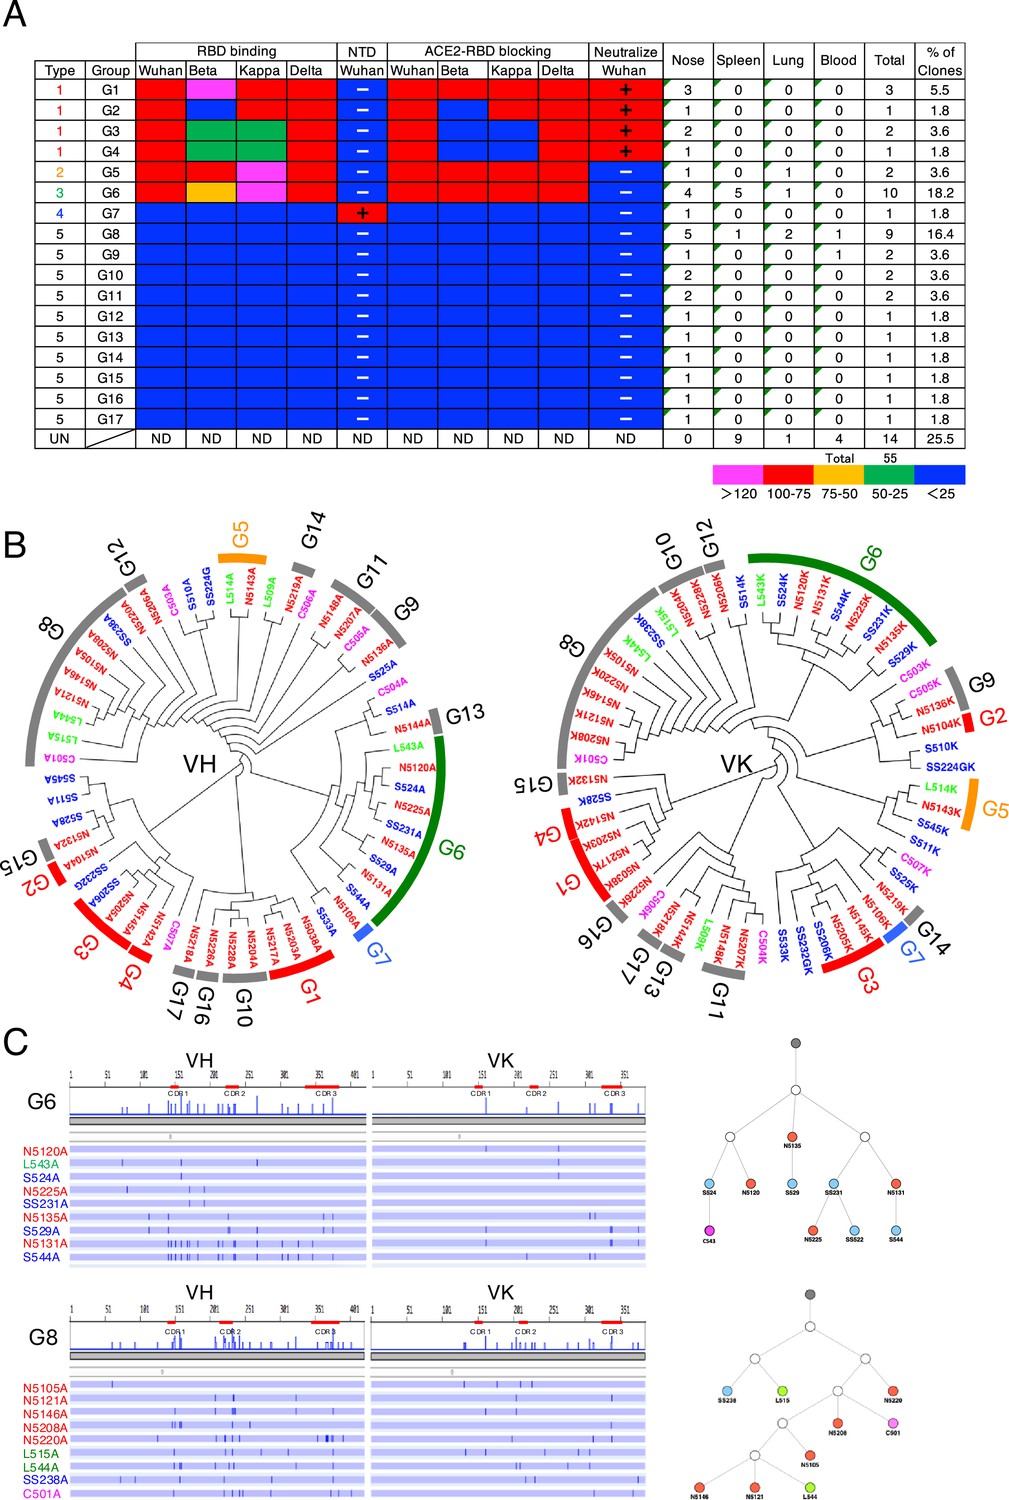
Characterization of S1-specific monoclonal antibodies obtained from No. 2 mouse.
(A) A total of 51 S1-reactive antibodies were analyzed for their properties as in Figure 2A. UN, antibody type not determined. ND, antibody activity not determined. (B) Maximum-likelihood phylogenetic tree of the VH and VL chains of the S1-specific antibodies. Different colored fonts indicate antibodies obtained from the nose (red), spleen (blue), lung (green), and blood (magenta). Bands on the outer ring indicate antibody groups. The color of the band indicates antibody types: Type 1 (red), Type 2 (orange), Type 3 (green), Type 4 (blue), and Type 5 (gray). The prefixes N, S, and L in the antibody clone numbers refer to antibodies derived from the nose, spleen, and lung, respectively. The suffixes A, G, and K in the antibody clone numbers refer to alpha, gamma, and kappa chains, respectively. (C) Nucleotide sequence alignment of VH and VL genes in the G6 and G8 antibodies from No. 2 mouse. The nucleotide changes relative to N5120A and N5105A are depicted as vertical bars across the horizontal lines. Different colored fonts indicate antibodies derived from the nose (red), spleen (blue), lung (green), and blood (magenta). Antibody phylogenetic trees based on VH/VK paired sequences are depicted. Gray circles represent the hypothetical germline configuration. White circles represent hypothetical ancestors. Colors indicate nasal (red), splenic (blue), lung (green), and blood (magenta) antibodies.
Figure 3—figure supplement 1
Characterization of S1-specific monoclonal antibodies obtained from No. 3 mouse.
(A) A total of 41 S1-reactive antibodies were analyzed for their properties. UN, antibody type not determined. ND, antibody activity not determined. (B) Maximum-likelihood phylogenetic tree of the VH and VL chains of the S1-specific antibodies. Different colored fonts indicate antibodies obtained from the nose (red) and spleen (blue). Bands on the outer ring indicate antibody groups. The color of the band indicates antibody types: Type 1 (red), Type 2 (orange), Type 3 (green), Type 4 (blue), and Type 5 (gray). The prefixes N and S in the antibody clone numbers refer to antibodies derived from the nose and spleen, respectively. The suffixes A, G, and K in the antibody clone numbers refer to alpha, gamma, and kappa chains, respectively. (C) Nucleotide sequence alignment of VH and VL genes in the G1 and G3 antibodies from No. 3 mouse. The nucleotide changes relative to N26A and N29A are depicted as vertical bars across the horizontal lines. Different colored fonts indicate antibodies derived from the nose (red) and spleen (blue). Antibody phylogenetic trees based on VH/VK paired sequences are depicted. Gray circles represent the hypothetical germline configuration. White circles represent hypothetical ancestors. Colors indicate nasal (red) and splenic (blue) antibodies.
Figure 3—figure supplement 2
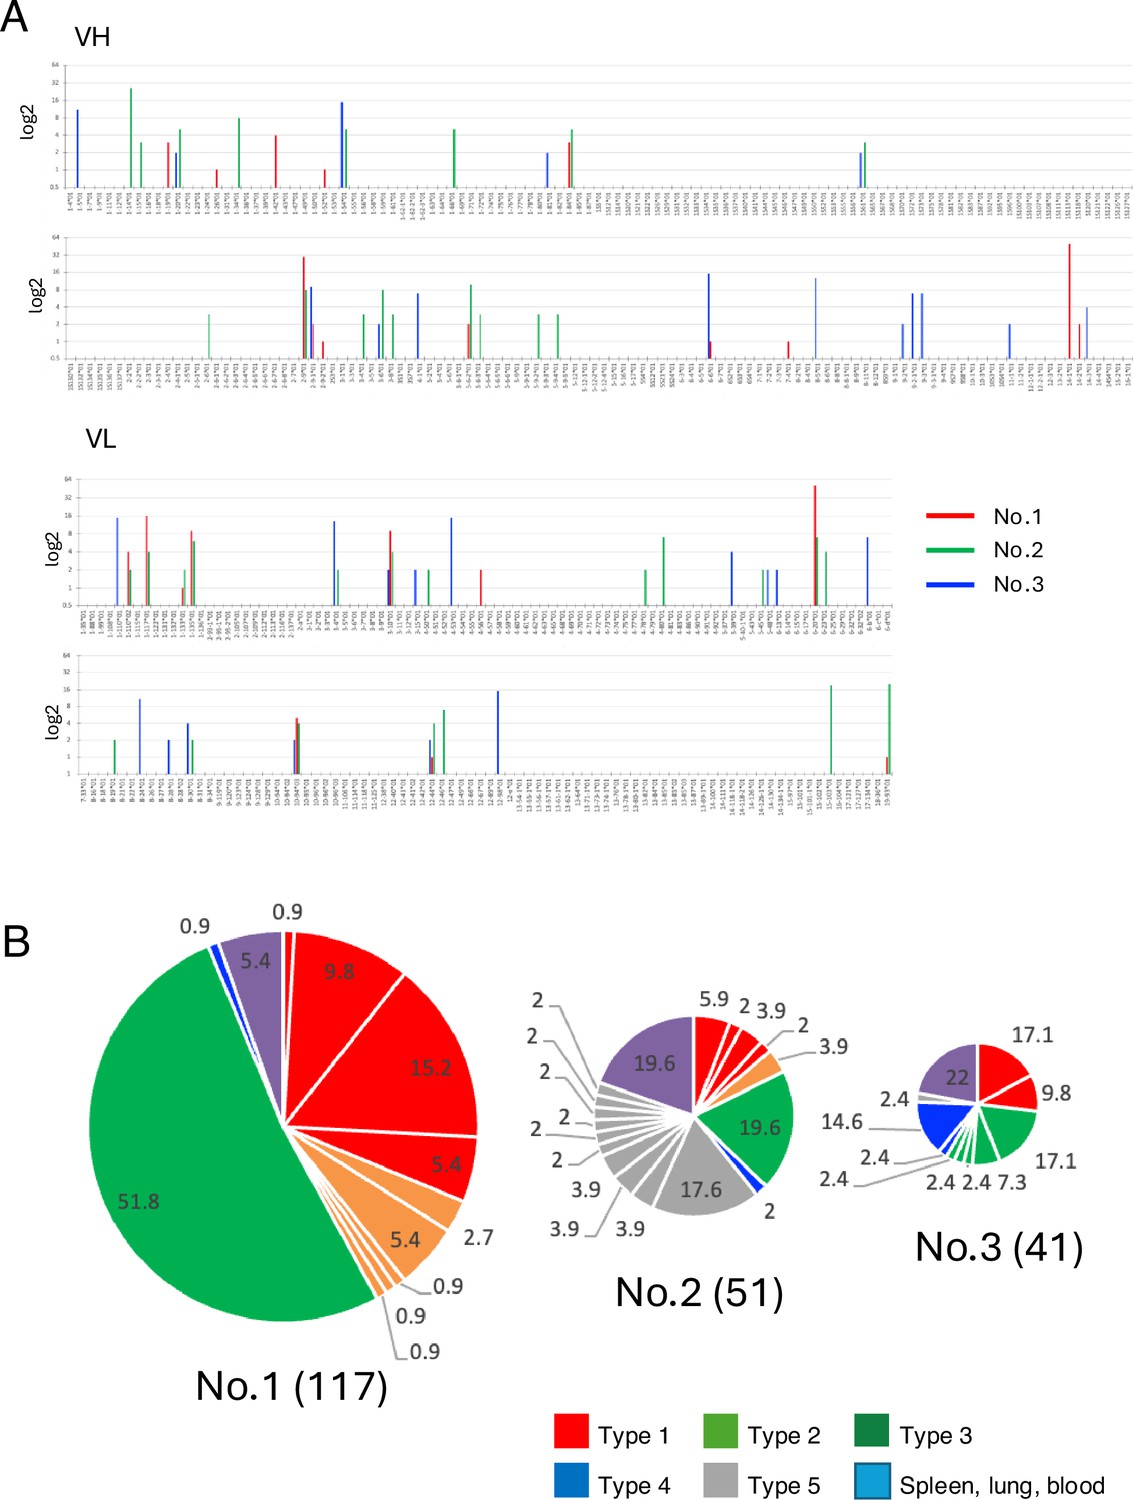
Analysis of the VH and VL repertoires of the three mice.
(A) V genes are plotted numerically, with heights indicating the expression rate between VH or VL clusters. (B) Pie charts show the distribution of mAb obtained from three immunized mice. The number inside each circle denotes the number of mAb of each type. The pie size is proportional to the number of antibody clones. Pie charts show the distribution of mAb obtained from three immunized mice. The number inside each circle denotes the number of mAb of each type. The pie size is proportional to the number of antibody clones obtained from each mouse.
Figure 4
Comparison of reactivity between monomeric and multimeric immunoglobulin As (IgAs).
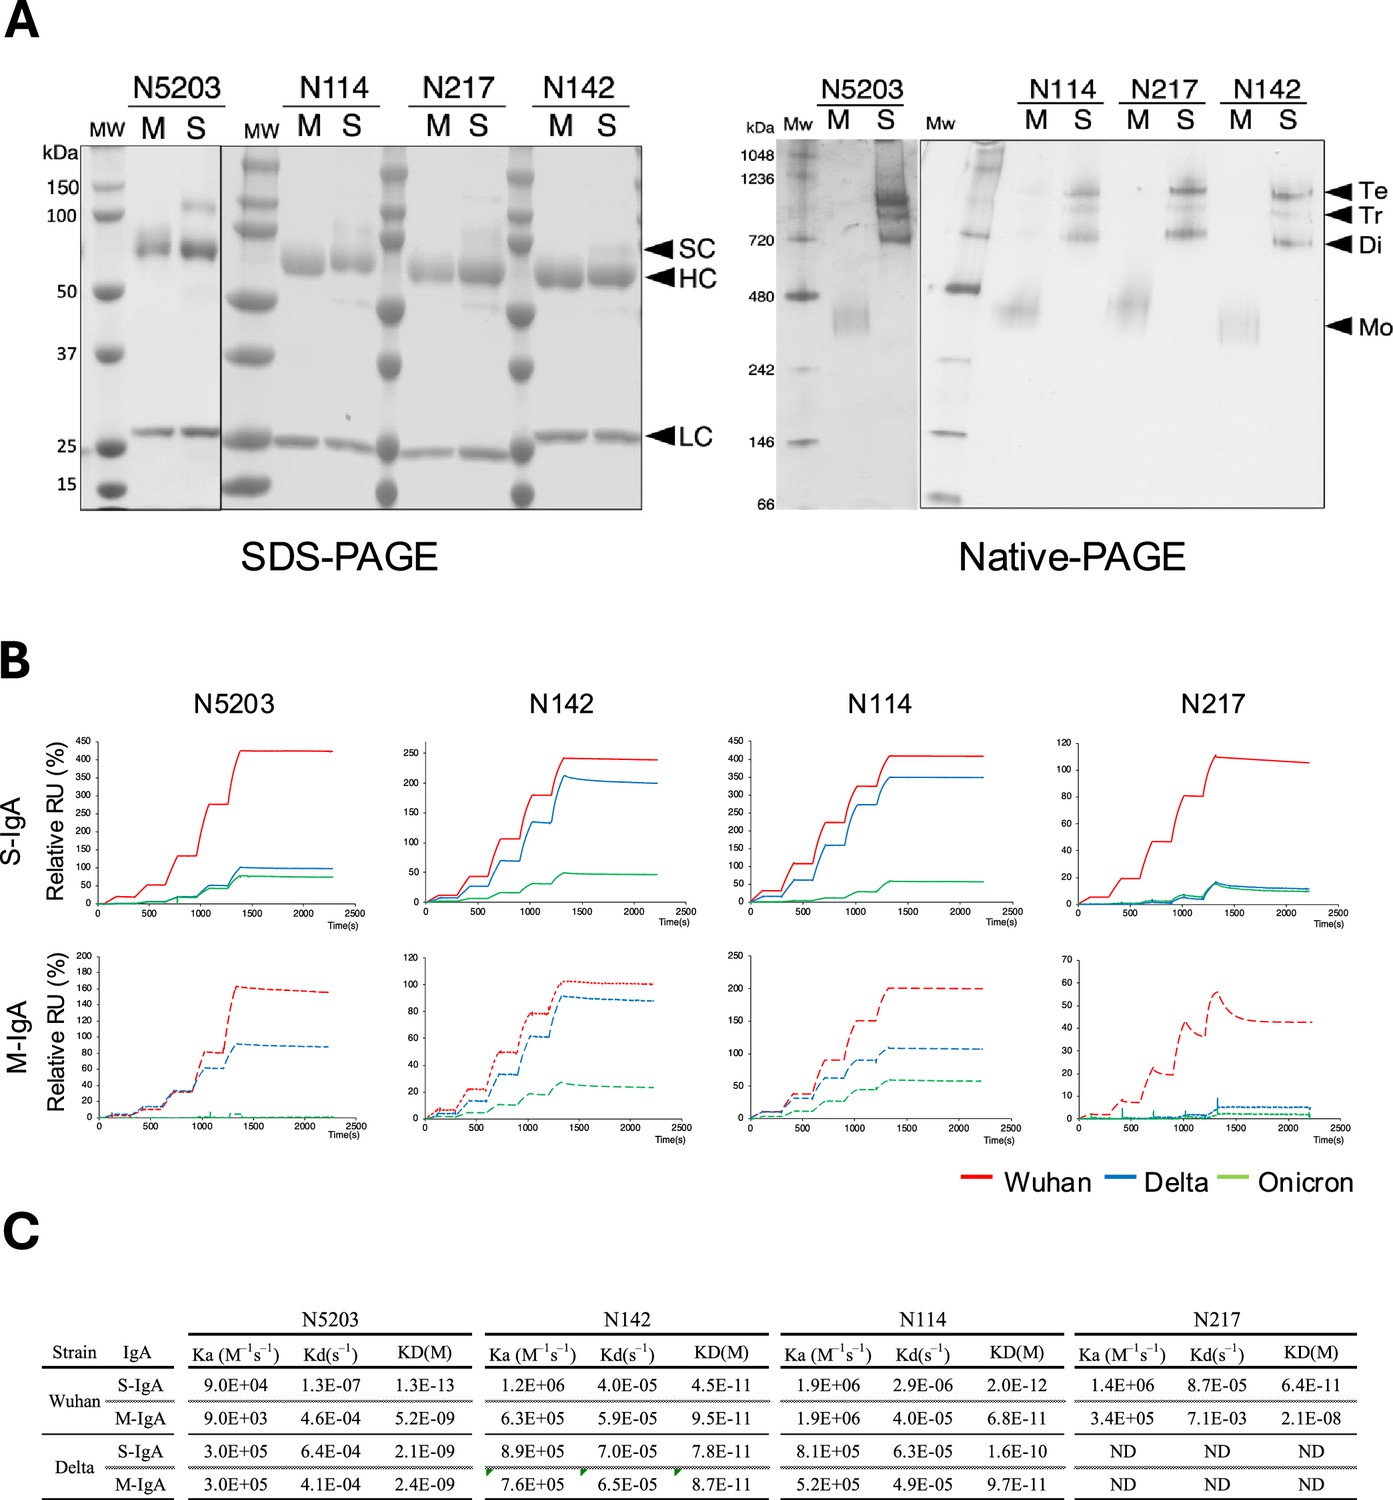
(A) Production of recombinant monomeric IgAs (M-IgAs) and secretory IgAs (S-IgAs). Recombinant M-IgA and S-IgA purified from the culture supernatant of CHO cells were subjected to SDS-PAGE and Blue native-PAGE analysis. Bands corresponding to a monomer (M), dimer (Di), trimer (Ti), and tetramer (Te) are shown. H, α heavy chain; L, light chain; J, J-chain; SC, secretory component; M, M-IgA; S, S-IgA. (B) Binding dynamics of M-IgAs and S-IgAs to Wuhan, Delta, or Omicron spike protein by surface plasmon resonance (SPR). The S-IgAs used are a mixture of dimers, trimers, and tetramers. The observed values reflect the average affinity of the S-IgAs. The curves shown are representative of two or three determinations. RU, resonance units. Representative data from two independent experiments are shown. (C) The table shows the association (ka) (M–1s–1), dissociation (kd) (s–1) rate constants and apparent equilibrium dissociation constants (KD) expressed as the mean of two or three determinations (lower panel).
-
Figure 4—source data 1
Raw uncropped native and SDS-PAGE data showing the Recombinant M-IgAs and S-IgAs.
- https://cdn.elifesciences.org/articles/88387/elife-88387-fig4-data1-v1.zip
-
Figure 4—source data 2
Recombinant M-IgA and S-IgA raw native and SDS-PAGE data were labeled with their associated bands prior to sectioning.
- https://cdn.elifesciences.org/articles/88387/elife-88387-fig4-data2-v1.zip
Figure 5
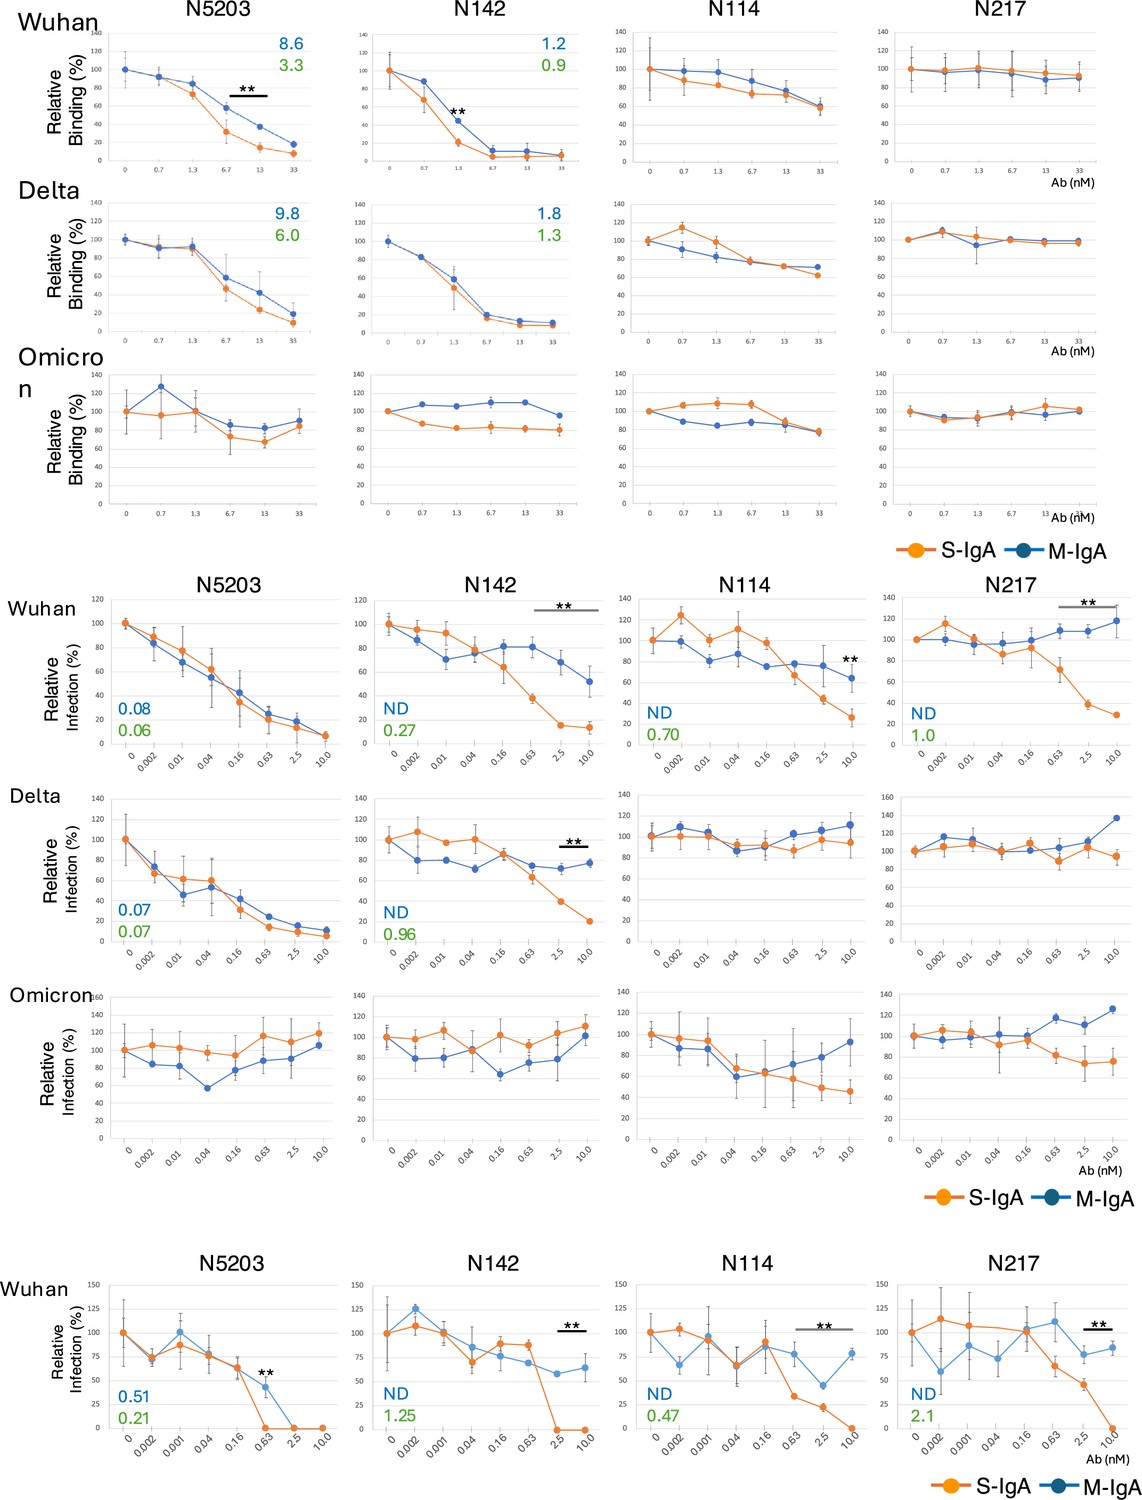
Multimerization facilitates the neutralization activity of non-neutralizing monomeric immunoglobulin As (M-IgAs).
(A) Graphs of the competitive enzyme-linked immunosorbent assay (ELISA) results showing the binding of biotinylated angiotensin-converting enzyme-2 (ACE2) to the immobilized Wuhan, Delta, or Omicron receptor binding domain (RBD) in the presence of antibodies. The results are expressed as the mean ± SD of three technical replicates. The figure reports values from a single experiment. The IC50 values of the indicated antibodies that inhibit the RBD-ACE2 interaction are shown in the diagrams. (B) Comparison of neutralization activity between M-IgA and secretory IgA (S-IgA) against severe acute respiratory syndrome coronavirus 2 (SARS-CoV-2) pseudotyped viruses. Neutralization curves of the indicated antibody against pseudotyped viruses bearing spike proteins of Wuhan, Delta, or Omicron are shown. Pseudotyped viruses preincubated with antibodies at the indicated concentrations were used to infect VeroE6 cells, and luciferase activities in cell lysates were measured at 20 hr post-transduction to calculate infection (%) relative to nonantibody-treated controls. The results are expressed as the mean ± SD of three technical replicates. The NT50 values of the indicated antibodies are shown in the diagrams. Antibodies that did not reach >70% inhibition at the highest concentration tested were listed as data not determined (ND). (C) Comparison of neutralization potential between M-IgA and S-IgA against authentic SARS-CoV-2 BA.1. The neutralizing potential of the antibody was determined using a reverse transcription polymerase chain reaction (RT-PCR)-based SARS-CoV-2 neutralization assay. VeroE6 cells preincubated with authentic SARS-CoV-2 BA.1 virus were incubated with the indicated antibodies at various concentrations. The virus in the cell culture medium was measured at 48 hr post-transduction to calculate infection (%) relative to non-antibody-treated controls. The results are expressed as the mean ± SD of three technical replicates. The NT50 values of the indicated antibodies are shown in the diagrams. Antibodies that did not reach >50% inhibition at the highest concentration tested are listed as ND. **p<0.01.
Figure 6
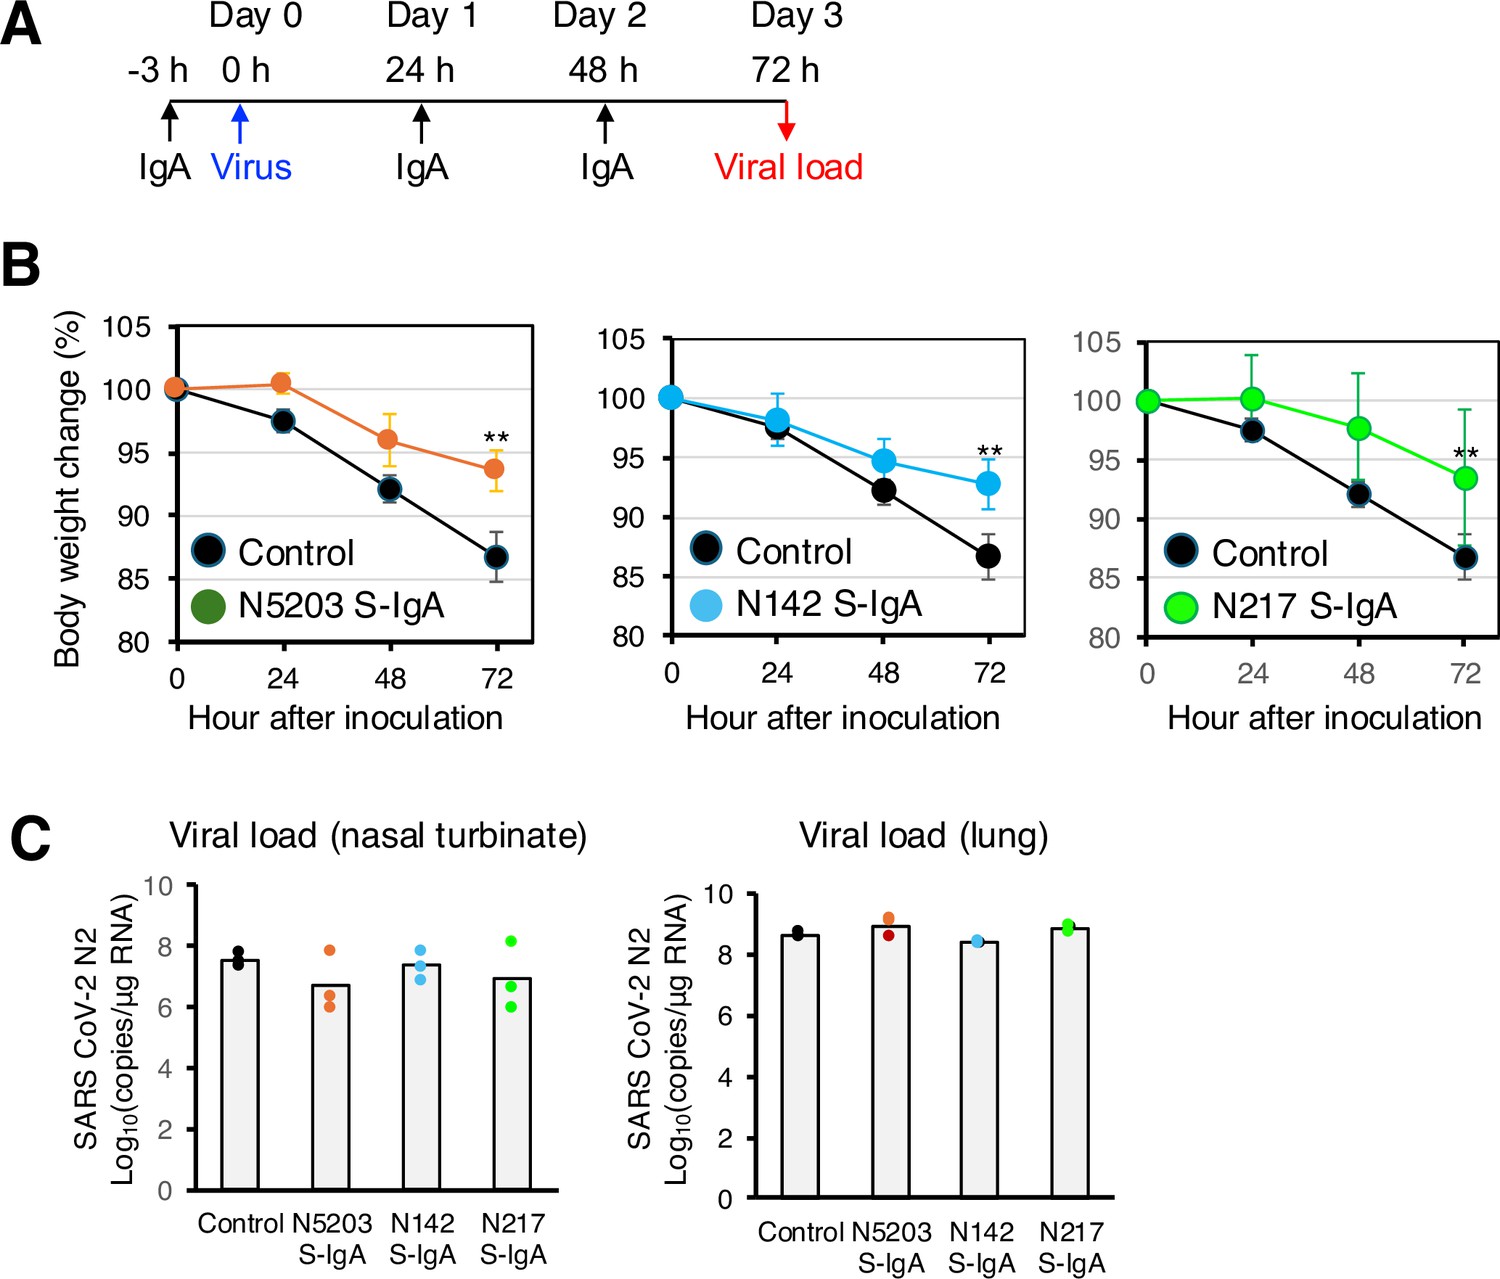
Intranasal administration of secretory immunoglobulin A (S-IgA) suppresses severe acute respiratory syndrome coronavirus 2 (SARS-CoV-2) infection in Syrian hamsters.
(A) Experimental schedule. Three groups of hamsters received a single intranasal dose of 1.0 mg/kg of S-IgA 3 hr before infection (–3) for pre-exposure prophylaxis and at 24 hr (24) and 48 hr post-infection for early treatment, respectively. Control hamsters (n=3) received phosphate-buffered saline (PBS) at the same dose. The figure reports values from a single experiment. On day 0, each hamster was intranasally challenged with the Wuhan SARS-CoV-2 virus (6×10⁵ median tissue culture infectious dose). (B) Hamster body weights were recorded hourly (0, 24, 48, and 72 hr), and weight loss was defined as the percentage loss from 0 hr. Data represent the mean value ± SD at the indicated time points (n = 3) at the indicated time points and were analyzed using a Kruskal-Wallis one-way ANOVA (∗p<0.05 and ∗∗p<0.01) . (C) Animals were euthanized 72 hr post-infection, and RNA was extracted from the nasal turbinates and lungs. The SARS-CoV-2 viral load was analyzed using quantitative reverse transcription polymerase chain reaction (qRT-PCR) targeting the SARS-CoV-2 nucleoprotein. Assays were normalized relative to total RNA levels. Data represent the mean value (n = 3) analyzed in one experiment.
Figure 7
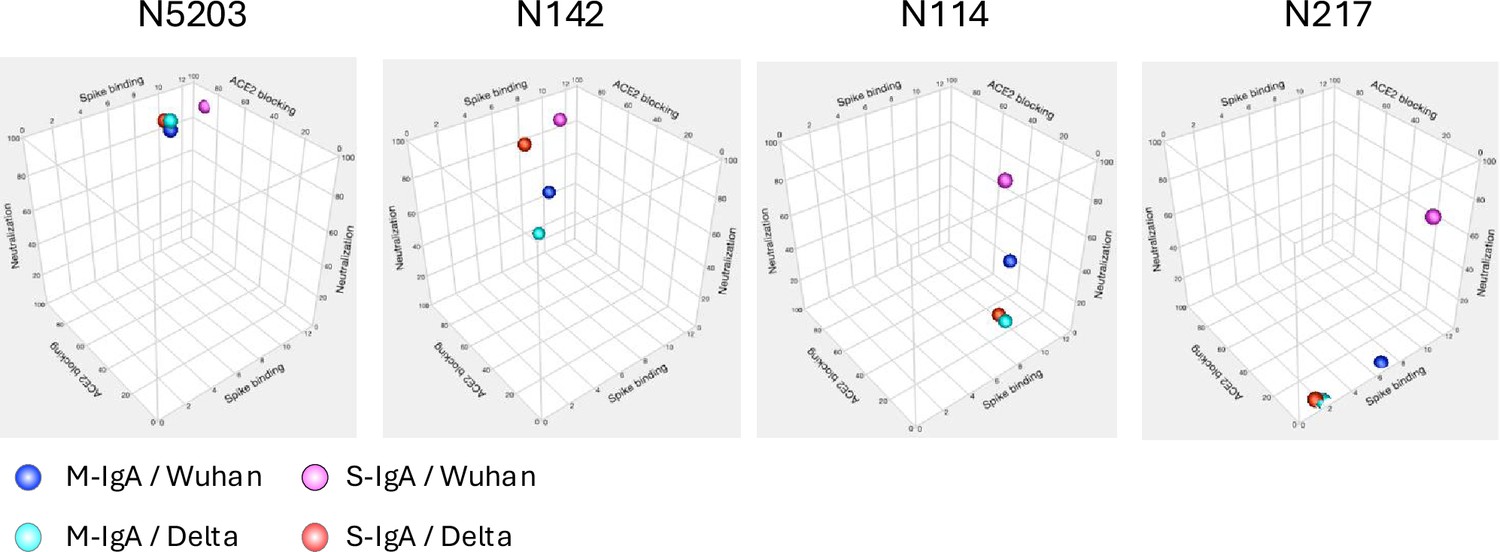
The affinity, angiotensin-converting enzyme-2 (ACE2) inhibitory activity, and the in vitro neutralizing activity of the indicated antibodies are illustrated in a 3D scatter plot.
Tables
Key resources table
| Reagent type (species) or resource | Designation | Source or reference | Identifiers | Additional information |
|---|---|---|---|---|
| Gene (Mus musculus) | IgHa | NCBI | AK136471 | |
| Gene (Homo sapiens) | IGHA2 | NCBI | AL389978 | |
| Gene (H. sapiens) | JCHAIN | NCBI | NM_144646 | |
| Gene (H. sapiens) | PIGR | NCBI | NM_002644.4 | |
| Strain, strain background (M. musculus) | ICR | SLC | SLC:ICR | Six-week-old female |
| Strain, strain background (M. musculus) | Syrian hamster | SLC | SLC:Syrian | Six-week-old female |
| Cell line (H. sapiens) | VeroE6/TMPRSS2 | JCRB, RRID:CVCL_YQ49 | JCRB1819 | Infection |
| Cell line (Cricetulus griseus) | CHO-S | Thermo Fisher, RRID:CVCL_5J31 | A29127 | Antibody expression |
| Biological sample (virus) | SARS-CoV-2 virus | NIID | 2019-nCoV/Japan/TY/WK-521/2020 | Wuhan |
| Antibody | DyLight488-labeled goat anti-mouse IgA alpha chain | Abcam | ab97011 | 1:250 |
| Antibody | Rat anti-mouse CD138 | BioLegend, RRID:AB_10915989 | 142503 | 1:250 |
| Antibody | DyLight488-labeled goat anti-mouse IgG H&L | Abcam | ab96871 | 1:250 |
| Recombinant protein | Biotinylated SARS-CoV-2 S1 protein NTD, His, Avitag | Acro Biosystems | S1D-C52E2 | Wuhan |
| Recombinant protein | SARS-CoV-2 (COVID-19) S protein RBD, His Tag | Acro Biosystems | SPD-C52H3 | Wuhan |
| Recombinant protein | SARS-CoV-2 S protein RBD (K417N, E484K, N501Y), His Tag | Acro Biosystems | SPD-C52Hp | B.1.351/Beta Variant |
| Recombinant protein | SARS-CoV-2 Spike RBD (L452R, E484Q), His Tag | Acro Biosystems | SPD-C52Hv | B.1.617.1 (Kappa) |
| Recombinant protein | SARS-CoV-2 (COVID-19) S protein RBD (L452R, T478K), His Tag | Acro Biosystems | SPD-C52Hh | B.1.617.2/Delta |
| Recombinant protein | Biotinylated Human ACE2 | Sino Biological | 10108-H08H-B | |
| Recombinant protein | SARS-CoV-2 S protein, His Tag, Super stable trimer | Acro Biosystems | SPN-C52H9 | Wuhan |
| Recombinant protein | Biotinylated SARS-CoV-2 S protein (D614G), His, Avitag, Super stable trimer | Acro Biosystems | SPN-C82E3 | Wuhan |
| Recombinant protein | Biotinylated SARS-CoV-2 Spike Trimer, His, Avitag (B.1.1.529/Omicron) | Acro Biosystems | SPNC82EE | B.1.1.529/Omicron |
| Recombinant protein | Biotinylated SARS-CoV-2 (COVID-19) S1 protein (D614G), His, Avitag | Acro Biosystems | S1N-C82E3 | Wuhan |
| Recombinant protein | Streptavidin Protein, DyLight 650 | Thermo Fisher | 84547 | Plasma cell isolation |
| Recombinant DNA reagent | pET-mIgA | This paper | Antibody expression plasmid | |
| Recombinant DNA reagent | pET-mIgK | This paper | Antibody expression plasmid | |
| Commercial assay or kit | THUNDERBIRD Probe One-step qRT-PCR Kit | TOYOBO | QRZ-101 | qPCR |
| Commercial assay or kit | SureBlue/TMB peroxidase substrate | Sera care | 5120-0059 | ELISA |
| Commercial assay or kit | N2 primer/probe set | Nihon Gene Research Laboratories | 283-34201 | qPCR |
| Commercial assay or kit | CHOgro High Yield Expression System | TakaraBaio/Mirus BIo | MIR 6260 | Antibody expression |
| Commercial assay or kit | Dynabeads mRNA Purification kit | Veritas | DB61006 | |
| Commercial assay or kit | NativePAGE Bis-Tris Gel System | Thermo Fisher | BN1001BOX | |
| Chemical compound, drug | ER-Tracker BlueWhite DPX | Thermo Fisher | E12353 | Plasma cell isolation |
| Chemical compound, drug | Cholera toxin | Fujifilm | 030-20621 | Adjuvant |
| Software, algorithm | GENETYX | NIHON SERVER | Antibody sequence analysis | |
| Software, algorithm | Sequencher | Gene Codes | Version 5.4.6 | Antibody sequence analysis |
| Software, algorithm | RStudio | posit | Version 2022.12.0+353 | Antibody lineage analysis |
| Software, algorithm | Alakazam | https://www.rdocumentation.org/packages/alakazam/ | Versions/1.2.1 | Antibody lineage analysis |
| Other | Peptide M Agarose | Thermo Fisher | gel-pdm-2 | IgA purification |
| Other | TiterMax adjuvants | Merck Sigma-Aldrich | 12352203 | Immunization |
| Antibody | Goat Anti-Mouse IgA alpha chain (HRP) | abcam | ab97235 | ELISA |
Additional files
-
Supplementary file 1
Nucleotide sequences of antigen-specific antibodies and their V-(D)-J usage.
Antibody sequences are organized by clone name, class, type, and group. The nucleotide sequences of the variable domains of the heavy and light chains are analyzed using IMGT/HighV-QUEST, and the best-matched IMGT reference germline alleles are provided. The somatic hypermutation (SHM) status is evaluated based on the number of mutations present in the sequences of the heavy and light chain variable domains.
- https://cdn.elifesciences.org/articles/88387/elife-88387-supp1-v1.xlsx
-
MDAR checklist
- https://cdn.elifesciences.org/articles/88387/elife-88387-mdarchecklist1-v1.docx
Download links
A two-part list of links to download the article, or parts of the article, in various formats.
Downloads (link to download the article as PDF)
Open citations (links to open the citations from this article in various online reference manager services)
Cite this article (links to download the citations from this article in formats compatible with various reference manager tools)
Comprehensive analysis of nasal IgA antibodies induced by intranasal administration of the SARS-CoV-2 spike protein
eLife 12:RP88387.
https://doi.org/10.7554/eLife.88387.3


