Evaluation of surface-based hippocampal registration using ground-truth subfield definitions
- Montreal Neurological Institute and Hospital, McGill University, Canada
- Institute of Neuroscience and Medicine INM-1, Research Centre Jülich, Germany
- C. & O. Vogt Institute for Brain Research, University Hospital Düsseldorf, Heinrich-Heine-University, Germany
- Robarts Research Institute, University of Western Ontario, Canada
Figures
Figure 1
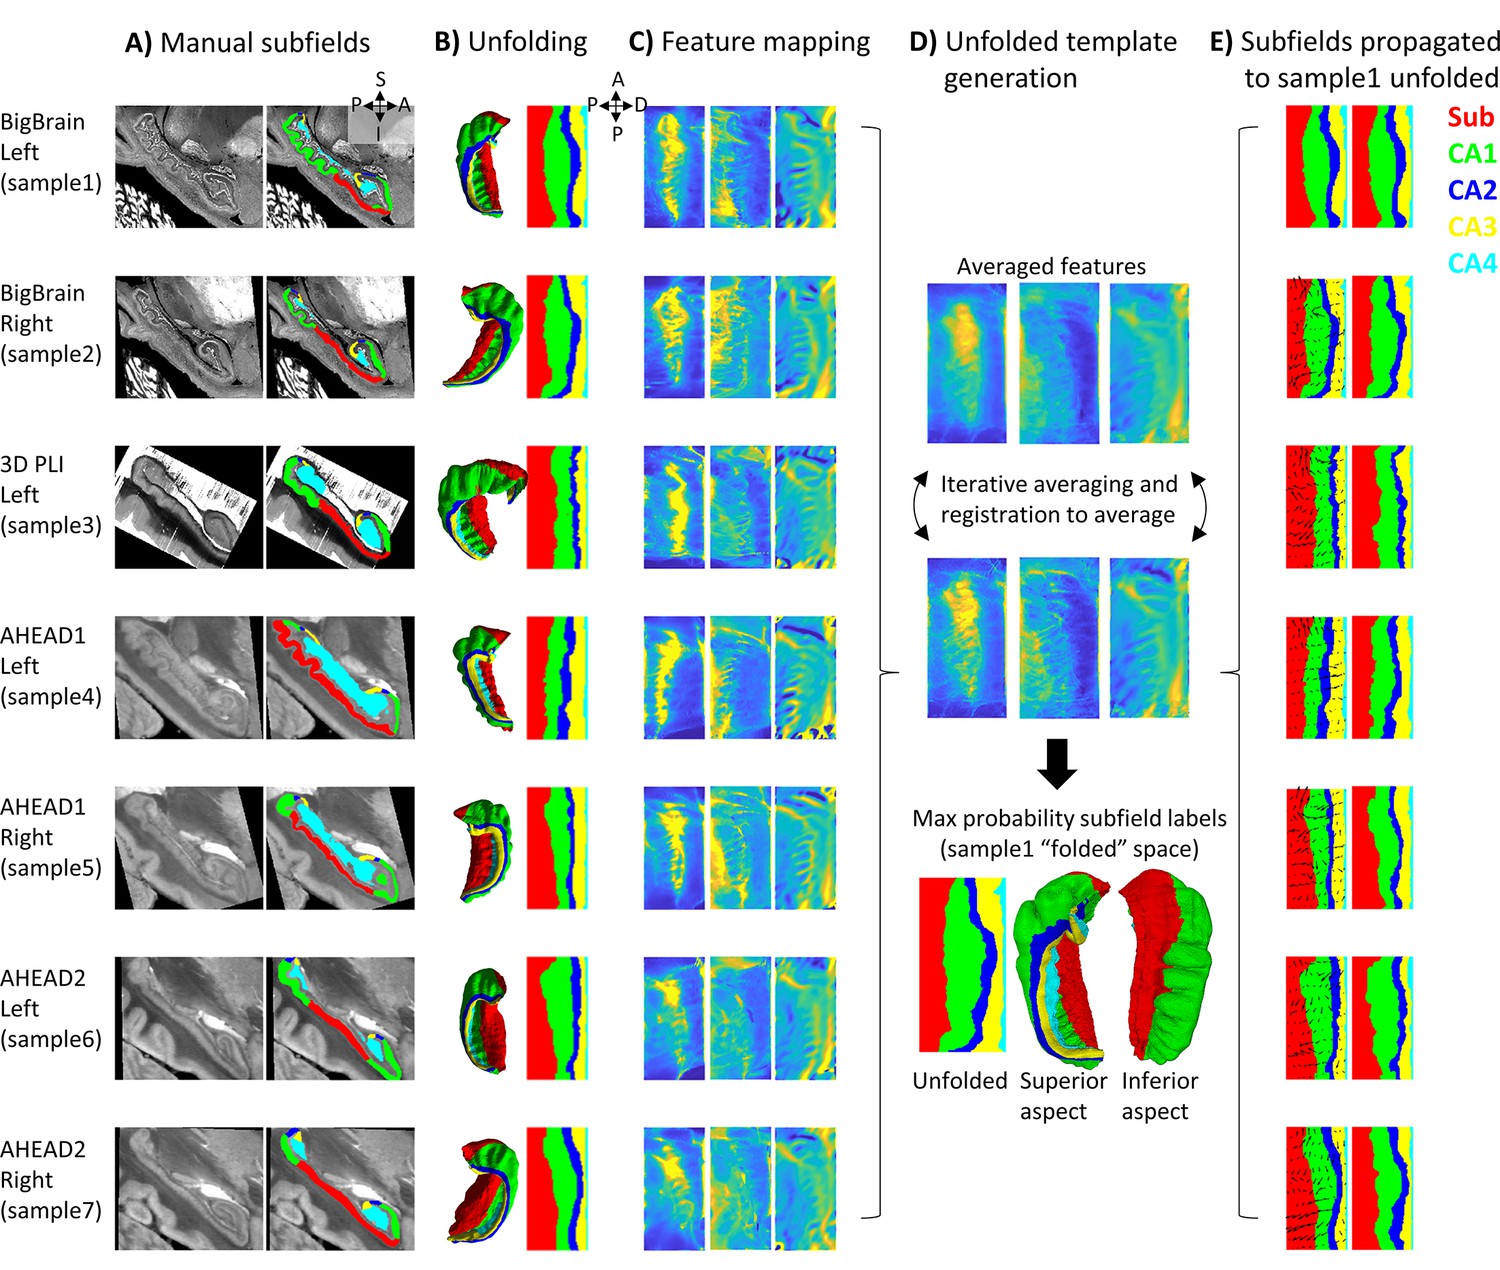
Surface-based subfield alignment pipeline.
(A) Each 3D dataset manually parcellated into subfields. (B) Subfields mapped to a common unfolded space using HippUnfold. (C) Morphometric features mapped to unfolded space (from left to right: gyrification, thickness, curvature). (D) Multimodal features iteratively aligned in unfolded space using 2D registration. (E) Subfield labels propagated through unfolded 2D registrations to sample1. Closeups of the segmentations for the individual datasets can be found in Appendix 2.
Figure 2
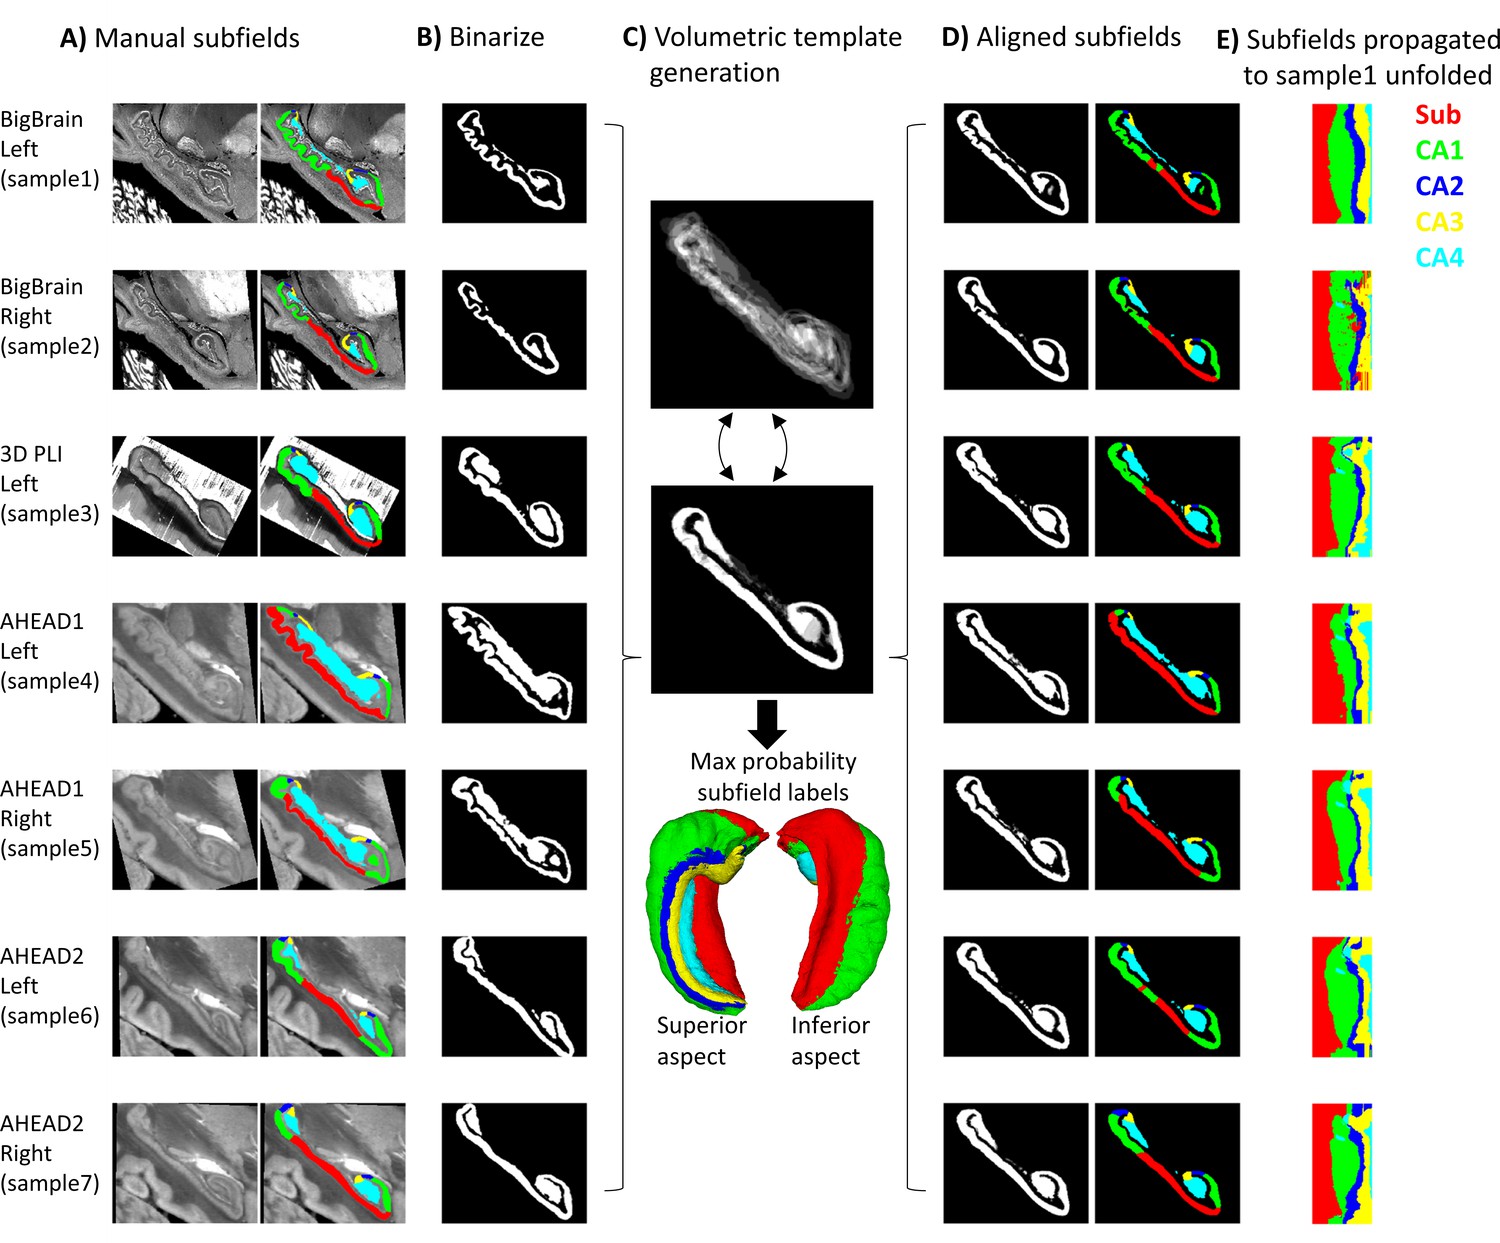
Control condition using volumetric registration.
(A) Subfield segmentation as in Figure 1A. (B) Binarized and rigidly aligned hippocampal gray matter masks (left hemispheres flipped). (C) Iterative alignment using ANTs template building in 3D. (D) Each sample’s subfields propagated to template space. (E) Each sample’s subfields propagated to sample1 unfolded space.
Figure 3
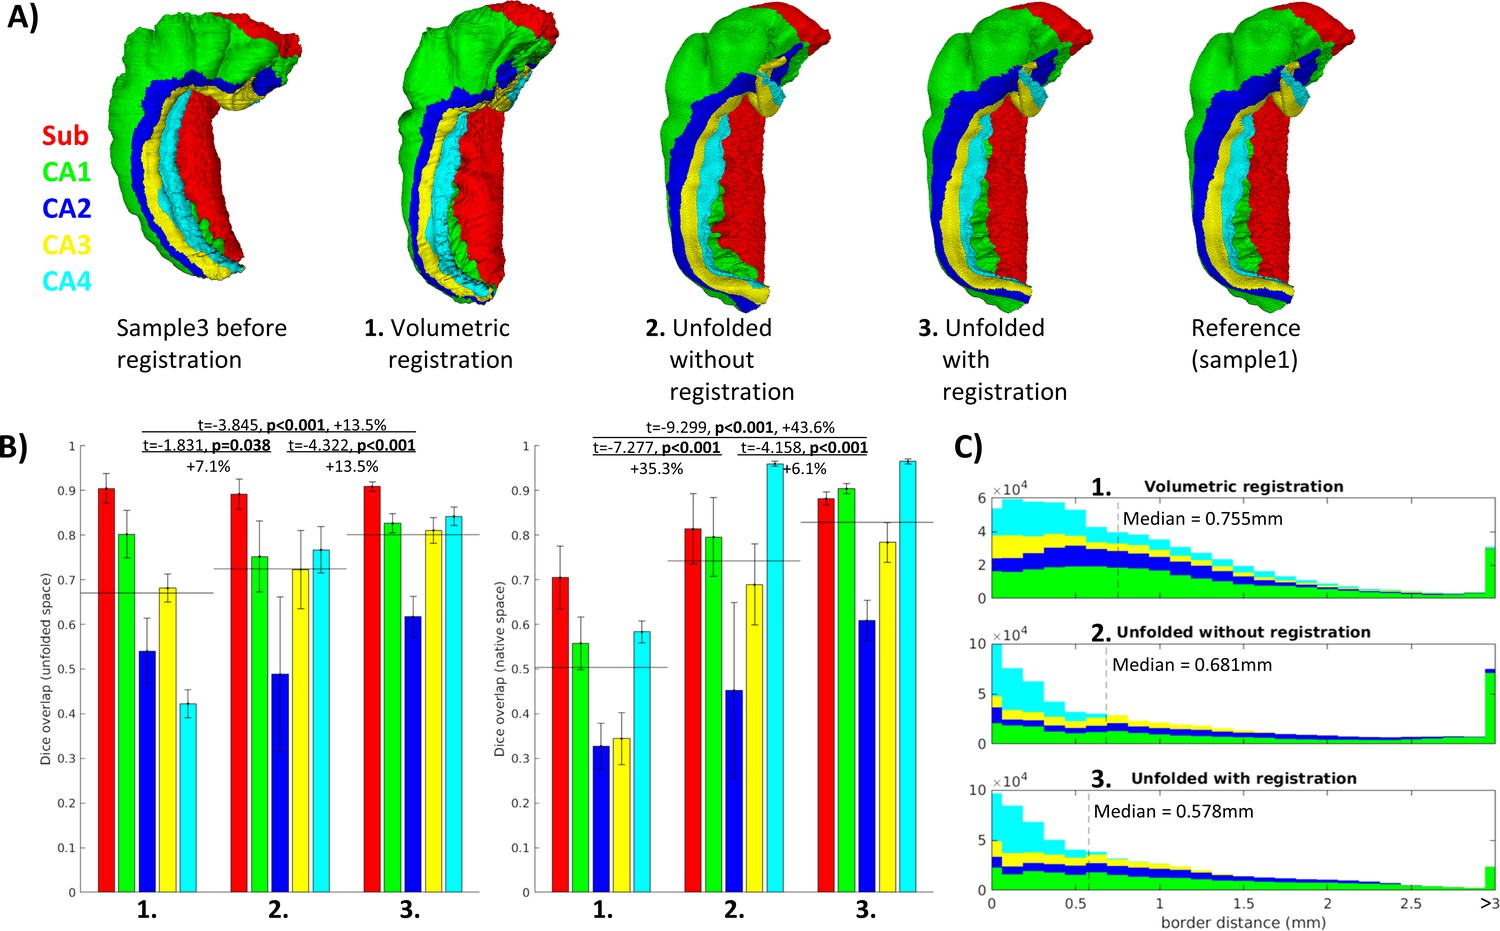
Evaluation of aligned subfield definitions.
(A) Qualitative example of subfields from the third sample projected to the first sample’s native ‘folded’ space using conventional 3D volumetric alignment, unfolding to account for inter-individual differences in folding shape, and unfolding followed by registration in unfolded space. (B) Dice overlap achieved. Each measure was calculated in unfolded space (left) and again in the first sample’s (BigBrain left hemisphere) native folded space (right). Black lines indicate the mean across all subfields. (C) Distances between all aligned subfield borders using the three methods described above. Dashed lines indicate the median distance.
Figure 4
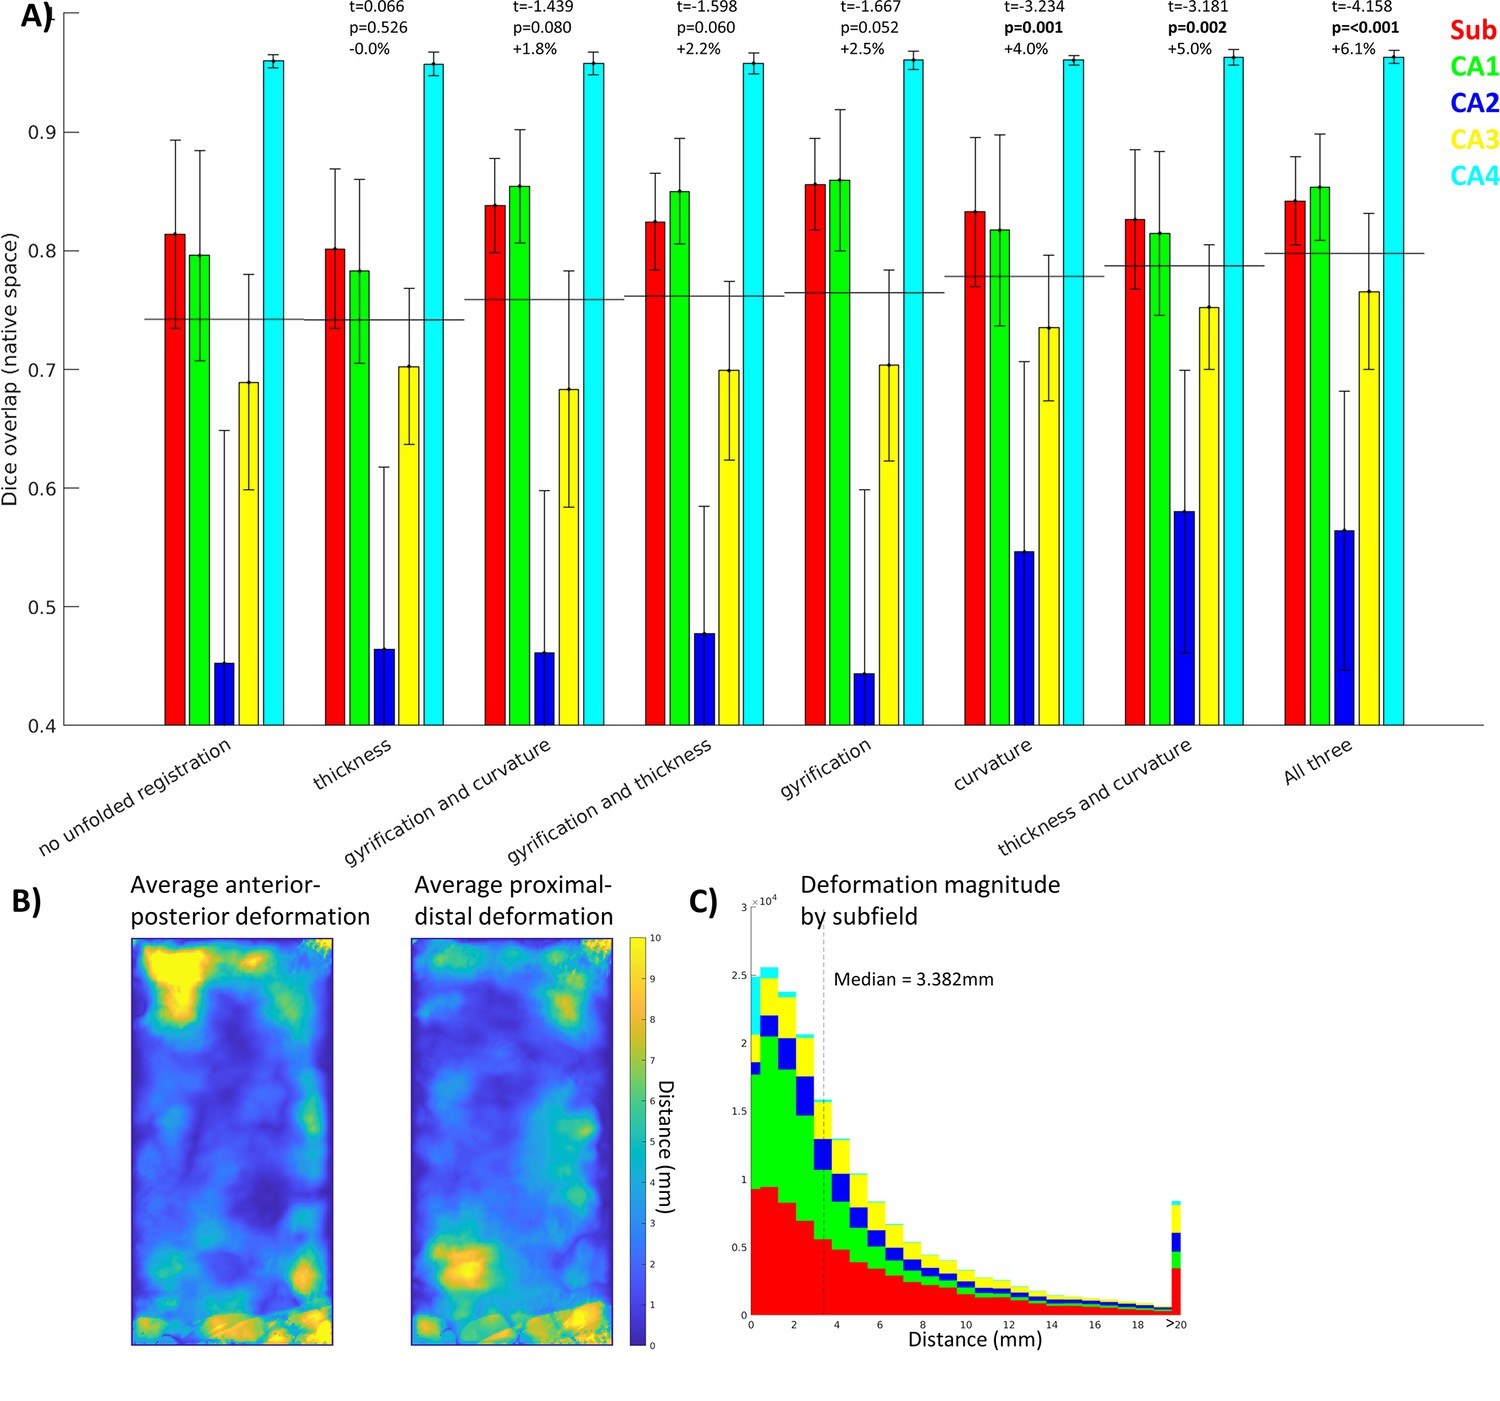
Contribution of each morphological feature to unfolded registration performance.
(A) Unfolded space registration was repeated for all combinations of unfolded morphological features and evaluated by Dice overlap in native space. Combinations are ordered by their Dice scores averaged across the five subfields. p-values are relative to no unfolded registration, using one-tailed paired-samples t-tests as above. (B, C) Evaluation of which hippocampal vertices (B) and subfields (C) were most deformed in unfolded registration.
Appendix 1—figure 1
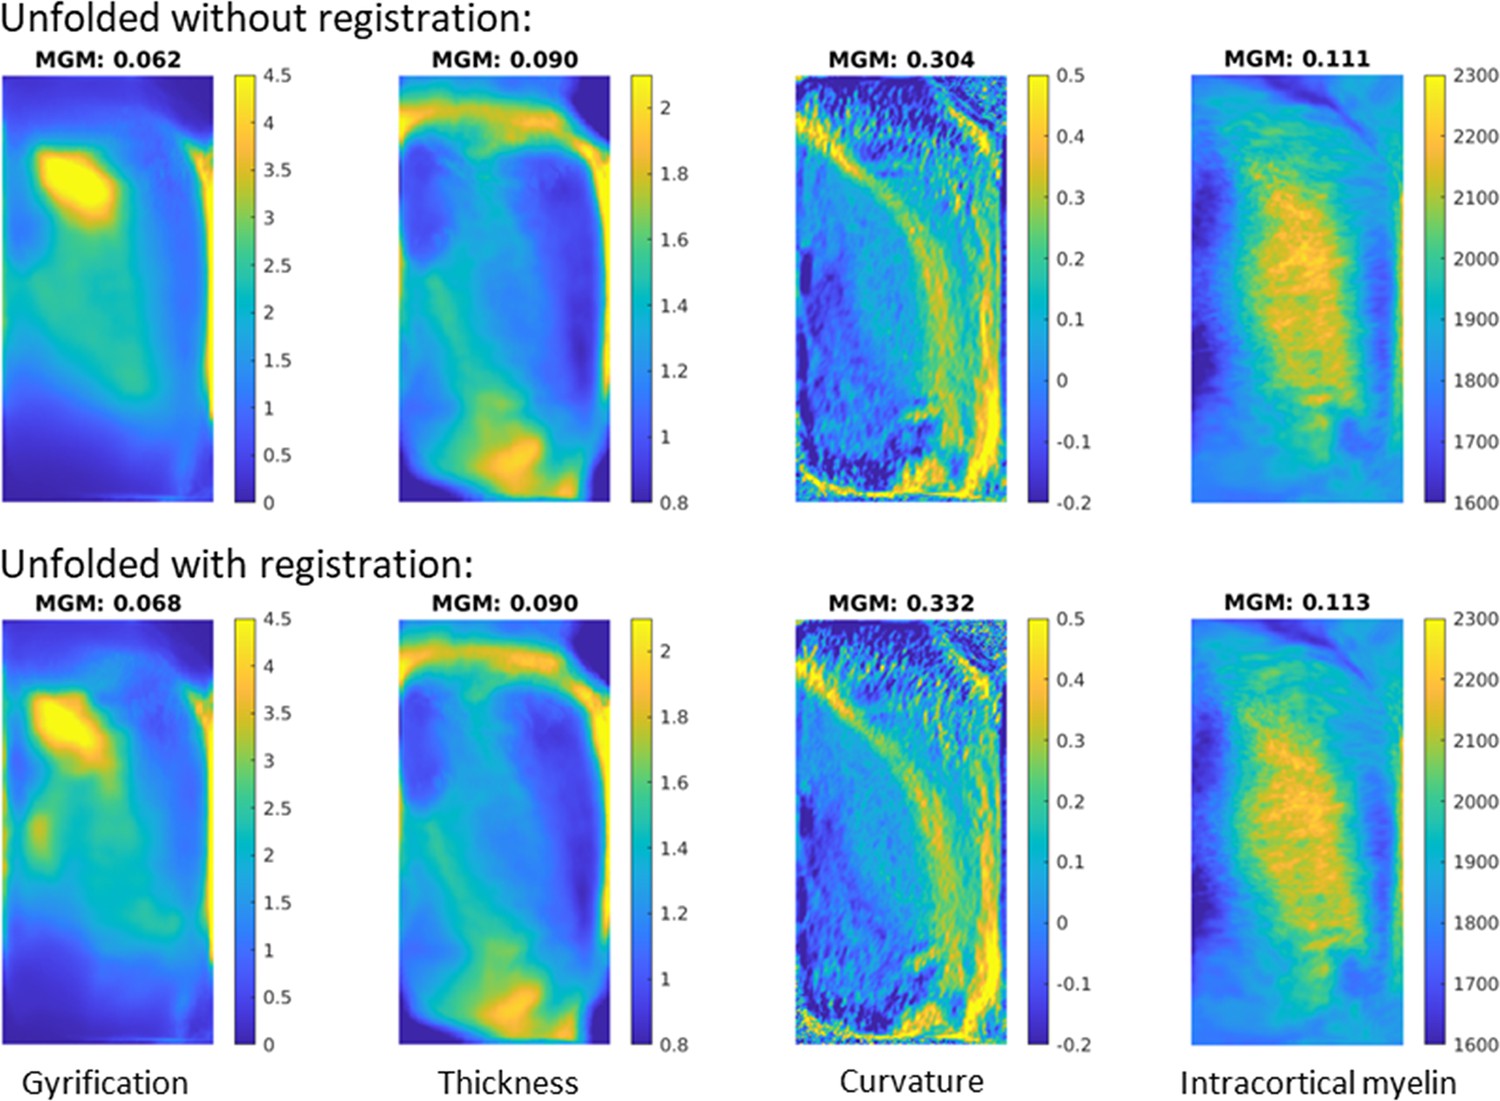
Image sharpness when averaging in vivo MRI subjects’ hippocampal features with and without unfolded space registration.
MGM = mean gradient magnitude of the group-averaged image.
Appendix 2—figure 1
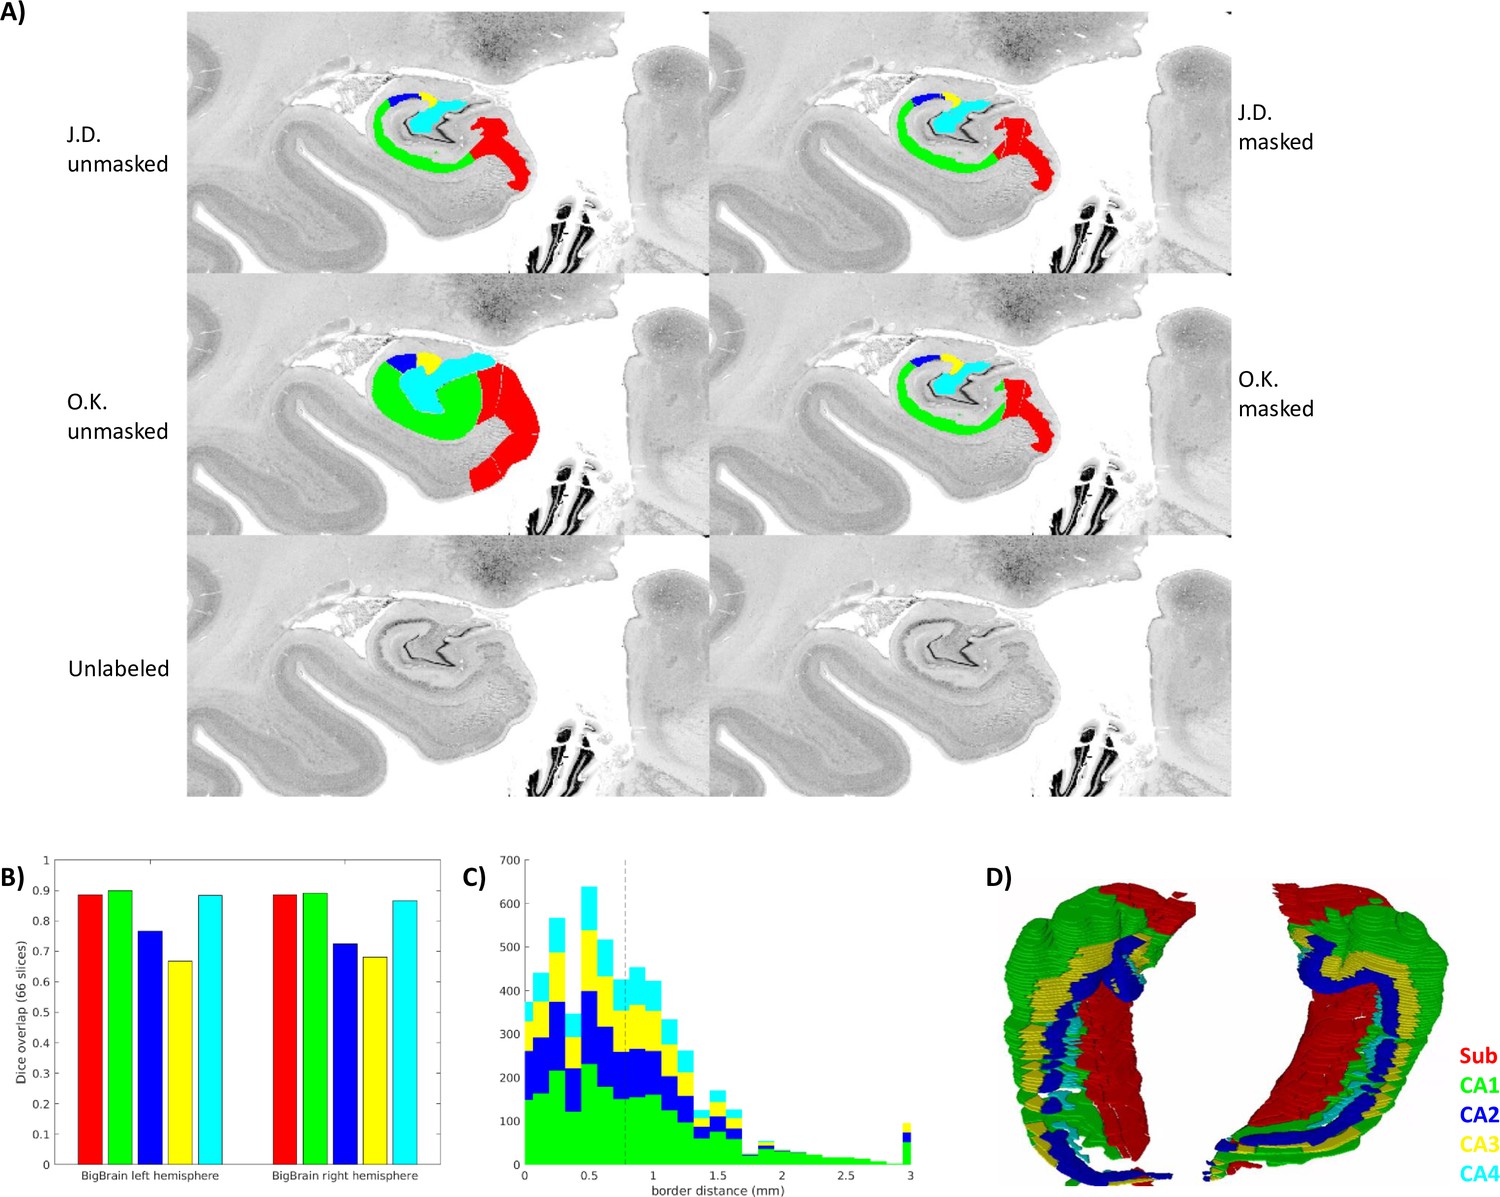
Inter-rater ground-truth subfield segmentation in the left and right BigBrain hippocampus (sample1 and sample2).
(A) Gray matter mask (defined as any unlabeled voxel from either rater) applied to one slice. (B. C) show inter-rater Dice and border distances, respectively, as in Figure 3. (D) Stacked coronal slices from rater O.K.
Additional files
-
MDAR checklist
- https://cdn.elifesciences.org/articles/88404/elife-88404-mdarchecklist1-v1.pdf
-
Supplementary file 1
Side-by-side comparison between raters (O.K. top; J.D. middle; unlabeled bottom) in a subset of 54 slices where both the left and right hemispheres were fully labeled.
Slices are ordered from anterior-to-posterior.
- https://cdn.elifesciences.org/articles/88404/elife-88404-supp1-v1.pdf
Download links
A two-part list of links to download the article, or parts of the article, in various formats.
Downloads (link to download the article as PDF)
Open citations (links to open the citations from this article in various online reference manager services)
Cite this article (links to download the citations from this article in formats compatible with various reference manager tools)
Evaluation of surface-based hippocampal registration using ground-truth subfield definitions
eLife 12:RP88404.
https://doi.org/10.7554/eLife.88404.4


