Evolutionary druggability for low-dimensional fitness landscapes toward new metrics for antimicrobial applications
- Department of Biological Sciences, North Carolina State University, United States
- Department of Mathematics and Statistics, University of Vermont, United States
- Department of Chemistry, Massachusetts Institute of Technology, United States
- Department of Ecology and Evolutionary Biology, Yale University, United States
- Santa Fe Institute, United States
- Public Health Modeling Unit, Yale School of Public Health, United States
Figures
Figure 1
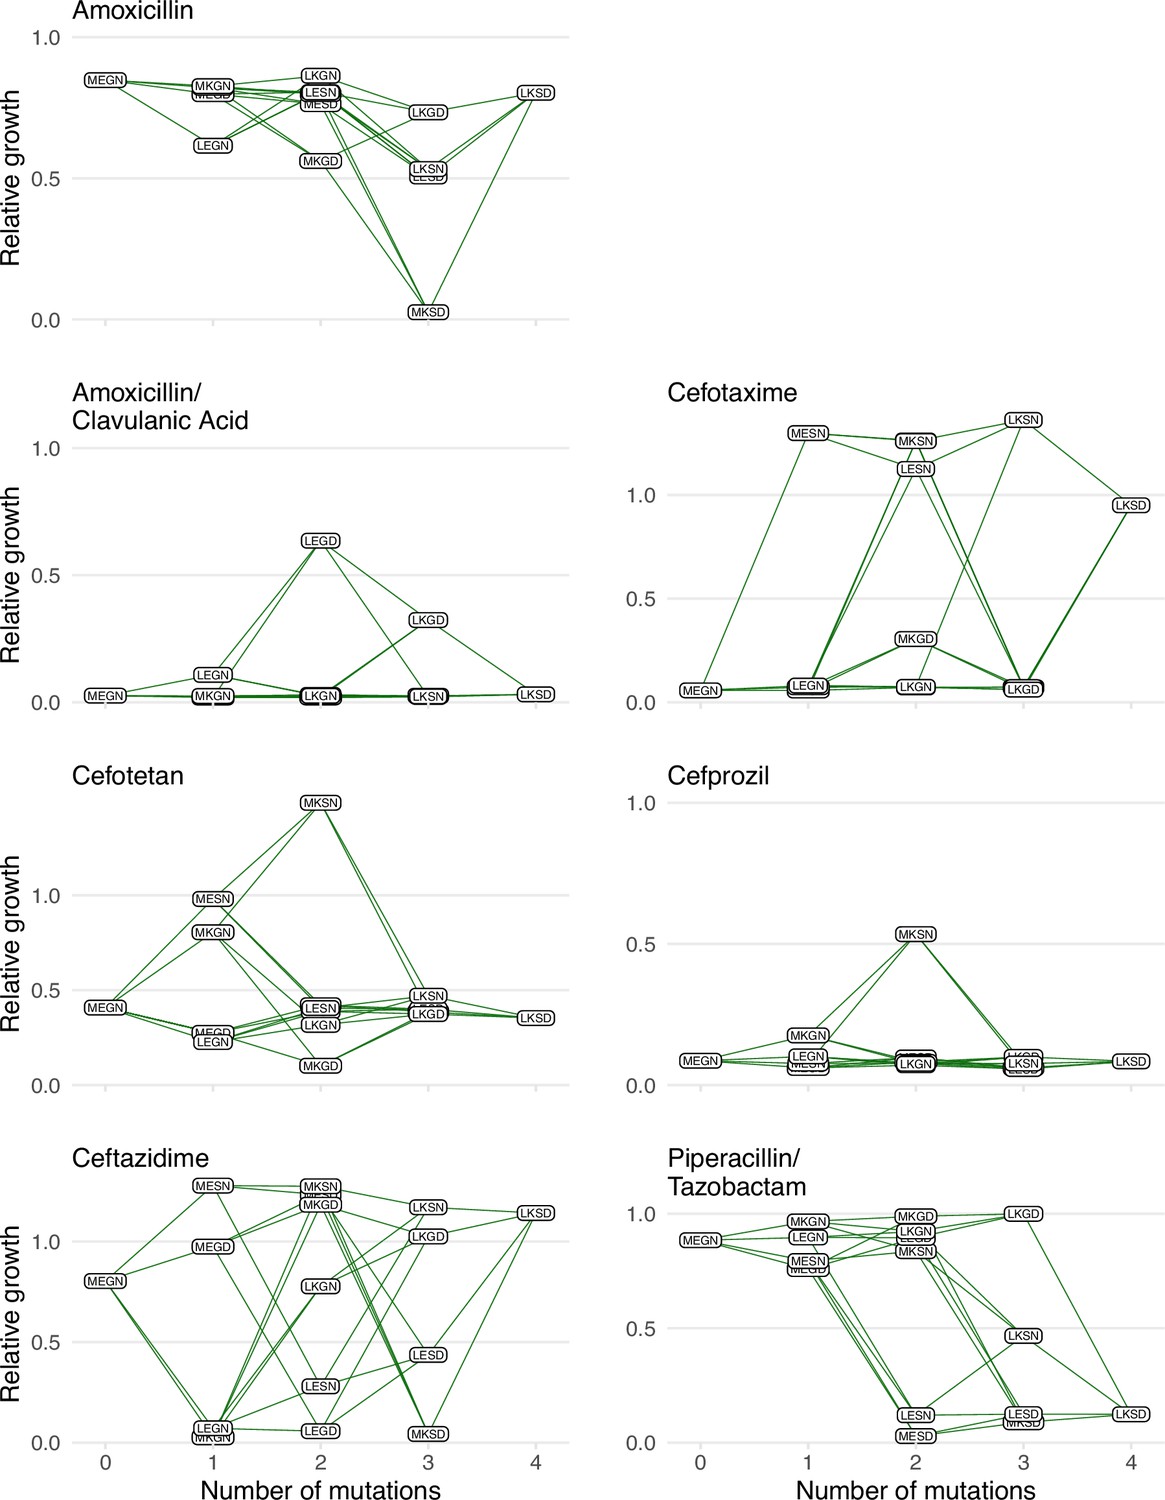
Graphical depictions of the TEM1/TEM-50 fitness landscape examined in this study.
The TEM-50 variant is represented by the quadruple mutant, LKSD, and the wild-type, MEGN, represents TEM-1. The figure highlights the variation in the topography of the various fitness landscapes. Y-axes correspond to the growth rates relative to the wild-type of the allelic variants. The X-axis corresponds to the number of mutations away from the TEM-1 wild-type MEGN.
Figure 2
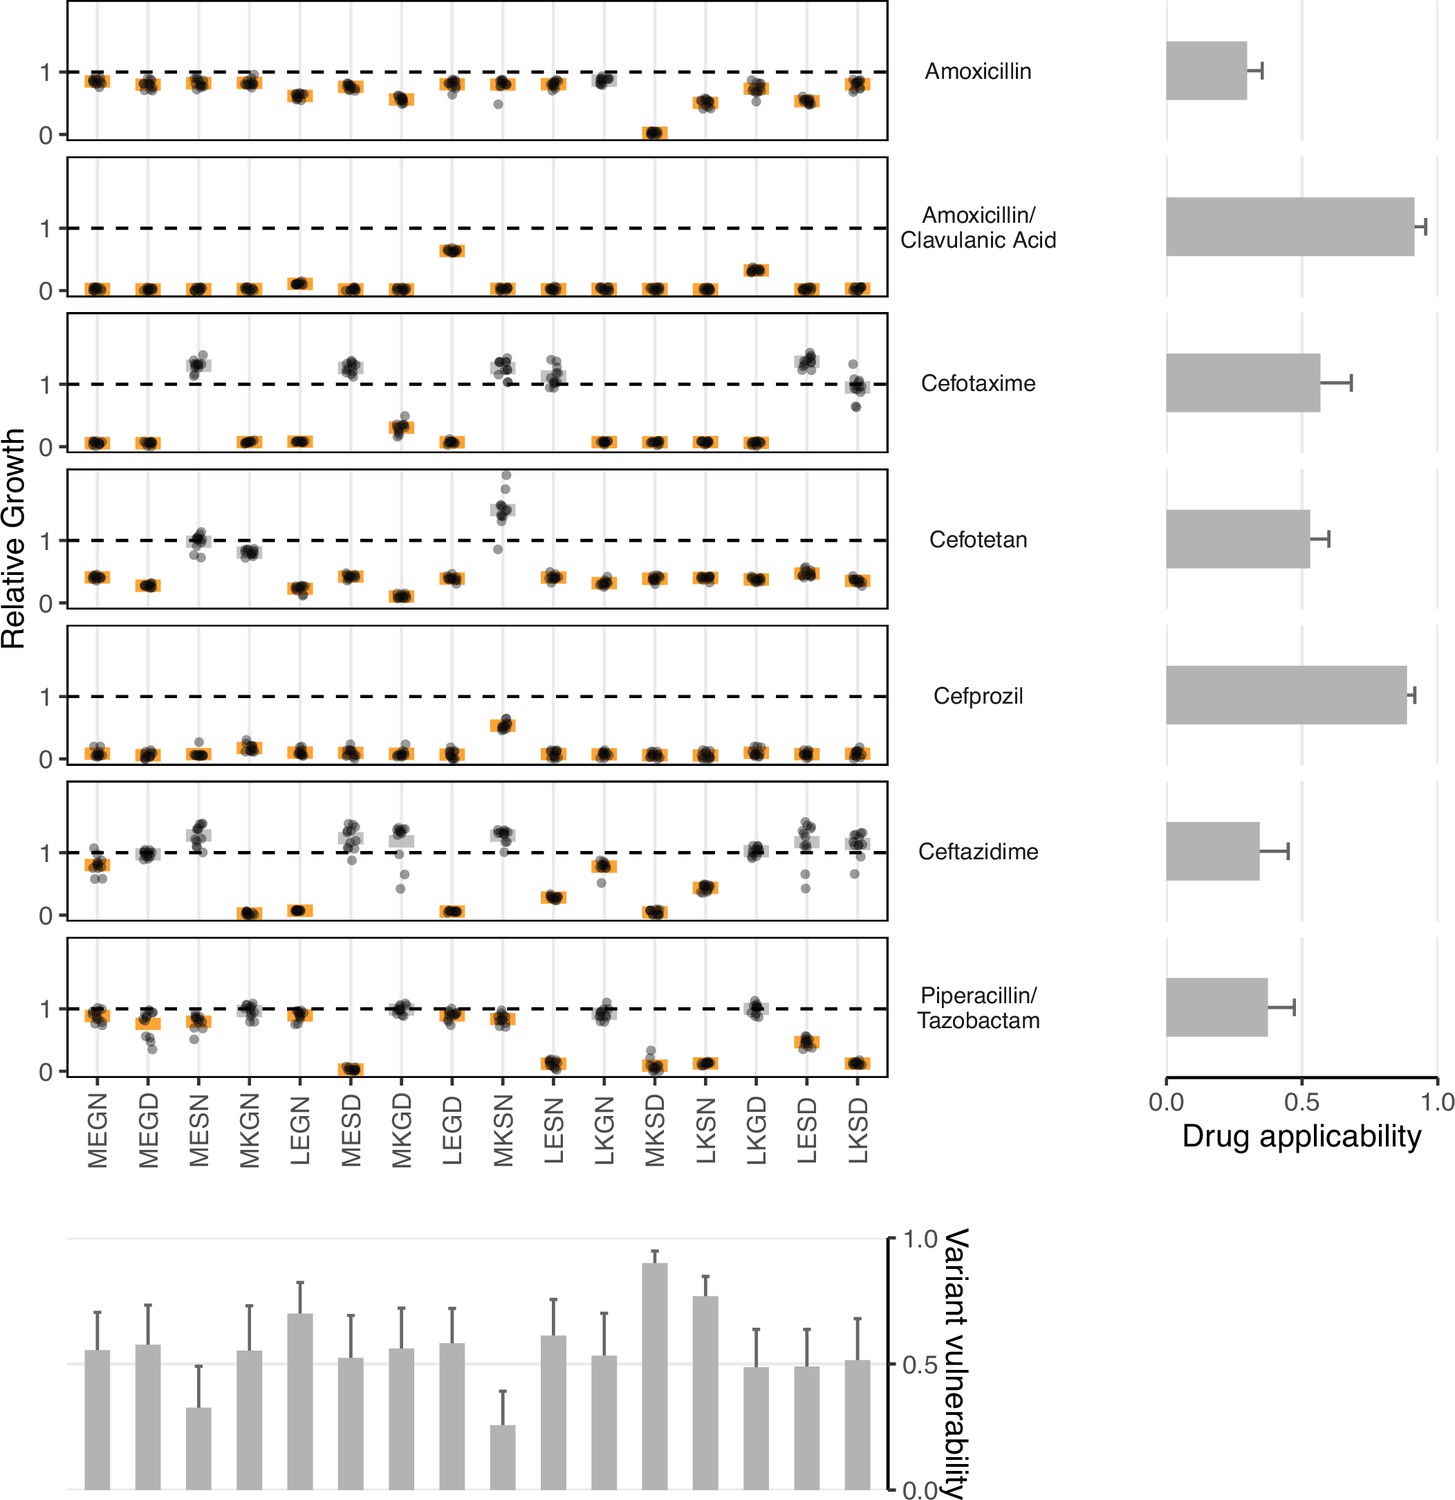
Data from empirical fitness landscapes can be used to compute two metrics: variant vulnerability (for allelic variants) and drug applicability (for drugs).
Growth of allelic variants, relative to control (wild-type), for seven drug treatments. Bars represent the mean value for each group; orange bars indicate significantly lower growth with respect to control (one-tailed t-test, p<0.01), grey bars otherwise. The bars, from left to right, along the bottom correspond to the variant vulnerability of the variants. The bars along the right side, from top to bottom, describe the drug applicability of the seven drugs analyzed in this study. Dashed lines correspond to the TEM-1 growth rate in the putative drug environment.
Figure 3
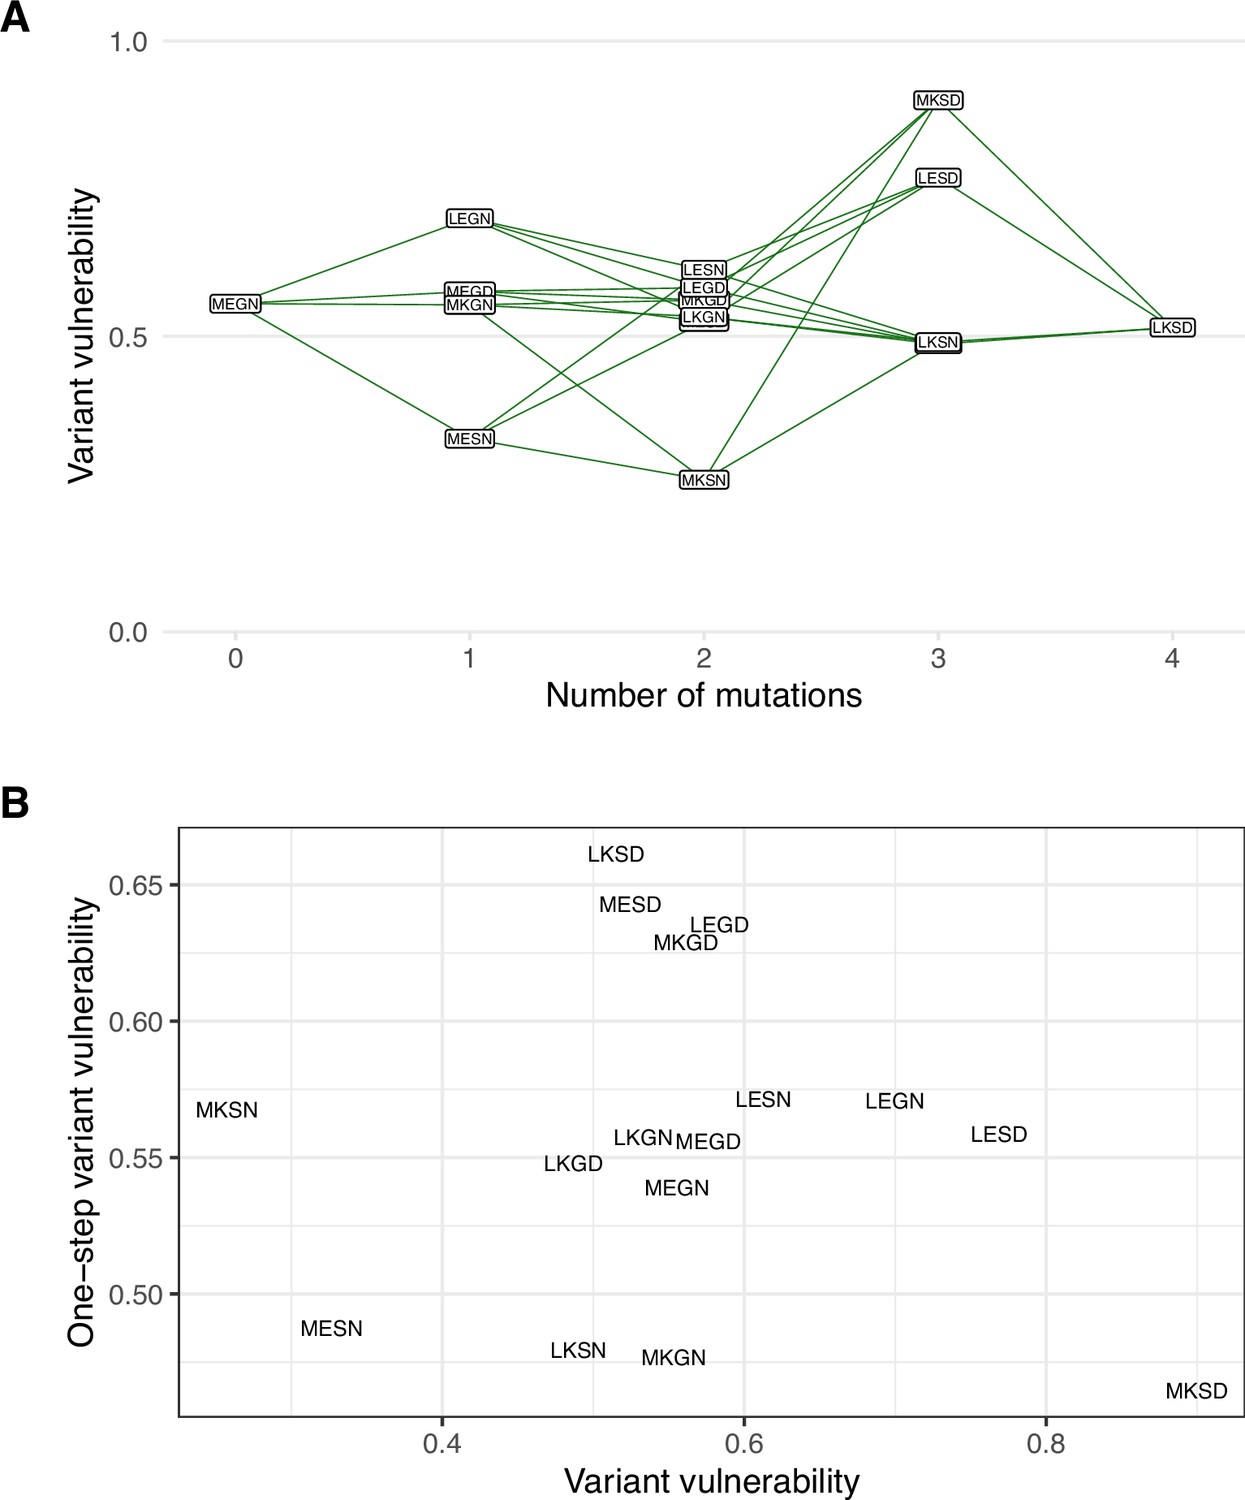
The variant vulnerability of the 16 allelic variants does not correlate with that of their one-step mutational neighbors.
(A) The variant vulnerability values for the 16-allelic variants as a function of the number of mutations away (hamming distance) from TEM-1 (MEGN). (B) The variant vulnerability values of all 16 allelic variants (x-axis) against the average variant vulnerability values of one-step neighbors (each allelic variant has four such neighbors). The analysis demonstrates no correlation, suggesting that variant vulnerability values are distributed nonlinearly across the fitness landscape (linear regression ).
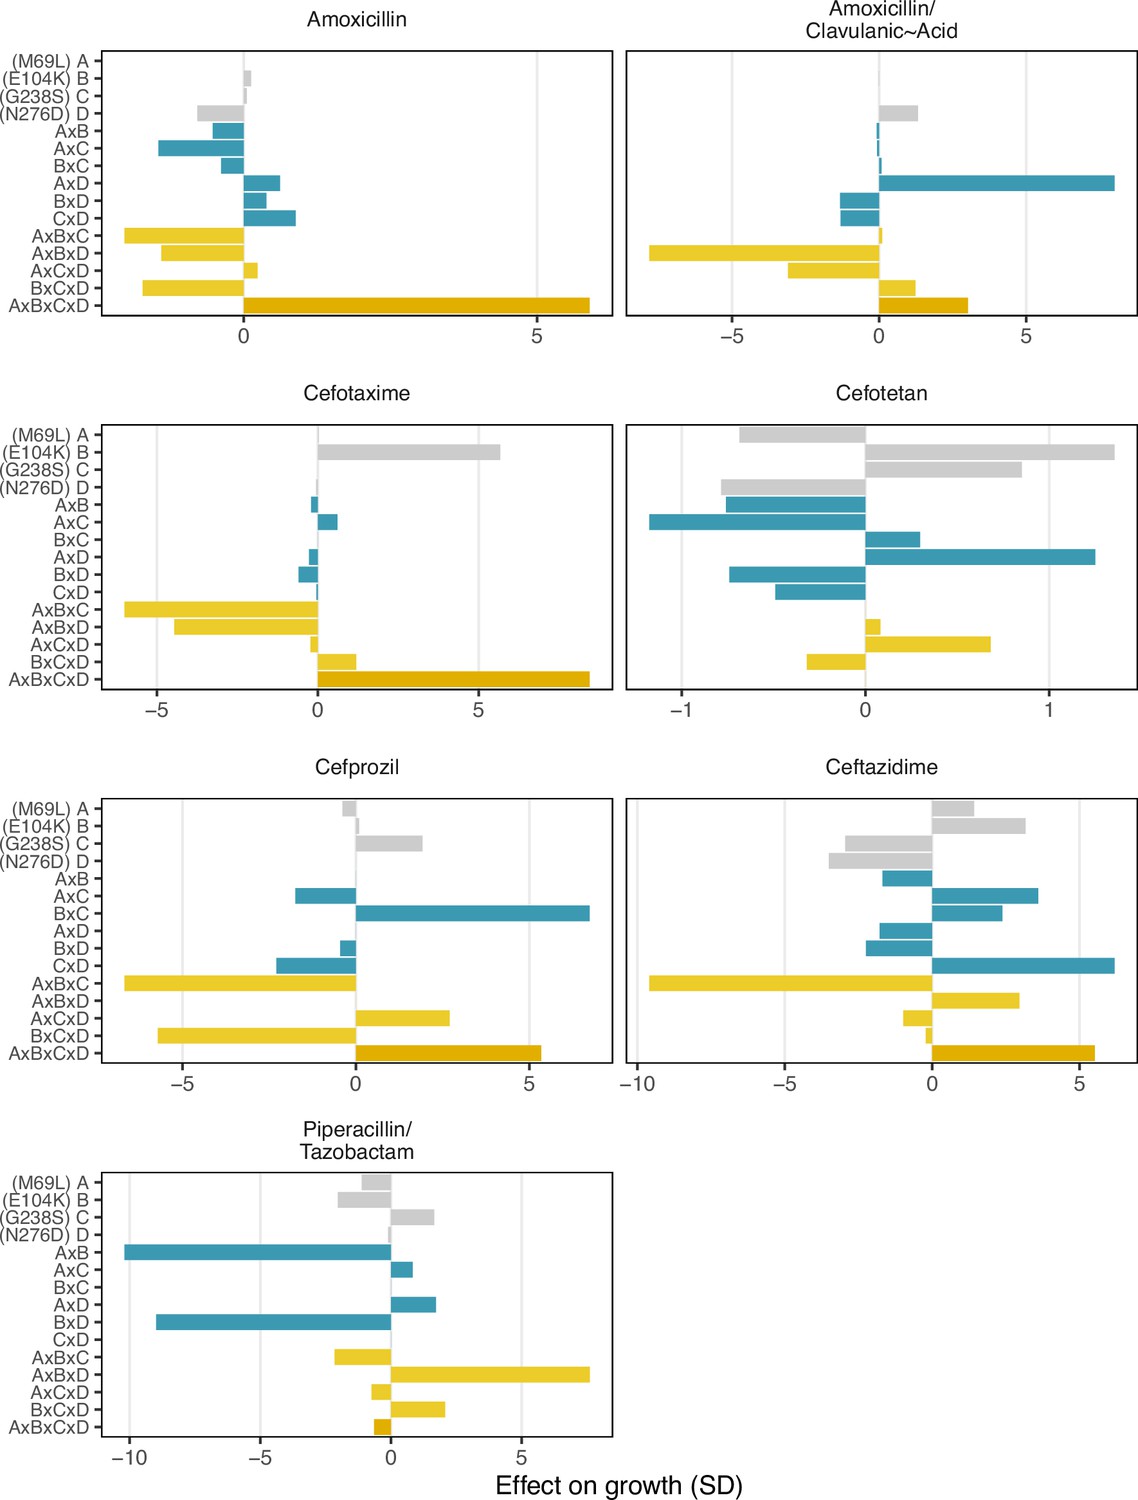
Figure 4
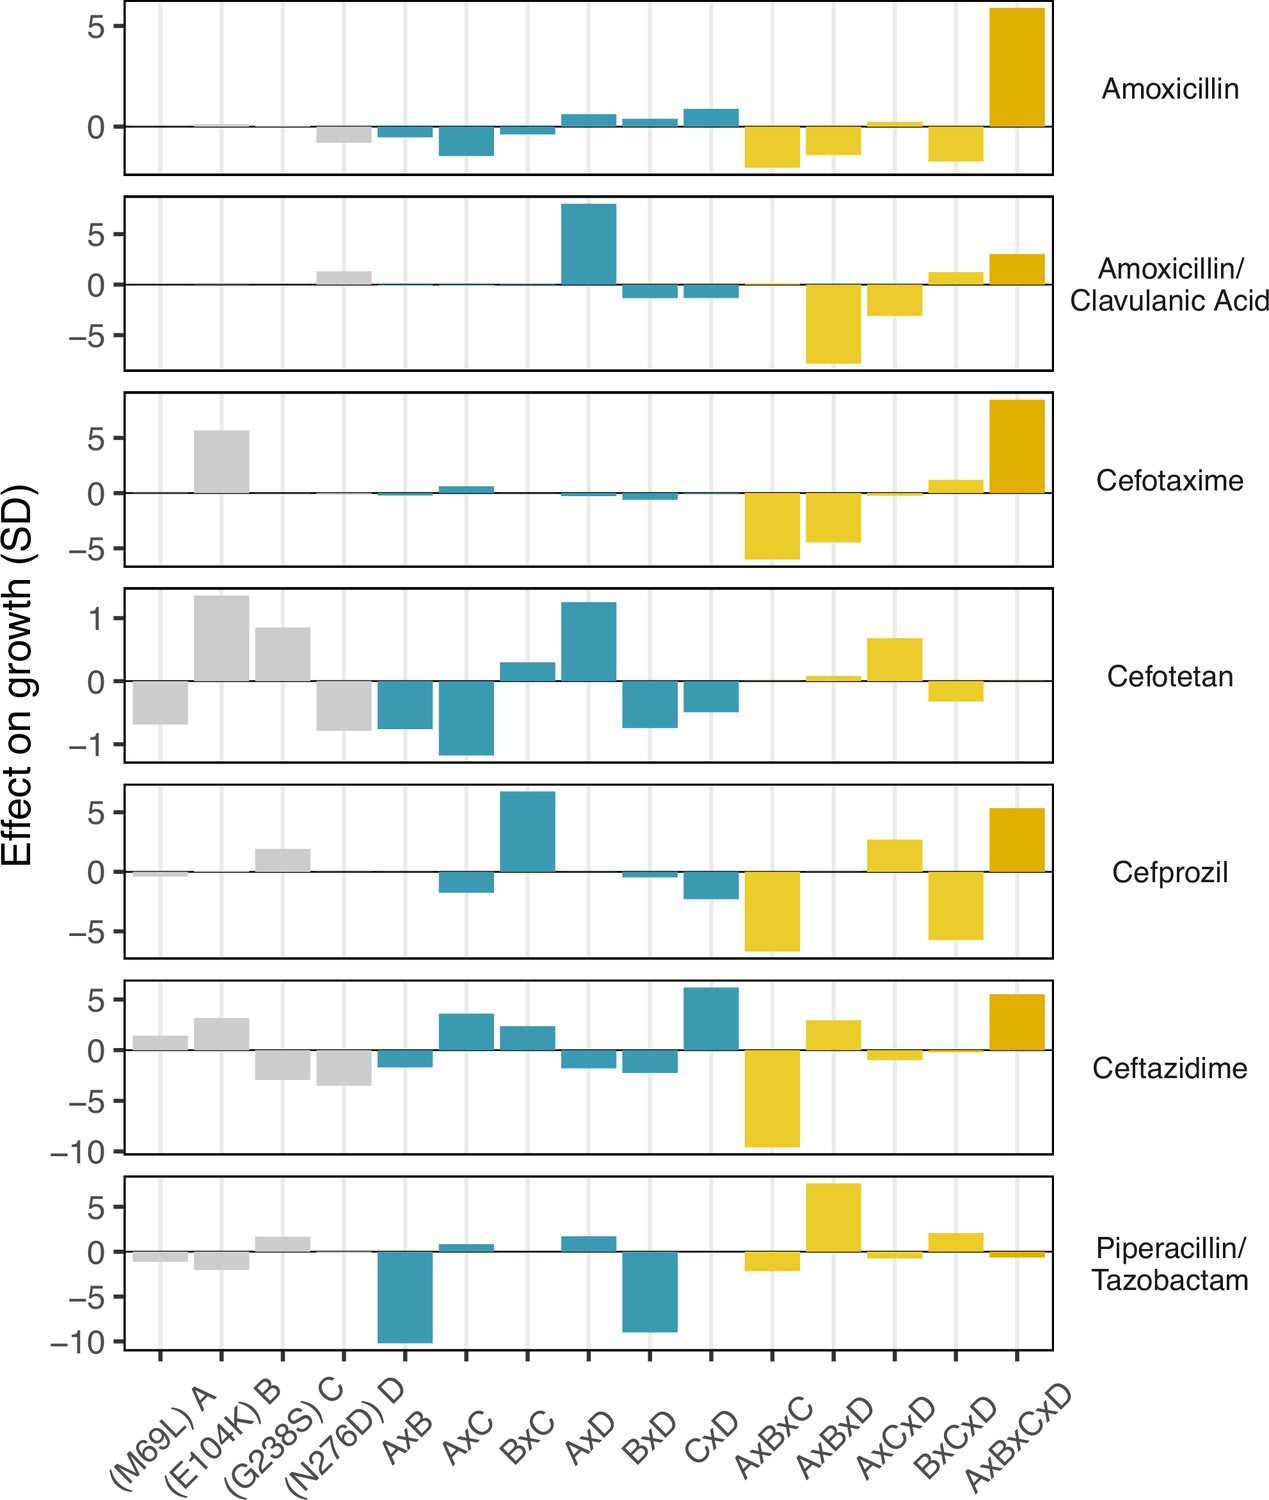
Environmental epistasis underlies the drug-allele interactions that drive the variant vulnerability and drug applicability.
Effect on growth (in standard deviations of the wild-type control values), estimated by LASSO regression, for individual loci and their interactions. [A] corresponds to M69L, [B] to E104K, [C] to G238S, and [D] to N276D. As in a mutation effect reaction norm (Ogbunugafor, 2022), the information describes how the effect of mutations changes across drug environments. This analysis is akin to a large deconstruction of the SNP x SNP x Environment (G x G x E) interactions, also known as environmental epistasis (Lindsey et al., 2013). In the supplemental information, we provide a version of this figure where all of the coefficients are the same axis.
Appendix 1—figure 1
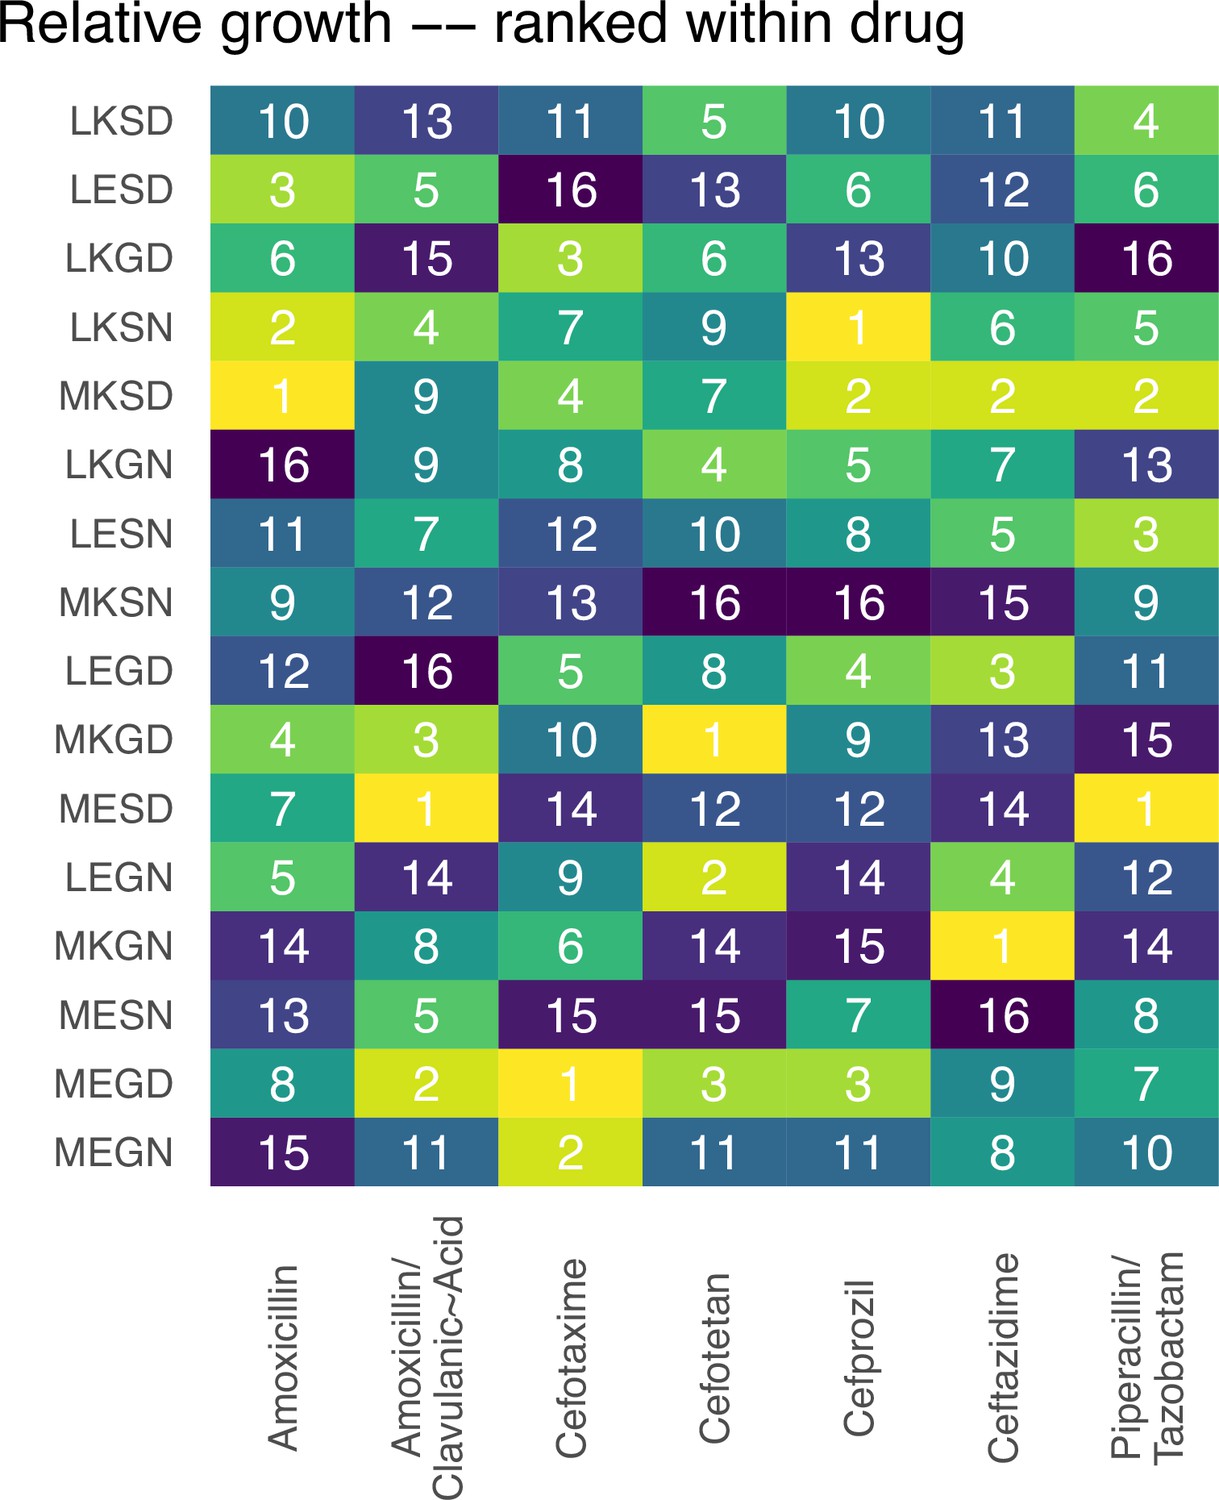
Rank orders for the alleles in the fitness landscapes outlined in Figure 1.
Appendix 1—figure 2
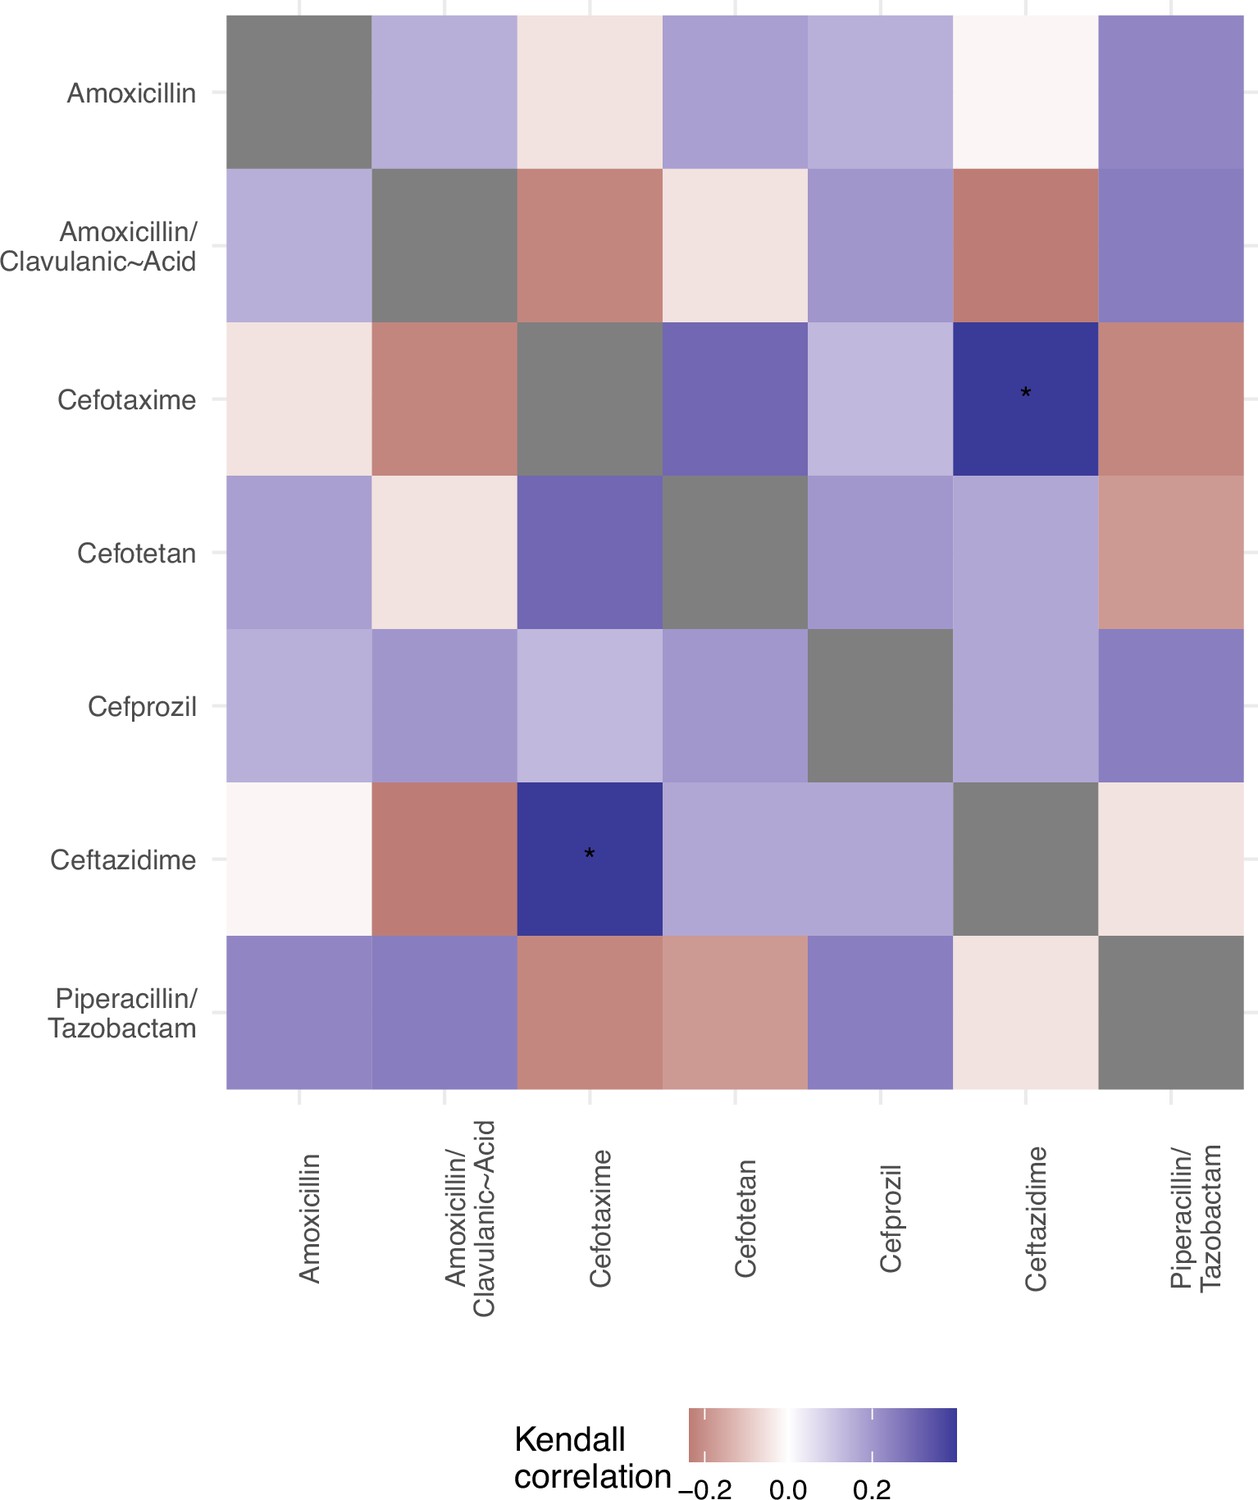
We offer an analysis of the topography of those landscapes, based on the Kendall rank order test.
This texts the hypothesis that there is no correlation (concordance or discordance) between the topographies of the fitness landscapes.
Appendix 1—figure 3
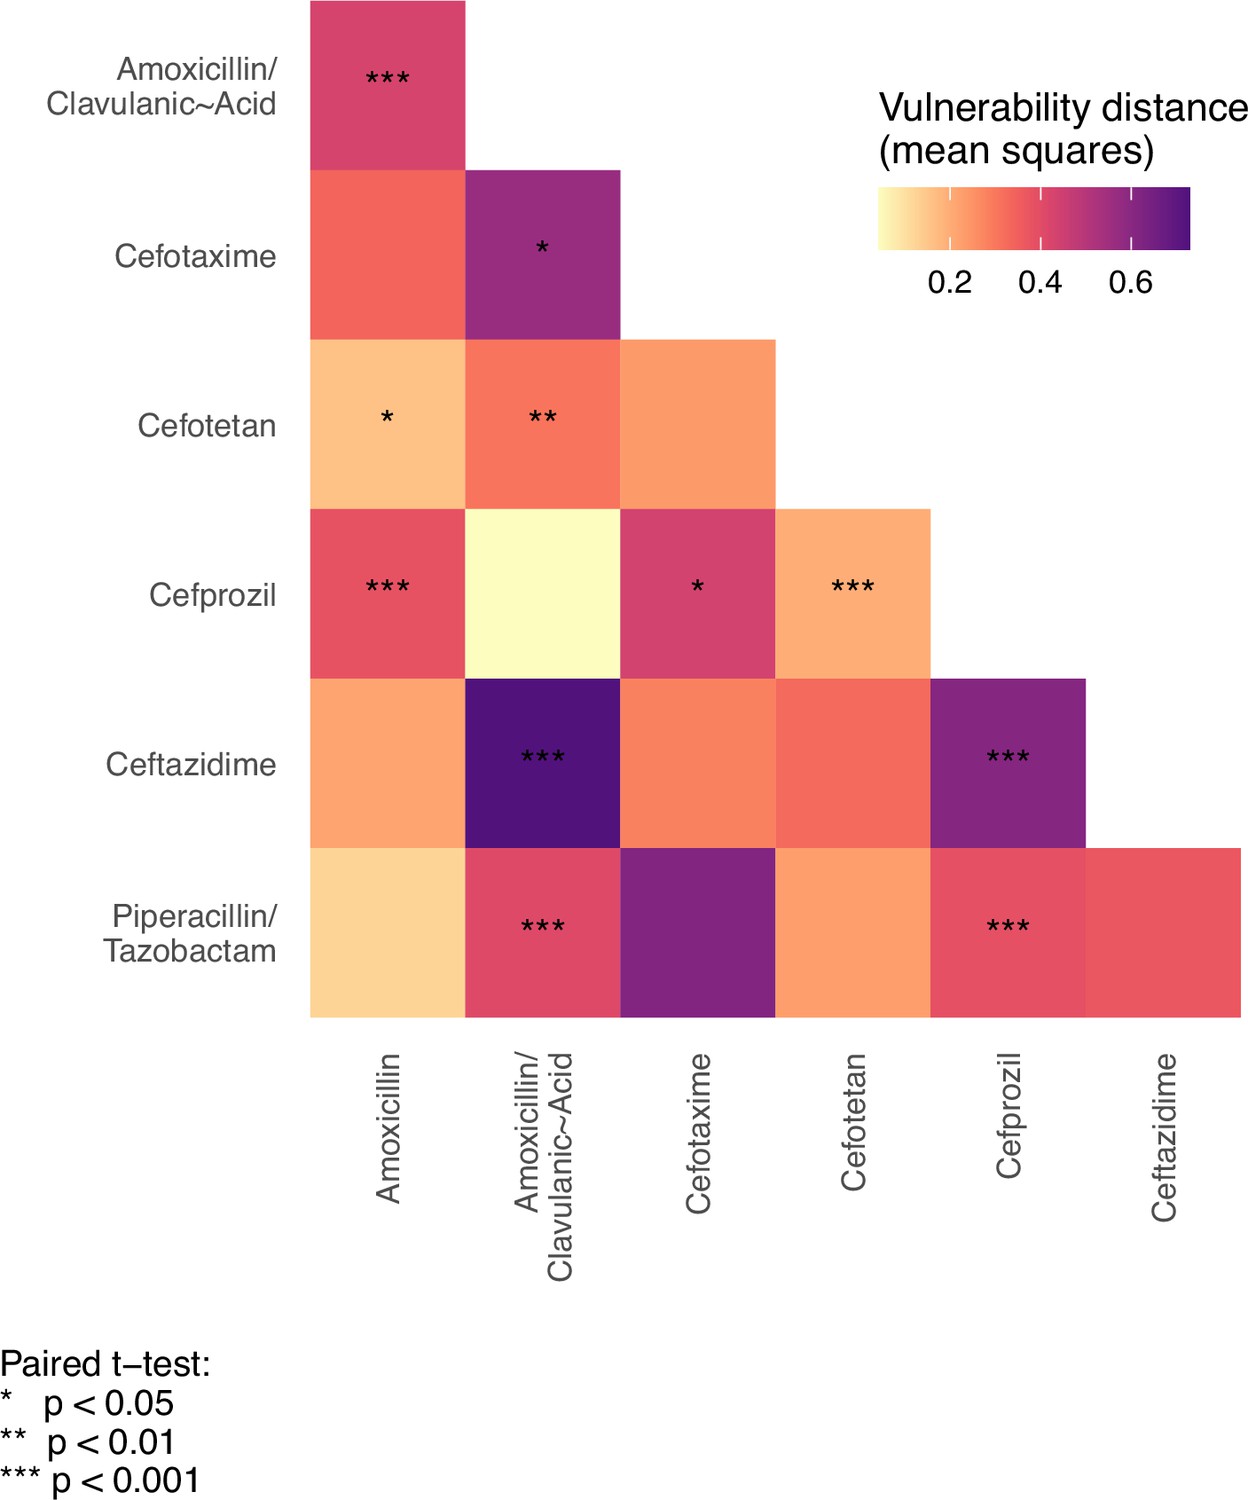
To test the hypothesis that the variant vulnerability values differ, we calculated a paired t-test.
These are paired by haplotype/allelic variant, so the comparisons are change in growth between drugs for each haplotype.
Appendix 1—figure 4
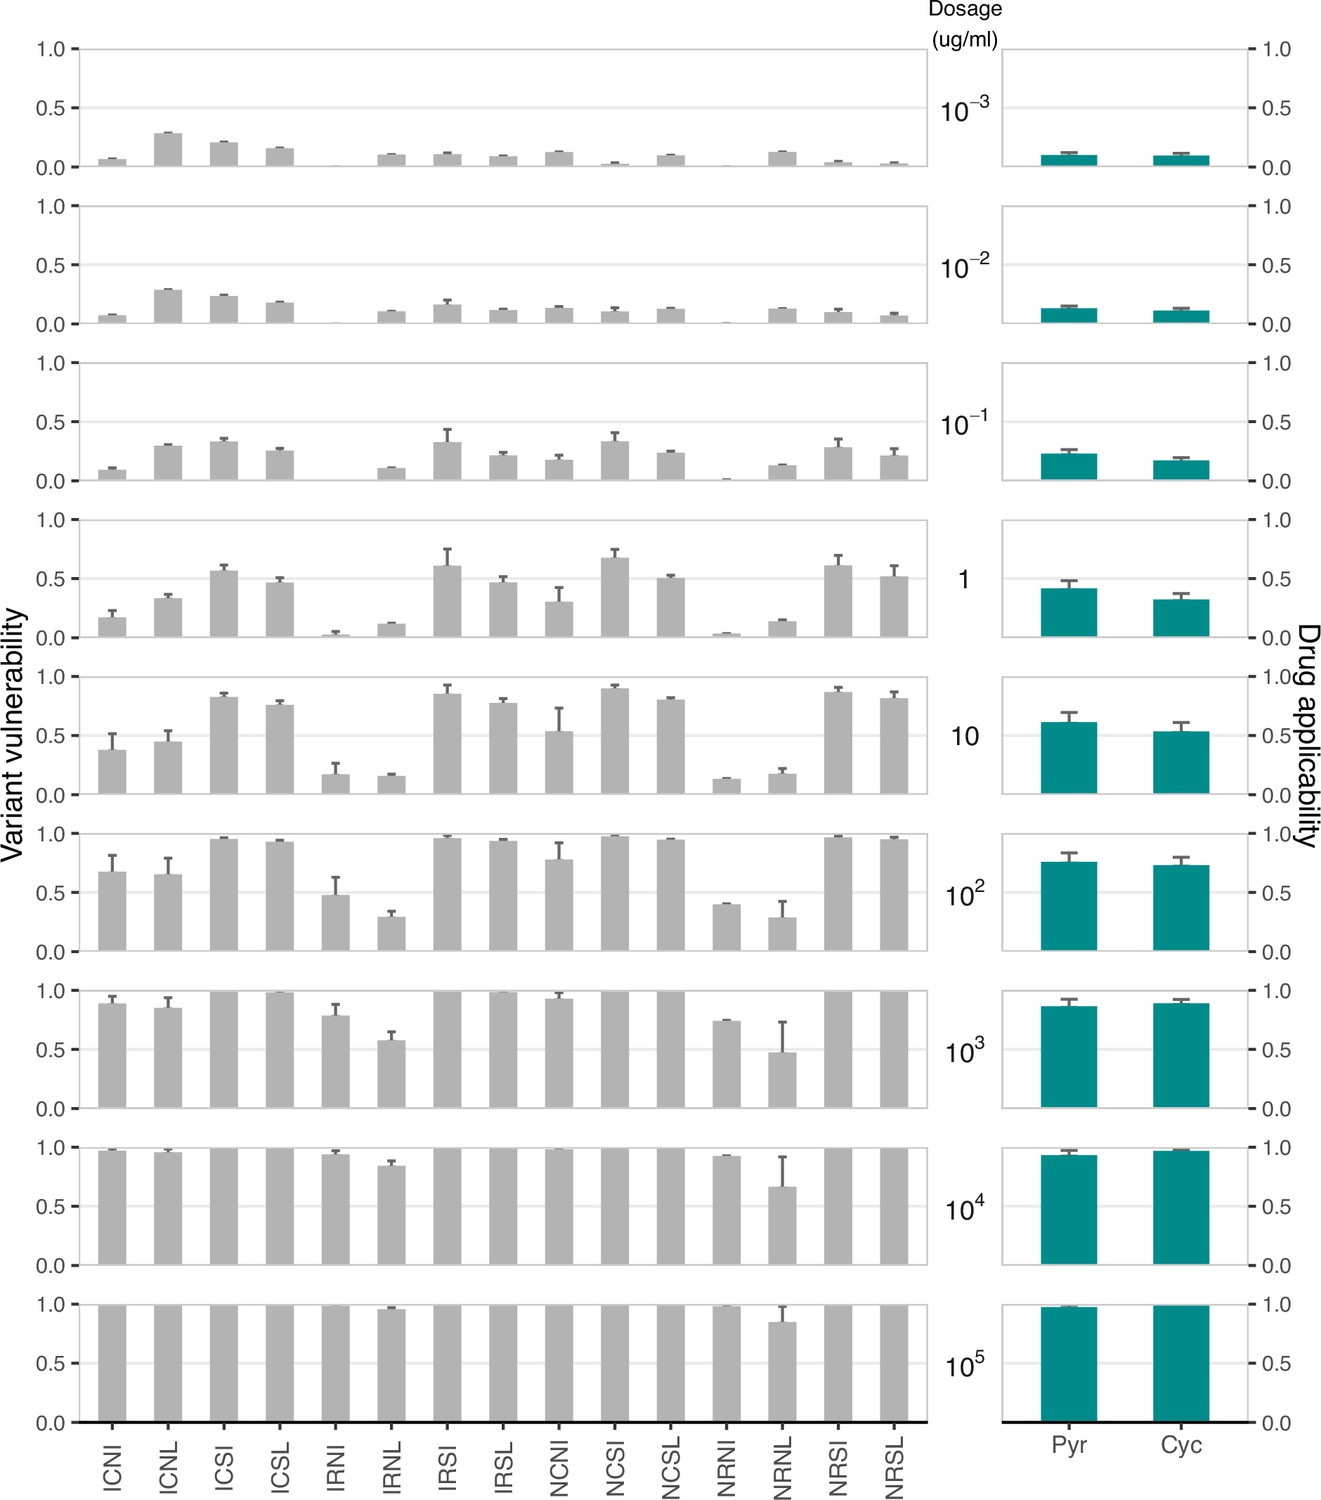
Variant vulnerability and drug applicability values for 16 allelic variants of dihydrofolate reductase (Plasmodium falciparum), across nine concentrations of two different antifolate drugs.
Appendix 1—figure 5
As stated in them main text: “Environmental epistasis underlies the drug-allele interactions that drive the variant vulnerability and drug applicability".
Effect on growth (in standard deviations of the wild-type control values), estimated by LASSO regression, for individual loci and their interactions. [A] corresponds to M69L, [B] to E104K, [C] to G238S, and [D] to N276D.
Author response image 1

Drug applicability and variant vulnerability for 16 alleles of dihydrofolate reductase.
Author response image 2
Author response image 3
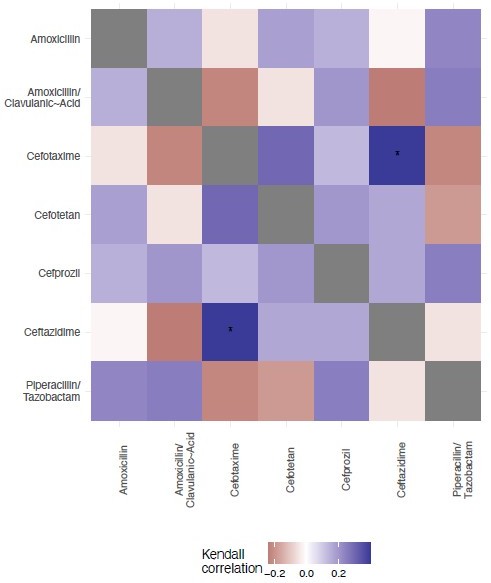
Kendall rank test for correlation between the 7 fitness landscapes.
Author response image 4
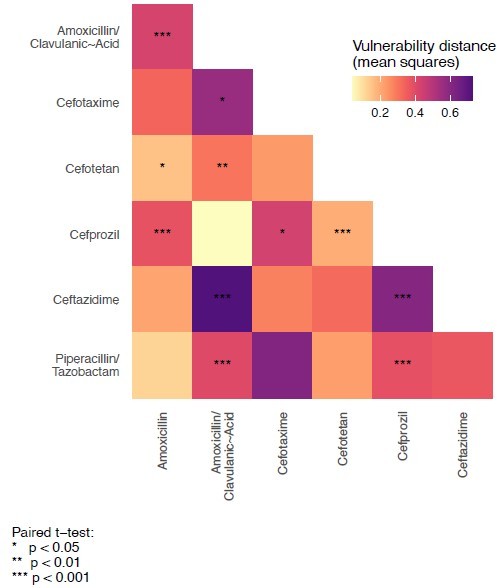
Paired t-tests for variant vulnerability.
Tables
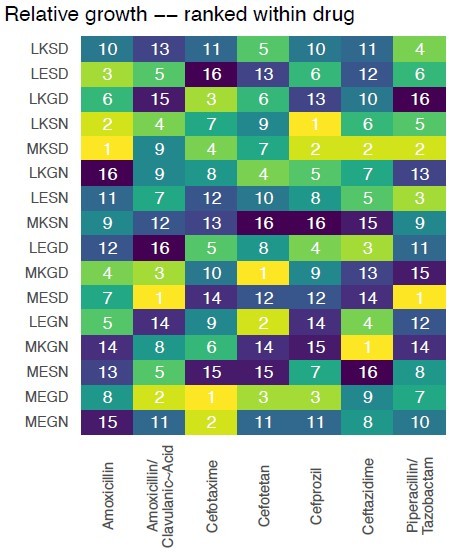
Table 1
The rank order of the alleles with respect to variant vulnerability.
An allele with high drug applicability is most susceptible to the collection of drugs in a panel (seven -lactamase drugs and drug combinations in this study). MEGN (0000) is the genotype known as the TEM-1 variant of -lactamase. LKSD (1111) is the TEM-50 variant of -lactamase genotype.
| TEM allelic variant | Binary | Rank (1=highest variant vulnerability) |
|---|---|---|
| MKSD | 0111 | 1 |
| LESD | 1011 | 2 |
| LEGN | 1000 | 3 |
| MEGD | 0001 | 4 |
| MKGN | 0100 | 5 |
| LESN | 1010 | 6 |
| LKGN | 1100 | 7 |
| LEGD | 1001 | 8 |
| MKGD | 0101 | 9 |
| LKGD | 1101 | 10 |
| LKSD | 1111 | 11 |
| MEGN | 0000 | 12 |
| MESD | 0011 | 13 |
| LKSN | 1110 | 14 |
| MESN | 0010 | 15 |
| MKSN | 0110 | 16 |
-
Source: The authors.
Table 2
The rank order of the seven drugs with respect to their drug applicability.
A drug with a high drug applicability is, on average, highly effective across the range of allelic variants in a set (in this study, a combinatorial set of four mutations that compose the TEM-50 variant of -lactamase in this study). We emphasize that the findings in this study do not apply to clinical settings nor are they based on clinical data.
| Antimicrobial | Class | Rank(1=highest drug applicability) |
|---|---|---|
| Amoxicillin / clavulanic acid | -lactam and -lactamase inhibitor | 1 |
| Cefprozil | Second-generation cephalosporin | 2 |
| Cefotaxime | Third-generation cephalosporin | 3 |
| Cefotetan | Second-generation cephalosporin | 4 |
| Piperacillin and tazobactam | Penicillin and -lactamase inhibitor | 5 |
| Ceftazidime | Third-generation cephalosporin | 6 |
| Amoxicillin | -lactam | 7 |
-
Source: The authors.
Table 3
Terms used or introduced in this study and their definition.
For some terms, references are provided for clarity.
| Term | Study definition |
|---|---|
| Drugability or Druggability | Generally used to describe the ability to treat a drug target with a small molecule-based drug Halgren, 2009; Jubb et al., 2015. Sometimes refers to the ability of a drug to be used against a single or set of drug targets, and/or used to describe whether a small molecule fits into a compound class that is or can be adapted to have pharmacologic properties useful in the clinic (e.g., solubility) Keller et al., 2006; Benet et al., 2016. |
| Cross-resistance | Phenomenon whereby pathogens are resistant to all or most antimicrobials belonging to a given class via a single mechanism. |
| Susceptibility | , where is the mean growth of the allelic variant under drug conditions relative to the mean growth of the wild-type control. |
| Environmental epistasis | A term that comes from a prior study on G x G x E interactions Lindsey et al., 2013. Analysis of the various G x G x E interactions that drive the variant vulnerability and drug applicability metrics. |
| Variant vulnerability | The average susceptibility of an allele across drugs in a panel. |
| Drug applicability | The average susceptibility of all variants to an antibiotic. |
-
Source: The authors.
Additional files
Download links
A two-part list of links to download the article, or parts of the article, in various formats.
Downloads (link to download the article as PDF)
Open citations (links to open the citations from this article in various online reference manager services)
Cite this article (links to download the citations from this article in formats compatible with various reference manager tools)
Evolutionary druggability for low-dimensional fitness landscapes toward new metrics for antimicrobial applications
eLife 12:RP88480.
https://doi.org/10.7554/eLife.88480.3


