Molecular mechanisms of microbiome modulation by the eukaryotic secondary metabolite azelaic acid
- Biology Program, New York University Abu Dhabi, United Arab Emirates
- Max Planck Institute for Marine Microbiology, Germany
- West Australian Biogeochemistry Centre, School of Biological Sciences, The University of Western Australia, Australia
- Climate Change Cluster, Faculty of Science, University of Technology Sydney, Australia
- Center for Genomics and Systems Biology (CGSB), New York University Abu Dhabi, United Arab Emirates
- Arabian Center for Climate and Environmental Sciences (ACCESS), New York University Abu Dhabi, United Arab Emirates
Figures
Figure 1 with 1 supplement

Enriched Kyoto Encyclopedia of Genes and Genomes (KEGG) pathways in Phycobacter and A. macleodii.
Left: Scatter plot of the log2 fold-change of differentially expressed (DE) genes present in KEGG pathways listed on the y-axis. Each circle represents the differential expression of a gene in the presence of azelaic acid (Aze) relative to controls. Genes were considered DE if they had a p-adjusted value of <0.05 and log2 fold-change of ≥±0.5. Right: Expression ratios for KEGG pathways of interest were calculated as the total number of DE genes: total number of genes present in the genome in the given pathway. Bar sizes are proportional to the contribution of DE genes in relation to all genes present in a pathway. Circle and bar colors indicate the strain and time point (red = Phycobacter at 0.5 hr; green = Phycobacter at 8 hr; blue = A. macleodii at 0.5 hr).
Figure 1—figure supplement 1

Effect of azelaic acid (Aze) on growth of Phycobacter.
(A) As a sole carbon source (1 mM) and (B) in comparison to a control. For (B) Aze was added at T=0 hr to treatments while controls received an equivalent volume of Milli-Q water. RNA samples were collected at the times marked by arrows (T=0.5 hr and T=8 hr). Error bars represent standard deviation of triplicate cultures.
Figure 2 with 1 supplement
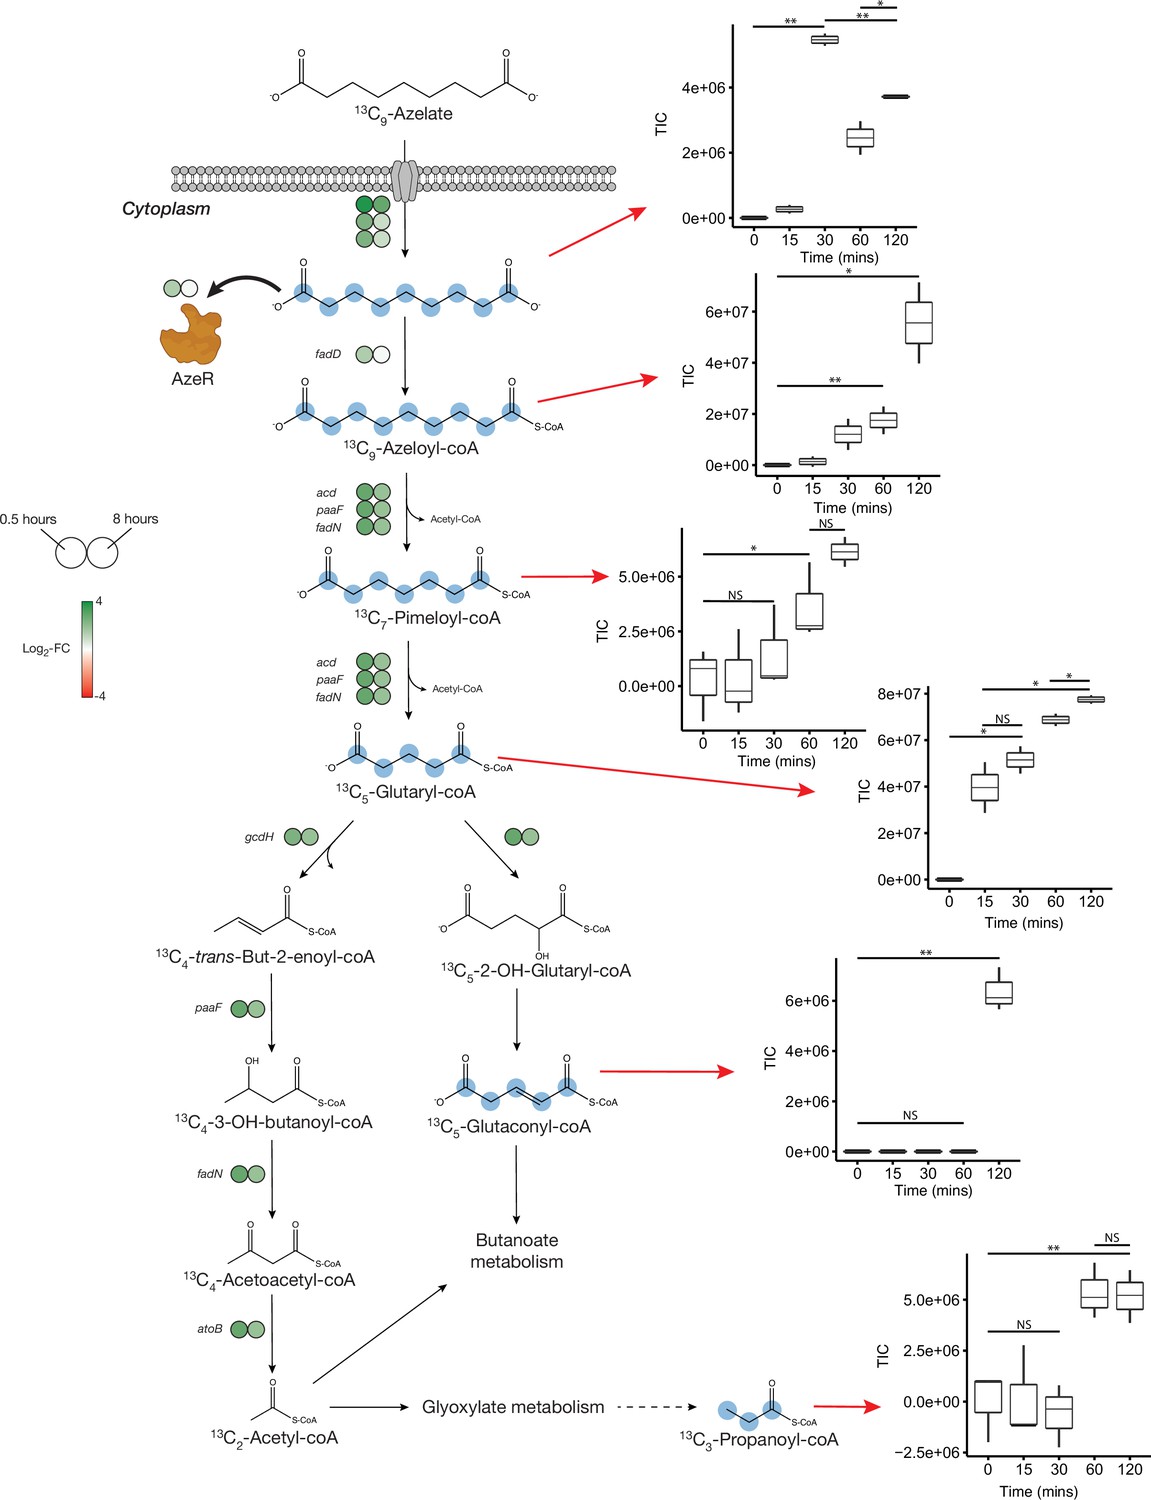
Proposed azelaic acid (Aze) catabolism in Phycobacter based on transcriptomics and isotope labeling.
Left: Log2 fold-change of differentially expressed (DE) genes is shown as circles at 0.5 (left circle) and 8 hr (right circle) after the addition of Aze to Phycobacter cells relative to controls. The Aze transport system (azeTSL) consists of three genes, the DE values of which are shown next to the transporter. Intermediate reactions and substrates for the successive liberation of acetyl-coA from azeloyl-coA and pimeloyl-coA are not shown; DE values of the genes involved are shown next to each overall reaction. 13C-labeled metabolites detected in the intracellular metabolome of Phycobacter cells are marked with cyan circles at each labeled carbon atom site. Right: Relative abundance of each detected labeled metabolite after addition of 100 μM 13C-Aze to Phycobacter cells, shown as total ion current (TIC). Box plot values are based on triplicates. NS indicates no significant relative abundance, * denotes p<0.05 and ** denotes p<0.005 based on a Student’s t-test.
Figure 2—figure supplement 1
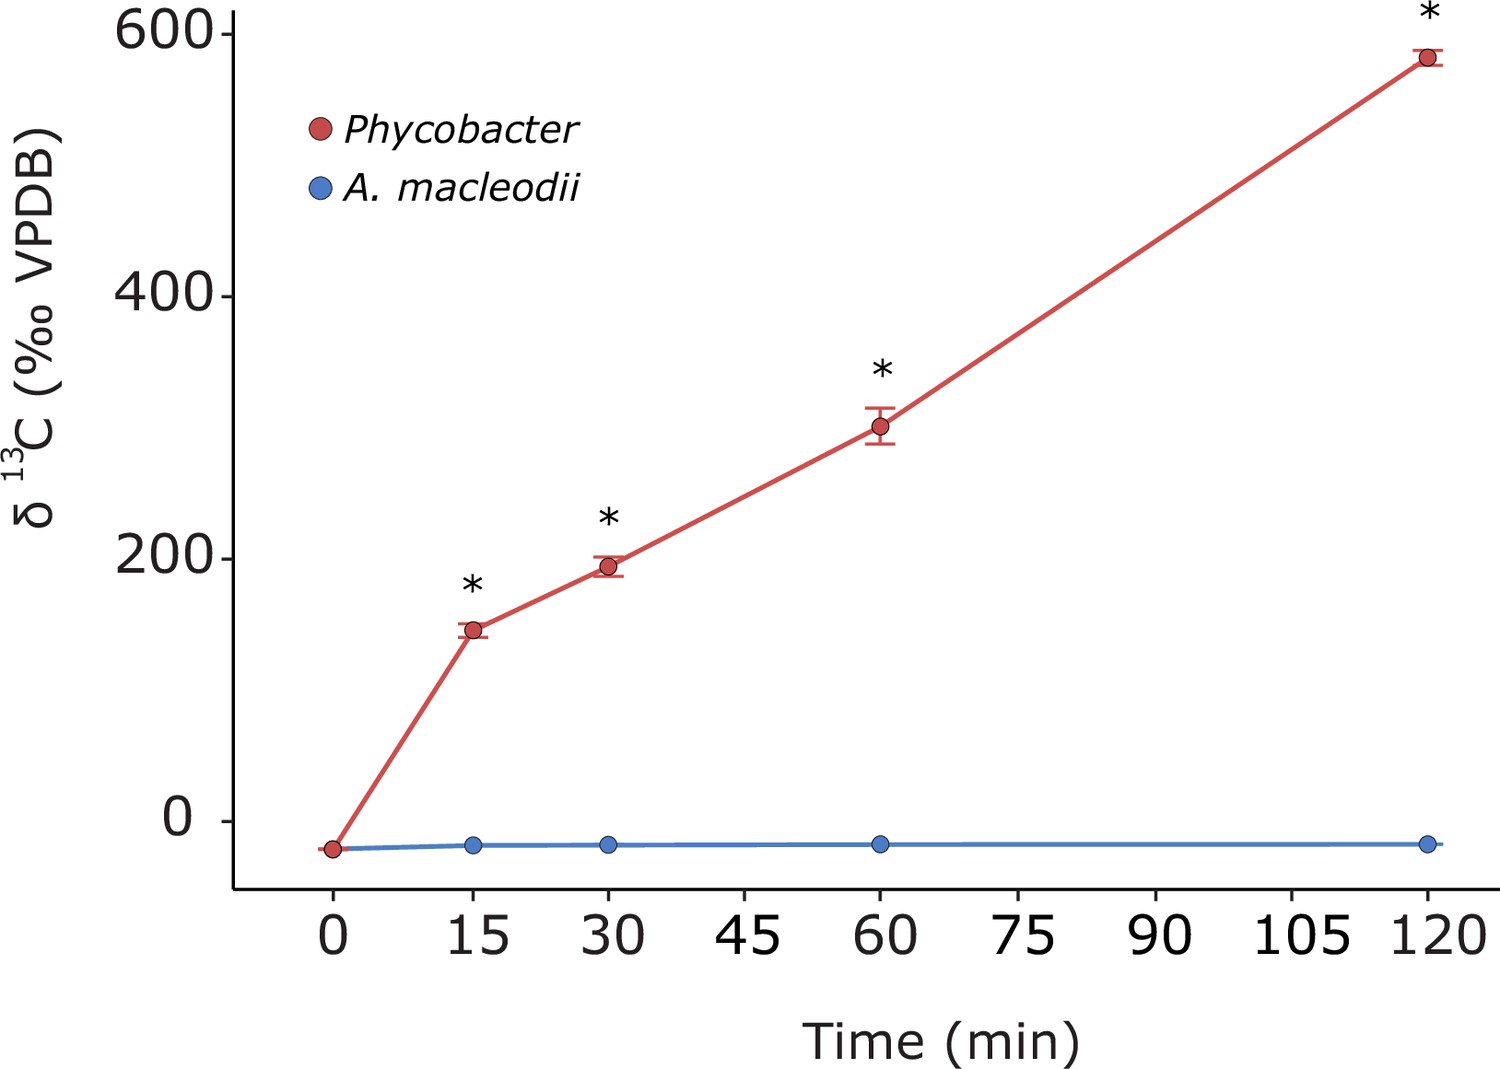
13C-Aze assimilation by Phycobacter and A. macleodii (reported as δ(13C) [‰, VPDB]) during a 2 hr incubation.
VPDB indicates Vienna Pee Dee Belemnite. Asterisks denote significant differences between the two bacteria (repeated-measure ANOVA, n=3, p<0.001). Error bars indicate the standard deviation of the mean.
Figure 3
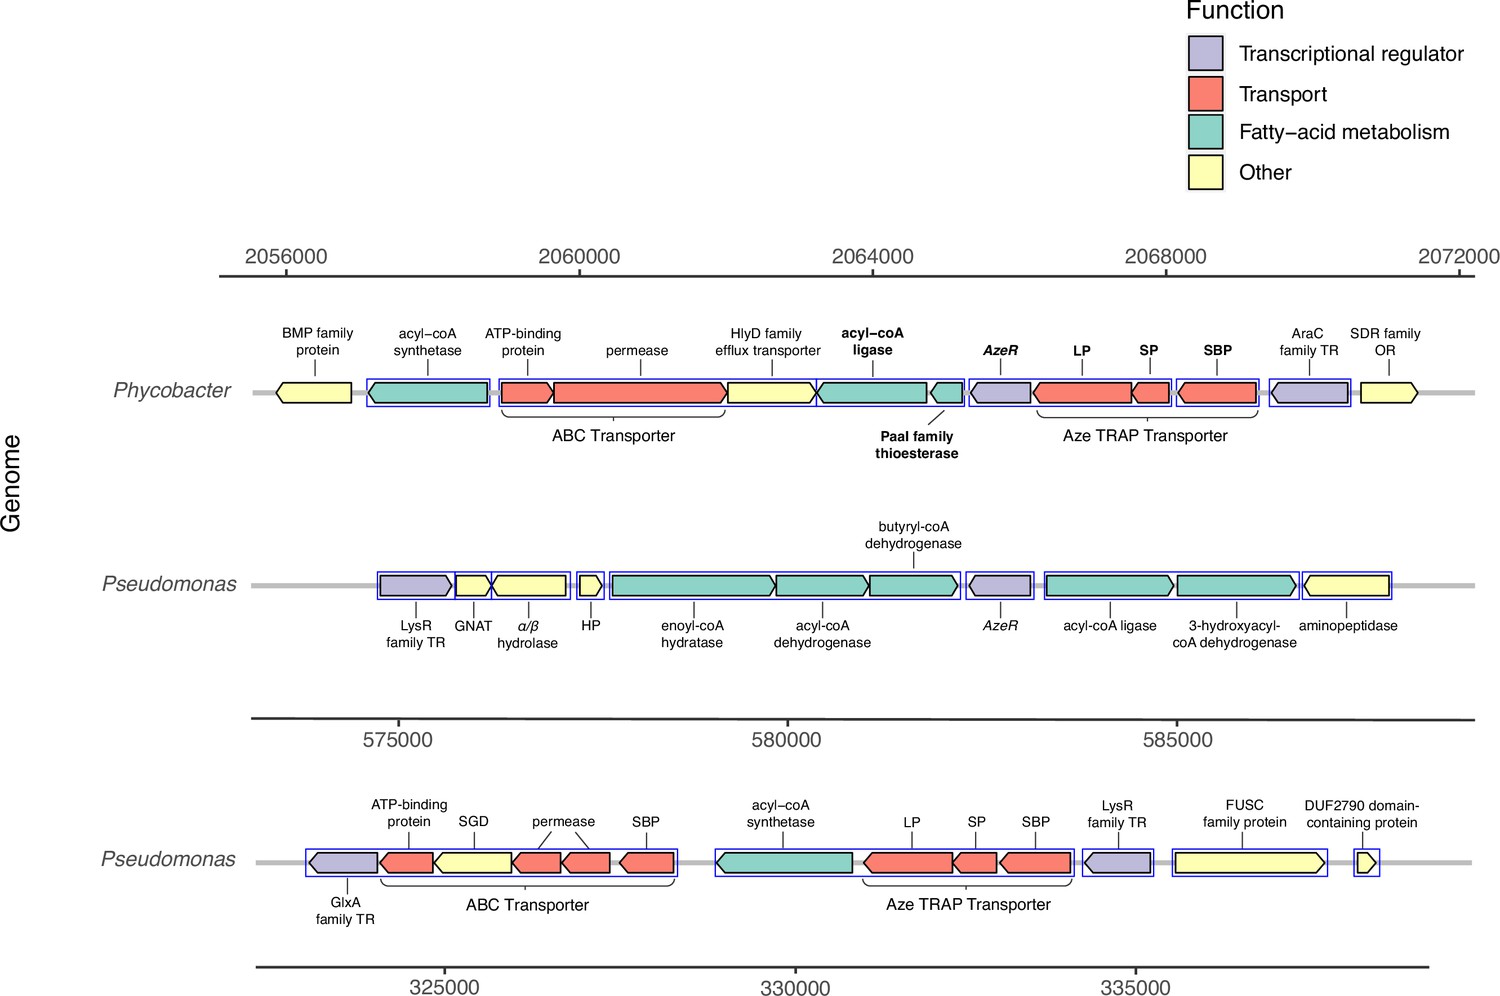
Genomic neighborhood structure of azeR and azeTSL in Phycobacter and P. nitroreducens DSM9128.
Genes predicted in silico to belong to a single operon are marked by blue boxes. Bold-faced gene abbreviations in Phycobacter denote upregulated genes in response to azelaic acid (Aze). Operon prediction was carried out on OperonMapper (Taboada et al., 2018). azeT = substrate-binding protein, azeS = small permease, azeL = large permease, azeR = transcriptional regulator, TR = transcriptional regulator, OR = oxidoreductase, HP = hypothetical protein, GNAT = GNAT family N-acetyltransferase, SGD = succinylglutamate desuccinylase, SBP = substrate-binding protein.
Figure 4
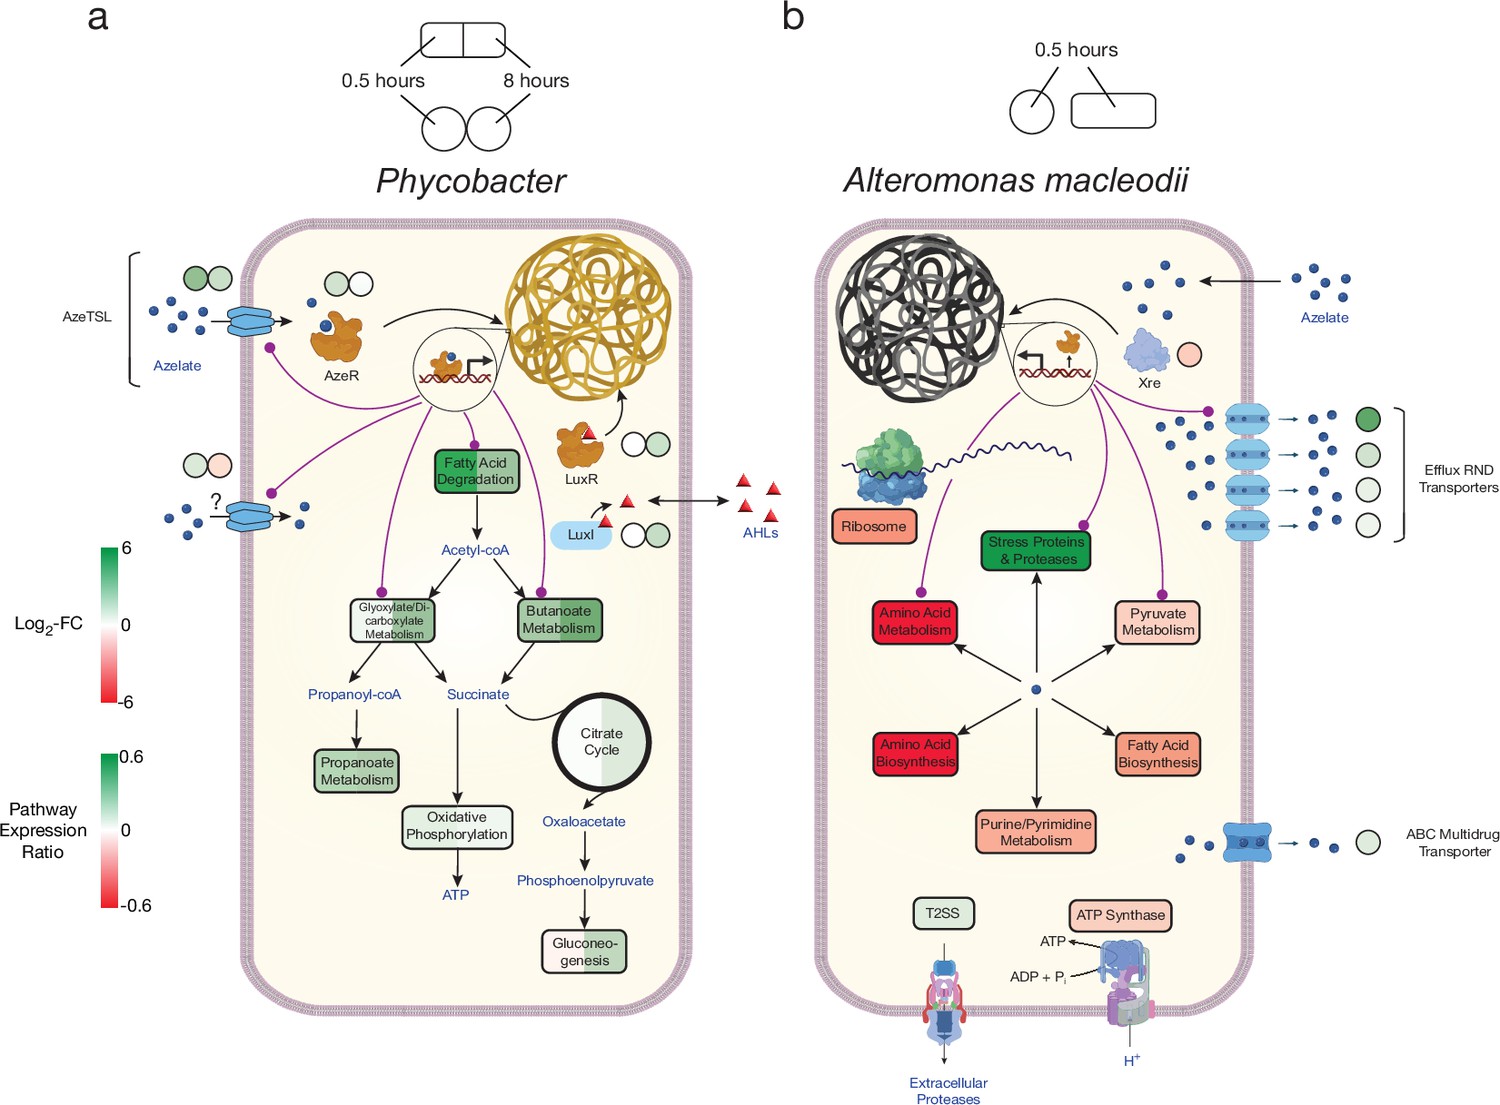
Model of azelaic acid (Aze) catabolism in Phycobacter and toxic effects in A. macleodii.
Colored boxes and circles represent metabolic pathway expression ratios and differential gene expression (log2 fold-change), respectively, at 0.5 and 8 hr for (a) Phycobacter and at 0.5 hr for (b) A. macleodii. White circles/boxes indicate non-statistically significant differentially expressed (DE) genes/silent pathways. Putative transcriptional factor regulation of pathways/genes is shown by purple lines. Log2 fold-change values shown for all transporters represent the mean log2 fold-change value of all genes in the cluster. Pathway expression ratios were the same as in Figure 1 except the sign of the ratio (indicating up- or downregulation) are shown. Amino acid biosynthesis and metabolism ratios in (b) are outside the range of the pathway expression ratio scale (values ~1.5) but are colored in dark red to indicate significant downregulation. T2SS = Type II secretion system, AHLs = acyl-homoserine lactones.
Figure 5 with 1 supplement
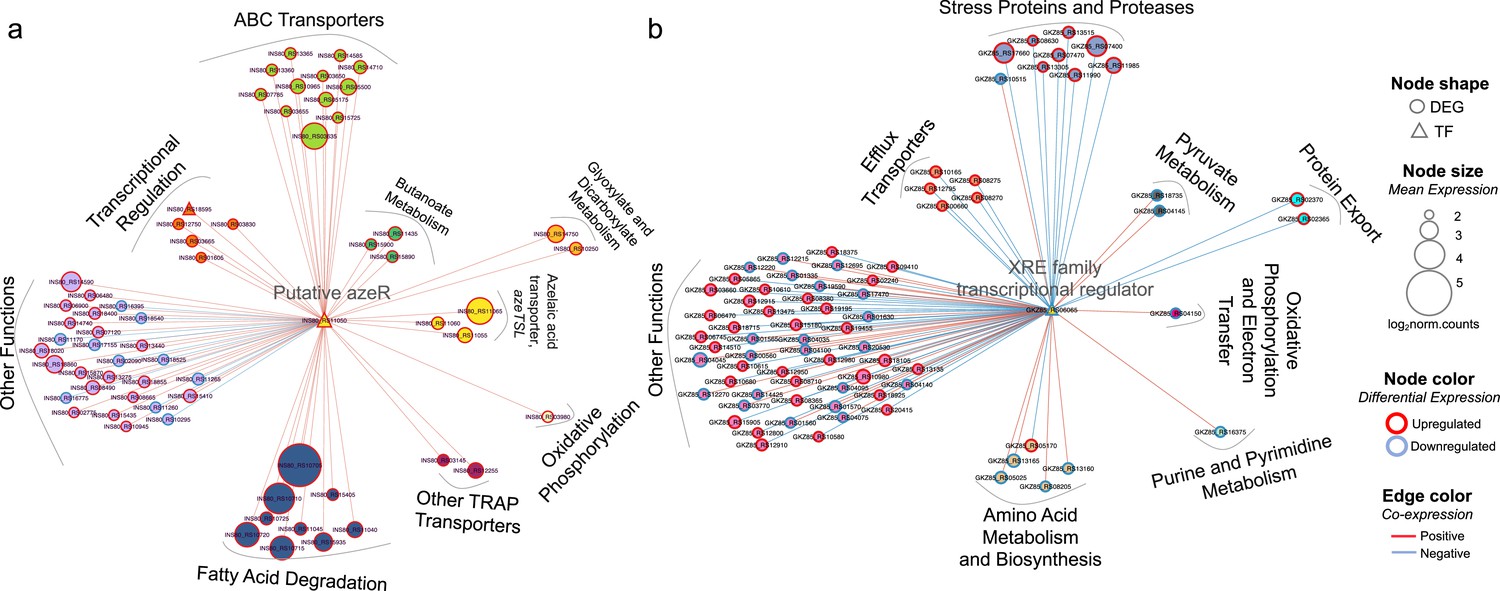
Transcriptional coexpression networks of hub transcriptional factors (TFs) azeR and xre, and their putative target genes in Phycobacter and A. macleodii.
Nodes represent genes (circles) and TFs (triangles) connected by edges based on significant coexpression correlation (PCIT; r≥0.95) for (a) Phycobacter and (b) A. macleodii. Nodes are grouped based on functions and represented by different colors. The size of the node corresponds to the normalized mean expression values in azelaic acid (Aze)-treated samples, whereas the color of the node border corresponds to differential expression. Edge colors indicate the direction of the correlation between each gene pair. DEG = differentially expressed gene, TF = transcriptional factor.
Figure 5—figure supplement 1
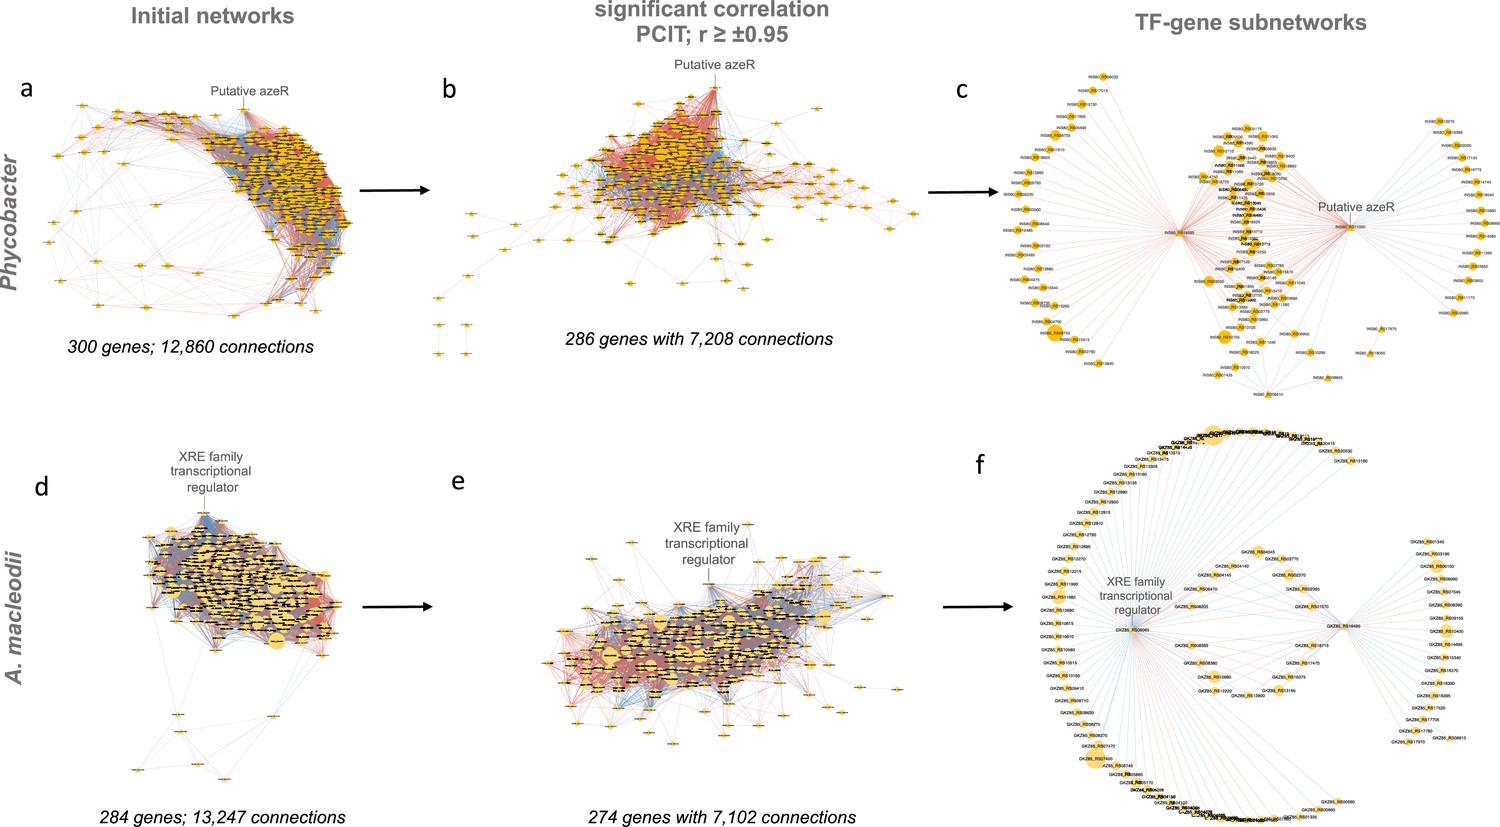
Transcriptional coexpression networks constructed using the partial correlation coefficient with information theory algorithm in Phycobacter and A. macleodii.
Initial networks (a, d) consisted of key transcriptional factors (TFs) (identified by regulatory impact factor analysis) and differentially expressed genes. Nodes are depicted either as circles for genes or triangles for TFs. Edges represent significant interactions between nodes. Edge color represents directions of the interaction (red = positive correlation and blue = negative correlation). The size of the node corresponds to the normalized mean expression values in azelaic acid (Aze)-treated samples. Subnetworks were extracted from initial networks based on significant coexpression correlation (PCIT; r ≥±0.95) (b, e) and those containing only hub genes (identified based on regulatory impact factor [RIF] scores, differential expression, and the degree centrality) and their connected genes (c, f).
Figure 6 with 3 supplements
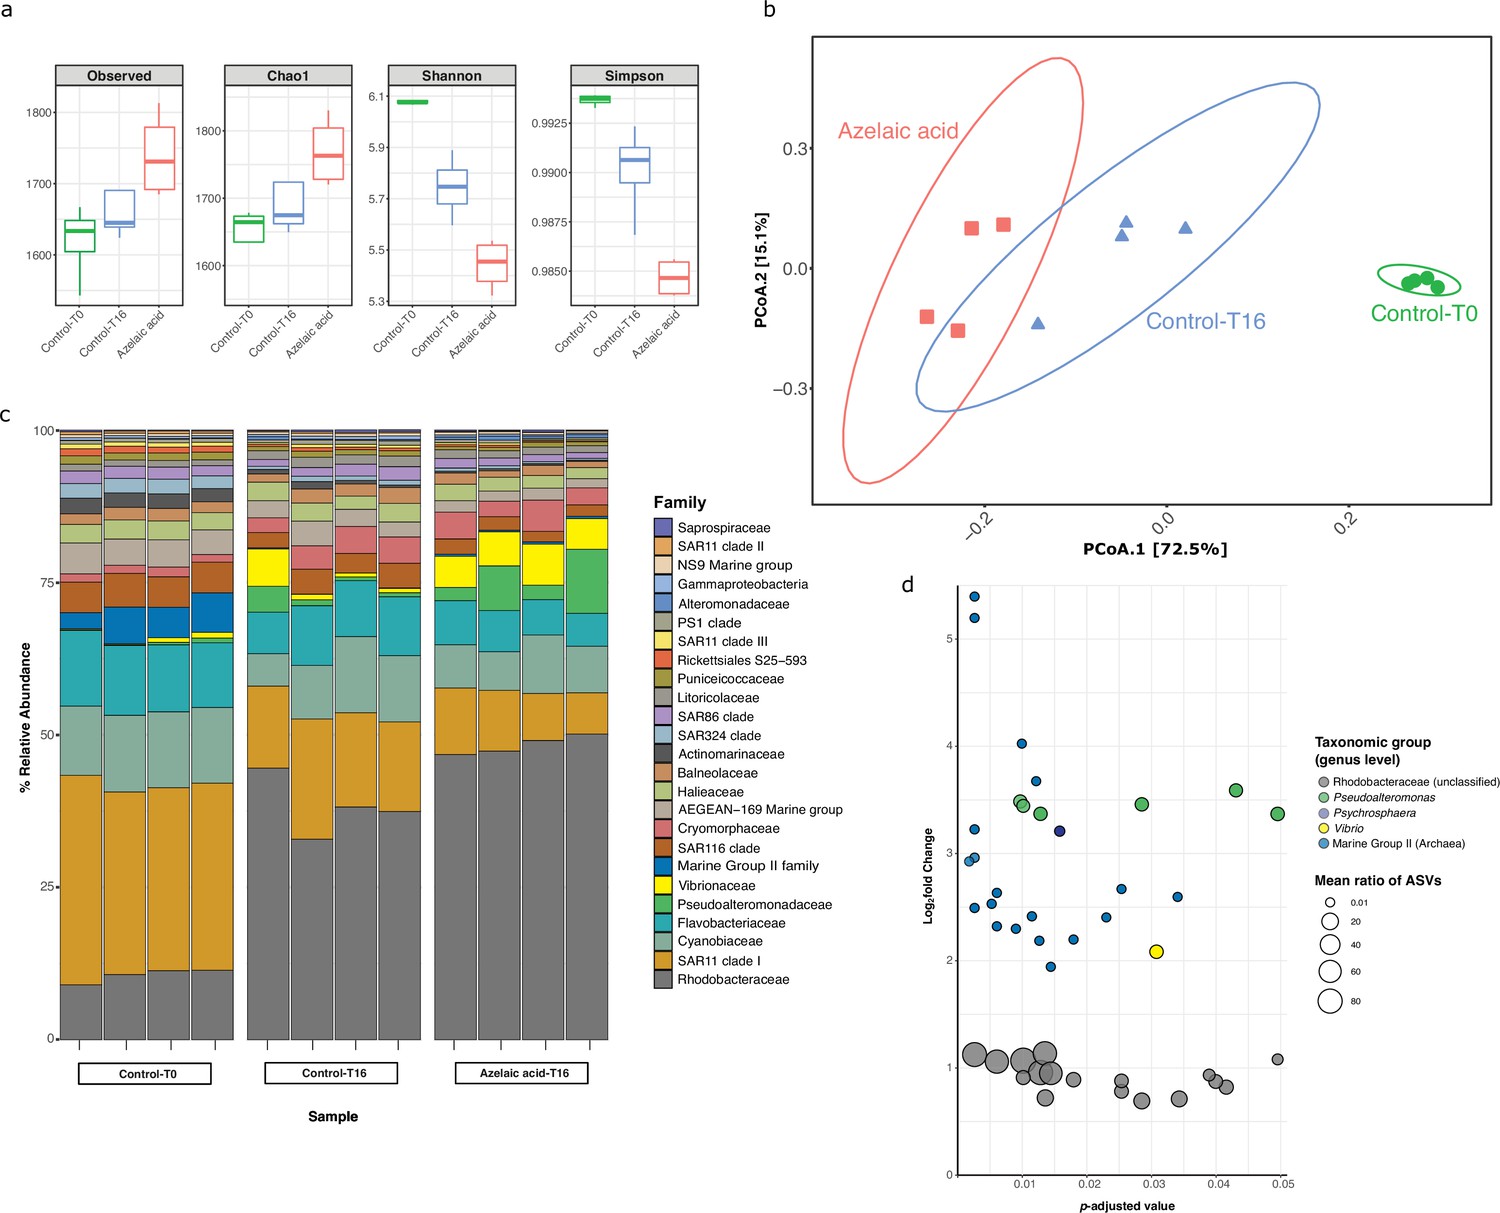
Bacterial and archaeal diversity in seawater treated with azelaic acid (Aze).
(a) Alpha-diversity indices of observed OTUs, Chao1, Shannon and Simpson across the Aze-treated and control samples. (b) Principal coordinate analysis (PCoA) of Bray-Curtis distances (permutational analysis of variance [PERMANOVA]: R2=0.73; p<0.001) between samples. The two principal components (PCoA1 and PCoA2) explained 72.5% and 15.1% variance, respectively. (c) Relative abundance of the top 25 microbial families based on 16S rRNA gene amplicon sequencing of Aze-treated samples at T=16 hr and control samples at T=0 and T=16 hr. (d) Distribution of the amplicon sequence variants (ASVs) belonging to significantly differentially abundant taxa between the Aze-treated and control samples at T=16 hr, according to their log2 fold-change and p-adjusted values. The bubble size indicates the mean taxonomic proportion of each ASV, calculated as the mean number of reads in an ASV: mean number of reads present in all ASVs of the same taxonomic classification. The bubble color indicates the taxonomic classification of each ASV according to (c).
Figure 6—figure supplement 1
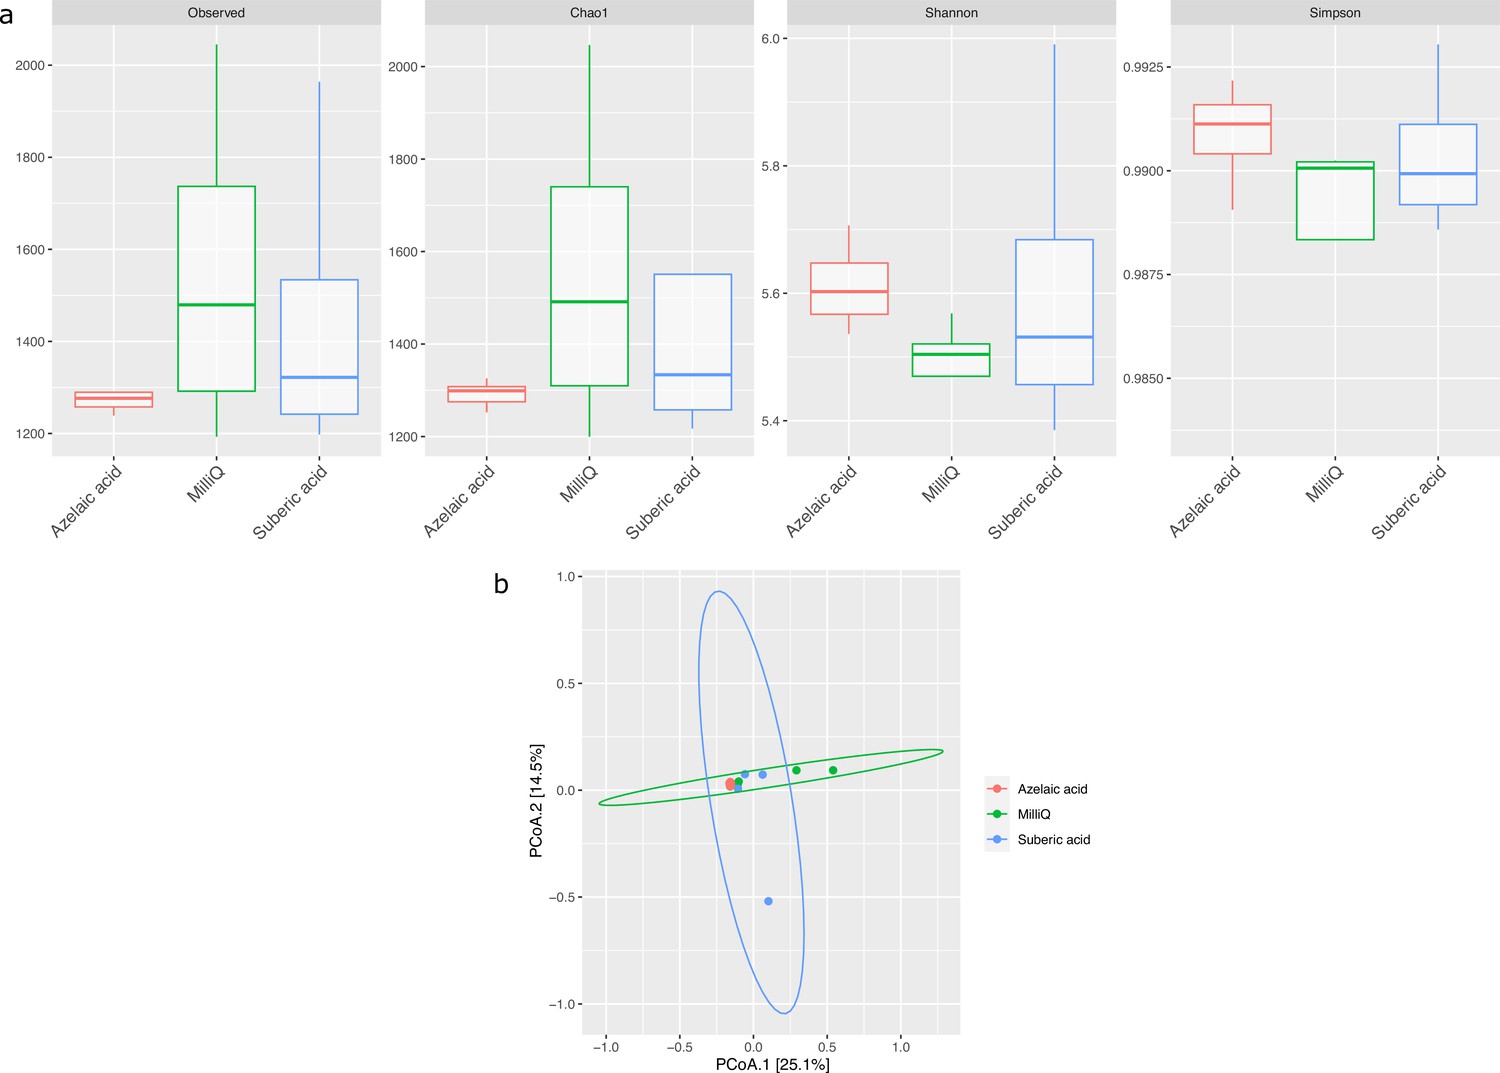
Effect of azelaic acid (Aze) treatment on the alpha- and beta-diversity of soil.
(a) Alpha-diversity indices of observed OTUs, Chao1, Shannon and Simpson across the Aze-treated and control samples. (b) Principal coordinate analysis (PCoA) of Bray-Curtis distances (permutational analysis of variance [PERMANOVA]: R2=0.73; p<0.001) between samples. The two principal components (PCoA1 and PCoA2) explained 25.1% and 14.5% variance, respectively.
Figure 6—figure supplement 2
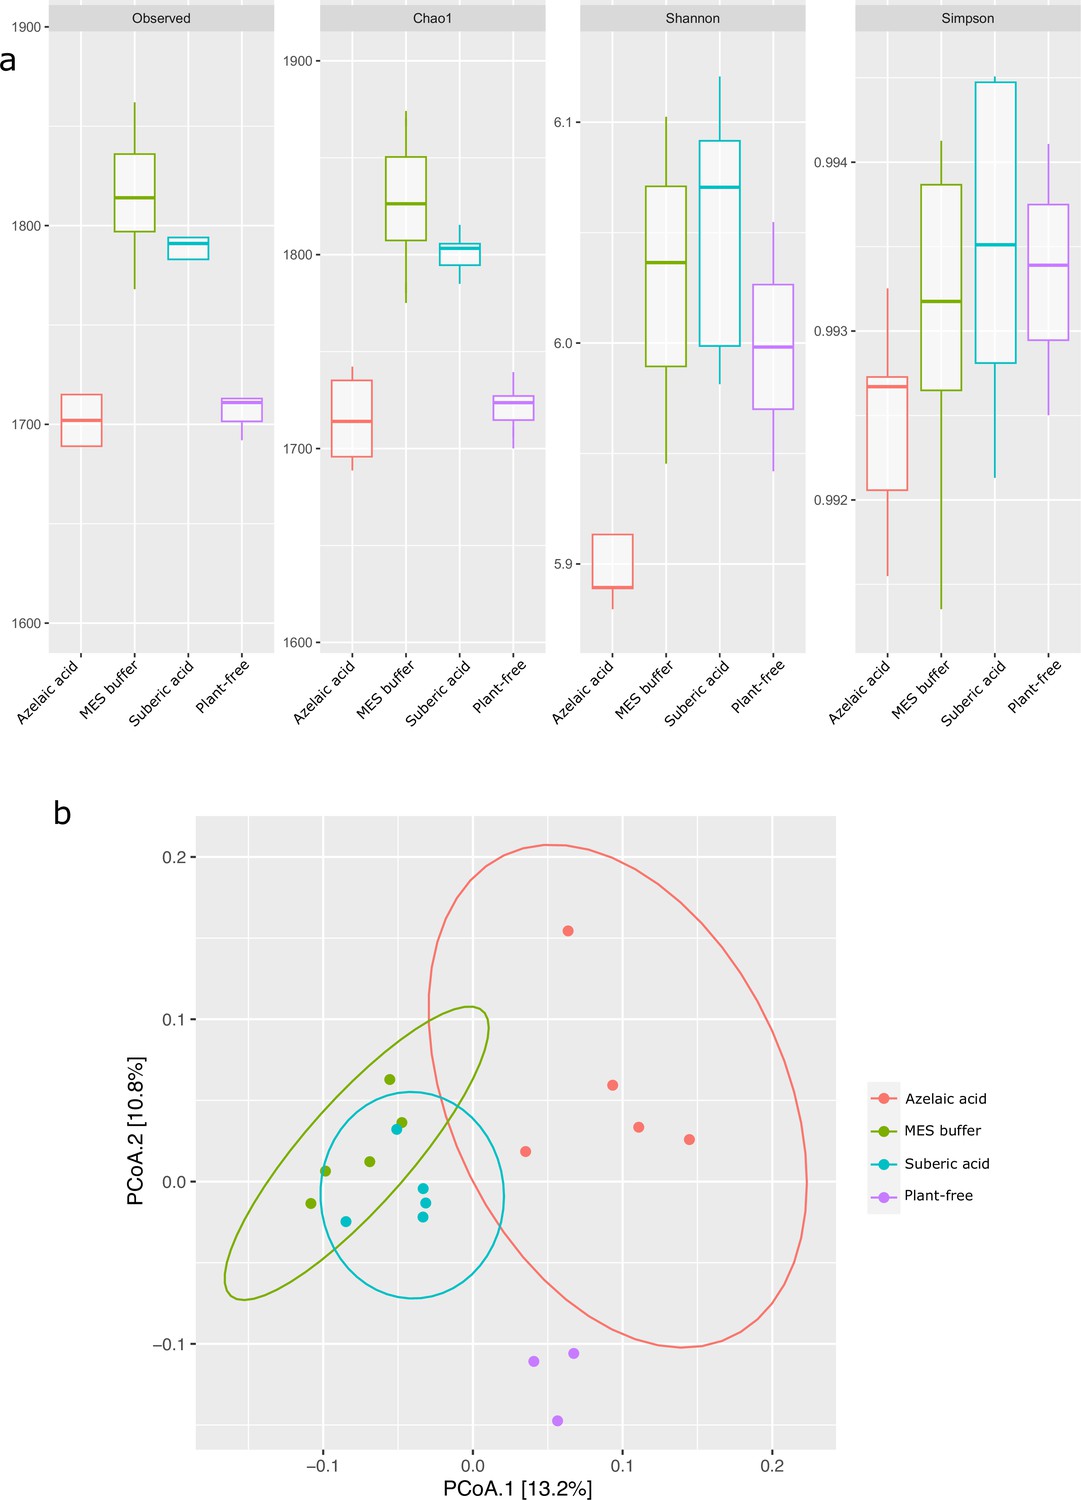
Effect of azelaic acid (Aze) treatment on the alpha- and beta-diversity of A. thaliana root microbiome.
(a) Alpha-diversity indices of observed OTUs, Chao1, Shannon and Simpson across the Aze-treated and control treatments. (b) Principal coordinate analysis (PCoA) of unweighted Unifrac distances between Aze treatment and controls (permutational analysis of variance [PERMANOVA], p<0.05). The two principal components (PCoA1 and PCoA2) explained 13.2% and 10.8% variance, respectively.
Figure 6—figure supplement 3
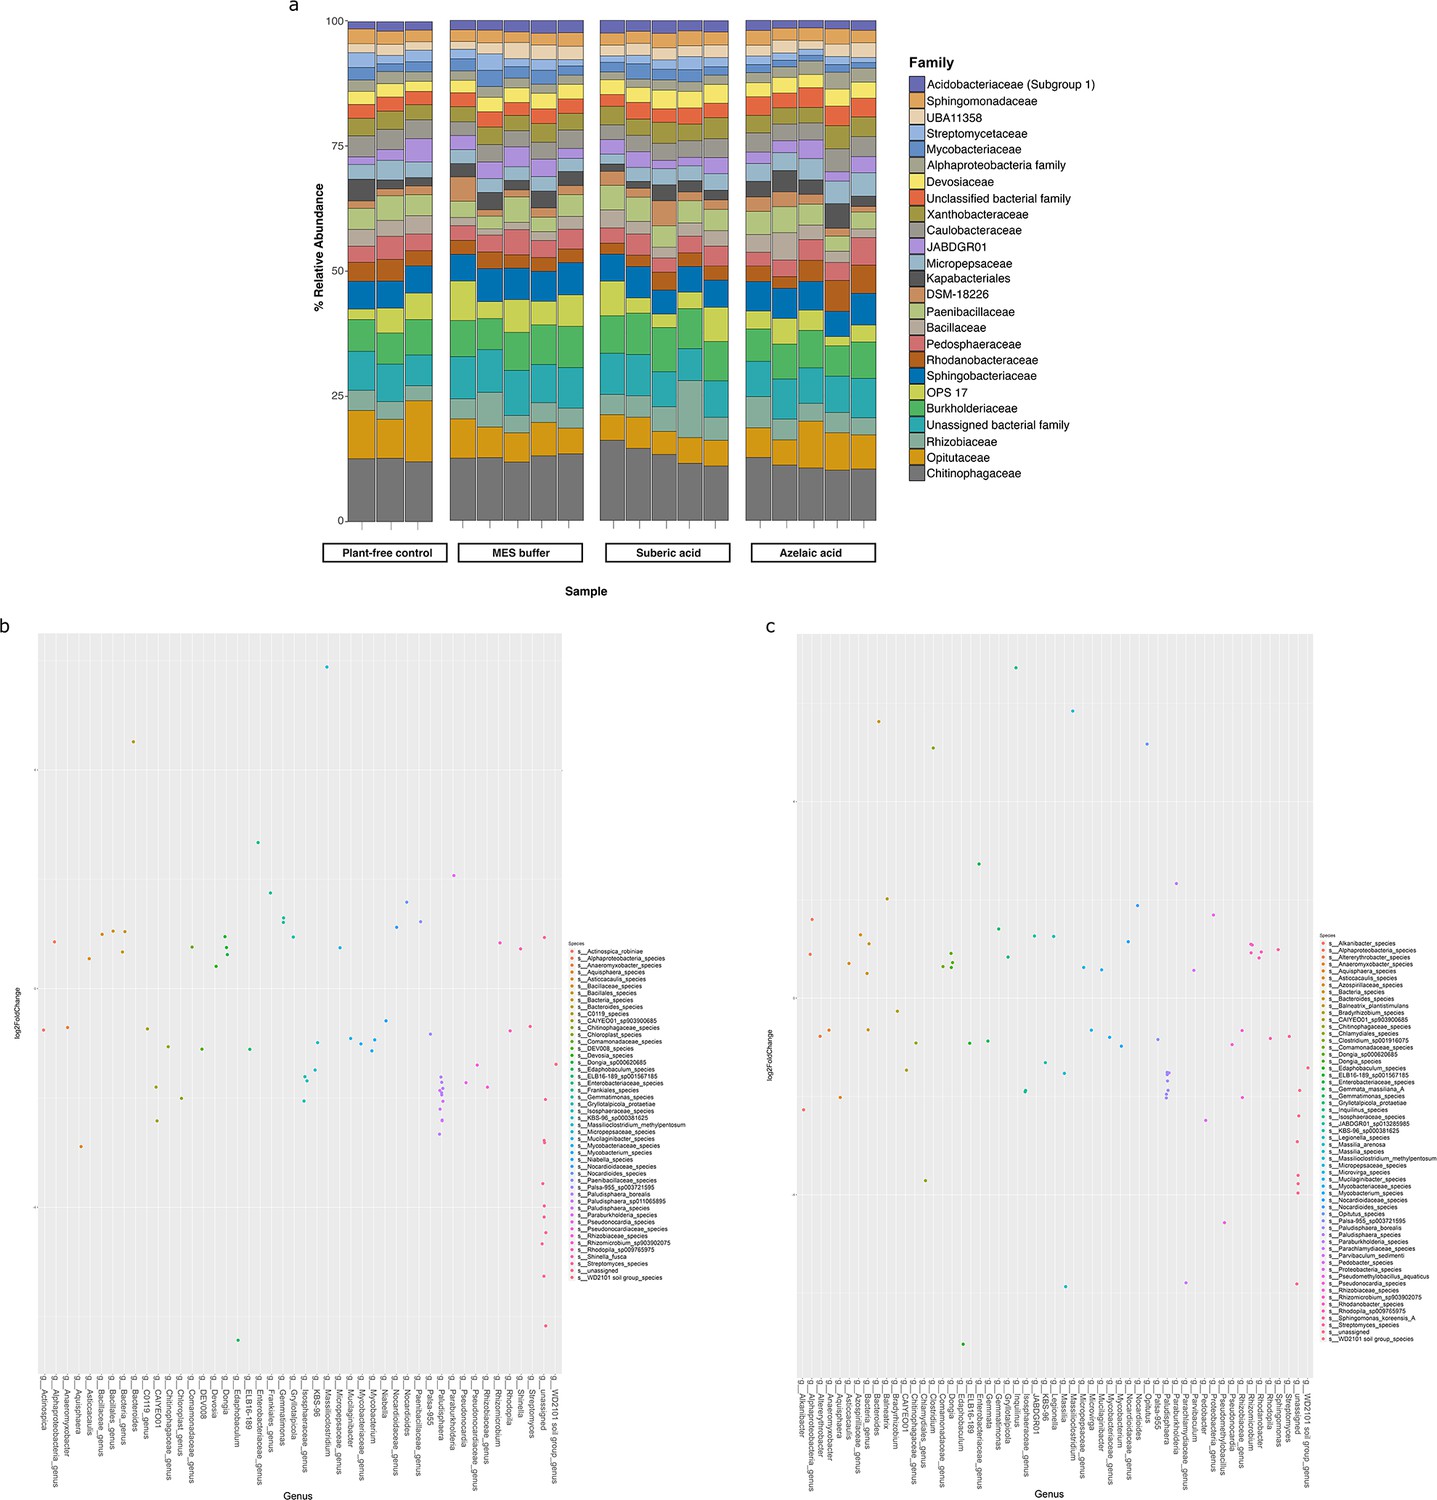
Bacterial diversity in the roots of A. thaliana treated with azelaic acid (Aze).
(a) Relative abundance of the top 25 microbial families based on 16S rRNA gene amplicon sequencing of A. thaliana root microbiome following Aze infiltration. Plant-free control is untreated soil and MES buffer and suberic acid are treatment controls. (b) Distribution of the amplicon sequence variants (ASVs) belonging to significantly differentially abundant taxa between the Aze-treated and MES buffer samples according to their log2 fold-change and p-adjusted values. The bubble color denotes the species belonging to each genus on the x-axis. (c) Distribution of the ASVs belonging to significantly differentially abundant taxa between the Aze-treated and suberic acid samples according to their log2 fold-change and p-adjusted values. Bubble colors denote the species belonging to each genus on the x-axis.
Additional files
-
Supplementary file 1
A summary of the differentially expressed (DE) genes in Phycobacter and A. macleodii.
The first worksheet summarizes the number of DE genes for Phycobacter at 0.5 and 8 hr and A. macleodii at 8 hr in response to azelaic acid. Percent values represent the ratio of genes in each category to the total number of genes in each genome. The second, third, and fourth sheets provide the DESeq output data (product ID, baseMean, log2FoldChange, pvalues, etc.) for Phycobacter at 0.5 and 8 hr and A. macleodii at 8 hr.
- https://cdn.elifesciences.org/articles/88525/elife-88525-supp1-v1.xlsx
-
Supplementary file 2
List of selected differentially expressed (DE) genes by (A) Phycobacter and (B) A. macleodii in response to azelaic acid addition.
Genes with no values indicate no statistically significant differential expression compared to controls. Genes were considered significantly DE if they had a p-adjusted value of <0.05 and a log2 fold-change of ≥±0.50. Genes predicted to be in a single operon structure are listed in the direction of transcription within a single box, where relevant. Genes operon structures were predicted by OperonMapper. Genes common to more than one pathway are listed only once.
- https://cdn.elifesciences.org/articles/88525/elife-88525-supp2-v1.xlsx
-
Supplementary file 3
List of all differentially expressed (DE) genes by (A) Phycobacter and (B) A. macleodii in response to azelaic acid addition.
Genes were considered significantly DE if they had a p-adjusted value of <0.05 and a log2 fold-change of ≥±0.50.
- https://cdn.elifesciences.org/articles/88525/elife-88525-supp3-v1.xlsx
-
Supplementary file 4
Characteristics of 13C-Aze uptake by Phycobacter and A. macleodii.
(A) Carbon fractionation and uptake rate of bacteria exposed to 13C-Aze. (B) 13C-labeled metabolites detected in Phycobacter after incubation with 13C-Aze.
- https://cdn.elifesciences.org/articles/88525/elife-88525-supp4-v1.xlsx
-
Supplementary file 5
Transcriptional factors (TFs) with significant regulatory impact factor (RIF) score and their differential gene expression in Phycobacter and A. macleodii.
- https://cdn.elifesciences.org/articles/88525/elife-88525-supp5-v1.xlsx
-
MDAR checklist
- https://cdn.elifesciences.org/articles/88525/elife-88525-mdarchecklist1-v1.docx
Download links
A two-part list of links to download the article, or parts of the article, in various formats.
Downloads (link to download the article as PDF)
Open citations (links to open the citations from this article in various online reference manager services)
Cite this article (links to download the citations from this article in formats compatible with various reference manager tools)
Molecular mechanisms of microbiome modulation by the eukaryotic secondary metabolite azelaic acid
eLife 12:RP88525.
https://doi.org/10.7554/eLife.88525.3


