Trends in self-citation rates in high-impact neurology, neuroscience, and psychiatry journals
- Department of Biomedical Engineering, Yale University, United States
- Department of Radiology & Biomedical Imaging, Yale School of Medicine, United States
- Department of Computer Science, Yale University, United States
- Interdepartmental Neuroscience Program, Yale University, United States
- Child Study Center, Yale School of Medicine, United States
- Department of Bioengineering, Northeastern University, United States
- Department of Psychology, Northeastern University, United States
- 8Department of Statistics & Data Science, Yale University, United States
Figures
Figure 1 with 1 supplement
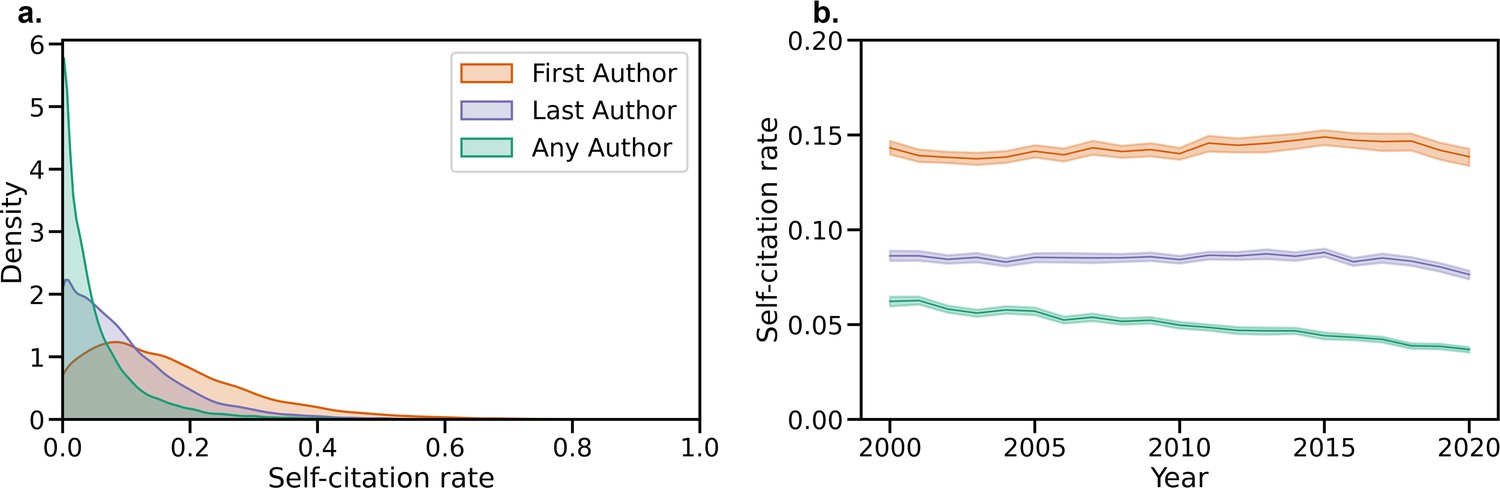
Visualizing recent self-citation rates and temporal trends.
(a) Kernel density estimate of the distribution of First Author, Last Author, and Any Author self-citation rates in the last five years. (b) Average self-citation rates over every year since 2000, with 95% confidence intervals calculated by bootstrap resampling.
Figure 1—figure supplement 1

Temporal trends in First Author, Last Author, and Any Author self-citation rates from 2000 to 2020 in Neurology, Neuroscience, and Psychiatry papers.
Shaded regions show 95% confidence intervals calculated with bootstrap resampling.
Figure 2 with 1 supplement
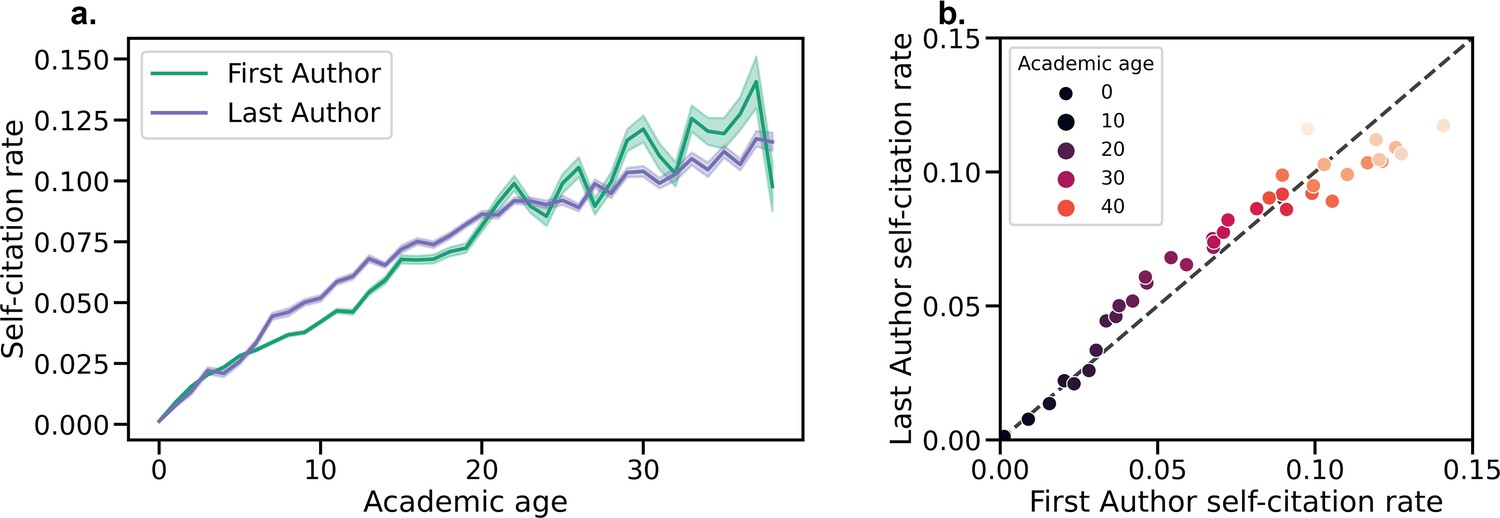
Average self-citation rates for each academic age in years 2016–2020.
(a) Self-citation rate vs. academic age for both First and Last Authors. Shaded regions show 95% confidence intervals obtained via bootstrap resampling. (b) Comparison of self-citation rates by academic age for First and Last Authors. For a given academic age, a single point is plotted as (x=First Author self-citation rate for authors of academic age a, y=Last Author self-citation rate for authors of academic age a). The dashed line represents the y=x line, and the coloring of the points from dark to light represents increasing academic age.
Figure 2—figure supplement 1
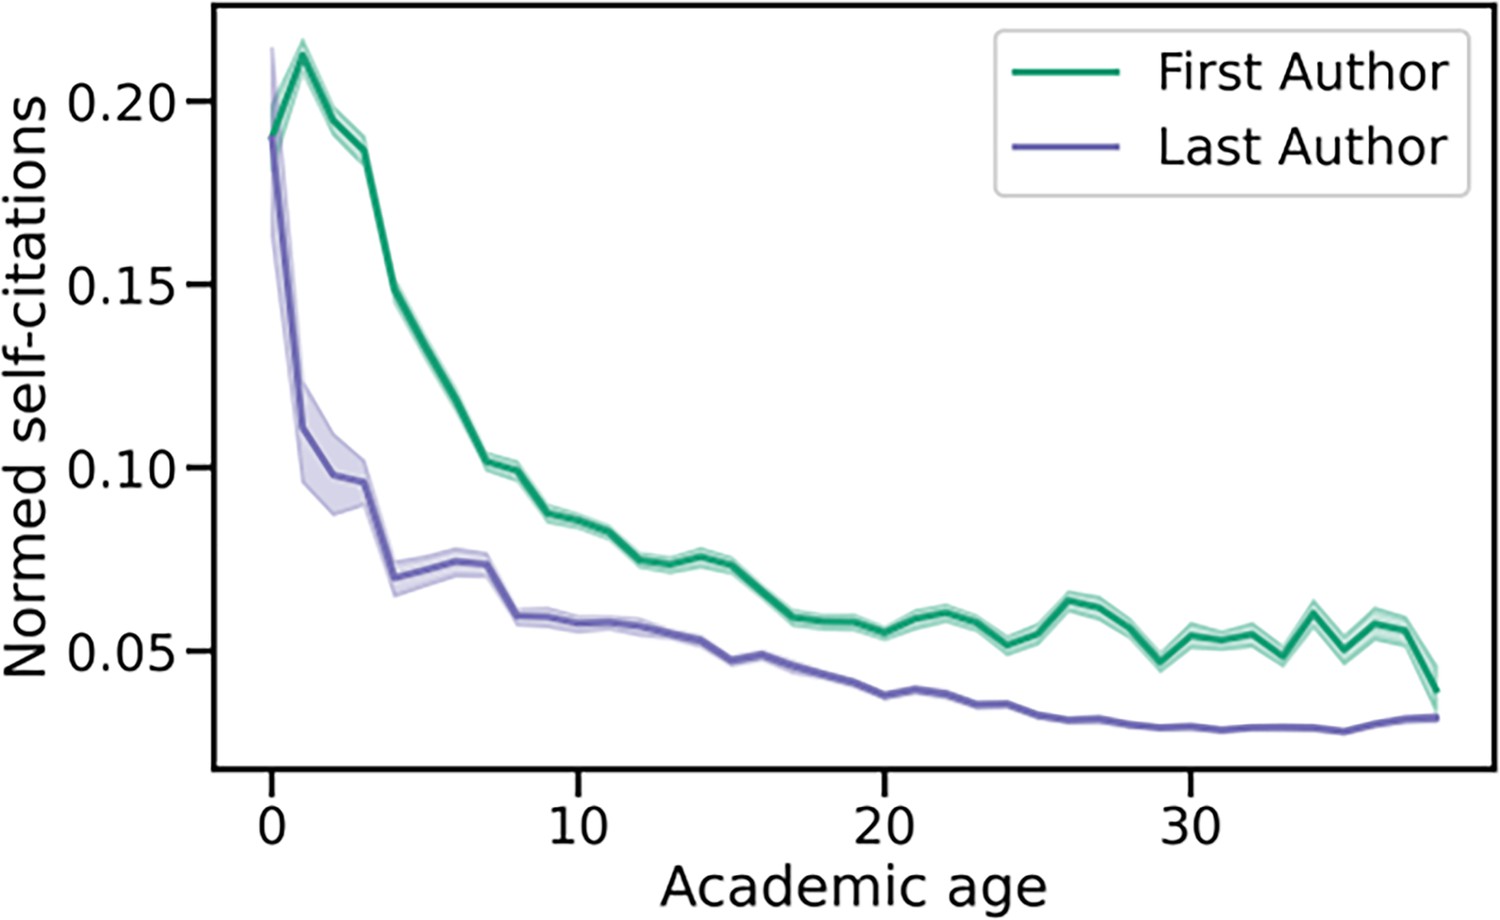
Average of normalized self-citation counts for each academic age in years 2016–2020.
For the normed self-citation counts, the number of self-citations were divided by the number of previously published papers by the author.
Figure 3 with 1 supplement
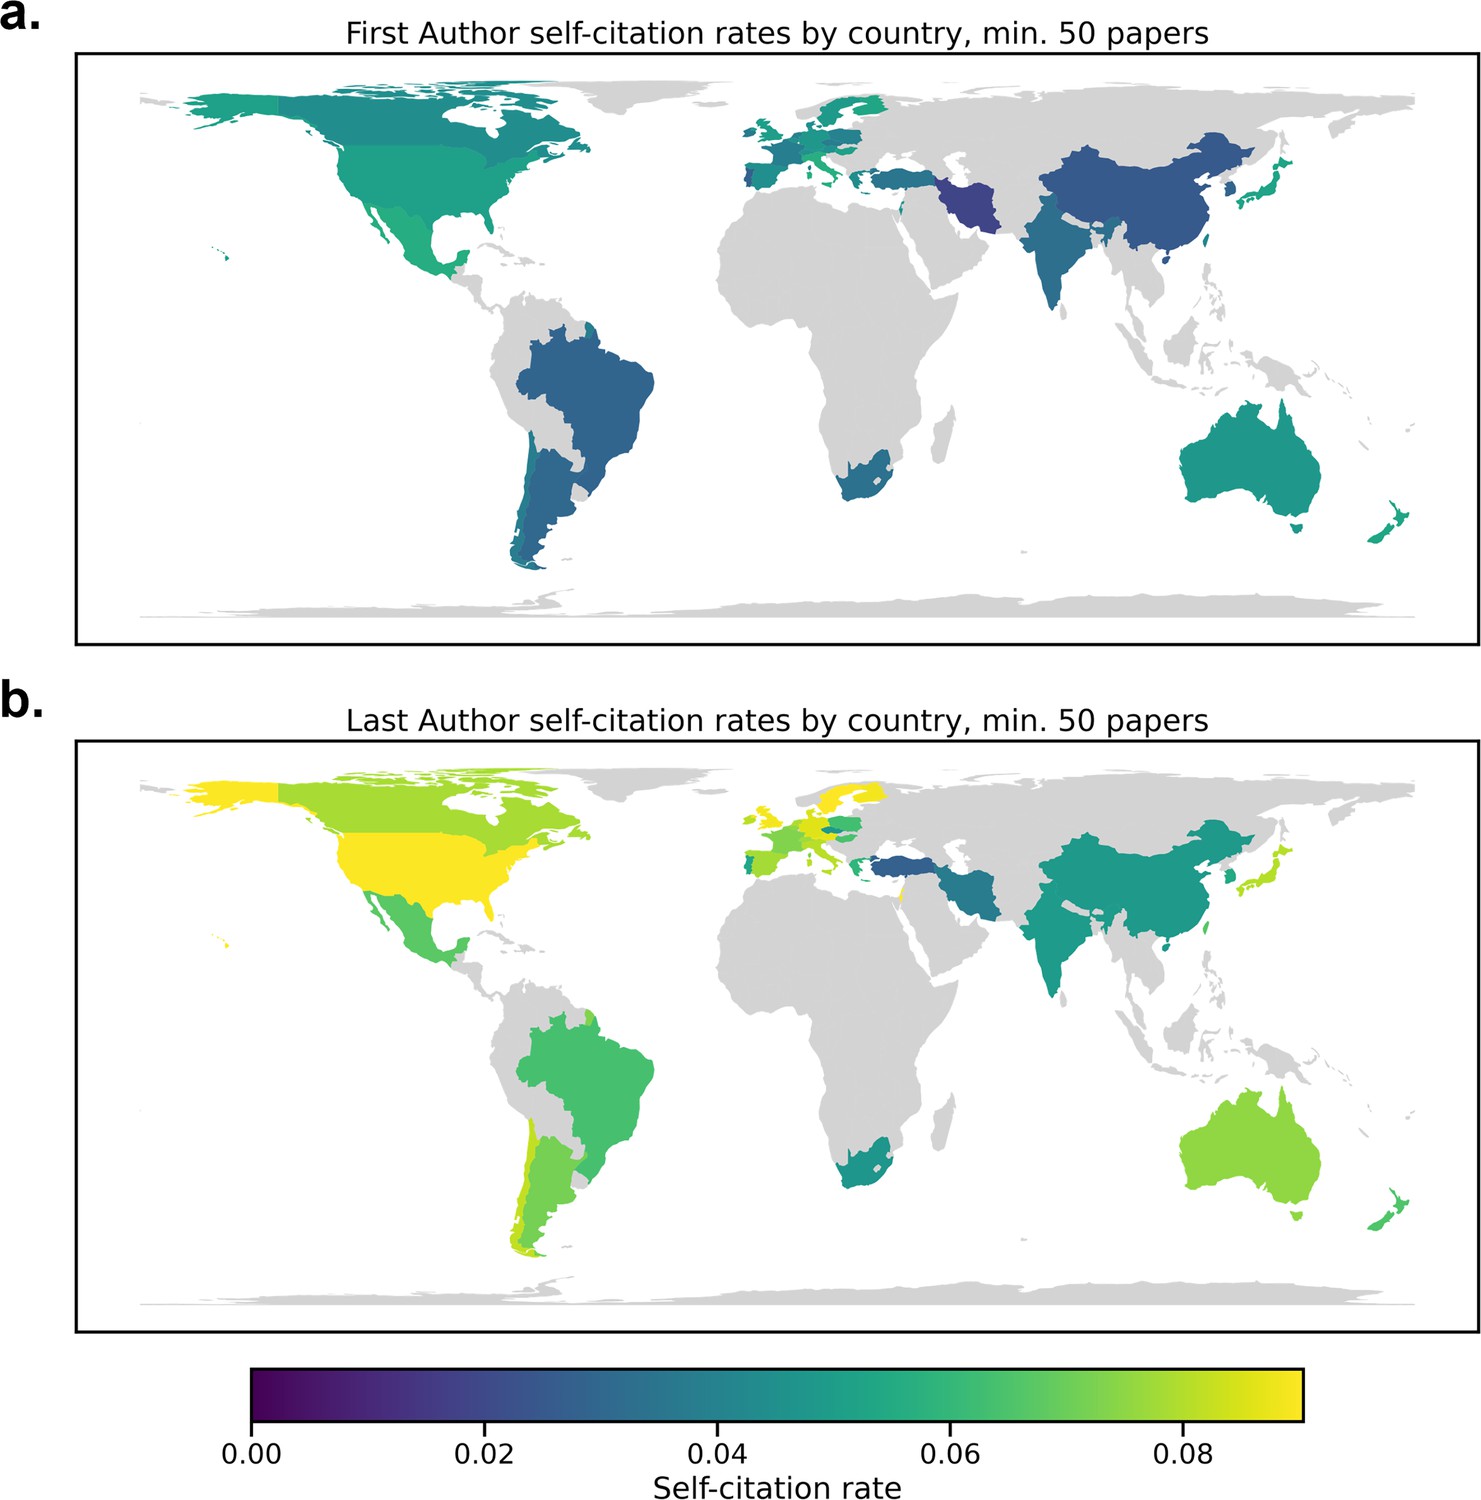
Self-citation rates by country for First and Last Authors from 2016 to 2020.
First Author data are presented in (a), and Last Author data are shown in panel (b). Only countries with >50 papers were included in the analysis. Country was determined by the affiliation of the author.
Figure 3—figure supplement 1
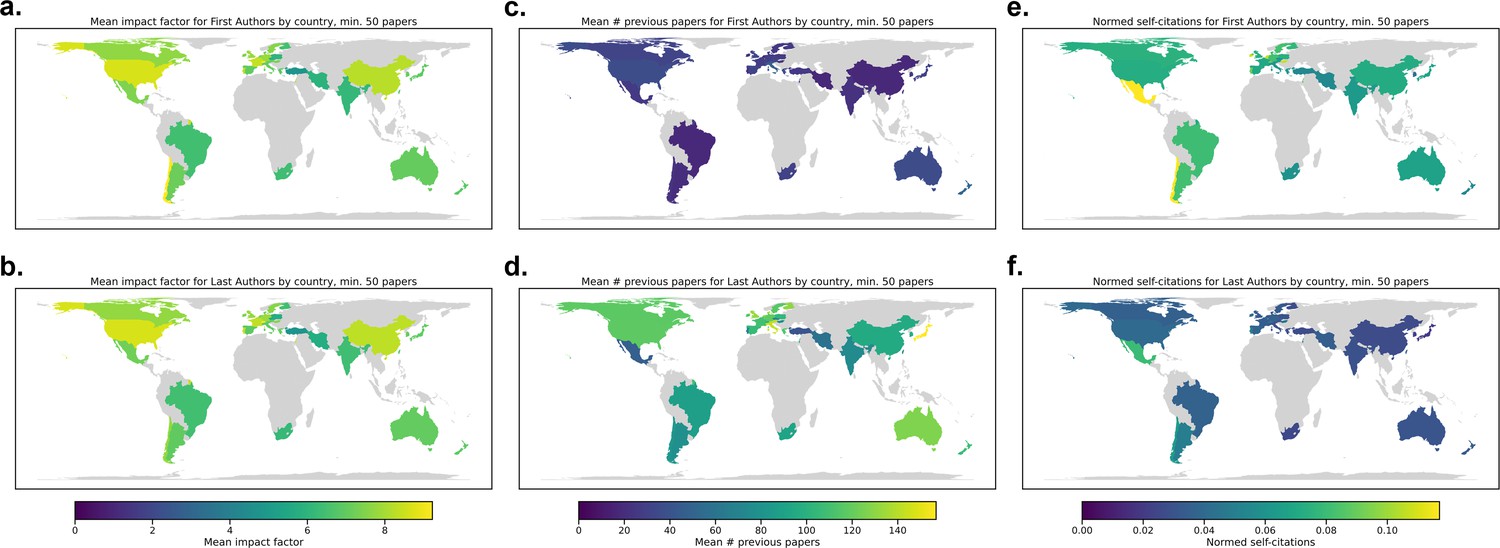
Mean impact factor by country for (a) First Authors and (b) Last Authors.
Mean number of previous papers by country for (c) First Authors and (d) Last Authors. Normed number of self-citations for (e) First Authors and (f) Last Authors. The normed self-citation rate was computed as the number of self-citations divided by the number of previously published papers.
Figure 4 with 4 supplements
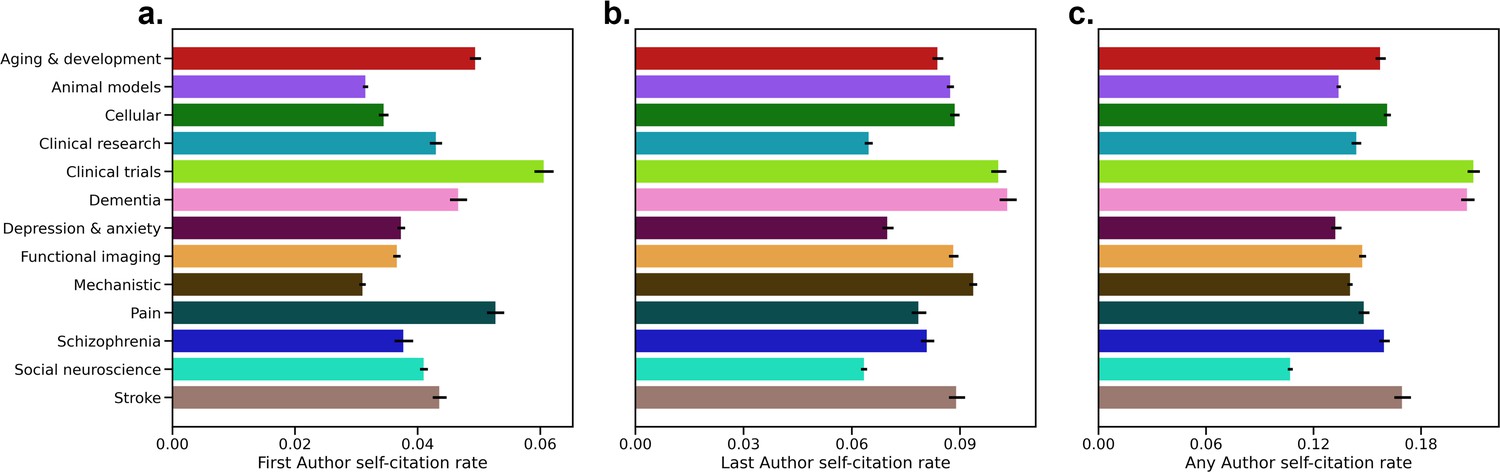
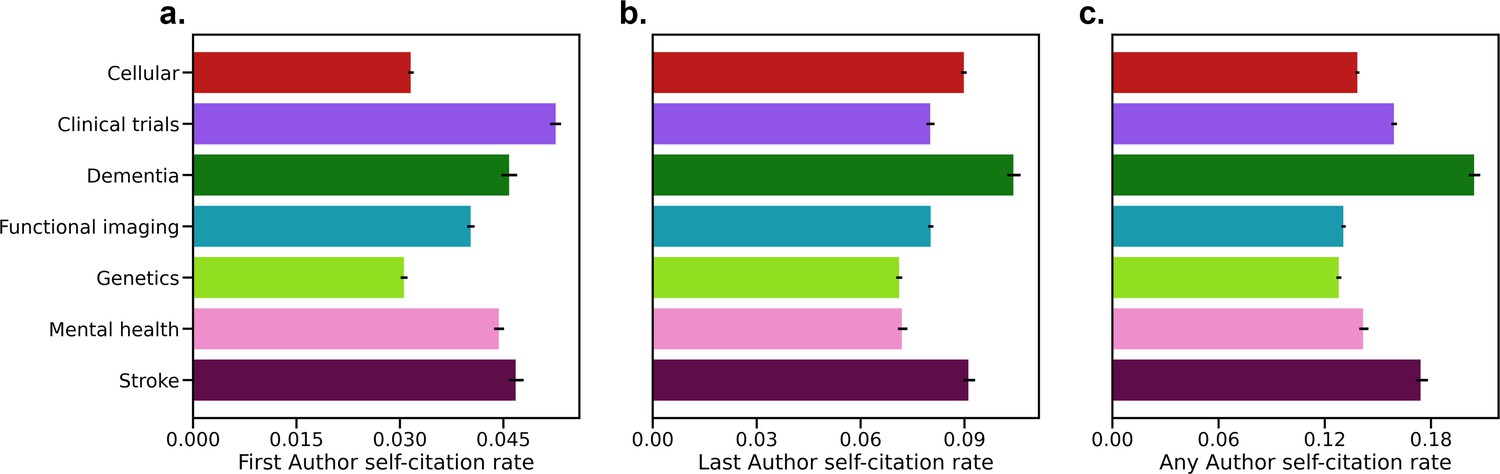
Self-citation rates by topic.
Results are presented for (a) First, (b) Last, and (c) Any Authors. Topics were determined by Latent Dirichlet Allocation. Confidence intervals of the average self-citation rate are shown based on 1000 iterations of bootstrap resampling.
Figure 4—figure supplement 1
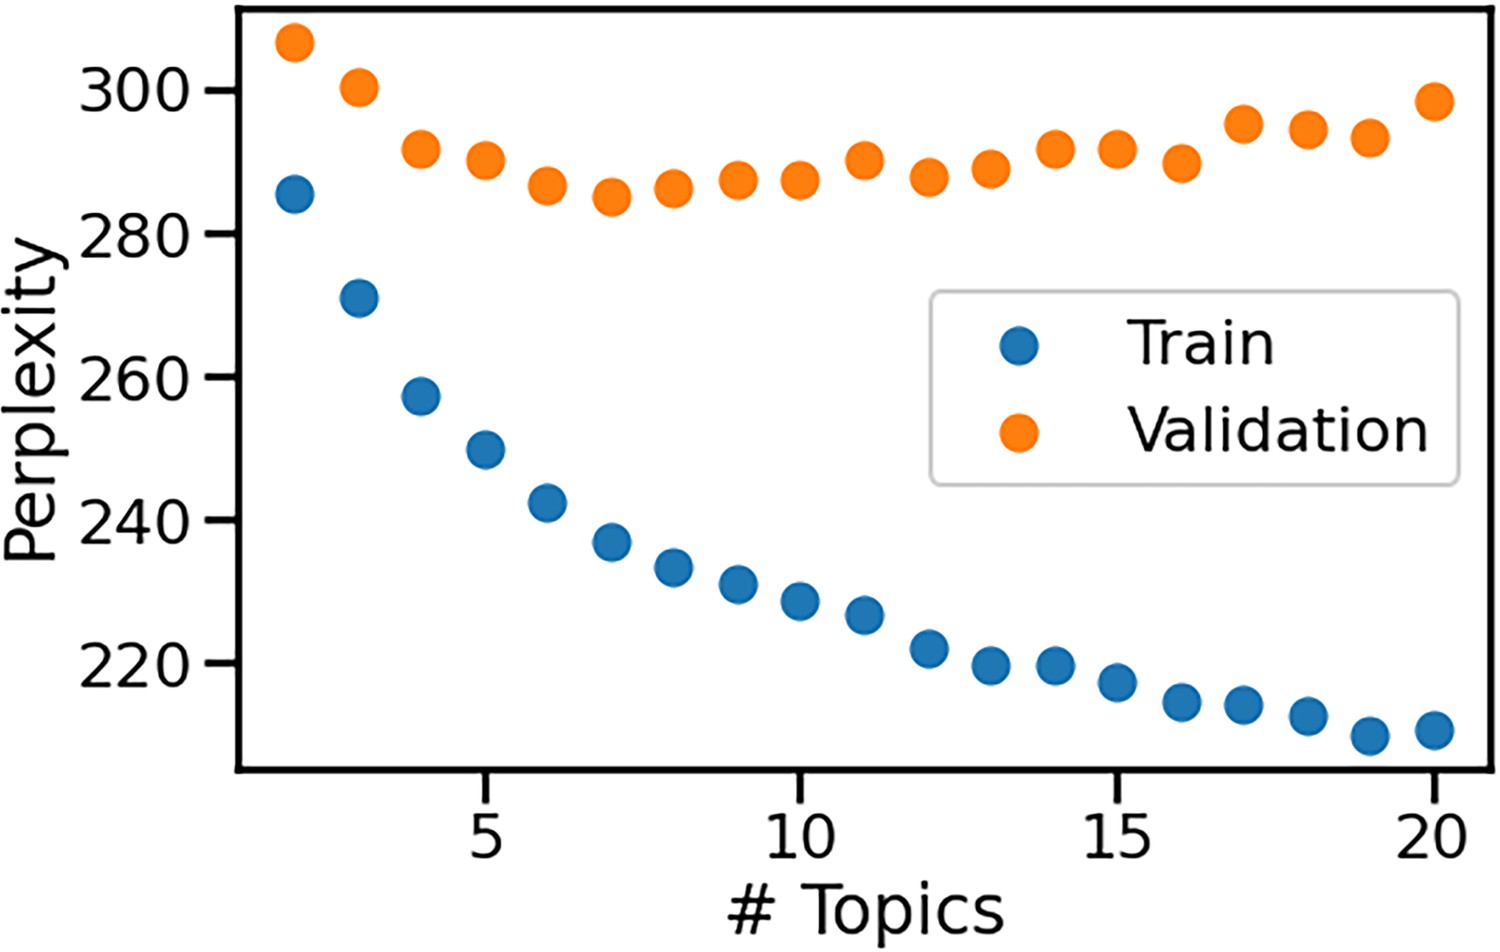
LDA perplexity on training and validation data for a different number of topics.
The lowest validation perplexity was for seven topics.
Figure 4—figure supplement 2
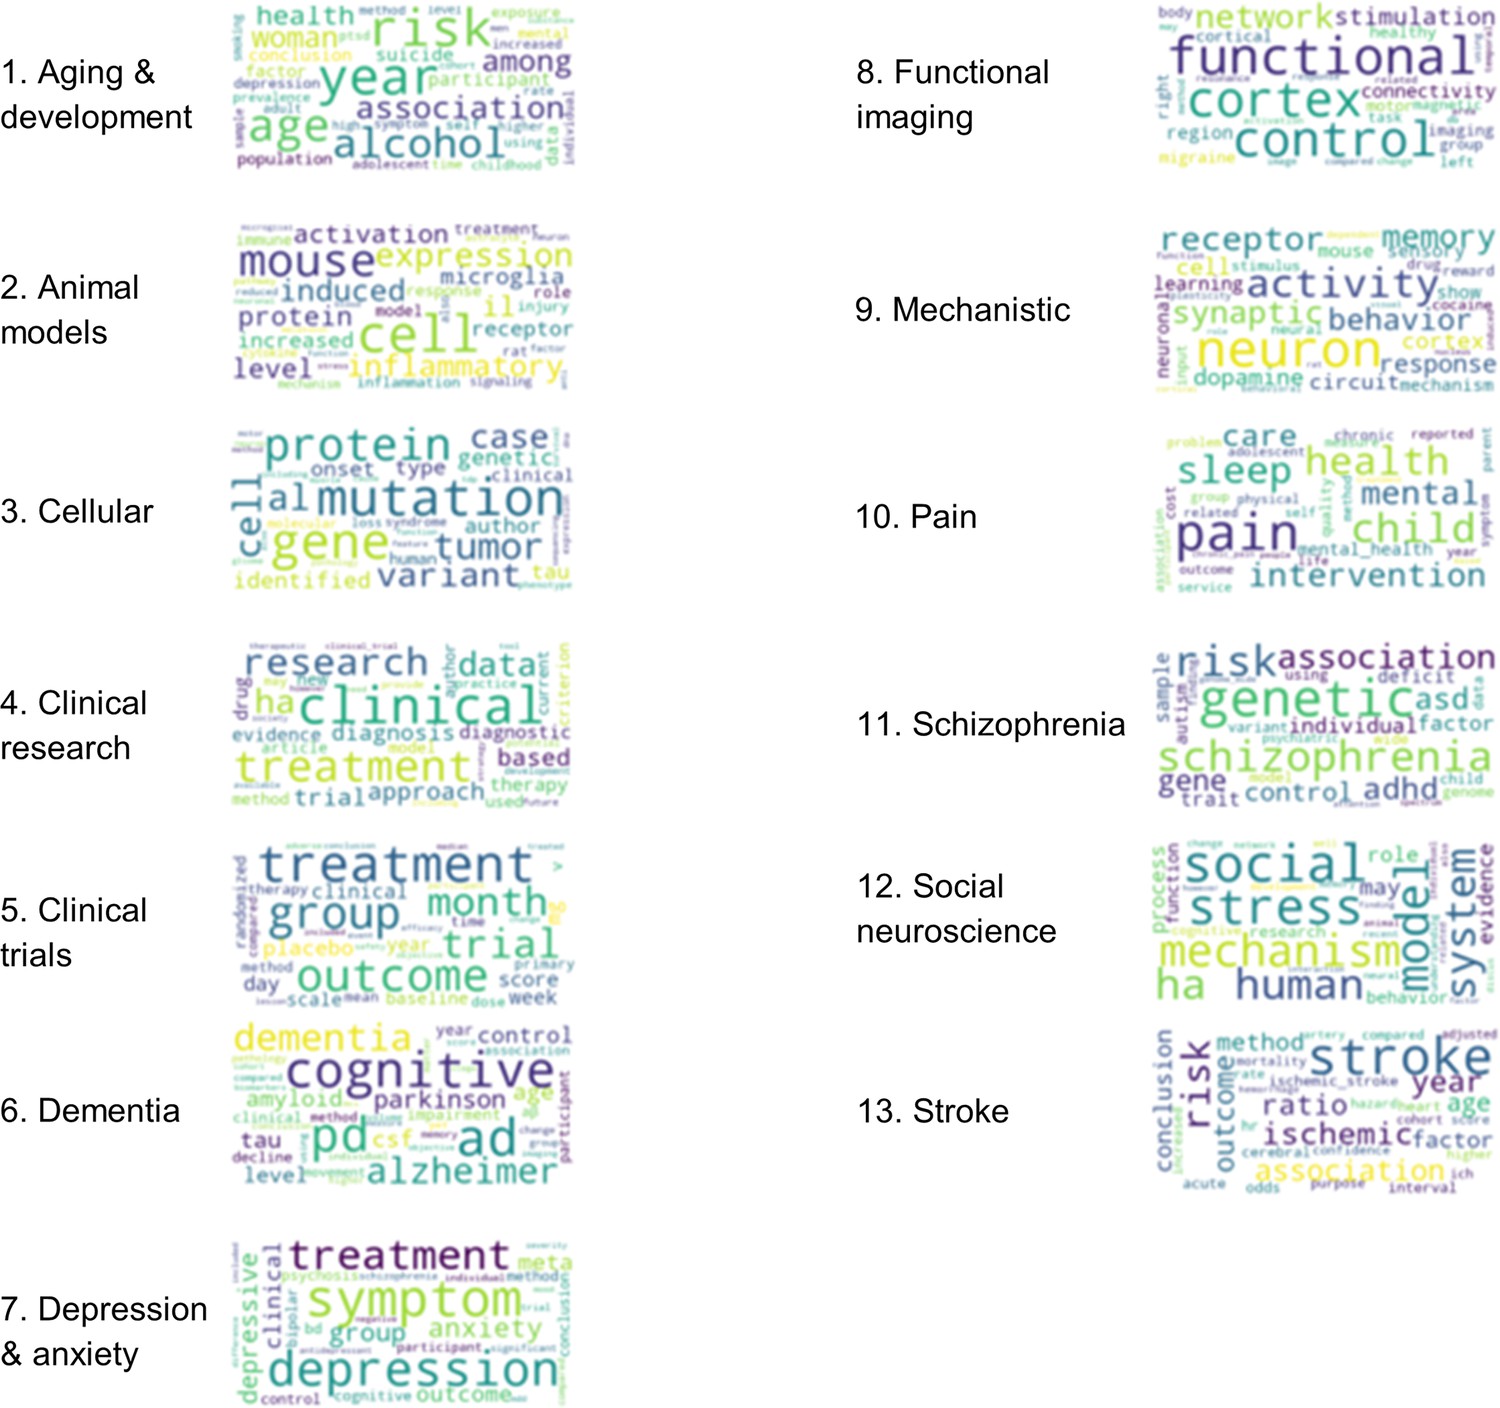
Topic word clouds for 13 topics.
These are the most common words appearing in each of our LDA model topics. Based on the word clouds, we assigned overall themes, or topic names.
Figure 4—figure supplement 3
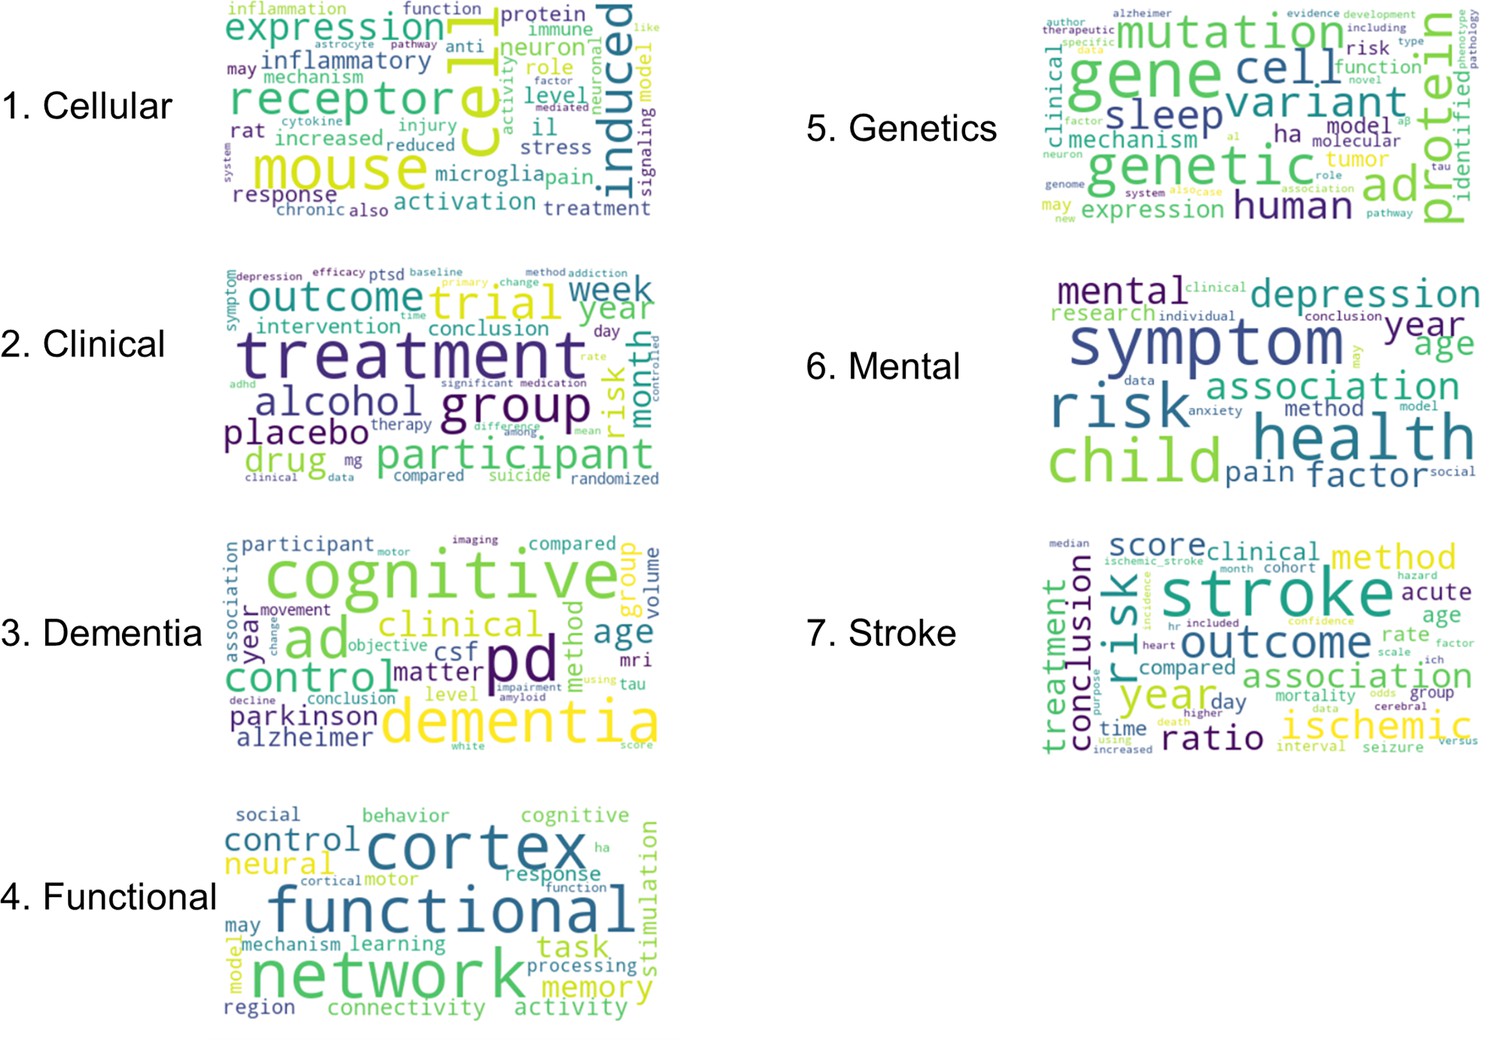
Topic word clouds for seven topics.
These are the most common words appearing in each of our LDA model topics. Based on the word clouds, we assigned overall themes, or topic names.
Figure 4—figure supplement 4
Self-citation rates by topic for seven topics.
(a) First Author, (b) Last Author, and (c) Any Author self-citation rates for seven topics.
Figure 5 with 2 supplements
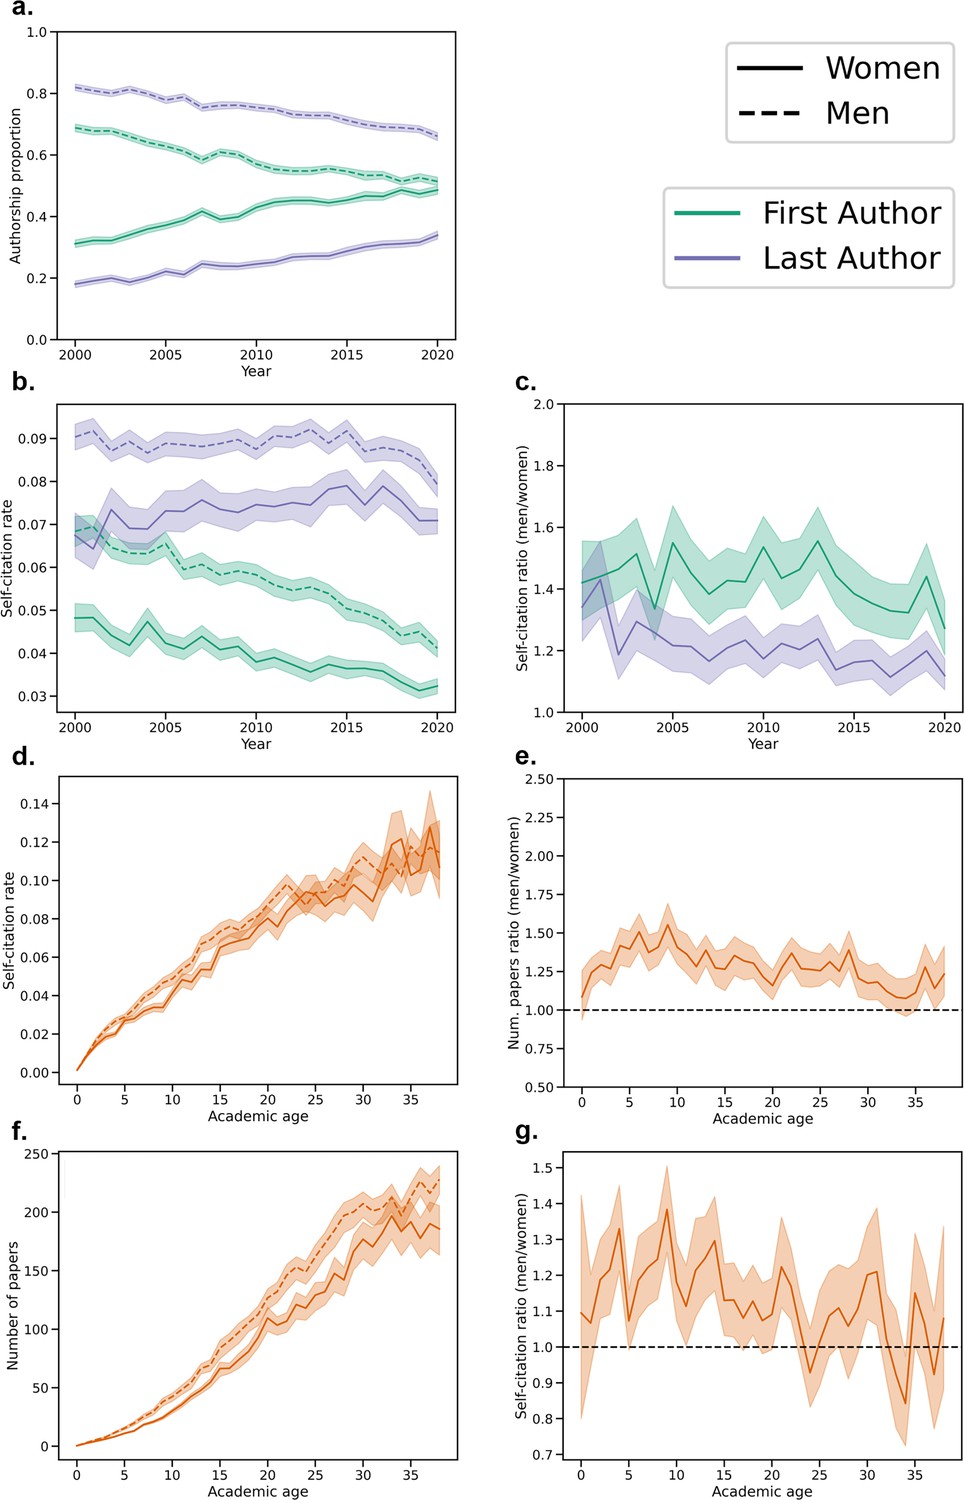
Gender disparities in authorship and self-citation.
(a) Proportion of papers written by men and women First and Last Authors since 2000. (b) Average self-citation rates for men and women First and Last Authors. (c) Ratio of average self-citation rates of men to women for First and Last Authors. (d) Self-citation rates by academic age for men and women authors, where the dashed line represents men and the solid line women. (e) Ratio of self-citation rates of men to women by academic age. (f) Number of papers by academic age for men and women, where the dashed line represents men and the solid line women. (g) Ratio of average number of papers of men to women by academic age. In all subplots, 95% confidence intervals of the mean were calculated with 1000 iterations of bootstrap resampling.
Figure 5—figure supplement 1
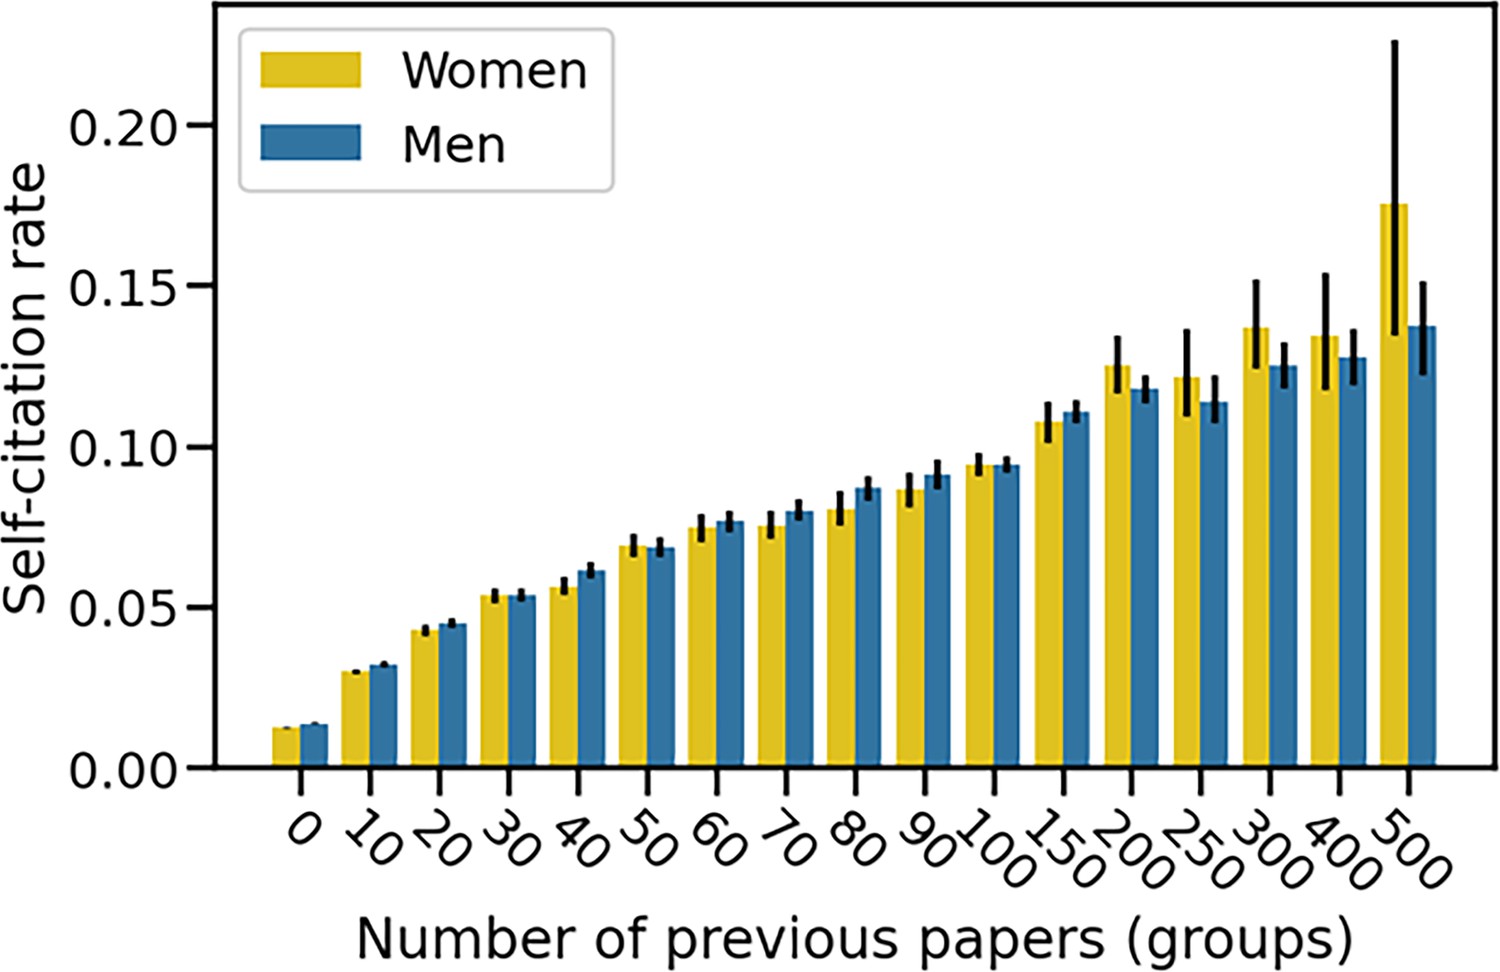
Self-citation rates by number of papers for women and men.
Self-citation rates were grouped in bins by number of previous papers: 0–9, 10–19, 20–29, 30–39, 40–49, 50–59, 60–69, 70–79, 80–89, 90–99, 100–149, 150–199, 200–249, 250–299, 300–399, 400–499, >500. Error bars reflect 95% confidence intervals obtained with bootstrap resampling.
Figure 5—figure supplement 2
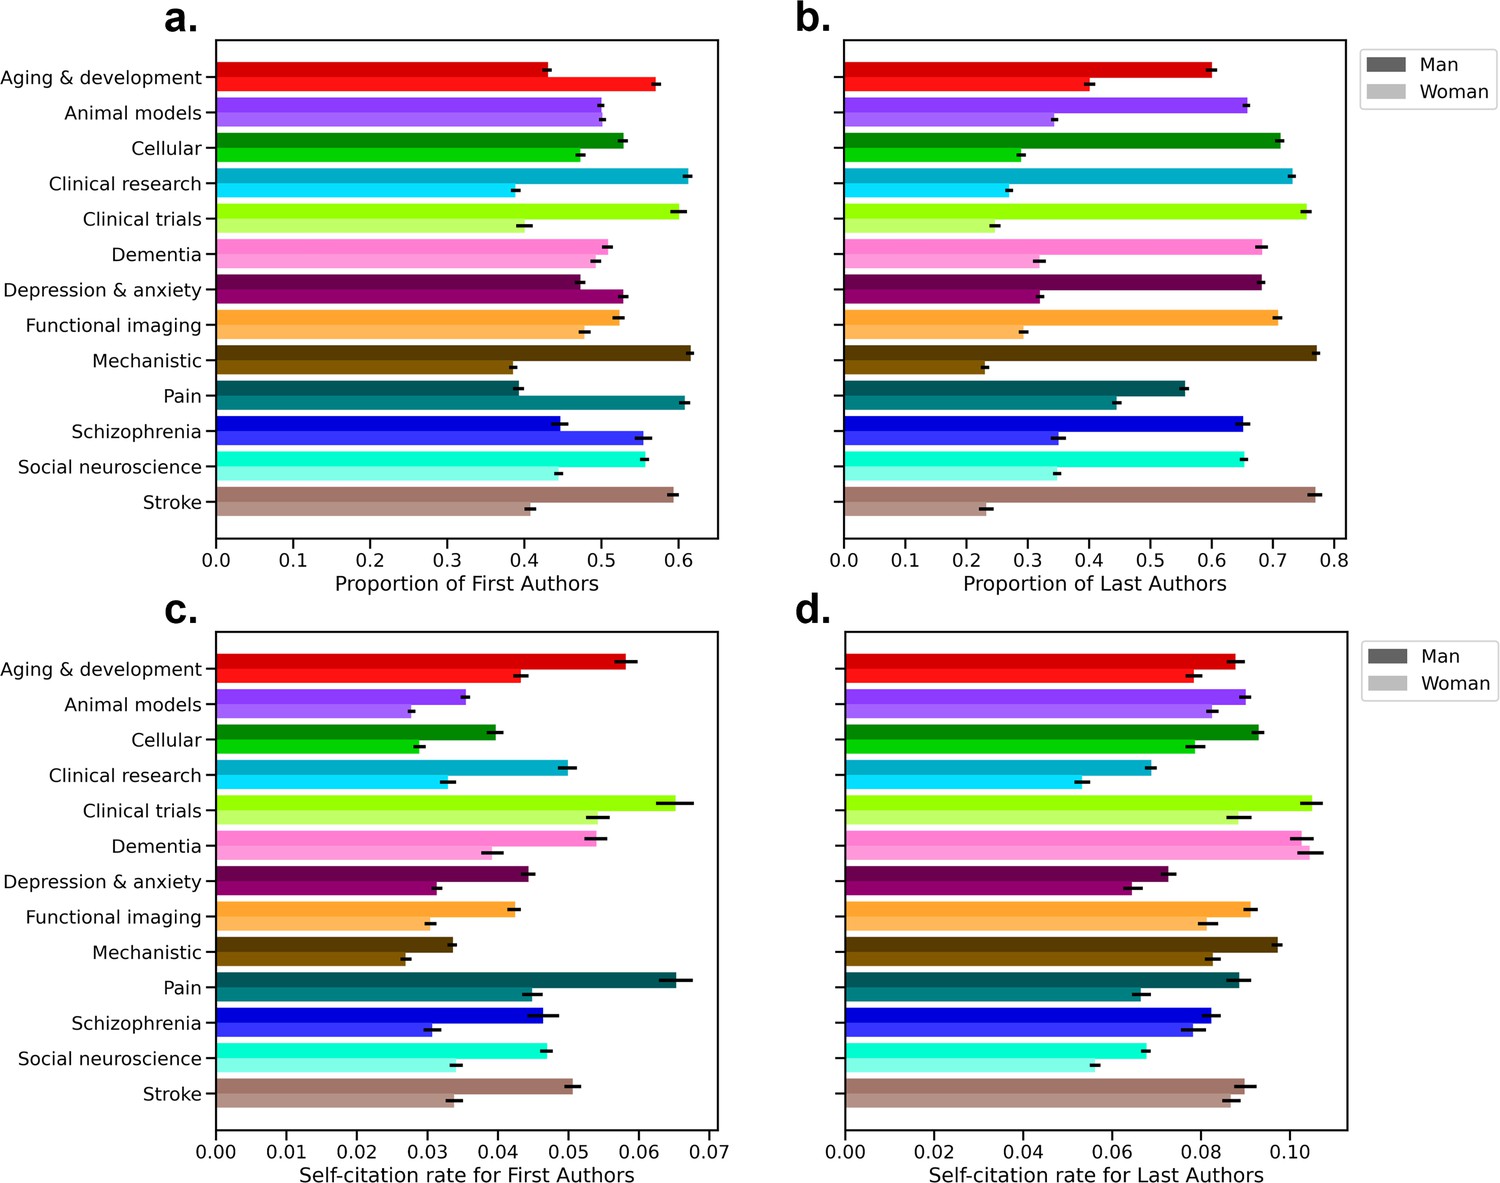
Topic and gender interactions.
Proportion of men and women authors by each topic for (a) First Authors and (b) Last Authors. Average self-citation rates for men and women authors by each topic for (c) First Authors and (d) Last Authors. Darker shades (top bar in each pair) are aggregated across men, and lighter shades (bottom bar in each pair) are aggregated across women.
Figure 6 with 2 supplements
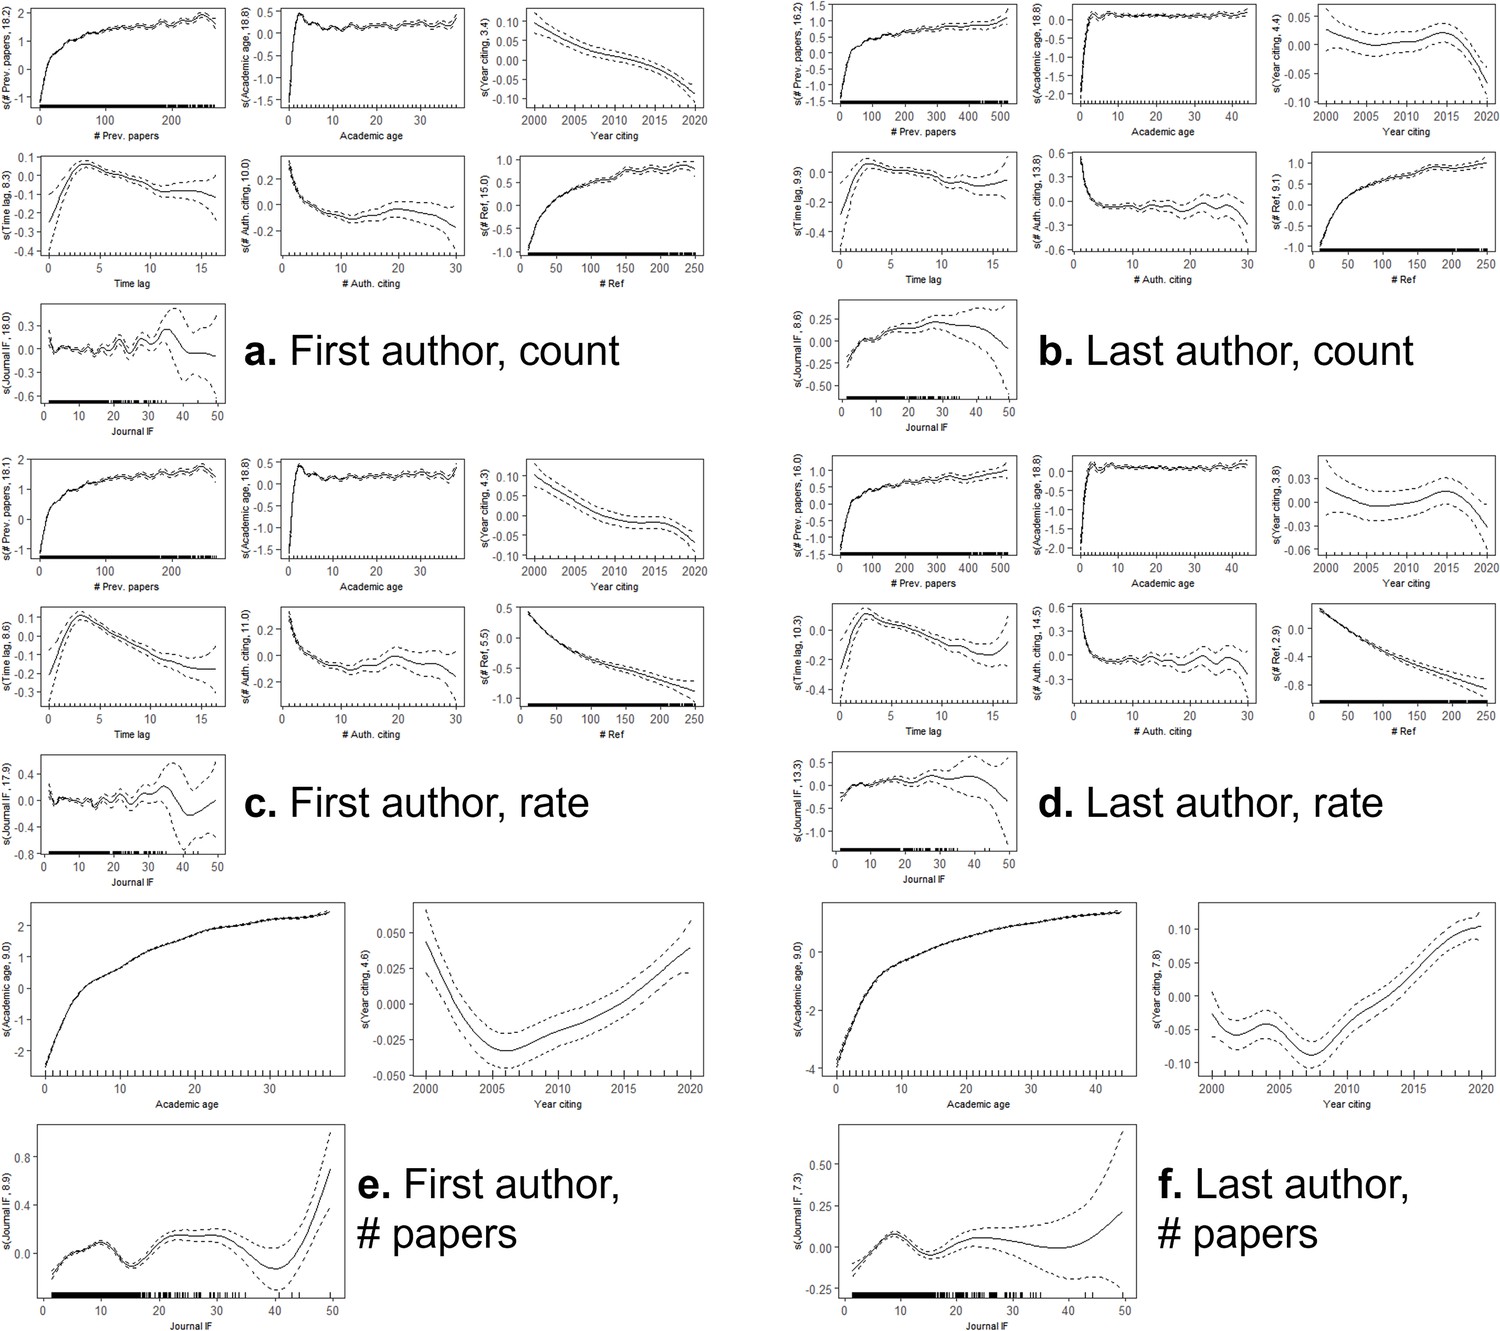
Smooth predictors for generalized additive models presented in Table 2.
Models for (a) First Authors and self-citation counts, (b) Last Authors and self-citation counts, (c) First Authors and self-citation rates, (d) Last Authors and self-citation rates, (e) First Authors and publication history, (f) Last Authors and publication history. The number in parentheses on each y-axis reflects the effective degrees of freedom. All p values were p<2e-16 except year citing for Last Authors for the count (p=5.0e-5) and rate (p=0.176) models.
Figure 6—figure supplement 1

Quantile-quantile plots for all models.
The plots were generated with a simulation-based approach using the DHARMa package in R.
Figure 6—figure supplement 2
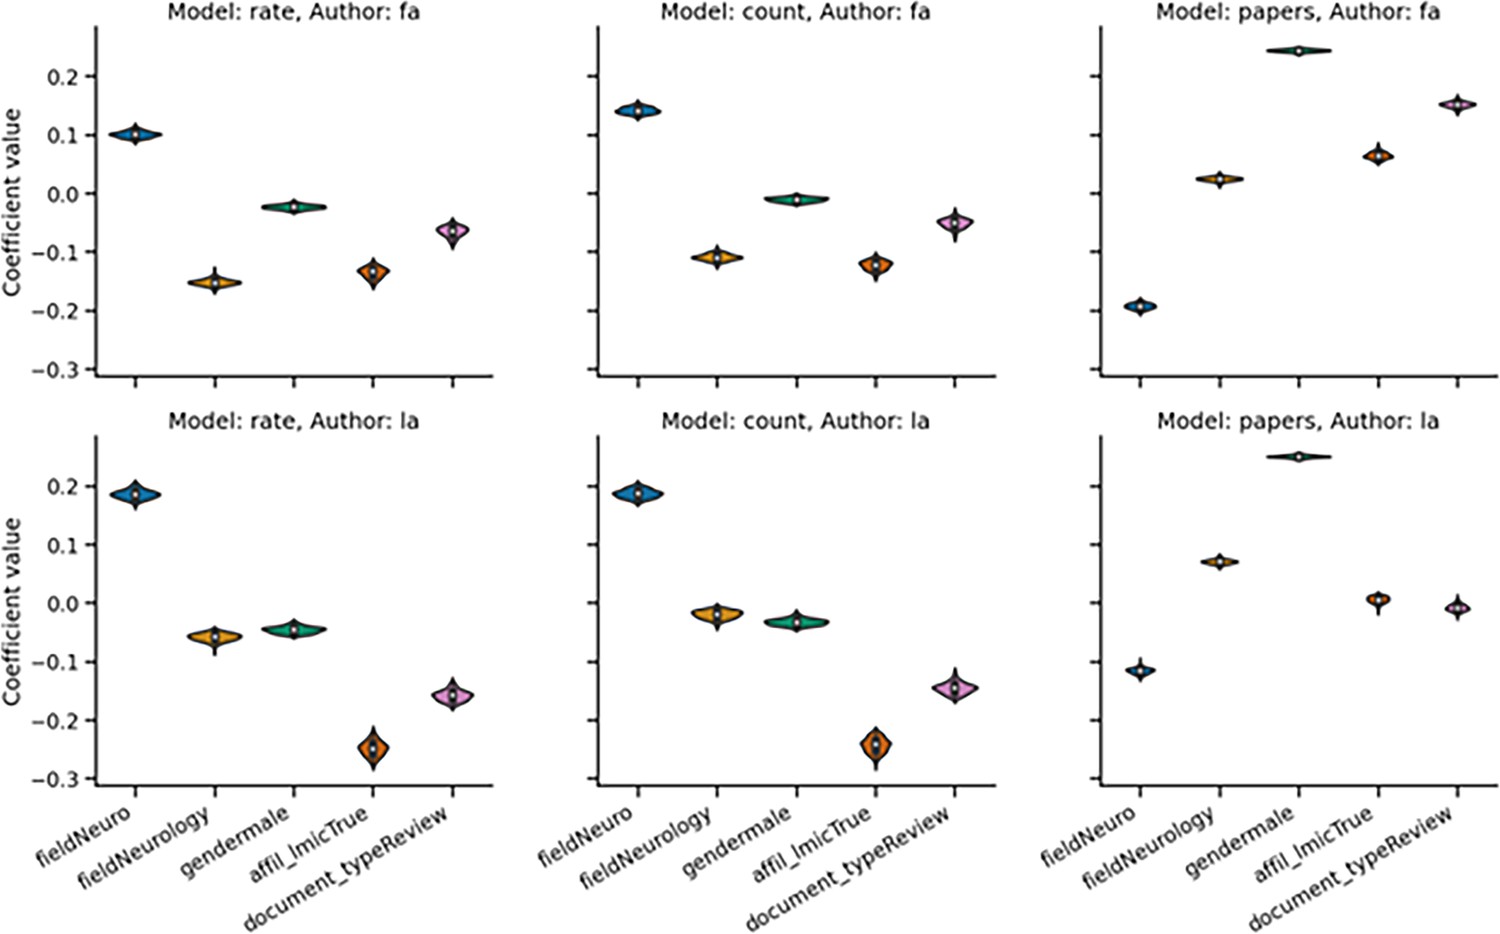
Values for parametric terms in models across 100 random resamplings.
Figure 7
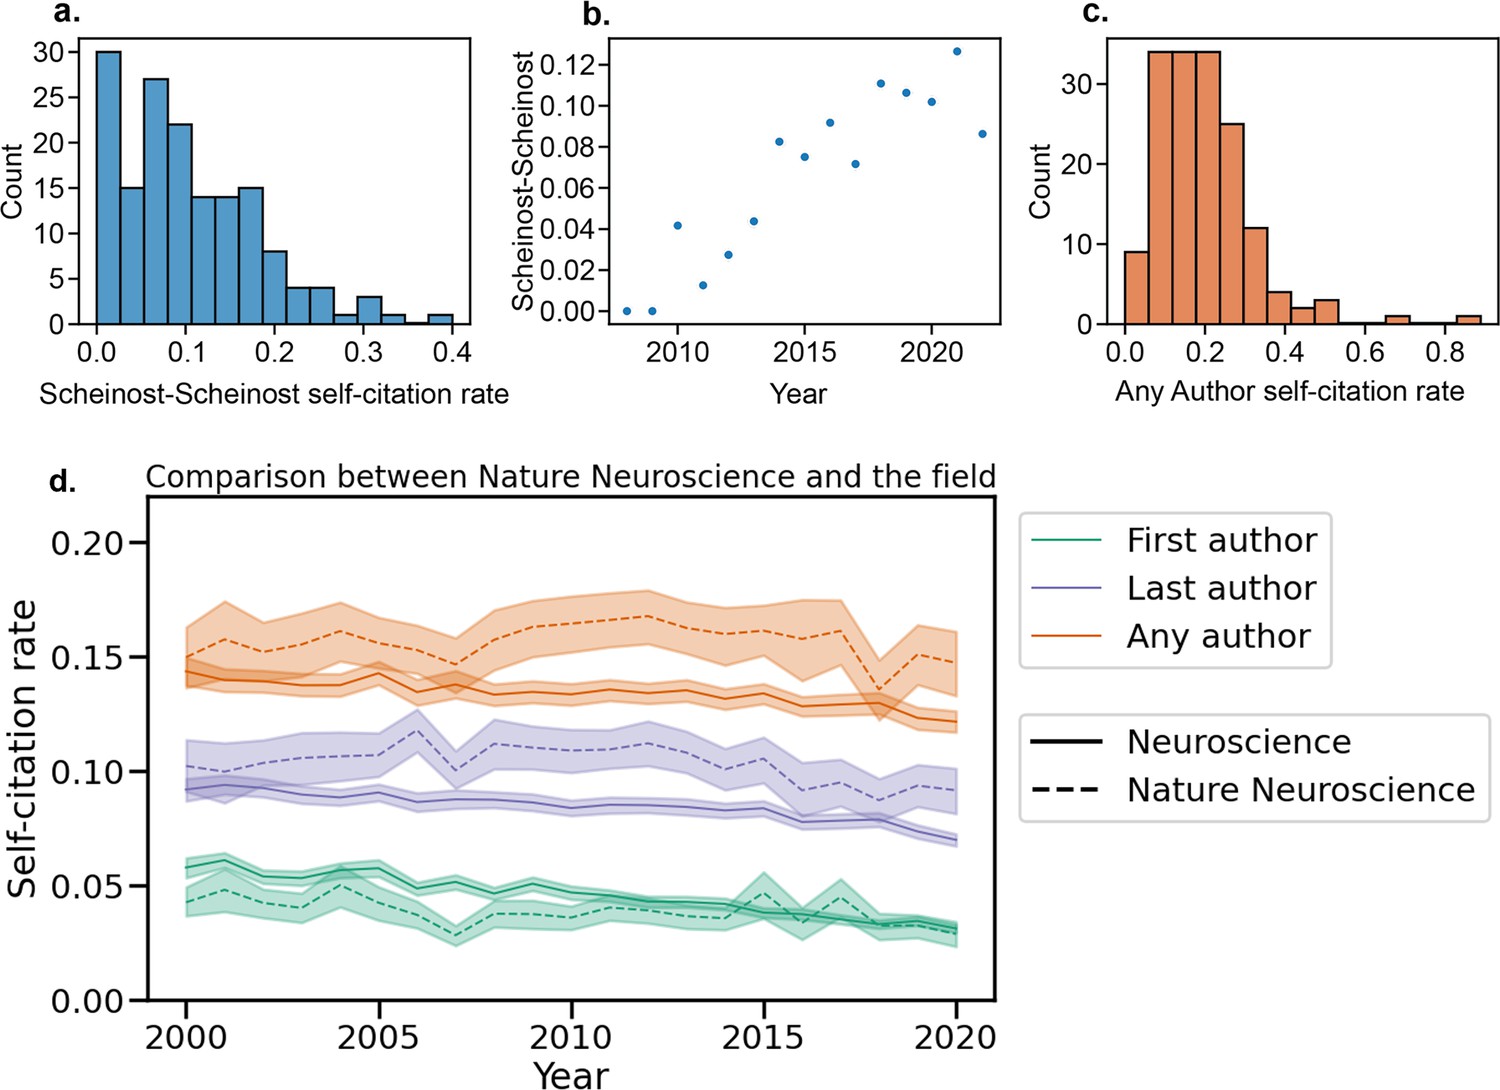
Self-citation tool outputs.
Self-citation rates for a single author (a) across all papers, (b) by year, and (c) for all authors of their papers. (d) Self-citation rate for a single journal is shown compared to the average in Neuroscience from 2000-2020.
Tables
Table 1
Self-citation rates in 2016–2020 for First, Last, and Any Authors by field.
| Field | First Author | Last Author | Any Author |
|---|---|---|---|
| Overall | 3.98 (3.87, 4.07) | 8.15 (7.98, 8.30) | 14.41 (13.99, 14.74) |
| Neurology | 4.54 (4.36, 4.70) | 8.87 (8.52, 9.14) | 16.59 (15.85, 17.16) |
| Neuroscience | 3.41 (3.30, 3.51) | 7.54 (7.36, 7.73) | 12.61 (12.29, 12.91) |
| Psychiatry | 4.29 (4.11, 4.43) | 8.41 (8.16, 8.60) | 15.07 (14.48, 15.47) |
Table 2
Coefficients and P values for parametric terms in the models.
Separate models were created for First and Last Authors. Models were also made for self-citation counts, self-citation rates, and the number of previously published papers. Quantile-quantile plots are presented in Figure 6—figure supplement 1. Results from 100 random resamplings are presented in Figure 6—figure supplement 2. Please note that model covariates were not included in the multiple comparisons correction in Appendix 2—table 5. *p<0.05, **p<1e-5, ***p<1e-10.
| Count | Rate | Number of papers | |||||
|---|---|---|---|---|---|---|---|
| First Author | Last Author | First Author | Last Author | First Author | Last Author | ||
| Adjusted R2 | 0.508 | 0.351 | 0.347 | 0.204 | 0.565 | 0.400 | |
| Deviance explained | 50.1% | 38.6% | 40.8% | 25.4% | 72.5% | 55.7% | |
| Intercept | 0.046** (p=1.1e-6) | 0.748*** (p<2e-16) | –3.64*** (p<2e-16) | –2.93*** (p<2e-16) | 2.296*** (p<2e-16) | 3.727*** (p<2e-16) | |
| Field | Neurology | –0.093*** (p<2e-16) | –0.025* (p=0.046) | –0.131*** (p<2e-16) | –0.062** (p=1.4e-6) | 0.026* (p=3.7e-4) | 0.068*** (p=4.0e-15) |
| Neuroscience | 0.147*** (p<2e-16) | 0.184*** (p<2e-16) | 0.112*** (p<2e-16) | 0.186*** (p<2e-16) | –0.195*** (p<2e-16) | –0.122*** (p<2e-16) | |
| Psychiatry | 0 | 0 | 0 | 0 | 0 | 0 | |
| Low-middle income country status | No | 0 | 0 | 0 | 0 | 0 | 0 |
| Yes | –0.116** (p=1.1e-7) | –0.241*** (p<2e-16) | –0.127** (p=1.0e-7) | –0.237*** (p<2e-16) | 0.071* (p=2.2e-5) | 0.010 (p=0.605) | |
| Gender | Woman | 0 | 0 | 0 | 0 | 0 | 0 |
| Man | –0.009 (p=0.253) | –0.033* (p=0.002) | –0.026* (p=0.004) | –0.047* (p=5.8e-5) | 0.246*** (p<2e-16) | 0.248*** (p<2e-16) | |
| Document type | Article | 0 | 0 | 0 | 0 | 0 | 0 |
| Review | –0.042**(p=0.001) | –0.139*** (p<2e-16) | –0.064** (p=7.8e-6) | –0.143*** (p<2e-16) | 0.152*** (p<2e-16) | –0.019* (p=0.047) | |
Table 3
Data exclusions.
Each cell shows the number of articles or citations remaining after exclusion, as well as the percentage that were dropped by the exclusion criteria.
| First Author | Last Author | |||
|---|---|---|---|---|
| # Articles | # Citations | # Articles | # Citations | |
| Prior to exclusions | 157,287 | 8,438,733 | 157,287 | 8,438,733 |
| Missing covariates: remaining (% dropped) | 133,403 (15.18%) | 7,392,638 (12.40%) | 132,806 (15.56%) | 7,379,581 (12.55%) |
| Missing citation data: remaining (% dropped) | 133,256 (0.11%) | 6,773,293 (8.38%) | 132,667 (0.10%) | 6,769,081 (8.27%) |
| Extreme values (citation level): remaining (% dropped) | 126,938 (4.74%) | 6,390,129 (5.66%) | 126,168 (4.90%) | 6,396,015 (5.51%) |
| Extreme values (article level): remaining (% dropped) | 115,205 (9.24%) | 5,794,926 (9.31%) | 114,622 (9.15%) | 5,801,367 (9.30%) |
| Data available for First and Last Authors | 100,347 Articles; 5,061,417 citations | |||
Appendix 1—table 1
All journals included in this analysis by field, sorted alphabetically.
We categorized each journal as belonging to Neurology, Neuroscience, or Psychiatry. While we recognize that some journals belong to overlapping fields (e.g., Neurology and Neuroscience), we attempted to select the most relevant field for each journal.
| Field | Journals (2020 Impact Factor) |
|---|---|
| Neurology | Acta Neuropathologica (17.09); Alzheimer’s and Dementia (21.57); Alzheimer’s Research and Therapy (6.98); Annals of Neurology (10.42); Brain (13.50); Brain Stimulation (8.96); Epilepsy Currents (7.5); JAMA Neurology (18.30); JNNP (10.28); Journal of Headache and Pain (7.28); Journal of Stroke (6.97); Lancet Neurology (44.18); Molecular Neurodegeneration (14.20); Movement Disorders (10.34); Nature Reviews Neurology (42.94); Neuro-Oncology (12.30); Neurology (9.91); Neurology: Neuroimmunology and NeuroInflammation (8.49); Neuropathology and Applied Neurobiology (8.09); Neurotherapeutics (7.62); npj Parkinson’s Disease (8.65); Pain (6.96); Sleep Medicine Reviews (11.61); Stroke (7.91); Translational Stroke Research (6.83) |
| Neuroscience | Annual Review of Neuroscience (12.45); Behavioral and Brain Sciences (12.58); Brain, Behavior, and Immunity (7.22); Frontiers in Neuroendocrinology (8.61); Journal of Neuroinflammation (8.32); Journal of Pineal Research (13.01); Nature Human Behaviour (13.66); Nature Neuroscience (24.88); Nature Reviews Neuroscience (34.87); Neuron (17.17); Neuroscience and Biobehavioral Reviews (8.99); Neuroscientist (7.52); Progress in Neurobiology (11.69); Trends in Cognitive Sciences (20.23); Trends in Neurosciences (13.84) |
| Psychiatry | Acta Psychiatrica Scandinavica (6.39); Addiction (6.53); American Journal of Psychiatry (18.11); Biological Psychiatry (13.38); Bipolar Disorders (6.74); Body Image (6.41); British Journal of Psychiatry (9.32); Clinical Psychological Science (7.17); Depression and Anxiety (6.51); Epidemiology and Psychiatric Sciences (6.89); Evidence-Based Mental Health (8.54); JAACAP (8.83) JAMA Psychiatry (21.60); JCPP (8.98); Journal of Abnormal Psychology (6.67); Journal of Behavioral Addictions (6.76); Molecular Psychiatry (15.99); Neuropsychopharmacology (7.86); Psychological Medicine (7.72); Psychotherapy and Psychosomatics (17.66); Schizophrenia Bulletin (9.31); The Lancet Psychiatry (26.48); World Psychiatry (49.55) |
Appendix 1—table 2
Mapping of subfields to fields.
| Field | Scopus-defined Subfields |
|---|---|
| Neurology | Neurology; Neurology (clinical) |
| Neuroscience | Cognitive Neuroscience; Neuroscience (all); Cellular and Molecular Neuroscience; Behavioral Neuroscience; Neuropsychology and Physiological Psychology; Developmental Neuroscience; Neuroscience (miscellaneous) |
| Psychiatry | Biological Psychiatry; Psychiatric Mental Health; Psychiatry and Mental Health |
Appendix 1—table 3
Data missingness.
| Ratio of prevalence in missing to non-missing data | |||
|---|---|---|---|
| First Author | Last Author | ||
| Document type | Article | 0.994 | |
| Review | 1.029 | ||
| Field | Neurology | 1.204 | |
| Neuroscience | 0.888 | ||
| Psychiatry | 0.900 | ||
| Continent | Africa | 1.308 | 1.329 |
| Americas | 0.973 | 0.979 | |
| Asia | 1.562 | 1.570 | |
| Europe | 0.909 | 0.908 | |
| Oceania | 0.926 | 0.914 | |
| Low-middle income country status | No | 0.972 | 0.976 |
| Yes | 1.615 | 1.608 | |
| Gender | Woman | 0.864 | 0.922 |
| Man | 1.089 | 1.026 | |
Appendix 2—table 1
Comparisons of self-citation rates whether defining field by paper or by author.
| Field | Field definition | First Author | Last Author |
|---|---|---|---|
| Neurology | By journal | 4.54 (4.36, 4.70) | 8.87 (8.52, 9.14) |
| By author | 4.33 (4.14, 4.47) | 9.07 (8.71, 9.36) | |
| Neuroscience | By journal | 3.41 (3.30, 3.51) | 7.54 (7.36, 7.73) |
| By author | 3.62 (3.47, 3.74) | 8.32 (8.13, 8.51) | |
| Psychiatry | By journal | 4.29 (4.11, 4.43) | 8.41 (8.16, 8.60) |
| By author | 4.45 (4.24, 4.60) | 7.92 (7.58, 8.16) |
Appendix 2—table 2
Percentiles of self-citation rates in articles from 2016 to 2020.
| Percentile | First Author self-citation rate (%) | Last Author self-citation rate (%) | Any Author self-citation rate (%) |
|---|---|---|---|
| 1% | 0.00 | 0.00 | 0.00 |
| 5% | 0.00 | 0.00 | 0.00 |
| 10% | 0.00 | 0.00 | 2.38 |
| 25% | 0.00 | 2.44 | 6.67 |
| 50% | 2.86 | 7.14 | 13.51 |
| 75% | 7.69 | 13.79 | 22.72 |
| 90% | 15.00 | 21.95 | 33.33 |
| 95% | 20.83 | 28.21 | 41.18 |
| 99% | 35.71 | 41.94 | 58.33 |
Appendix 2—table 3
Correlations between year and self-citation rate and corresponding slopes by field.
| Correlation | Slope (% per decade) | ||
|---|---|---|---|
| Neurology | First Author | –0.86 (-0.92,–0.77) | –0.71 (-0.87,–0.54) |
| Last Author | 0.43 (0.09, 0.67) | 0.30 (0.05, 0.53) | |
| Any Author | 0.87 (0.80, 0.93) | 1.68 (1.19, 2.08) | |
| Neuroscience | First Author | –0.96 (-0.98,–0.94) | –1.40 (-1.51,–1.28) |
| Last Author | –0.90 (-0.95,–0.85) | –0.94 (-1.10,–0.77) | |
| Any Author | –0.82 (-0.91,–0.70) | –0.80 (-1.06,–0.56) | |
| Psychiatry | First Author | –0.95 (-0.97,–0.92) | –1.30 (-1.48,–1.15) |
| Last Author | 0.51 (0.28, 0.68) | 0.36 (0.17, 0.53) | |
| Any Author | 0.66 (0.41, 0.80) | 0.76 (0.36, 1.06) |
Appendix 2—table 4
First Author and Last Author self-citation rates by affiliation country of the author for papers from 2016–2020.
95% confidence intervals obtained via bootstrap resampling are included in parentheses. Only countries with at least 50 papers were included in the analysis.
| Country | First Author Self-citation Rate | Last Author Self-citation Rate |
|---|---|---|
| Argentina | 3.04 (2.59, 3.42) | 7.11 (5.72, 8.35) |
| Australia | 4.82 (4.51, 5.07) | 7.54 (6.96, 7.93) |
| Austria | 4.62 (3.68, 5.20) | 8.73 (7.24, 9.62) |
| Belgium | 4.61 (4.10, 5.04) | 7.58 (6.58, 8.21) |
| Brazil | 2.92 (2.60, 3.21) | 6.37 (5.54, 6.98) |
| Canada | 4.43 (4.23, 4.61) | 7.85 (7.55, 8.13) |
| Chile | 3.79 (2.87, 4.67) | 8.37 (5.37, 9.57) |
| China | 2.52 (2.31, 2.74) | 4.84 (4.51, 5.20) |
| Czech Republic | 3.84 (2.64, 4.93) | 4.85 (3.67, 6.16) |
| Denmark | 4.45 (4.07, 4.76) | 8.51 (7.69, 9.09) |
| Finland | 5.34 (4.82, 5.79) | 8.86 (8.08, 9.56) |
| France | 3.83 (3.63, 4.01) | 7.32 (6.97, 7.62) |
| Germany | 4.79 (4.63, 4.95) | 8.61 (8.37, 8.83) |
| Greece | 4.36 (3.63, 5.05) | 5.91 (4.56, 6.99) |
| Hong Kong | 4.72 (3.32, 5.87) | 6.83 (5.74, 8.15) |
| Hungary | 5.10 (4.03, 5.98) | 6.44 (5.31, 7.55) |
| India | 3.29 (2.50, 3.96) | 5.00 (3.77, 5.89) |
| Ireland | 3.67 (3.20, 4.11) | 8.12 (6.93, 8.96) |
| Iran | 1.87 (1.24, 2.42) | 3.78 (2.40, 4.90) |
| Israel | 4.68 (4.20, 5.11) | 9.00 (8.16, 9.70) |
| Italy | 5.65 (5.35, 5.90) | 8.08 (7.57, 8.46) |
| Japan | 5.25 (4.87, 5.55) | 8.05 (7.59, 8.43) |
| South Korea | 2.93 (2.50, 3.28) | 5.47 (4.92, 5.95) |
| Mexico | 5.92 (3.56, 7.21) | 7.01 (4.76, 8.11) |
| Netherlands | 3.97 (3.81, 4.16) | 7.92 (7.41, 8.29) |
| New Zealand | 5.34 (4.44, 6.11) | 6.52 (5.60, 7.31) |
| Norway | 4.90 (4.23, 5.39) | 8.83 (7.43, 9.88) |
| Poland | 3.98 (3.27, 4.63) | 6.31 (5.21, 7.36) |
| Portugal | 2.85 (2.31, 3.26) | 5.42 (4.39, 6.27) |
| Singapore | 3.80 (2.60, 4.77) | 7.54 (4.23, 9.13) |
| South Africa | 3.44 (2.47, 4.40) | 4.77 (3.79, 5.89) |
| Spain | 4.47 (4.20, 4.72) | 7.83 (7.35, 8.25) |
| Sweden | 4.89 (4.53, 5.24) | 9.03 (8.66, 9.42) |
| Switzerland | 4.55 (4.26, 4.85) | 7.72 (7.31, 8.18) |
| Taiwan | 4.17 (3.07, 5.01) | 6.66 (4.62, 8.02) |
| Turkey | 3.51 (2.72, 4.18) | 2.79 (2.20, 3.38) |
| United Kingdom | 5.02 (4.84, 5.18) | 8.88 (8.57, 9.10) |
| United States | 5.09 (4.99, 5.17) | 8.97 (8.84, 9.08) |
Appendix 2—table 5
P values for all 44 comparisons performed in this study.
P values are corrected for multiple comparisons with the Benjamini/Hochberg false discovery rate (FDR) correction with 𝛼=0.05. For P values determined by permutation testing, 10,000 permutations were used. Significant values (Pcorrected <0.05) are marked with an asterisk in the “Finding” column.
| Comparison | Method | Uncorrected P | Corrected P | Finding | |
|---|---|---|---|---|---|
| First vs Last Author self-citation (all fields) | permutation | 1e-4 | 2.9e-4 | * Last >First | |
| First vs Last Author self-citation (Neurology) | permutation | 1e-4 | 2.9e-4 | * Last >First | |
| First vs Last Author self-citation (Neuroscience) | permutation | 1e-4 | 2.9e-4 | * Last >First | |
| First vs Last Author self-citation (Psychiatry) | permutation | 1e-4 | 2.9e-4 | * Last >First | |
| First Author: Neurology vs. Neuroscience | permutation | 1e-4 | 2.9e-4 | * Neurology >Neuroscience | |
| First Author: Neuroscience vs. Psychiatry | permutation | 1e-4 | 2.9e-4 | * Psychiatry >Neuroscience | |
| First Author: Neurology vs. Psychiatry | permutation | 0.095 | 0.144 | No significant difference | |
| Last Author: Neurology vs. Neuroscience | permutation | 1e-4 | 2.9e-4 | * Neurology >Neuroscience | |
| Last Author: Neuroscience vs. Psychiatry | permutation | 1e-4 | 2.9e-4 | * Psychiatry >Neuroscience | |
| Last Author: Neurology vs. Psychiatry | permutation | 0.078 | 0.123 | No significant difference | |
| Any Author: Neurology vs. Neuroscience | permutation | 1e-4 | 2.9e-4 | * Neurology >Neuroscience | |
| Any Author: Neuroscience vs. Psychiatry | permutation | 1e-4 | 2.9e-4 | * Psychiatry >Neuroscience | |
| Any Author: Neurology vs. Psychiatry | permutation | 0.005 | 0.010 | * Neurology >Psychiatry | |
| Slope over the years: First Author | correlation | 2.1e-15 | 9.2e-14 | * m=–1.21 % / decade | |
| Slope over the years: Last Author | correlation | 0.074 | 0.123 | No significant correlation | |
| Slope over the years: Any Author | correlation | 0.012 | 0.024 | No significant correlation | |
| Country-level self-citation rate and number of previous papers: First Author | correlation | 1.5e-4 | 4.1e-4 | *Spearman’s r=0.576 | |
| Country-level self-citation rate and number of previous papers: Last Author | correlation | 8.0e-7 | 1.8e-5 | *Spearman’s r=0.654 | |
| Country-level self-citation rate and impact factor: First Author | correlation | 0.347 | 0.424 | No significant correlation | |
| Country-level self-citation rate and impact factor: Last Author | correlation | 0.007 | 0.014 | *Spearman’s r=0.428 | |
| First Author: Spearman’s correlation between topic self-citation and number of authors | correlation | 0.915 | 0.929 | No significant correlation | |
| Last Author: Spearman’s correlation between topic self-citation and number of authors | correlation | 0.003 | 0.007 | *Spearman’s r=0.758 | |
| Any Author: Spearman’s correlation between topic self-citation and number of authors | correlation | 0.004 | 0.009 | *Spearman’s r=0.736 | |
| Men vs. Women, First Author self-citation rate, 2020 | permutation | 1e-4 | 2.9e-4 | * Men >Women | |
| Men vs. Women, Last Author self-citation rate, 2020 | permutation | 4e-4 | 0.001 | * Men >Women | |
| Early career men vs. women, self-citation rate | permutation | 1e-4 | 2.9e-4 | * Men >Women | |
| Early career men vs. women, number of papers | permutation | 1e-4 | 2.9e-4 | * Men >Women | |
| Early career men vs. women self-citation rate by number of papers | 0–9 papers | permutation | 3.0e-4 | 7.8e-4 | * Men >Women |
| 10–19 | permutation | 0.019 | 0.034 | * Men >Women | |
| 20–29 | permutation | 0.174 | 0.248 | No significant difference | |
| 30–39 | permutation | 0.855 | 0.918 | No significant difference | |
| 40–49 | permutation | 0.035 | 0.062 | No significant difference | |
| 50–59 | permutation | 0.888 | 0.929 | No significant difference | |
| 60–69 | permutation | 0.508 | 0.588 | No significant difference | |
| 70–79 | permutation | 0.272 | 0.342 | No significant difference | |
| 80–89 | permutation | 0.175 | 0.248 | No significant difference | |
| 90–99 | permutation | 0.399 | 0.475 | No significant difference | |
| 100–149 | permutation | 0.929 | 0.929 | No significant difference | |
| 150–199 | permutation | 0.824 | 0.906 | No significant difference | |
| 200–249 | permutation | 0.264 | 0.342 | No significant difference | |
| 250–299 | permutation | 0.196 | 0.269 | No significant difference | |
| 300–399 | permutation | 0.264 | 0.342 | No significant difference | |
| 400–499 | permutation | 0.716 | 0.808 | No significant difference | |
| ≥ 500 | permutation | 0.075 | 0.123 | No significant difference | |
Appendix 3—table 1
Models with affiliation continent instead of low- and middle-income country terms.
*P<0.05, **P<1e-5, ***P<1e-10.
| Count | Rate | ||||
|---|---|---|---|---|---|
| First Author | Last Author | First Author | Last Author | ||
| Adjusted R2 | 0.507 | 0.354 | 0.347 | 0.208 | |
| Deviance explained | 50.1% | 38.9% | 40.9% | 25.7% | |
| Intercept | –0.096** (P=4.3e-8) | 0.467*** (P<2e-16) | –3.817*** (P<2e-16) | –3.222*** (P<2e-16) | |
| Field | Neurology | –0.089*** (P<2e-16) | –0.021 (P=0.098) | –0.124*** (P<2e-16) | –0.058** (P=6.4e-6) |
| Neuroscience | 0.150*** (P<2e-16) | 0.200*** (P<2e-16) | 0.120*** (P<2e-16) | 0.204*** (P<2e-16) | |
| Psychiatry | 0 | 0 | 0 | 0 | |
| Continent | Africa | 0.162 (P=0.069) | 0.211* (P=0.027) | 0.290* (P=0.001) | 0.357* (P=2.1e-4) |
| Americas | 0.125*** (P=3.1e-15) | 0.309*** (P<2e-16) | 0.162*** (P<2e-16) | 0.320*** (P<2e-16) | |
| Asia | 0 | 0 | 0 | 0 | |
| Europe | 0.162*** (P<2e-16) | 0.256*** (P<2e-16) | 0.198*** (P<2e-16) | 0.270*** (P<2e-16) | |
| Oceania | 0.170*** (P=4.7e-12) | 0.187** (P=1.7e-10) | 0.231*** (P<2e-16) | –.234*** (P=5.0e-14) | |
| Gender | Woman | 0 | 0 | 0 | 0 |
| Man | –0.003 (P=0.703) | –0.024* (P=0.026) | –0.017 (P=0.059) | –0.036* (P=0.002) | |
| Document type | Article | 0 | 0 | 0 | 0 |
| Review | –0.047** (P=1e-4) | –0.139*** (P<2e-16) | –0.073** (P=9.7e-7) | –0.146*** (P<2e-16) | |
Appendix 3—table 2
Coefficients for field when defining fields based on the publication history of authors rather than the journal.
*P<0.05, **P<1e-5, ***P<1e-10.
| Field | Count | Rate | Number of papers | |||
|---|---|---|---|---|---|---|
| First Author | Last Author | First Author | Last Author | First Author | Last Author | |
| Neurology (by journal) | –0.093*** (P<2e-16) | –0.025* (P=0.046) | –0.131*** (P<2e-16) | –0.062** (P=1.4e-6) | 0.026* (P=3.7e-4) | 0.068*** (P=4.0e-15) |
| Neurology (by author) | –0.091*** (P=2.9e-16) | –0.002 (P=0.85) | –0.154*** (P<2e-16) | –0.054* (P=2.2e-4) | –0.016* (P=0.034) | 0.042* (P=1.7e-5) |
| Neuroscience (by journal) | 0.147*** (P<2e-16) | 0.184*** (P<2e-16) | 0.112*** (P<2e-16) | 0.186*** (P<2e-16) | –0.195*** (P<2e-16) | –0.122*** (P<2e-16) |
| Neuroscience (by author) | 0.248*** (P<2e-16) | 0.357*** (P<2e-16) | 0.191*** (P<2e-16) | 0.312*** (P<2e-16) | –0.340*** (P<2e-16) | –0.253*** (P<2e-16) |
| Psychiatry (by journal) | 0 | 0 | 0 | 0 | 0 | 0 |
| Psychiatry (by author) | 0 | 0 | 0 | 0 | 0 | 0 |
Appendix 3—table 3
Models with interaction terms for between gender/academic age and gender/number of previous papers.
*P<0.05, **P<1e-5, ***P<1e-10.
| Count | Rate | Number of papers | |||||
|---|---|---|---|---|---|---|---|
| First Author | Last Author | First Author | Last Author | First Author | Last Author | ||
| Adjusted R2 | 0.509 | 0.353 | 0.349 | 0.204 | 0.565 | 0.4 | |
| Deviance explained | 50.1% | 38.6% | 40.9% | 25.4% | 72.5% | 55.7% | |
| Intercept | 0.034* (P=0.001) | 0.748*** (P<2e-16) | –3.645*** (P<2e-16) | –2.926*** (P<2e-16) | 2.306*** (P<2e-16) | 3.724*** (P<2e-16) | |
| Field | Neurology | –0.094*** (P<2e-16) | –0.026* (P=0.045) | –0.132*** (P<2e-16) | –0.062** (P=1.3e-6) | 0.026* (P=3.8e-4) | 0.068*** (P=3.8e-15) |
| Neuroscience | 0.146*** (P<2e-16) | 0.185*** (P<2e-16) | 0.112*** (P<2e-16) | 0.186*** (P<2e-16) | –0.195*** (P<2e-16) | –0.122*** (P<2e-16) | |
| Psychiatry | 0 | 0 | 0 | 0 | 0 | 0 | |
| Low-middle income country status | No | 0 | 0 | 0 | 0 | 0 | 0 |
| Yes | –0.118** (P=7.4e-8) | –0.242*** (P<2e-16) | –0.128** (P=8.0e-8) | –0.237*** (P<2e-16) | 0.073* (P=1.4e-5) | 0.009 (P=0.628) | |
| Gender | Woman | 0 | 0 | 0 | 0 | 0 | 0 |
| Man | 0.019 (P=0.107) | –0.031* (P=0.023) | –0.001 (P=0.911) | –0.048* (P=0.001) | 0.223*** (P<2e-16) | 0.254*** (P<2e-16) | |
| Document type | Article | 0 | 0 | 0 | 0 | 0 | 0 |
| Review | –0.040* (P=0.001) | –0.139*** (P<2e-16) | –0.063* (P=1.3e-5) | –0.142*** (P<2e-16) | 0.151*** (P<2e-16) | –0.019* (P=0.046) | |
Appendix 3—table 4
Tests for uniformity, outliers, and dispersion in models.
Tests were performed using the DHARMa package in R. Uniformity: Asymptotic one-sample Kolmogorov-Smirnov test. DHARMa outlier test based on exact binomial test with approximate expectations. DHARMa nonparametric dispersion test via sd of residuals fitted vs. simulated. DHARMa zero-inflation test via comparison to expected zeros with simulation under H0=fitted model.
| Count | Rate | Number of papers | ||||
|---|---|---|---|---|---|---|
| First Author | Last Author | First Author | Last Author | First Author | Last Author | |
| Uniformity | D=0.010 (P=3.1e-6) | D=0.016 (P=1.4e-9) | D=0.030 (P<2.2e-16) | D=0.041 (P<2.2e-16) | D=0.097 (P<2.2e-16) | D=0.078 (P<2.2e-16) |
| Outliers | 0.009 outlier frequency (P=1.2e-5) | 0.010 outlier frequency (P=5.0e-4) | 0.011 outlier frequency (P=4.0e-14) | 0.009 outlier frequency (P=0.004) | 0.013 outlier frequency (P<2.2e-16) | 0.012 outlier frequency (P<2.2e-16) |
| Dispersion | dispersion = 1.358 (P<2.2e-16) | dispersion = 1.211 (P<2.2e-16) | dispersion = 1.251 (P<2.2e-16) | dispersion = 1.058 (P<2.2e-16) | dispersion = 1.775 (P<2.2e-16) | dispersion = 1.258 (P<2.2e-16) |
| Zero Inflation | ratio = 0.977 (P<2.2e-16) | ratio = 0.858 (P<2.2e-16) | ratio = 0.913 (P<2.2e-16) | ratio = 0.806 (P<2.2e-16) | ratio = 0.250 (P<2.2e-16) | ratio = 0.173 (P<2.2e-16) |
Additional files
Download links
A two-part list of links to download the article, or parts of the article, in various formats.
Downloads (link to download the article as PDF)
Open citations (links to open the citations from this article in various online reference manager services)
Cite this article (links to download the citations from this article in formats compatible with various reference manager tools)
Trends in self-citation rates in high-impact neurology, neuroscience, and psychiatry journals
eLife 12:RP88540.
https://doi.org/10.7554/eLife.88540.4


