Myomatrix arrays for high-definition muscle recording
- Department of Biology, Emory University, United States
- School of Electrical and Computer Engineering, Georgia Institute of Technology, United States
- Graduate Program in Biomedical Engineering at Emory University and Georgia Tech, United States
- Department of Physiology and Pharmacology, Western University, Canada
- Neuroscience Graduate Program, Emory University, United States
- Graduate Program in BioEngineering, Georgia Tech, United States
- Graduate Program in Electrical and Computer Engineering, Georgia Tech, United States
- Zuckerman Mind Brain Behavior Institute at Columbia University, United States
- Department of Biomedical Engineering at Emory University and Georgia Tech, United States
- Champalimaud Neuroscience Programme, Champalimaud Foundation, Portugal
- Department of Biology, Tufts University, United States
- Solomon H. Snyder Department of Neuroscience, Johns Hopkins School of Medicine, United States
- Departments of Biomedical Engineering and Neurology, Johns Hopkins School of Medicine, United States
- Salk Institute for Biological Studies, United States
- Department of Physiology and Biophysics, University of Colorado Anschutz Medical Campus, United States
- Department of Neurobiology & Anatomy, Drexel University, College of Medicine, United States
- Department of Physical Therapy and Rehabilitation Sciences, Drexel University College of Nursing and Health Professions, United States
- Department of Health and Rehabilitation Sciences, Temple University, United States
- Allen Institute, United States
Figures
Figure 1 with 3 supplements
Myomatrix arrays record muscle activity at motor unit resolution.
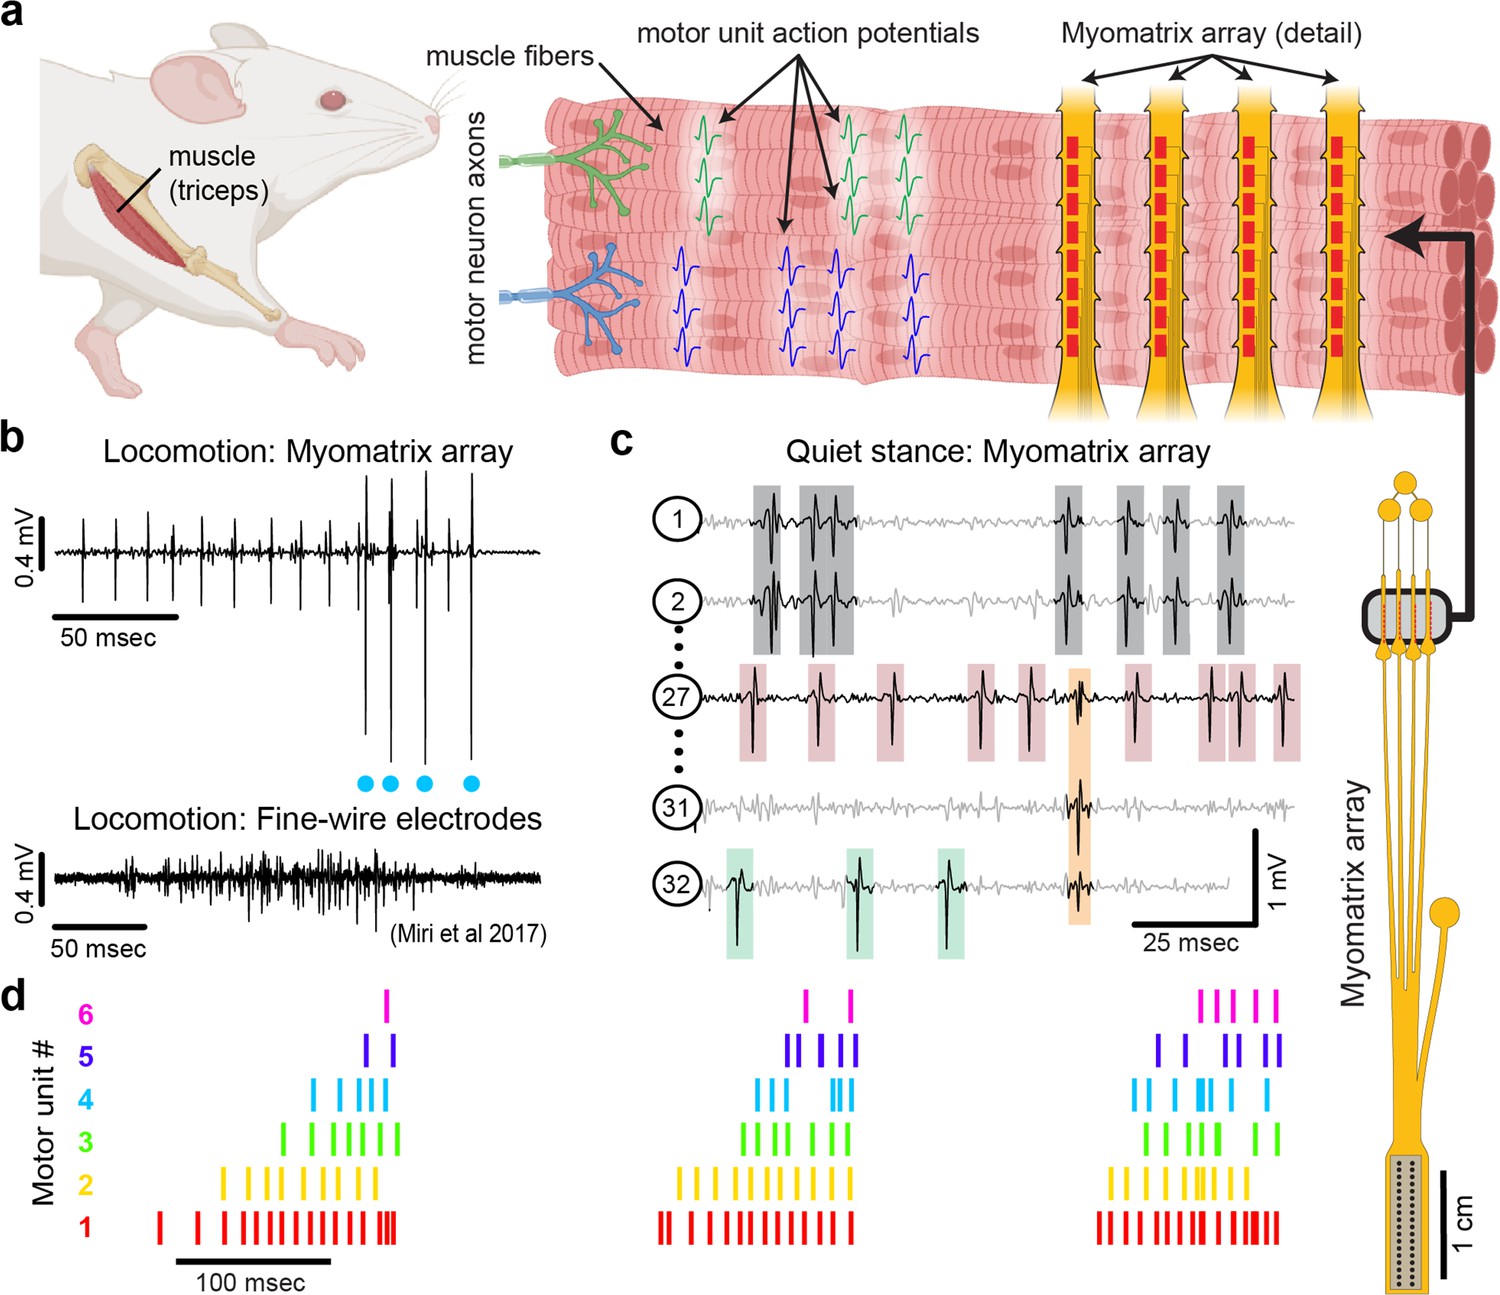
(a) The nervous system controls behavior via motor units, each consisting of a single motor neuron and the muscle fibers it innervates. Each motor neuron’s spiking evokes motor unit action potentials in the corresponding muscle fibers. Myomatrix arrays (right) bearing 32 electrode contacts on a flexible substrate (Figure 1—figure supplement 1) can be targeted to one or more muscles and yield high-resolution recordings of motor activity during free behavior. Motor neurons, muscle fibers, and electrode arrays are not shown to scale. (b, c) Example recordings from the right triceps muscle of a freely behaving mouse. (b) Top: bipolar Myomatrix recording from the mouse triceps during locomotion. Blue dots indicate the spike times of one motor unit isolated from the data using a spike-sorting method based on principal components analysis (PCA) (Figure 1—figure supplement 2a–d). Bottom: example data (from Miri et al., 2017, used with permission) from traditional fine-wire EMG recording of triceps activity during locomotion. Applying the PCA-based spike-sorting method to the fine-wire data did not isolate any individual motor units. (c) Unipolar Myomatrix recording during quiet stance. Colored boxes illustrate motor unit action potentials from four identified units. Spike waveforms from some units, including those highlighted with gray and orange boxes, appear on multiple electrode channels, requiring the use of a multichannel spike-sorting algorithm (see Figure 1—figure supplement 2e–h). (d) Spiking pattern (tick marks) of six individual motor units recorded simultaneously during locomotion on a treadmill. The three bursts of motor unit action potentials correspond to triceps activity during three stride cycles. Motor unit 4 (cyan) is the same motor unit represented by cyan dots in (b). The other motor units in this recording, including the smaller amplitude units at top in (b), were isolated using Kilosort but could not be isolated with the PCA-based method applied to data from only the single recording channel shown (b).
Figure 1—figure supplement 1

Myomatrix fabrication, design variations, and implantation.
(a) Workflow for electrode array fabrication. Layers of insulating polymer (polyimide) and conductive metal (gold) are successively deposited on a carrier wafer to form a flexible, 20- or 40-μm-thick electrode array of gold electrode contacts, which receive a surface treatment of PEDOT to improve recording properties (see ‘Methods’). Electrodes are connected via thin gold traces to a receiving pad for a high-density connector (Omnetics Inc), which is then bonded to the array. The completed array is then peeled off the carrier wafer. (b) Photo showing two different Myomatrix designs (left) as well as ‘blank’ arrays comprised only of the flexible polyimide substrate for surgical practice and design optimization. (c–e) Expanded views of the electrode array also shown in Figure 1, which has four ‘threads’ each bearing eight electrode contacts. This array design can be used for either acute or chronic recordings. For chronic implantation, the surgeon grasps the ‘pull-through tabs’ when tunneling the threads subcutaneously. For intramuscular implantation in either acute or chronic settings, a needle is used to pull each thread through the target muscle. In this use case, the ‘depth-restrictor tabs’ prevent the thread from being pulled any further into the muscle, thereby determining the depth of the electrode contacts within the muscle. (d, e) Detailed views highlighting sub-millimeter features used to increase electrode stability within the muscle (barbs, suture holes) and labels to indicate which channel/thread labels have been implanted in which muscles. (f, g) Design variations. The fabrication process shown in (a) can easily be modified to alter size and shape of the electrode array. Each Myomatrix design in (f) and (g) has 32 electrode contacts. (f) Two array designs customized for chronic recording applications in different muscle groups in rodents. (g) Injectable array for recording forelimb muscles in nonhuman primates. (h) For chronic implantation in mice, the connector end of the array is attached to the skull using dental acrylic (1) and the flexible array threads are then routed subcutaneously to a small distal incision located near the targeted muscle or muscles (2). For intramuscular implantation, the surgeon secures each thread to a suture and needle, which are then inserted through the target area of muscle tissue (3). The surgeon then pulls the suture further through the muscle, eventually drawing the array thread into the muscles such that the depth-restrictor tabs prevent further insertion and ensure that the electrode contacts are positioned at the correct depth within the muscle (4). In contrast, for epimysial (as opposed to intramuscular) implantation, the array threads are sutured to the surface of the muscle fascia rather than being inserted with a suture needle. After all threads are secured to the muscle, the distal incision site is sutured closed (5). (i) For percutaneous insertion of injectable arrays, the array’s thin ‘tail’ is loaded into a modified hypodermic syringe (Loeb and Gans, 1986; Muceli et al., 2015). During insertion, the tail is secured by bending it back over the plastic needle holder and securing it with either the surgeon’s fingers or an additional syringe inserted into the cannula. After electrode array insertion the needle is gently pulled out of the muscle, leaving the electrode-bearing part of the array thread within the target muscle for the duration of the recording session. After recording, the electrode and tail are gently pulled out of the muscle together as with injectable fine-wire EMG (Loeb and Gans, 1986).
Figure 1—figure supplement 2
Spike sorting.
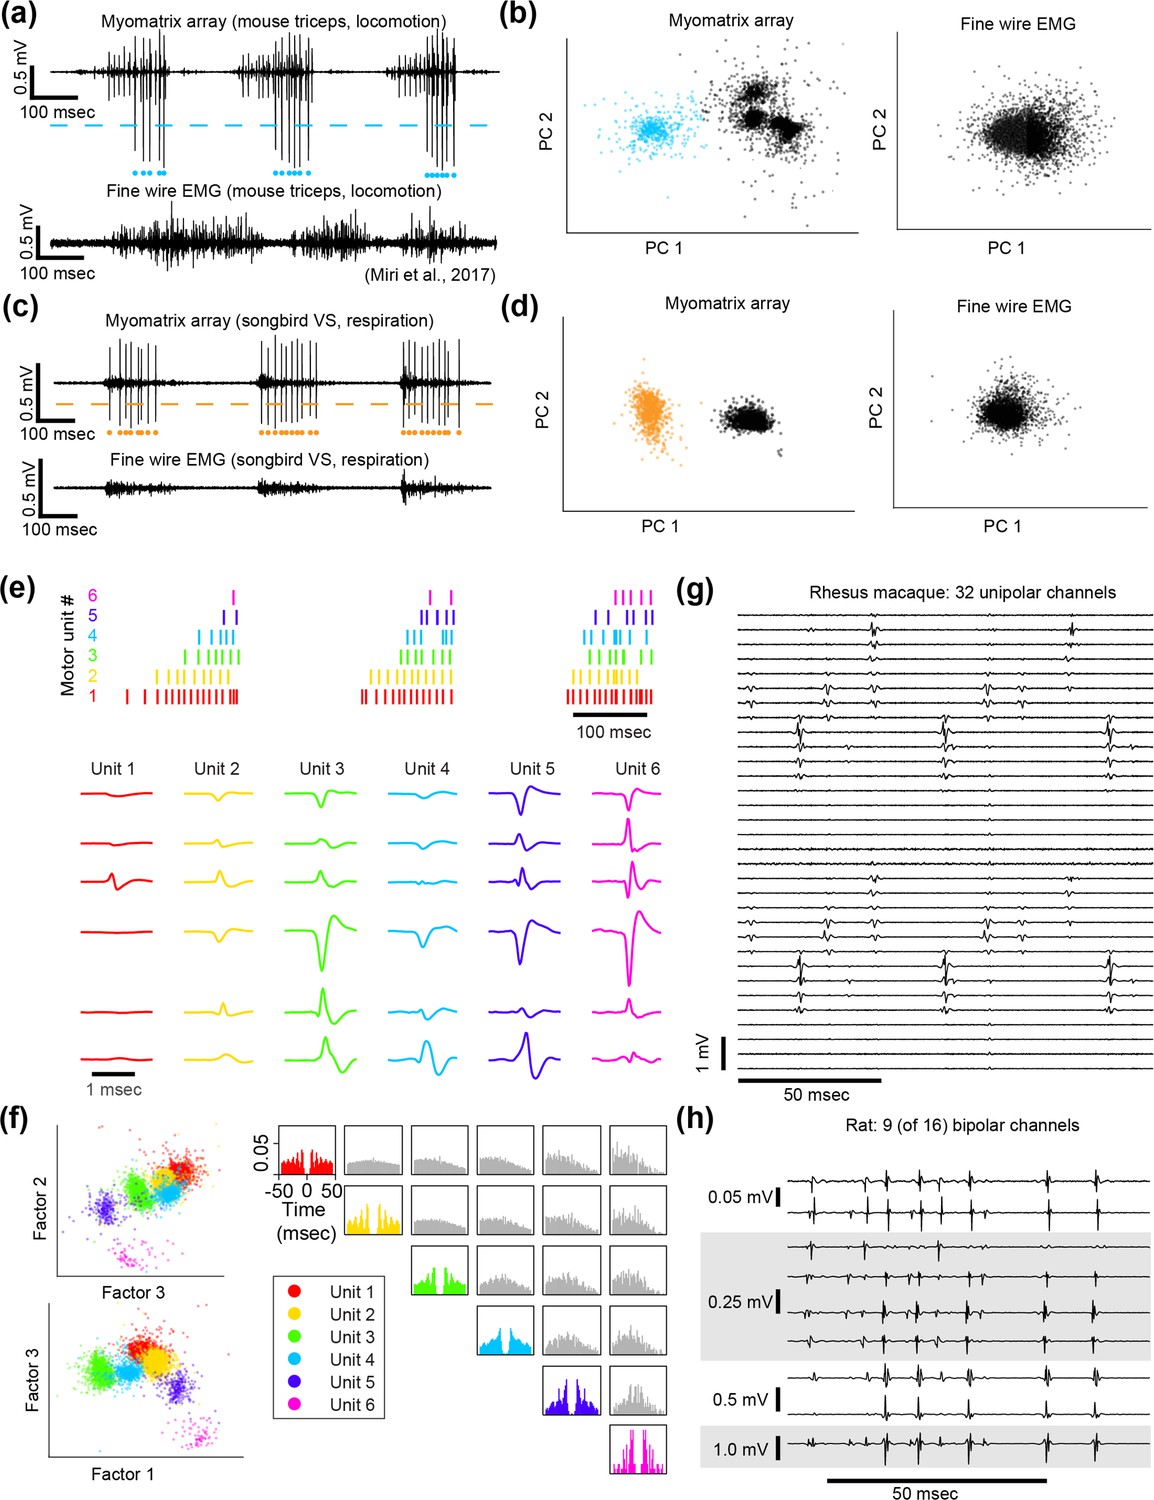
Action potential (‘spike’) waveforms from individual motor units can be identified (‘sorted’) using analysis methods that are commonly used to sort spikes from neural data. (a–d) Single-channel spike sorting. In some cases, a single motor unit’s spike will dominate the recording on an individual Myomatrix channel, as shown in an example bipolar recording from mouse triceps during locomotion (a, top). In such cases, a simple voltage threshold (dashed line) can be used to isolate spike times of the largest recorded unit (blue dots) from a single channel. In contrast (a, bottom), fine-wire EMG typically does not yield isolated single units during active behaviors. (b) Single-channel spike sorting using principal components analysis (PCA) of the data shown in (a). Each data point in (b) represents a single-voltage waveform represented in the dimensions defined by the first two principal components (PC1 and PC2) of the set of all spike waveforms. As described previously (Sober et al., 2008), k-means clustering can discriminate the waveforms from individual motor units (cyan dots in a and b) and waveforms from other motor units and/or background noise (black dots in b). If one of the clusters has less than 1% overlap with any other cluster (based on fitting each cluster with a 2D Gaussian as described previously) and displays an absolute refractory period (less than 1% of inter-spike intervals less than 1 ms), it is classified as a single unit (Sober et al., 2008). When applied to the Myomatrix data in (a), PCA-based sorting method produced identical spike times as the thresholding method (cyan dots in a). In contrast, the same analysis applied to the fine-wire data shown in (a) did not produce any well-isolated clusters in PCA space (b, right), indicating that this method could not extract any single motor units. Myomatrix and fine-wire data shown in (a, b) are from the same datasets as the examples shown in Figure 1a and b. (c, d) Single-channel spike sorting applied to bipolar Myomatrix recordings from the ventral syringeal (VS) muscle, a songbird vocal muscle (Srivastava et al., 2015). Here again, PCA-based sorting of Myomatrix data method produced identical spike times as the thresholding method (orange dots in c and d). In contrast, the same analysis applied to fine-wire data recorded from VS shown in (c) did not produce any well-isolated clusters in PCA space (d, right), Other plotting conventions for (c, d) are the same as for the mouse data in (a, b). (e–h) Multichannel spike sorting using Kilosort. We used Kilosort version 2.5 (Pachitariu et al., 2023; Steinmetz et al., 2021) and custom MATLAB and Python code to sort waveforms into clusters arising from individual motor units. (e) Spike times (top) and mean waveforms (bottom) of six motor units recorded simultaneously from mouse triceps during locomotion (same dataset as Figure 1). Mean waveforms for the six motor units (columns at bottom) are shown from six different EMG channels (rows) and illustrate the distinct pattern of spike waveforms across channel associated with the discharge of each identified motor unit. (f) Left: feature space projection of individual waveforms (colored dots), projected onto the space of singular values (‘factors’) that describe the space of all recorded waveforms. The clustering of waveforms from Kilosort-identified units (colors) further illustrates the distinctness of voltage waveforms assigned to each of the identified motor units. Right: autocorrelograms (colors) and cross-correlograms (gray) of the six motor units shown in (e). In addition to examining the consistency of each candidate motor unit’s spike waveforms, we also inspected autocorrelations to ensure that each identified unit showed an absolute refractory period (zero or near-zero autocorrelations at lag zero) and that cross-correlograms did not have strong peaks at zero lag (which might indicate the same motor unit being detected by multiple Kilosort clusters). (g, h) Myomatrix recordings from nonhuman primate and rat (unipolar and bipolar recordings, respectively, same datasets as in Figures 3 and 2c), respectively. These examples (along with the mouse data in Figure 1c) highlight the finding that Myomatrix arrays typically record the same motor unit on multiple channels simultaneously. This redundancy is critical for Kilosort and related methods to isolate single motor unit waveforms, particularly when waveforms from multiple units overlap in time.
Figure 1—figure supplement 3

Longevity of Myomatrix recordings.
In addition to isolating individual motor units, Myomatrix arrays also provide stable multiunit recordings of comparable or superior quality to conventional fine-wire EMG. (a, b) Bipolar Myomatrix recordings from the triceps muscle of a mouse recorded during treadmill locomotion over a period 61 d. Colored regions in (b) highlight the ‘stance’ phase (when the paw from the recorded forelimb is in contact with the treadmill surface) and ‘swing’ phase (when the paw is lifted off the treadmill surface). To quantify changes in recording quality over time, we computed a ‘signal-to-noise ratio (SNR)’ for each of each stride cycle as described previously (Pack et al., 2023). Here, the ‘locomotor SNR’ for each swing-stance-cycle is defined as the root mean square (RMS) amplitude of the multiunit EMG signal during each single-stance cycle divided by the RMS of the EMG signal during the immediately subsequent swing phase. (c) Fine-wire EMG data recorded from the triceps muscle during locomotion (reproduced with permission from Miri et al., 2017). Note that all horizontal gray bars in (b, c) represent 100 ms. (d) Mean ± standard error of locomotor SNR across five mouse subjects implanted with Myomatrix arrays. Filled symbols indicate EMG implantation in the right triceps muscle, unfilled symbols indicate EMG implantation in the left triceps. The black trace with unfilled symbols represents the animal whose data are also shown in panel (b). In some cases, error bars are hidden behind plotting symbols. Blue symbols indicate the locomotor SNR from the fine-wire data from Miri et al., 2017, with each symbol representing a single day’s recording from one of four individual mice. SNR values from Myomatrix arrays are significantly greater than those from fine-wire EMG, both when all data shown in (d) are pooled and when only data from day 14 are included (two-sample KS-test, p=0.002 and 0.038, respectively). (e) Although individual motor units were most frequently recorded in the first 2 wk of chronic recordings (see main text), Myomatrix arrays also isolate individual motor units after much longer periods of chronic implantation, as shown here where spikes from two individual motor units (colored boxes in bottom trace) were isolated during locomotion 65 d after implantation. This bipolar recording was collected from the subject plotted with unfilled black symbols in panel (d).
Figure 2
Myomatrix recordings across muscles and species.
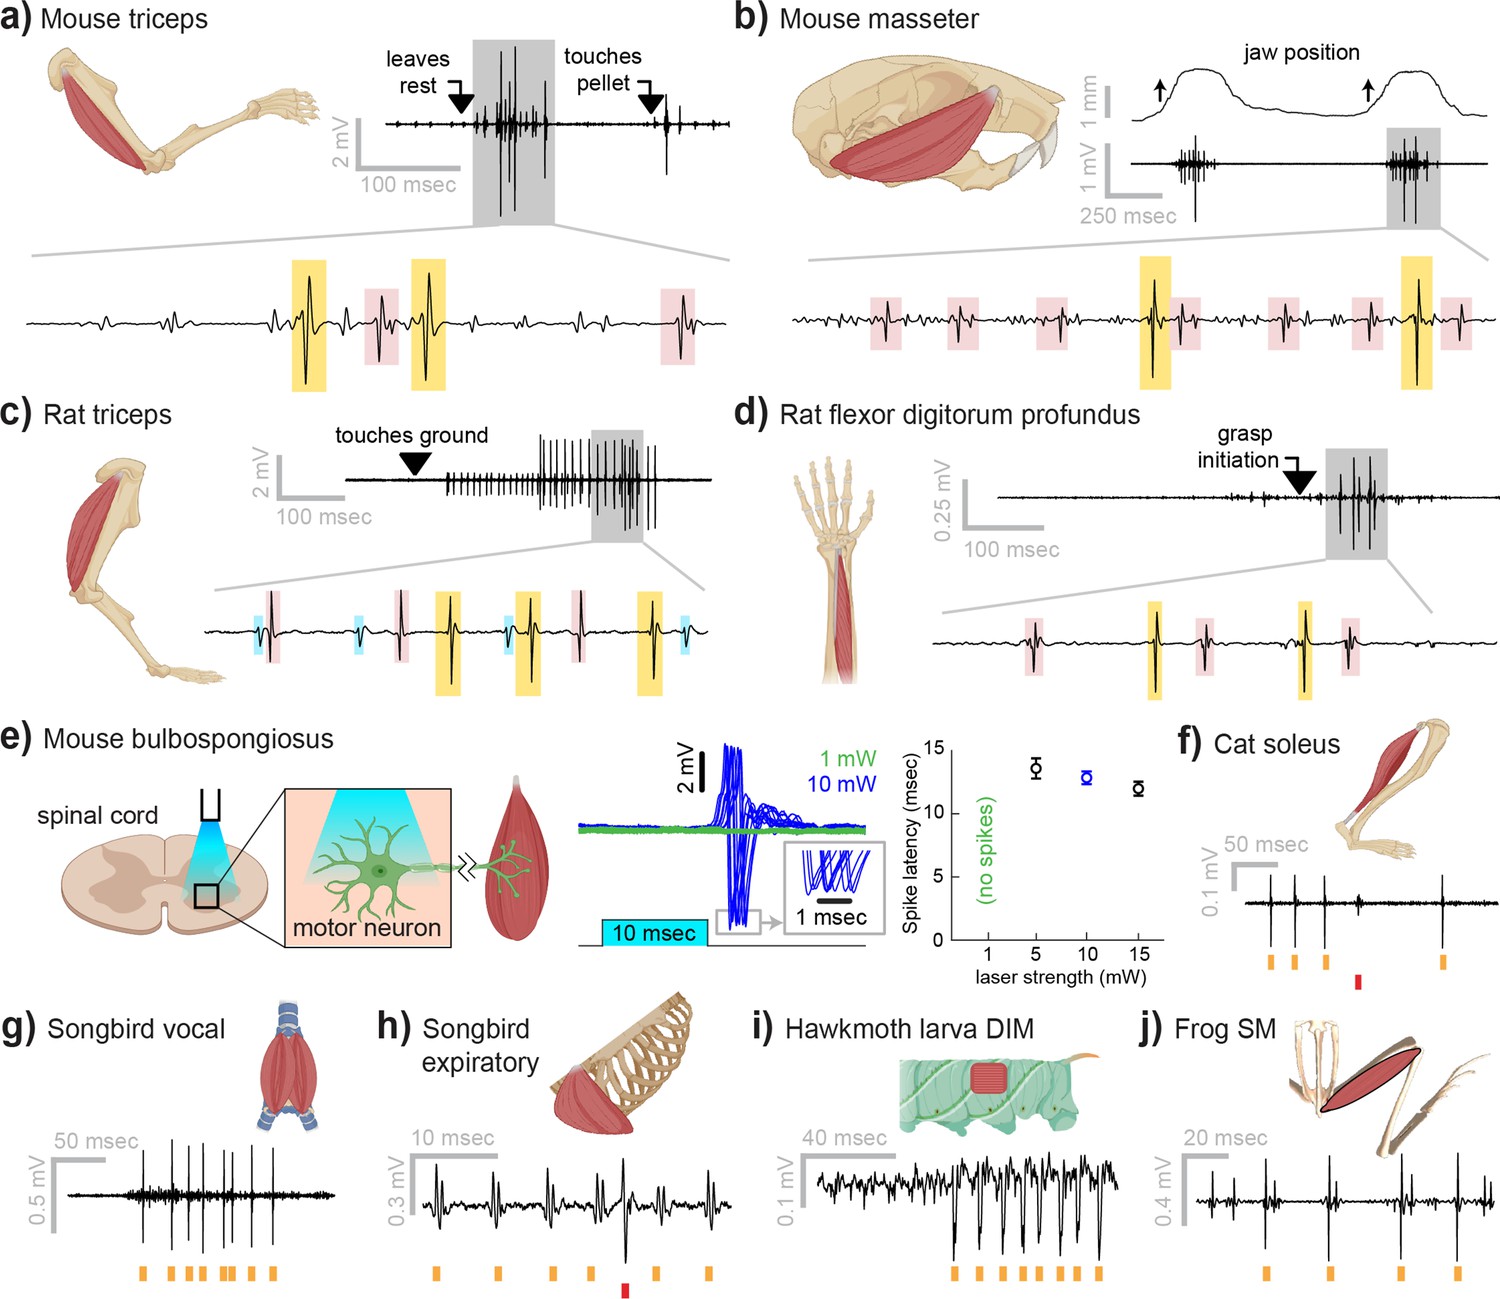
(a) Example recording from mouse triceps during a head-fixed pellet reaching task. Arrows at top indicate the approximate time that the animal’s paw leaves a rest position and first contacts the target. Bottom: colored boxes highlight motor unit action potentials identified using a multichannel spike sorting algorithm (Pachitariu et al., 2023). Different box colors on the same voltage trace indicate distinct motor units. (b) Recordings from the mouse superficial masseter muscle were obtained in anesthetized, head-fixed mice when passive mandible displacement evoked reflexive muscle contractions. Top trace shows the lateral component of jaw displacement, with arrows indicating the direction and approximate time of displacement onset. (c) In a recording from rat triceps during head-free locomotion, the arrowhead indicates the time that the mouse’s paw touched the treadmill surface, marking the beginning of the stance phase. (d) Recording from the rat flexor digitorum profundus muscle during a pellet reaching task, arrow indicates the time of grasp initiation. (e) Myomatrix recording of motor unit activity in the mouse bulbospongiosus muscle evoked by optical stimulation of spinal motor neurons, producing motor unit spikes at latencies between 10 and 15 ms, consistent with results obtained from traditional fine-wire electrodes in mice (Lenschow et al., 2022). (f–j) Recordings from the cat soleus (f) during sensory nerve stimulation, songbird vocal (ventral syringeal) muscle (g) and expiratory muscle (h) during quiet respiration, hawkmoth larva dorsal internal medial (DIM) muscle (i) during fictive locomotion, and bullfrog semimembranosus (SM) muscle (j) in response to cutaneous (foot) stimulation. Spike times from individual motor units are indicated by colored tick marks under each voltage trace in (f–j). Recordings shown in panels (a, c, g, h, i, and j) were collected using bipolar amplification, data in panels (b, d, e, and f) were collected using unipolar recording. See ‘Methods’ for details of each experimental preparation.
Figure 3
Motor unit recordings during active movement in primates.
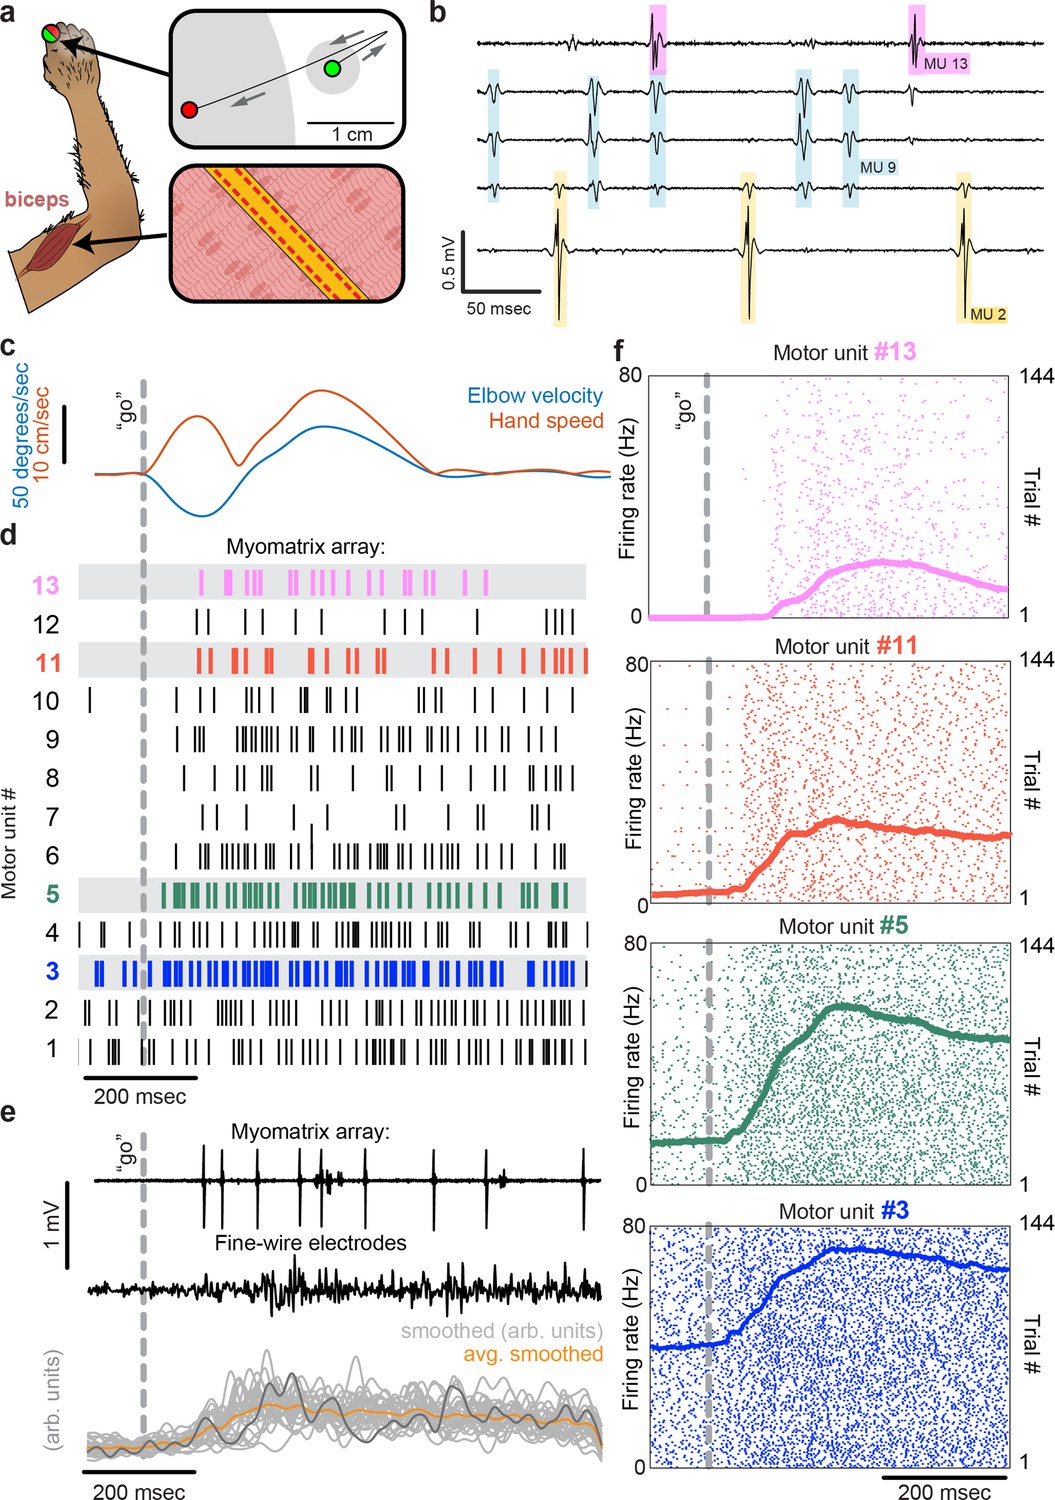
(a) An injectable version of the Myomatrix array (Figure 1—figure supplement 1g) was inserted percutaneously (Figure 1—figure supplement 1i) into the right biceps of a rhesus macaque performing a cued reaching task. Green and red dots: reach start and endpoints, respectively; gray regions: start and target zones. (b) Recording from 5 of 32 unipolar channels showing spikes from three individual motor units isolated from the multichannel recording (Figure 1—figure supplement 2). (c) At trial onset (dotted line), a sudden force perturbation extends the elbow, signaling the animal to reach to the target. (d) Spike times (tick marks) from 13 simultaneously recorded motor units. (e) Example voltage data from a Myomatrix array (top) and traditional fine-wire EMG (middle, bottom) collected from the same biceps muscle in the same animal performing the same task, but in a separate recording session. Gray traces (bottom) show smoothed EMG data from the fine-wire electrodes in all trials, orange trace shows trial-averaged smoothed fine-wire EMG, and dark gray trace represents smoothed data from the example fine-wire trace shown above it. (f) Spike times of four motor units (of the 13 shown in d) recorded simultaneously over 144 trials.
Author response image 1

Longevity of Myomatrix recordingsIn addition to isolating individual motor units, Myomatrix arrays also provide stable multi-unit recordings of comparable or superior quality to conventional fine wire EMG….
(e) Although individual motor units were most frequently recorded in the first two weeks of chronic recordings (see main text), Myomatrix arrays also isolate individual motor units after much longer periods of chronic implantation, as shown here where spikes from two individual motor units (colored boxes in bottom trace) were isolated during locomotion 65 days after implantation. This bipolar recording was collected from the subject plotted with unfilled black symbols in panel (d).
Additional files
Download links
A two-part list of links to download the article, or parts of the article, in various formats.
Downloads (link to download the article as PDF)
Open citations (links to open the citations from this article in various online reference manager services)
Cite this article (links to download the citations from this article in formats compatible with various reference manager tools)
Myomatrix arrays for high-definition muscle recording
eLife 12:RP88551.
https://doi.org/10.7554/eLife.88551.3


