Delta-dependent Notch activation closes the early neuroblast temporal program to promote lineage progression and neurogenesis termination in Drosophila
- Department of Biology, University of Virginia, United States
Figures
Figure 1
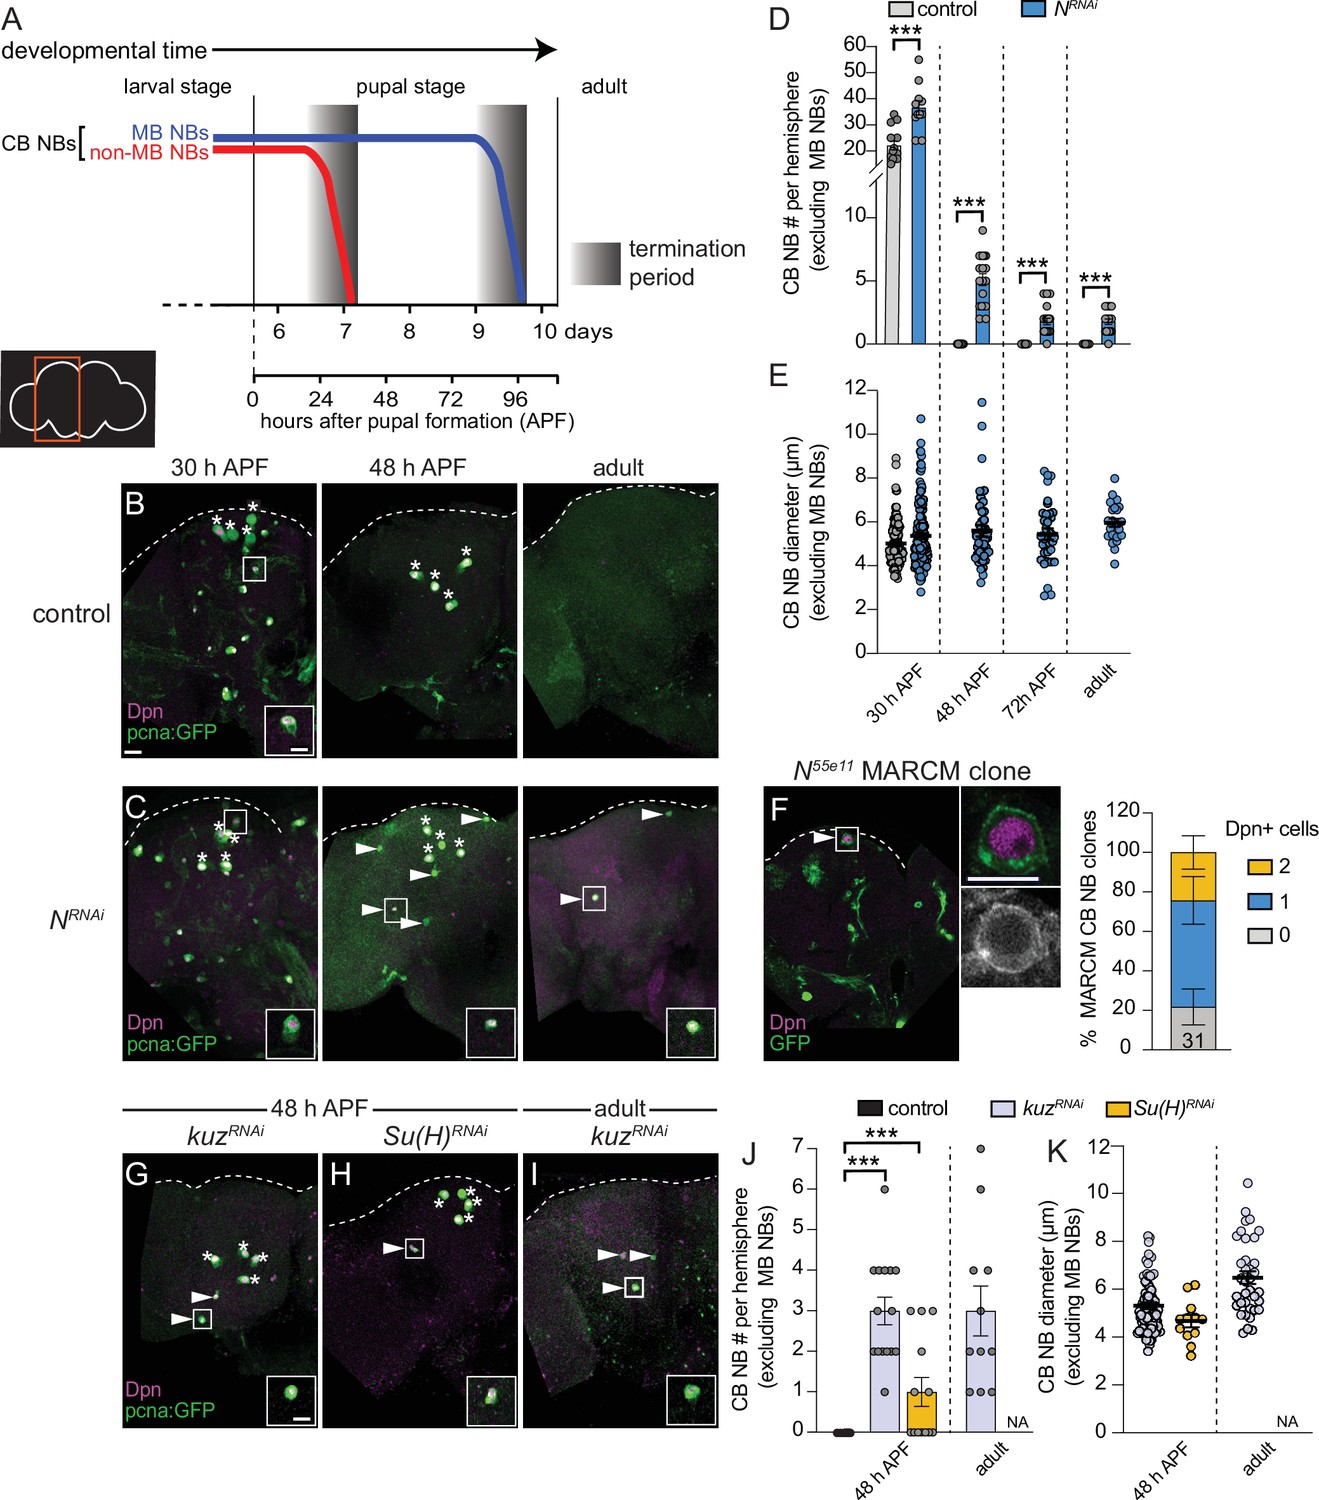
Notch signaling regulates timing of central brain neuroblast (CB NB) elimination and neurogenesis termination.
(A) Schematic showing developmental timeframe of CB NB elimination with timeline below used for developmental staging. (B–C, G–I) Maximum intensity projections of single brain hemispheres from indicated genotypes, times, with markers listed in bottom left. Asterisks indicate the four mushroom body (MB) NBs and arrowheads indicate some of the ectopically proliferating CB NBs (non-MB NBs). One ectopic CB NB (white box) shown at higher magnification in bottom right. (D, J) Quantification of CB NB number (excluding MB NBs) per brain hemisphere at indicated times and genotypes. Each data point represents one brain hemisphere, mean ± SEM, ***p-value ≤0.001 (unpaired two-tailed Student’s t-test). (E, K) Quantification of average CB NB diameter, used as a proxy for NB size, at indicated times and genotypes. Each data point equals one CB NB (n≥4 animals per genotype), mean ± SEM. (F) Single optical section of a brain hemisphere from indicated genotype at 48 hr APF (after pupal formation) with markers listed in panels with high magnification panel to right of ectopic CB NB in white box. Distribution of Notch55e11 MARCM CB NB clones containing Dpn positive NBs. Scale bar equals 20 μm (panels) or 10 μm (insets) in this and all subsequent figures. Panel genotypes listed in Supplementary file 1.
Figure 2

Delta expressed in CB neuroblasts (NBs), GMCs, and cortex glia regulates CB NB Notch activity.
(A–F) Single optical section of a brain hemisphere from the indicated genotypes at wandering L3 stages. Higher magnification image of the CB NB highlighted by the white box is shown to the right of the colored overlays. Top panels are higher magnification colored overlay with single channel grayscale images below. White brackets indicate the CB NB and yellow brackets indicate newborn GMC progeny. (G–L) Single optical section of a brain hemisphere from the indicated genotypes at 72 hr ALH. Higher magnification image of the CB NB highlighted by the white box is shown to the right of the colored overlays. Scale bar equals 20 μm (panels) and 10 μm (insets). CB: central brain; OL: optic lobe. Panel genotypes listed in Supplementary file 1.
Figure 3

Delta is required to eliminate central brain neuroblasts (CB NBs) and terminate neurogenesis.
(A, B, E) Maximum intensity projections of single brain hemispheres from indicated genotypes. Asterisks indicate the mushroom body (MB) NBs and the white arrowheads indicate some of the ectopically proliferating CB NBs. Inset shows a higher magnification of the ectopically proliferating CB NB highlighted by the white box. (C, F, H, J) Quantification of CB NB number (excluding the MB NBs). Each data point represents one brain hemisphere. Control data in (C) is the same as Figure 1D. Mean ± SEM. ***p≤0.001 (unpaired two-tailed Student’s t-test). (D, G, I) Quantification of CB NB size (excluding the MB NBs) in the indicated genotypes and developmental times. Each data point represents one NB (n≥4 animals per genotype). Control data in (D) is the same as Figure 1E. Mean ± SEM. ***p≤0.001, *p≤0.033 (Kruskal-Wallis test). Scale bar equals 20 μm (panels) and 10 μm (insets). Panel genotypes listed in Supplementary file 1.
Figure 4 with 1 supplement
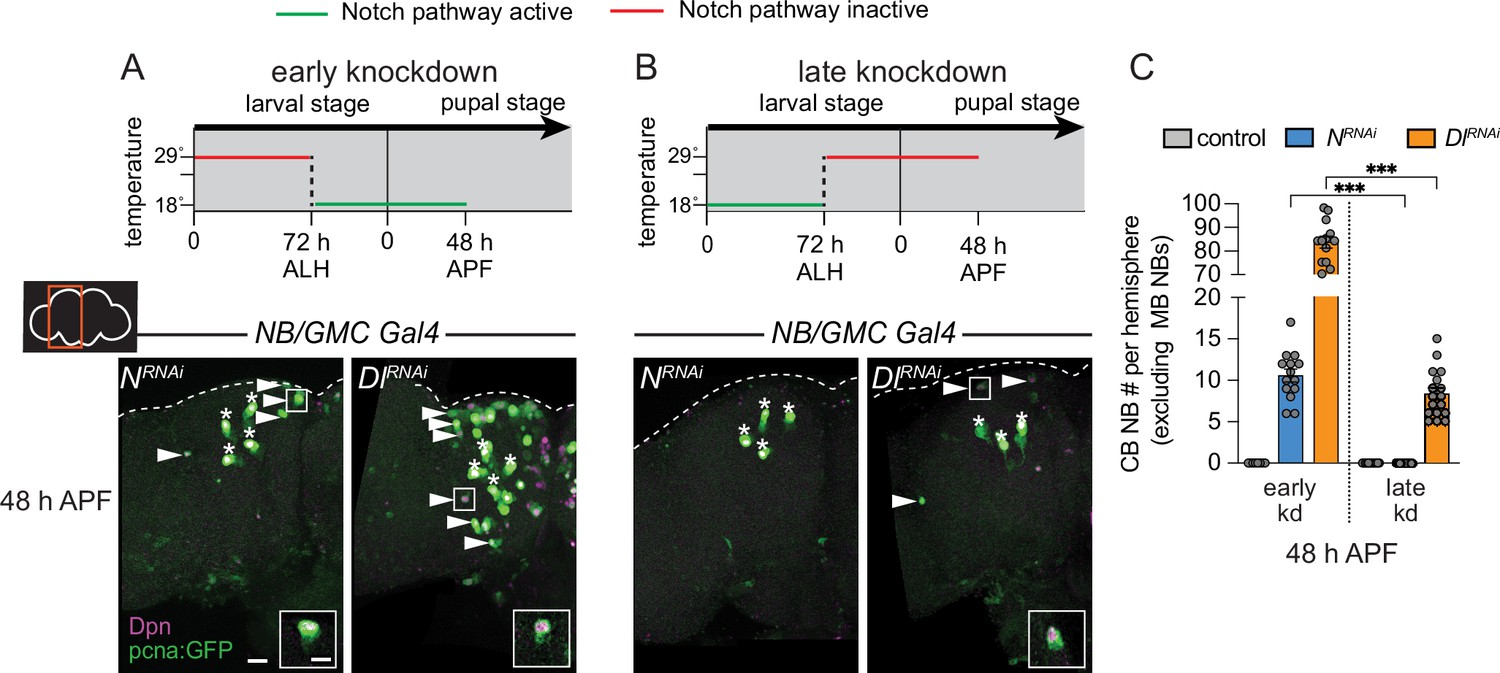
Notch is required early to eliminate central brain neuroblasts (CB NBs).
(A, B) Top, schematic depicting experimental setup to temporally control knockdown of Notch signaling. Bottom, maximum intensity projections of single brain hemispheres from indicated genotypes at 48 hr APF (after pupal formation) relative to 25°C. Asterisks indicate the mushroom body (MB) NBs and the white arrowheads indicate some of the ectopically proliferating CB NBs. Inset shows a higher magnification of an ectopically proliferating CB NB highlighted by the white box. (C) Quantification of CB NB number (excluding the MB NBs) in the indicated genotypes. Each data point represents one brain hemisphere. Mean ± SEM. ***p≤0.001 (Welch’s t-test). Scale bar equals 20 μm (panels) and 10 μm (insets). Panel genotypes listed in Supplementary file 1.
Figure 4—figure supplement 1
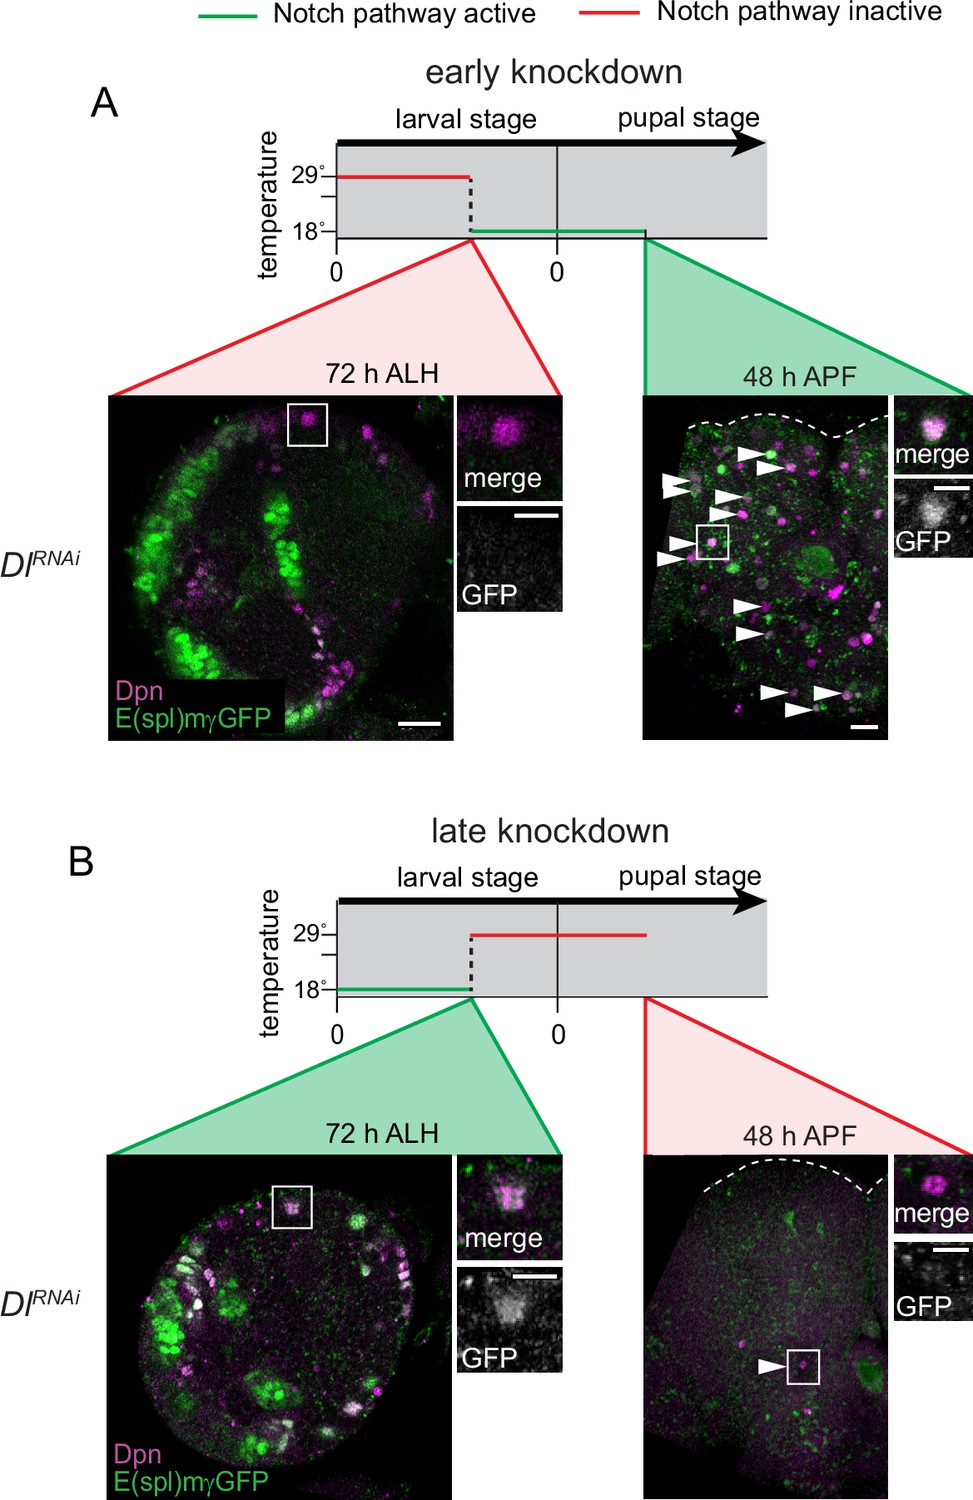
Temporal control of Notch activity in central brain neuroblasts (CB NBs).
Related to Figure 4. (A–B) Cartoon above depicts temperature shift regime. Below, single optical sections of brain hemispheres from indicated genotypes and developmental times, with markers listed in panels. Higher magnification image of the CB NB highlighted by the white box is shown to the right of the colored overlays. White arrow heads indicate some of the ectopically persisting CB NBs. Scale bar equals 20 μm (panels) and 10 μm (inset). Panel genotypes listed in Supplementary file 1.
Figure 5 with 1 supplement

Notch signaling refines temporal factor expression boundaries.
(A) Schematic of temporal factor expression in CB neuroblasts (NBs) during larval and pupal development. Top timeline (days) refers to developmental timing with two timelines below used for developmental staging. Larva hatch 22 hr after egg lay. (B, I) Quantification of the percentage of CB NBs (excluding the mushroom body [MB] NBs) in the indicated genotypes and developmental times expressing the indicated temporal factors. Mean ± SEM. n≥3 animals, ***p≤0.001, **p≤0.002, *p≤0.033 (two-way ANOVA). (C–H) Single optical section of a brain hemisphere from the indicated genotypes and developmental times. Higher magnification image of the CB NB highlighted by the white box is shown below the colored overlays. White brackets indicate the CB NB. (J) Single optical section of a CB NB, colored overlay with grayscale image below. White brackets indicate the CB NB with quantification of normalized nuclear E93 intensities. Column numbers indicate the number of CB NB clones (excluding the MB NBs) scored. Mean ± SEM. ***p≤0.001 (Mann-Whitney test). Scale bar equals 20 μm (panels) and 10 μm in single CB NB panels. CB: central brain; OL: optic lobe. Panel genotypes listed in Supplementary file 1.
Figure 5—figure supplement 1
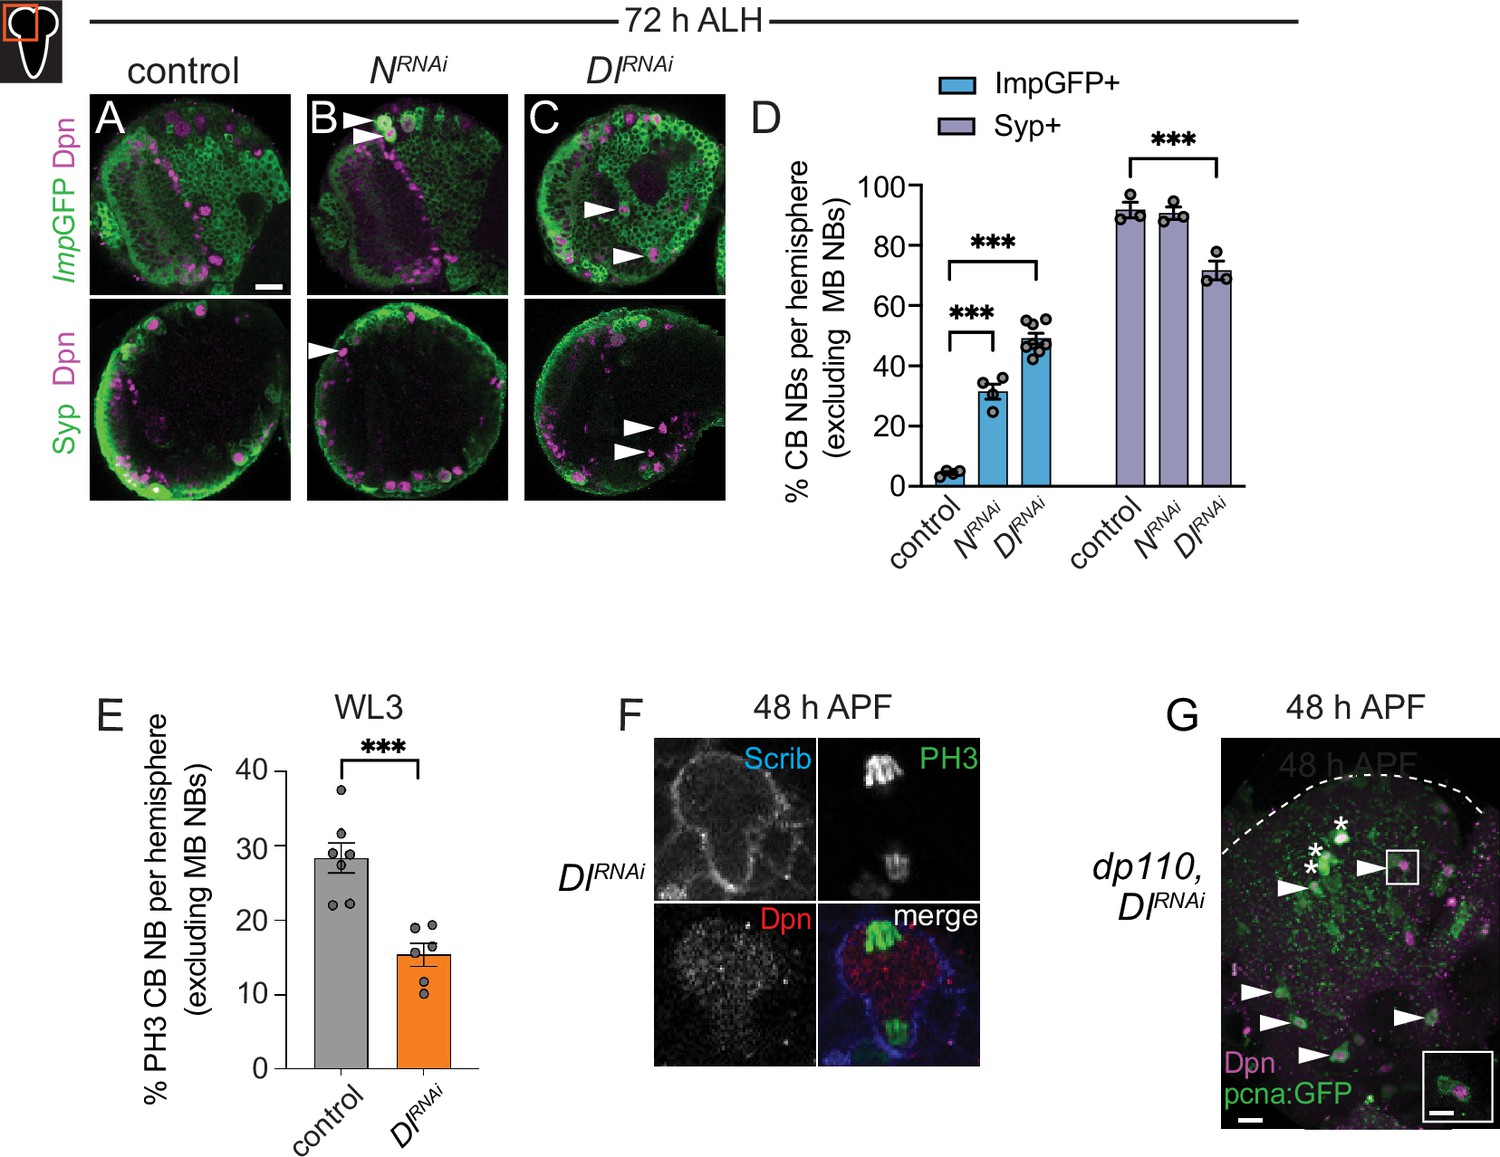
Imp expression is prolonged and Syp expression delayed in animals with reduced Notch pathway activity.
Related to Figure 5. (A–C) Single optical section of a brain hemisphere from the indicated genotypes at 72 hr ALH, with markers listed to left. White arrowheads indicate central brain neuroblasts (CB NBs) with ectopic expression of either Imp-GFP or no Syp expression. (D) Quantification of the percentage of CB NBs (excluding the mushroom body [MB] NBs) in the indicated genotypes at 72 hr ALH expressing the indicated temporal factors. Mean ± SEM. n≥3 animals, ***p≤0.001 (two-way ANOVA). (E) Quantification of the percentage of PH3 positive CB NBs (excluding the MB NBs) in the indicated genotypes at WL3 (wandering L3 stage). (F) Image of a mitotic non-MB NB at 48 hr ALH in Dl RNAi expressing animals. (G) Maximum intensity projection of a single brain hemisphere from indicated genotype and time with markers listed in bottom left. Asterisks indicate the MB NBs and arrowheads indicate some of the ectopically proliferating CB NBs (non-MB NBs). One ectopic CB NB (white box) shown at higher magnification in bottom right. Scale bar (A, G) equals 20 μm and inset (G) equals 10 μm. Panel genotypes listed in Supplementary file 1.
Figure 6 with 1 supplement
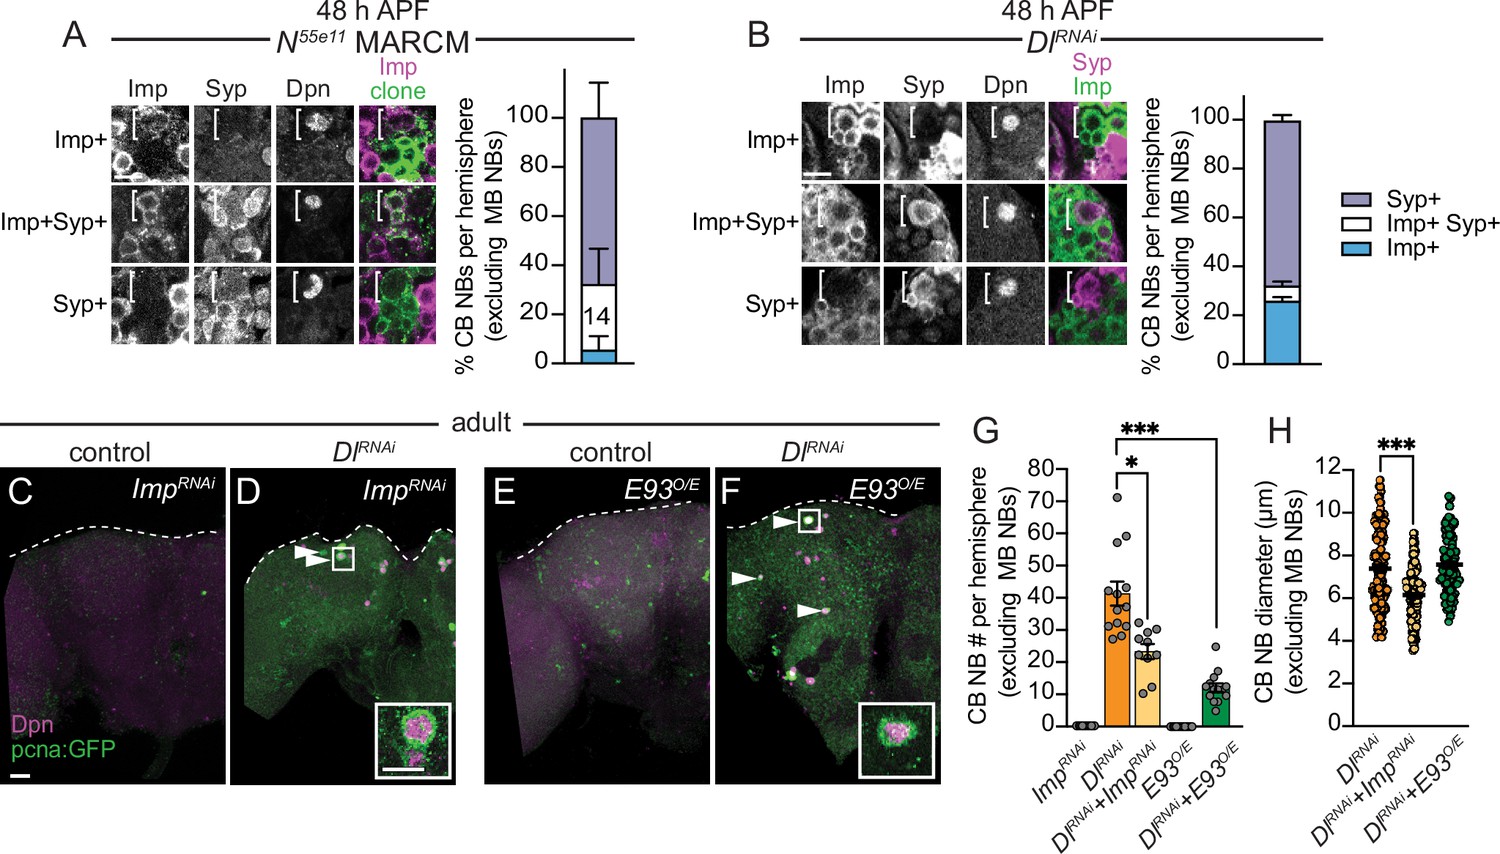
Central brain neuroblasts (CB NBs) ectopically persist due to prolonged early factor Imp expression and reduced late factor E93 expression.
(A, B) Single optical sections of CB NBs from indicated genotypes and developmental times. Single channel grayscale images with colored overlay to the right. White brackets indicate CB NBs. Right, percentage of CB NBs (excluding the mushroom body [MB] NBs) in the indicated genotypes and developmental times expressing the indicated temporal factors. Column number (A) indicates number of clones scored. Mean ± SEM. n≥3 animals (B). (C–F) Maximum intensity projections of single brain hemispheres from indicated genotypes in 1-day old adults. White arrowheads indicate some ectopically proliferating CB NBs (MB NBs are absent). Inset shows a higher magnification of an ectopically proliferating CB NB highlighted by the white box. (G) Quantification of CB NB number (excluding MB NBs) in the indicated genotypes. Each data point represents one brain hemisphere. Mean ± SEM. ***p≤0.001, *p≤0.033 (Kruskal-Wallis ANOVA). (H) Quantification of CB NB size (excluding the MB NBs) in the indicated genotypes. Each data point represents one CB NB (n≥4 animals per genotype). Mean ± SEM. ***p≤0.001, *p≤0.033 (Kruskal-Wallis ANOVA). Scale bar equals 20 μm (panels) and 10 μm (insets). Panel genotypes listed in Supplementary file 1.
Figure 6—figure supplement 1

Defects in temporal patterning account for defects in timing of central brain neuroblast (CB NB) elimination and neurogenesis termination when Notch activity is reduced.
Related to Figure 6. (A) Maximum intensity projection of single brain hemisphere from indicated genotype at indicated time. (B) Quantification of CB NB number (excluding the MB NBs) in the indicated genotypes. Each data point represents one brain hemisphere. Mean ± SEM. ***p≤0.001, **p≤0.002 (Kruskal-Wallis ANOVA). Scale bar equals 20 μm. Panel genotypes listed in Supplementary file 1.
Figure 7
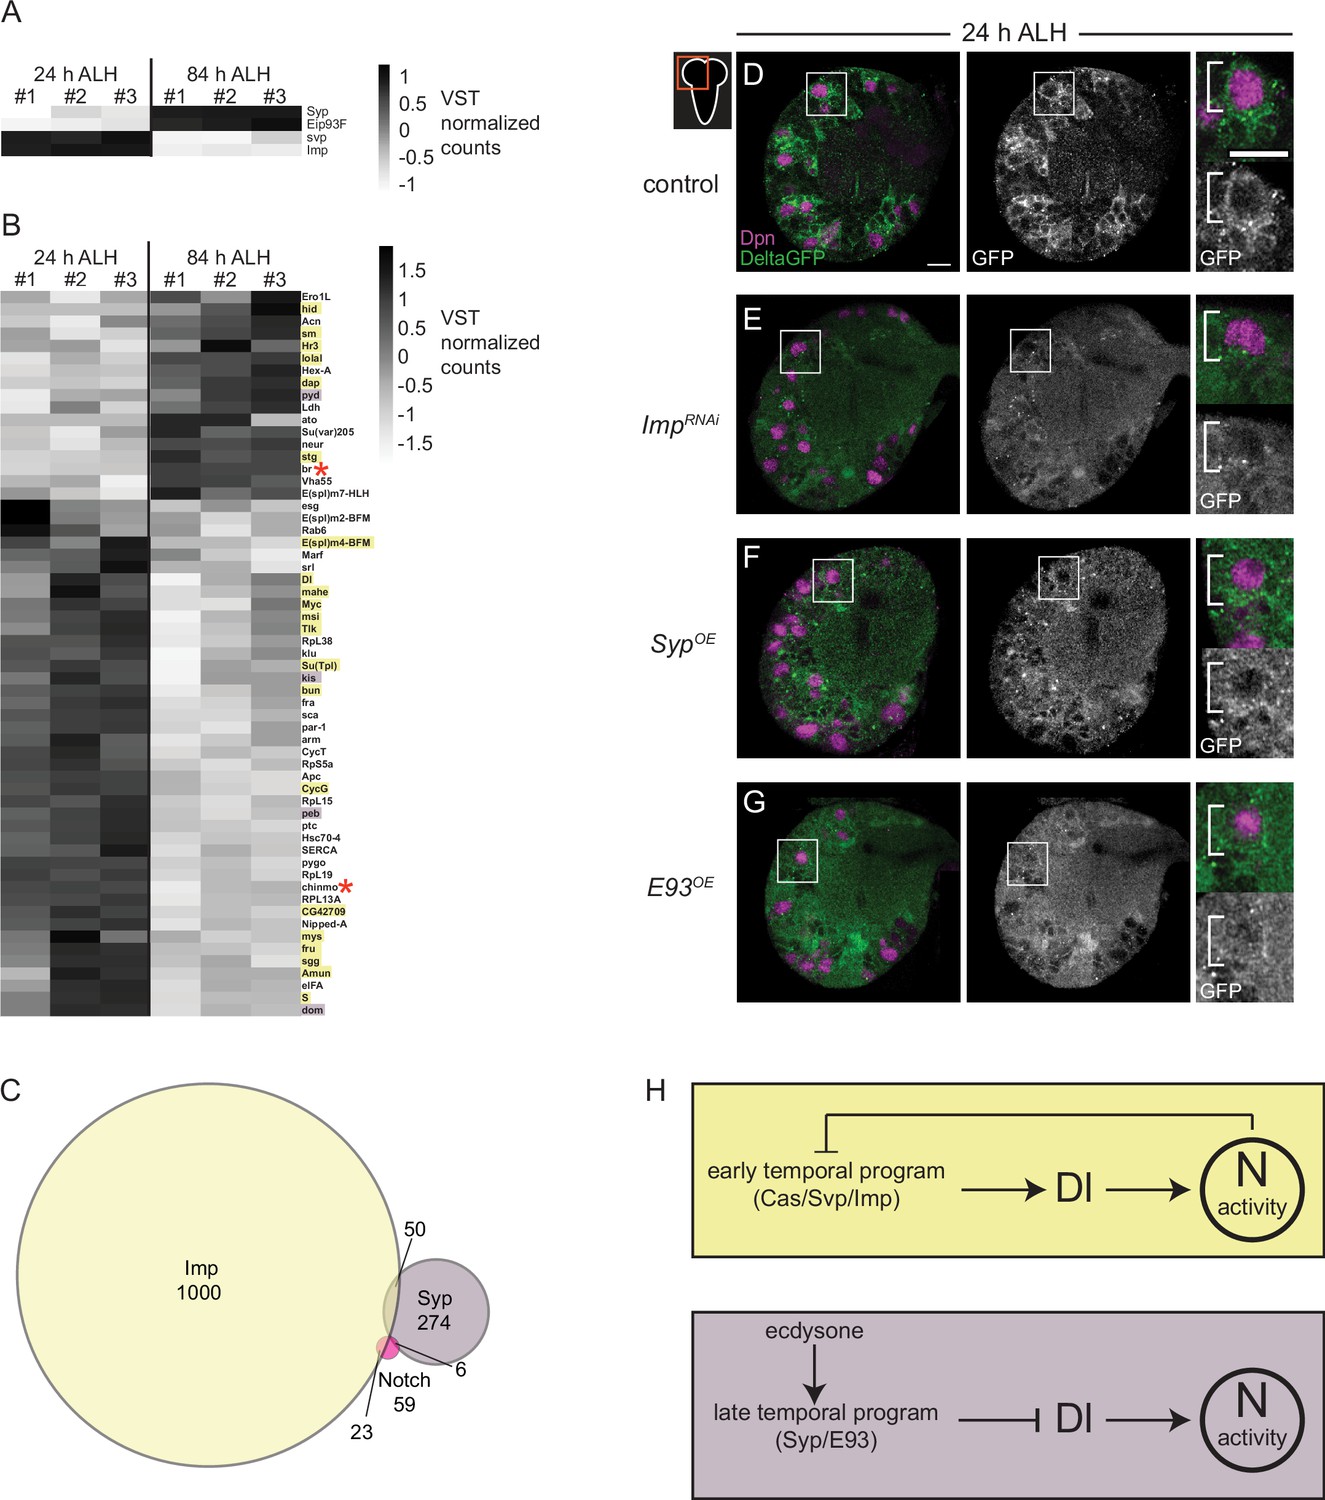
Delta is expressed at higher levels early and is positively regulated by the early temporal factor Imp.
(A–B) Heatmap showing the list of genes that are differentially expressed in the AL neuroblasts (NBs) from 24 to 84 hr ALH. In (B) genes are color coded to show if they are also targets of either Imp (yellow) or Syp (purple) or both (red asterisk). Variance-stabilizing transformation (VST) normalized counts were used to plot the heatmaps. (C) Venn diagram showing the number of target genes analyzed that are common between Notch, Imp, and Syp. (D–G) Single optical section of a brain hemisphere from the indicated genotypes at 24 hr ALH expressing Delta-GFP. Higher magnification image of the central brain (CB) NB highlighted by the white box is shown to the right of the single channel grayscale images. Top panels are higher magnification colored overlay with single channel grayscale images below. White brackets indicate the NB. Scale bar equals 10 μm. Panel genotypes listed in Supplementary file 1. (H) Model of Delta-dependent Notch activation in regulation of CB NB temporal patterning.
Tables
Key resources table
| Reagent type (species) or resource | Designation | Source or reference | Identifiers | Additional information |
|---|---|---|---|---|
| Antibody | Anti-Dpn (rat monoclonal) | Abcam | ab195173 | IF (1:1000) |
| Antibody | Anti-GFP (chicken polyclonal) | Abcam | ab13970 | IF (1:500) |
| Antibody | Anti-dsRed (rabbit polyclonal) | Clontech | 632496 | IF (1:1000) |
| Antibody | Anti-PH3 (rabbit polyclonal) | Millipore | 06-570 | IF (1:1000) |
| Antibody | Anti-Repo (mouse monoclonal) | Developmental Studies Hybridoma Bank | 8D12 | IF (1:5) |
| Antibody | Anti-Prospero (mouse monoclonal) | Developmental Studies Hybridoma Bank | MR1A | IF (1:1000) |
| Antibody | Anti-Svp (mouse monoclonal) | Developmental Studies Hybridoma Bank | 5B11 | IF (1:10) |
| Antibody | Anti-Dlg (mouse monoclonal) | Developmental Studies Hybridoma Bank | 4F3 | IF (1:40) |
| Antibody | Anti-Scribble (rabbit polyclonal) | Gift from Chris Q Doe | IF (1:500) | |
| Antibody | Anti-Cas (rabbit polyclonal) | Gift from Chris Q Doe | IF (1:500) | |
| Antibody | Anti-Syp (rabbit polyclonal) | Gift from Chris Q Doe | IF (1:250) | |
| Antibody | Anti-E93 (guinea pig polyclonal) | Gift from Chris Q Doe | IF (1:250) | |
| Antibody | Anti-Imp (rabbit polyclonal) | Gift from Paul MacDonald | IF (1:250) | |
| Antibody | Anti-Imp (rat polyclonal) | Gift frorm Claude Desplan | IF (1:250) | |
| Antibody | Anti-Dpn (guinea pig polyclonal) | Gift from Claude Desplan | IF (1:1000) | |
| Antibody | Alexa 488 (goat anti-chicken polyclonal) | Thermo Fisher Scientific | A32931 | IF (1:300) |
| Antibody | Alexa 555 (goat anti-rat polyclonal) | Thermo Fisher Scientific | A48263 | IF (1:300) |
| Antibody | Alexa 647 (goat anti-rat polyclonal) | Thermo Fisher Scientific | A48265 | IF (1:300) |
| Antibody | Alexa 405 (goat anti-rabbit polyclonal) | Thermo Fisher Scientific | A48254 | IF (1:300) |
| Antibody | Alexa 555 (goat anti-rabbit polyclonal) | Thermo Fisher Scientific | A21428 | IF (1:300) |
| Antibody | Alexa 633 (goat anti-rabbit polyclonal) | Thermo Fisher Scientific | A21071 | IF (1:300) |
| Antibody | Alexa 405 (goat anti-mouse polyclonal) | Thermo Fisher Scientific | A48255 | IF (1:300) |
| Antibody | Alexa 488 (goat anti-mouse polyclonal) | Thermo Fisher Scientific | A11001 | IF (1:300) |
| Antibody | Alexa 555 (goat anti-mouse polyclonal) | Thermo Fisher Scientific | A32727 | IF (1:300) |
| Antibody | Alexa 488 (goat anti-guinea pig polyclonal) | Thermo Fisher Scientific | A11073 | IF (1:300) |
| Antibody | Alexa 555 (goat anti-guinea pig polyclonal) | Thermo Fisher Scientific | A21435 | IF (1:300) |
| Chemical compound, drug | SlowFade Diamond antifade reagent | Invitrogen | Catalog # S36963 | |
| Chemical compound, drug | SlowFade Gold antifade reagent | Invitrogen | Catalog # S36937 | |
| Chemical compound, drug | Normal Goat Serum | Thermo Fisher Scientific | Catalog # 31873 | |
| Chemical compound, drug | Paraformaldehyde 16% solution EM grade | Electron Microscopy Sciences | Catalog # 15710 | |
| Chemical compound, drug | Schneider's Drosophila media | Gibco | Catalog # 21720-024 | |
| Chemical compound, drug | Triton X-100 | Sigma | Catalog # T9284 | |
| Software, algorithm | ImageJ/Fiji | Fiji | http://fiji.sc/ | |
| Software, algorithm | LAS AF | Leica Microsystems | https://www.leica-microsystems.com/products/microscope-software/details/product/leica-las-x-ls/ | |
| Software, algorithm | Prism 9 | GraphPad | https://www.graphpad.com/scientific-software/prism/ | |
| Software, algorithm | Photoshop 2022 | Adobe | https://www.adobe.com/products/photoshop.html | |
| Software, algorithm | Illustrator 2022 | Adobe | https://www.adobe.com/products/illustrator.html | |
| Software, algorithm | R-studio | R-studio | https://www.rstudio.com/ | |
| Genetic reagent (D. melanogaster) | Oregon R | Bloomington Drosophila Stock Center | 5 | |
| Genetic reagent (D. melanogaster) | wor-Gal4 | Albertson and Doe, 2003 | ||
| Genetic reagent (D. melanogaster) | tubulin-Gal80(ts) | Bloomington Drosophila Stock Center | 7108 | |
| Genetic reagent (D. melanogaster) | repo-Gal4 | Bloomington Drosophila Stock Center | 7415 | |
| Genetic reagent (D. melanogaster) | NP0577-Gal4 | Kyoto Stock Center | 112228 | |
| Genetic reagent (D. melanogaster) | repo-Gal80 | Awasaki et al., 2008 | ||
| Genetic reagent (D. melanogaster) | UAS-Notch RNAi (HMS00001) | Bloomington Drosophila Stock Center | 33611 | |
| Genetic reagent (D. melanogaster) | UAS-Kuzbanian RNAi (HMS05424) | Bloomington Drosophila Stock Center | 66958 | |
| Genetic reagent (D. melanogaster) | UAS-Su(H)RNAi (HMS05748) | Bloomington Drosophila Stock Center | 67928 | |
| Genetic reagent (D. melanogaster) | UAS-Delta RNAi (HMS01309) | Bloomington Drosophila Stock Center | 34322 | |
| Genetic reagent (D. melanogaster) | UAS-Serrate RNAi (HMS01179) | Bloomington Drosophila Stock Center | 34700 | |
| Genetic reagent (D. melanogaster) | UAS-dp110 | Bloomington Drosophila Stock Center | 25914 | |
| Genetic reagent (D. melanogaster) | Delta-GFP | Bloomington Drosophila Stock Center | 59819 | |
| Genetic reagent (D. melanogaster) | Serrate-GFP | Bloomington Drosophila Stock Center | 59824 | |
| Genetic reagent (D. melanogaster) | pcna-GFP | Thacker et al., 2003 | ||
| Genetic reagent (D. melanogaster) | E(spl)mg-GFP | Almeida and Bray, 2005 | ||
| Genetic reagent (D. melanogaster) | Imp-GFP | Bloomington Drosophila Stock Center | 60237 | |
| Genetic reagent (D. melanogaster) | UAS-Imp RNAi (HMS01168) | Bloomington Drosophila Stock Center | 34977 | |
| Genetic reagent (D. melanogaster) | UAS-Syp-RB-HA | Gift from Tzumin Lee | ||
| Genetic reagent (D. melanogaster) | UAS-Eip93F WT | Zurich FlyORF | F000587 | |
| Genetic reagent (D. melanogaster) | hsFlp (on X) | Gift from Iswar Hariharan | ||
| Genetic reagent (D. melanogaster) | Act5c-FRT-CD2-FRT-Gal4, UAS-RFP | Bloomington Drosophila Stock Center | 30558 | |
| Genetic reagent (D. melanogaster) | Act5c-FRT-CD2-FRT-Gal4, UAS-GFP | Gift from Iswar Hariharan | ||
| Genetic reagent (D. melanogaster) | UAS-mCD8-mRFP | Bloomington Drosophila Stock Center | 27399 | |
| Genetic reagent (D. melanogaster) | UAS-mCD8-mGFP | Bloomington Drosophila Stock Center | 5137 | |
| Genetic reagent (D. melanogaster) | Notch55e11 FRT19A | Bloomington Drosophila Stock Center | 28813 | |
| Genetic reagent (D. melanogaster) | hsflp, tubgal80, FRT19A; tubGal4, UASmCD8GFP | Gift from Ben Ohlstein |
Additional files
-
Supplementary file 1
Panel genotypes.
Table of genotypes listed by panel of each figure and figure supplement.
- https://cdn.elifesciences.org/articles/88565/elife-88565-supp1-v1.docx
-
MDAR checklist
- https://cdn.elifesciences.org/articles/88565/elife-88565-mdarchecklist1-v1.docx
Download links
A two-part list of links to download the article, or parts of the article, in various formats.
Downloads (link to download the article as PDF)
Open citations (links to open the citations from this article in various online reference manager services)
Cite this article (links to download the citations from this article in formats compatible with various reference manager tools)
Delta-dependent Notch activation closes the early neuroblast temporal program to promote lineage progression and neurogenesis termination in Drosophila
eLife 12:RP88565.
https://doi.org/10.7554/eLife.88565.3


