Combined transcranial magnetic stimulation and electroencephalography reveals alterations in cortical excitability during pain
- Center for Pain IMPACT, Neuroscience Research Australia, Australia
- University of New South Wales, Australia
- School of Health Sciences, College of Health, Medicine and Wellbeing, The University of Newcastle, Australia
- Department of Medical Biophysics, Schulich School of Medicine & Dentistry, University of Western Ontario, Canada
- The Gray Centre for Mobility and Activity, University of Western Ontario, Canada
Figures
Figure 1
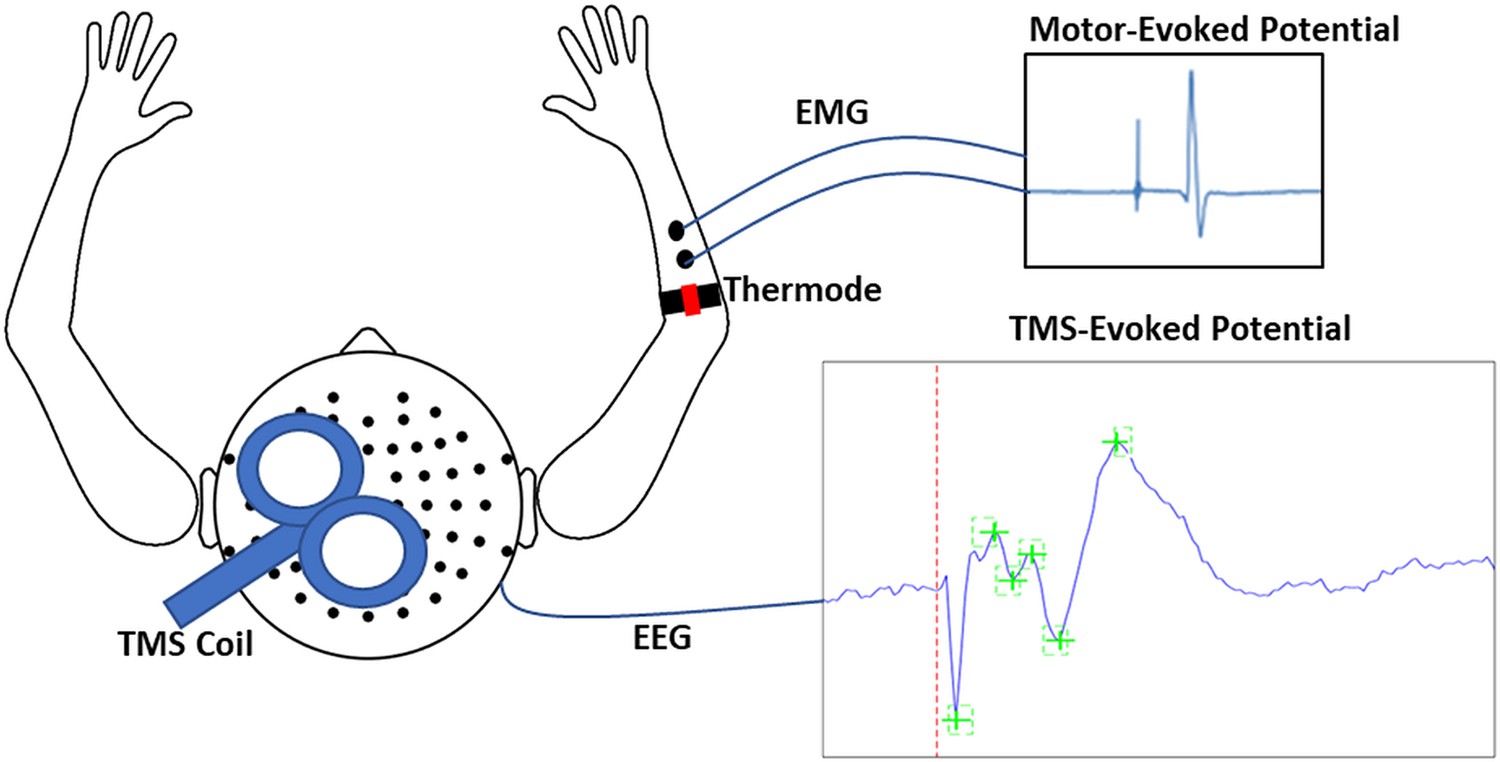
Schematic of experimental apparatus.
The apparatus consisted of transcranial magnetic stimulation (TMS) during concurrent electroencephalography (EEG) to simultaneously record motor-evoked potentials (MEPs) and TMS-evoked potentials (TEPs). MEPs were recorded using electromyographic (EMG) electrodes placed over the distal region of the extensor carpi radialis brevis (ECRB), while thermal pain was delivered over the proximal region of the ECRB.
Figure 2 with 2 supplements
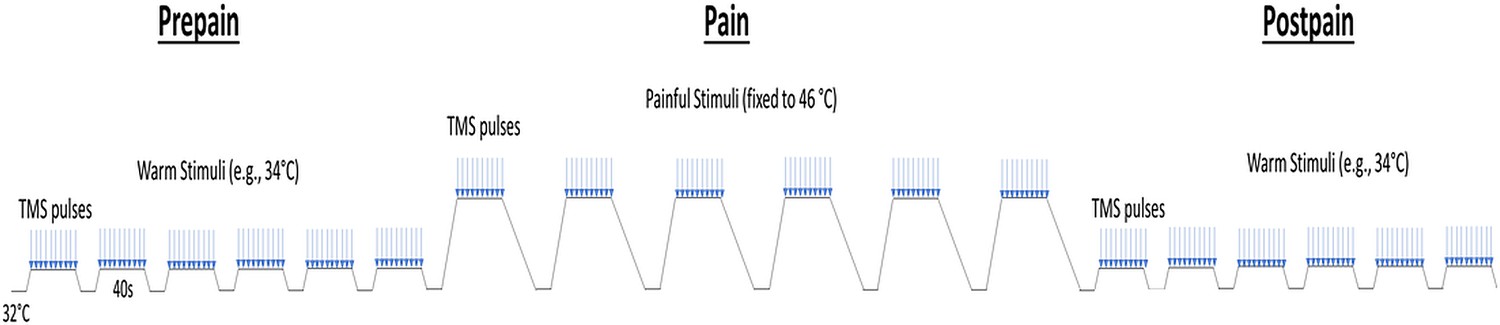
Schematic of the protocol for Experiment 1.
Participants experienced three blocks of thermal stimuli: a pre-pain, pain, and post-pain block, with each block consisting of multiple thermal stimuli delivered 40 s at a time, and during which TMS measurements (indicated by blue arrows) and verbal pain ratings were obtained. The pre-pain and post-pain blocks involved thermal stimuli delivered at the warm threshold (i.e. the temperature that leads to any perceived change in skin temperature from baseline). In the pain block, thermal stimuli were delivered at 46 °C.
Figure 2—figure supplement 1
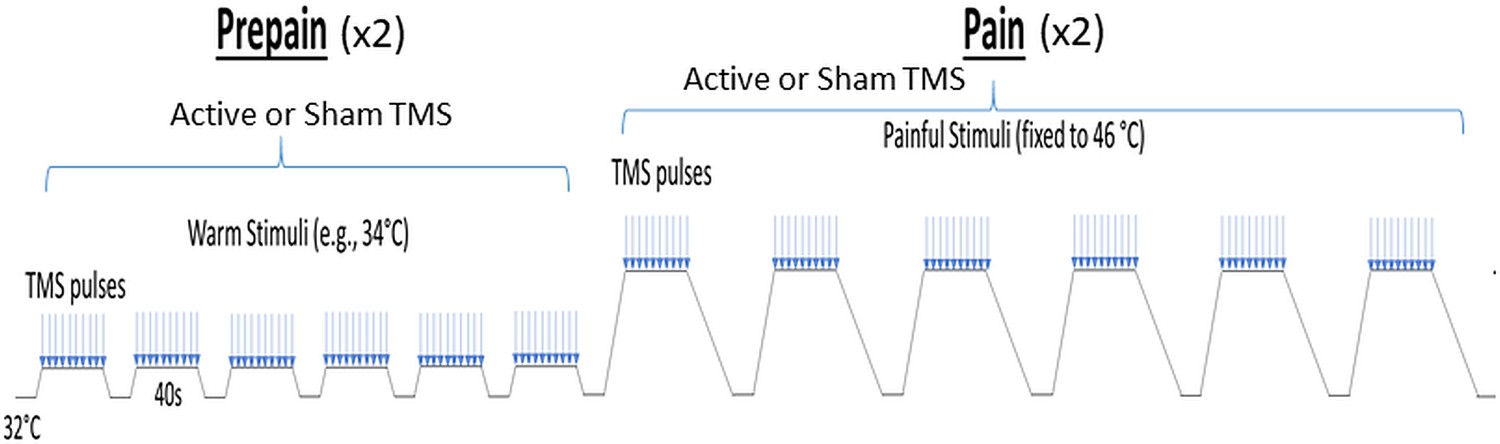
Schematic of the protocol for Experiment 2.
For Experiment 2, the post-pain block was excluded, and an additional sham TMS condition was intermixed within both the pre-pain and pain blocks.
Figure 2—figure supplement 2
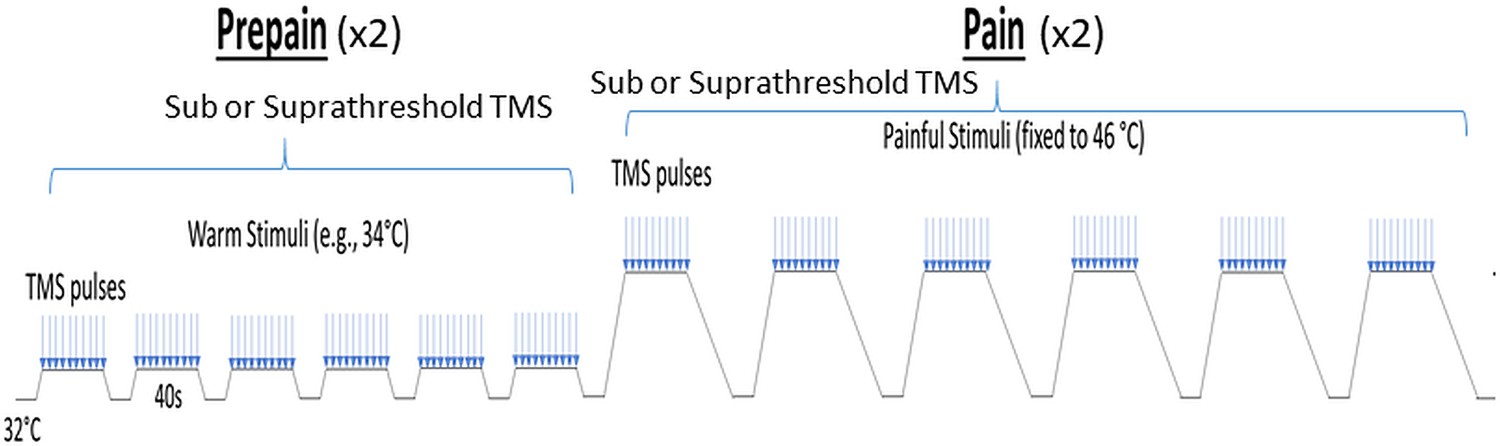
Schematic of the protocol for Experiment 3.
For Experiment 3, the post-pain block was also excluded, and an additional subthreshold TMS condition intermixed within both the pre-pain and pain blocks.
Figure 3 with 3 supplements
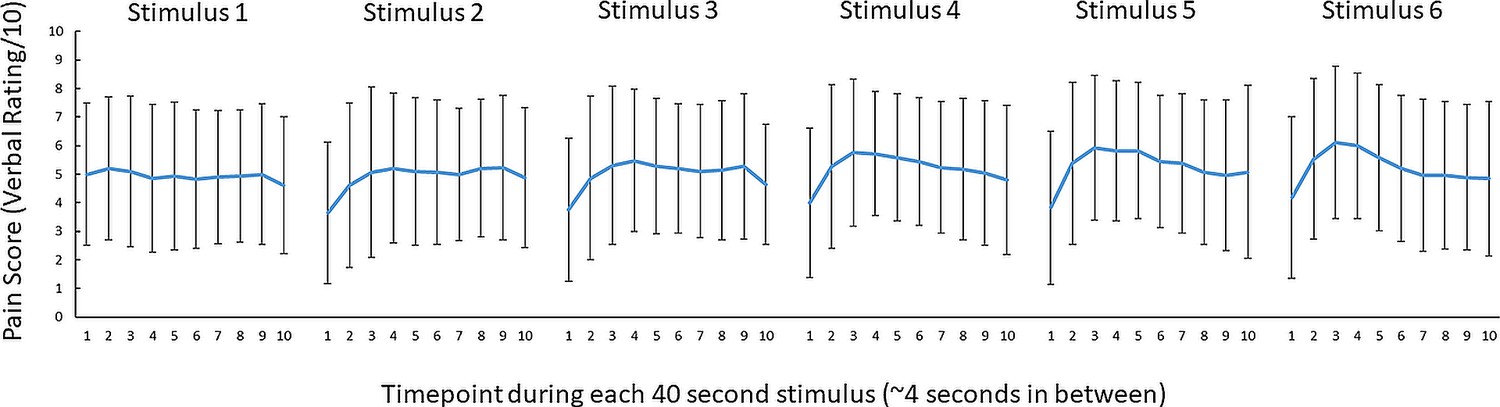
No conclusive evidence of a difference in pain ratings between successive 46 °C 40 s thermal stimuli.
Mean (± SD) pain ratings (n = 29) during the 6 thermal stimuli delivered during the pain block (thermal stimuli delivered at 46 °C) of Experiment 1. Ten pain ratings were collected over each 40-s thermal stimulus ~every 4 s. A 6 (stimulus number: 1–6) x 10 (timepoint:1–10) Bayesian repeated measures ANOVA revealed anecdotal evidence (i.e. no conclusive evidence) of a difference in pain between six thermal stimuli (BF10=2.86), very strong evidence for a difference in pain ratings between the 10 timepoints (BF10=6.130) and strong evidence of an interaction between stimulus number and timepoint (BF10=19.6).
Figure 3—figure supplement 1
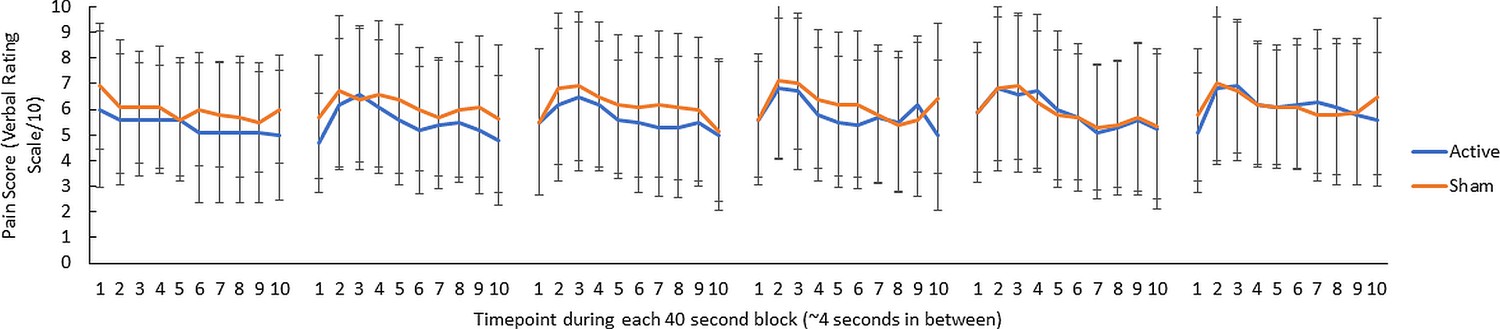
Pain ratings for Experiment 2.
Mean (± SD) pain ratings (n = 10) during the six thermal stimuli delivered during the pain block (thermal stimuli delivered at 46 °C) for both active and sham TMS in Experiment 2. Ten pain ratings were collected over each 40-s stimulus ~every 4 s.
Figure 3—figure supplement 2
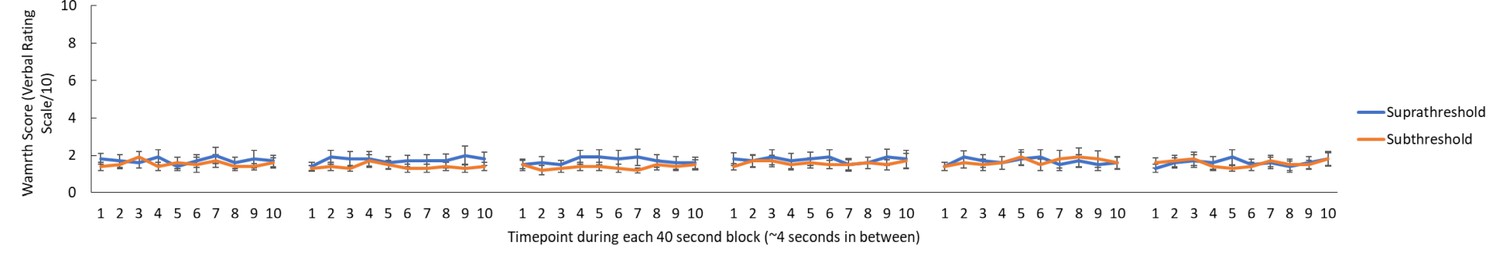
Warmth ratings for Experiment 3.
Mean ( ± SEM) warmth ratings (n=10) during the six thermal stimuli delivered during the pre-pain block (thermal stimuli delivered at the warmth threshold) for both supra and subthreshold TMS for Experiment 3. Ten warmth ratings were collected over each 40-s stimulus ~every 4 s. This figure confirms that participants felt some difference in the sensation (relative to baseline) when the temperature was delivered at the warmth detection threshold.
Figure 3—figure supplement 3
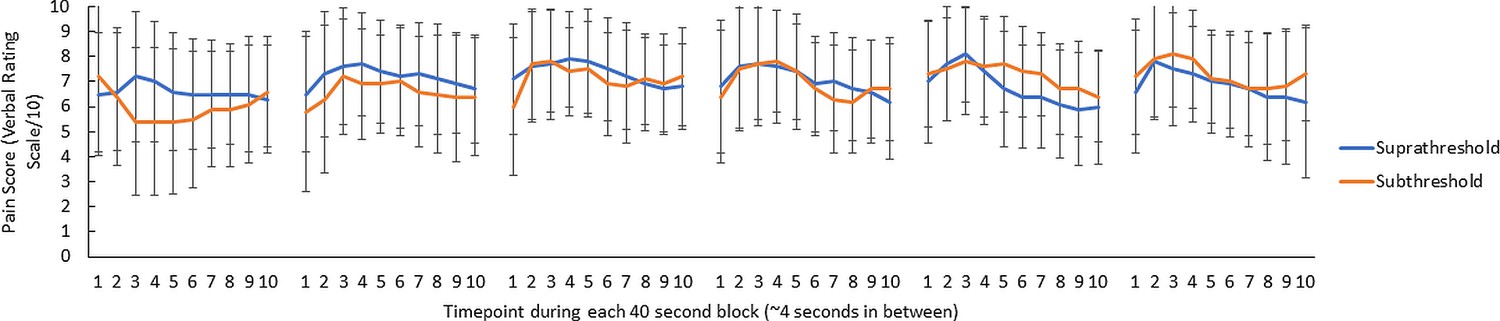
Pain ratings for Experiment 3.
Mean (± SD) pain ratings (n=10) during the 6 thermal stimuli delivered during the pain block (thermal stimuli delivered at 46 °C) for both supra and subthreshold TMS in Experiment 3.Ten pain ratings were collected over each 40-s thermal stimulus ~every 4 s.
Figure 4
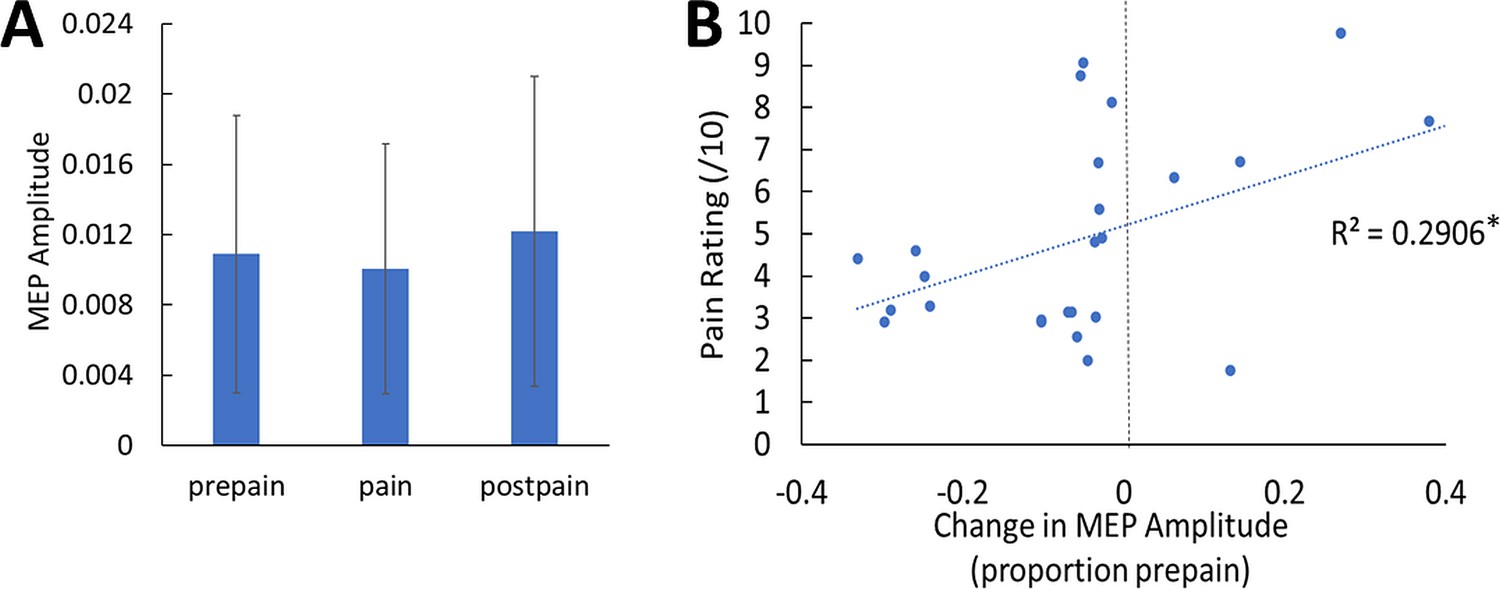
No conclusive evidence of MEP amplitude differences between conditions; however individual pain sensitivity was predicted by changes in MEP amplitude.
(A) Mean (± SD) MEP amplitude (n=26) during the pre-pain, pain, and post-pain blocks of Experiment 1. A Bayesian repeated-measures ANOVA revealed anecdotal evidence of a difference in MEP amplitude between blocks (BF10=1.02). (B) Individual-level Relationship between change in MEP amplitude during pain (proportion of pre-pain) and mean verbal pain rating provided by each participant. There was strong evidence for a positive relationship (r26=0.54, BF10=11.17).
Figure 5
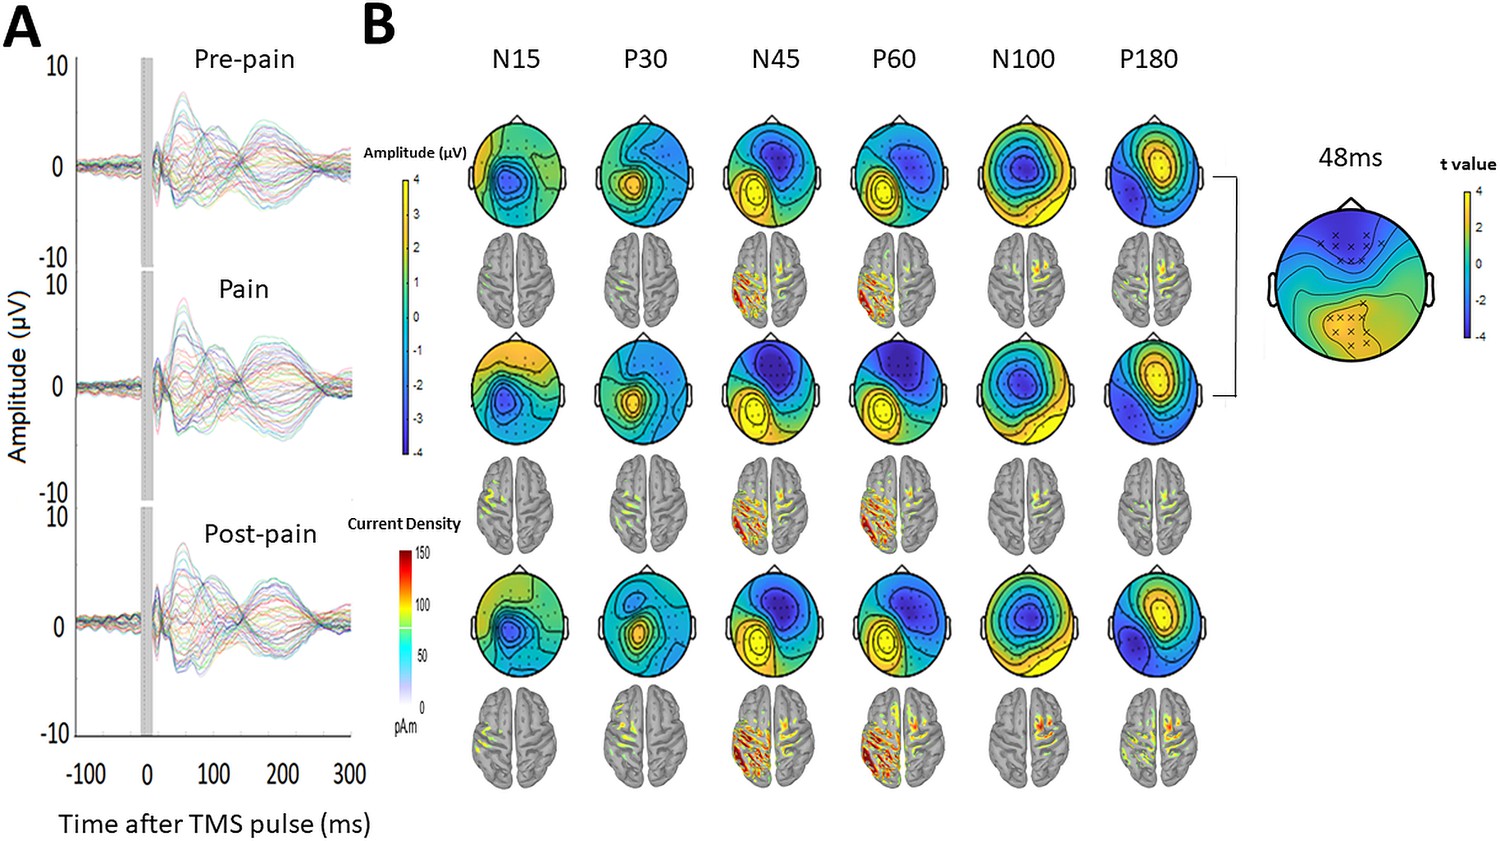
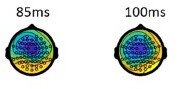
Pain led to increased negative and positive amplitude in frontocentral and parietal-occipital sites respectively, 43–90ms after the TMS pulse.
(A) Grand-average TEPs (n = 28) during the pre-pain, pain, and post-pain blocks of Experiment 1. The gray-shaded area represents the window of interpolation around the TMS pulse. (B) Scalp topographies and estimated source activity at timepoints where TEP peaks are commonly observed, including the N15, P30, N45, P60, N100, and P180. A cluster plot is also shown on the right comparing signal amplitude between the pain and pre-pain conditions at a representative timepoint (48ms) between 43 and 90ms, which is where significant amplitude differences were observed. The black stars demonstrate the presence of significant positive (yellow) clusters or negative (blue) clusters.
Figure 6 with 1 supplement
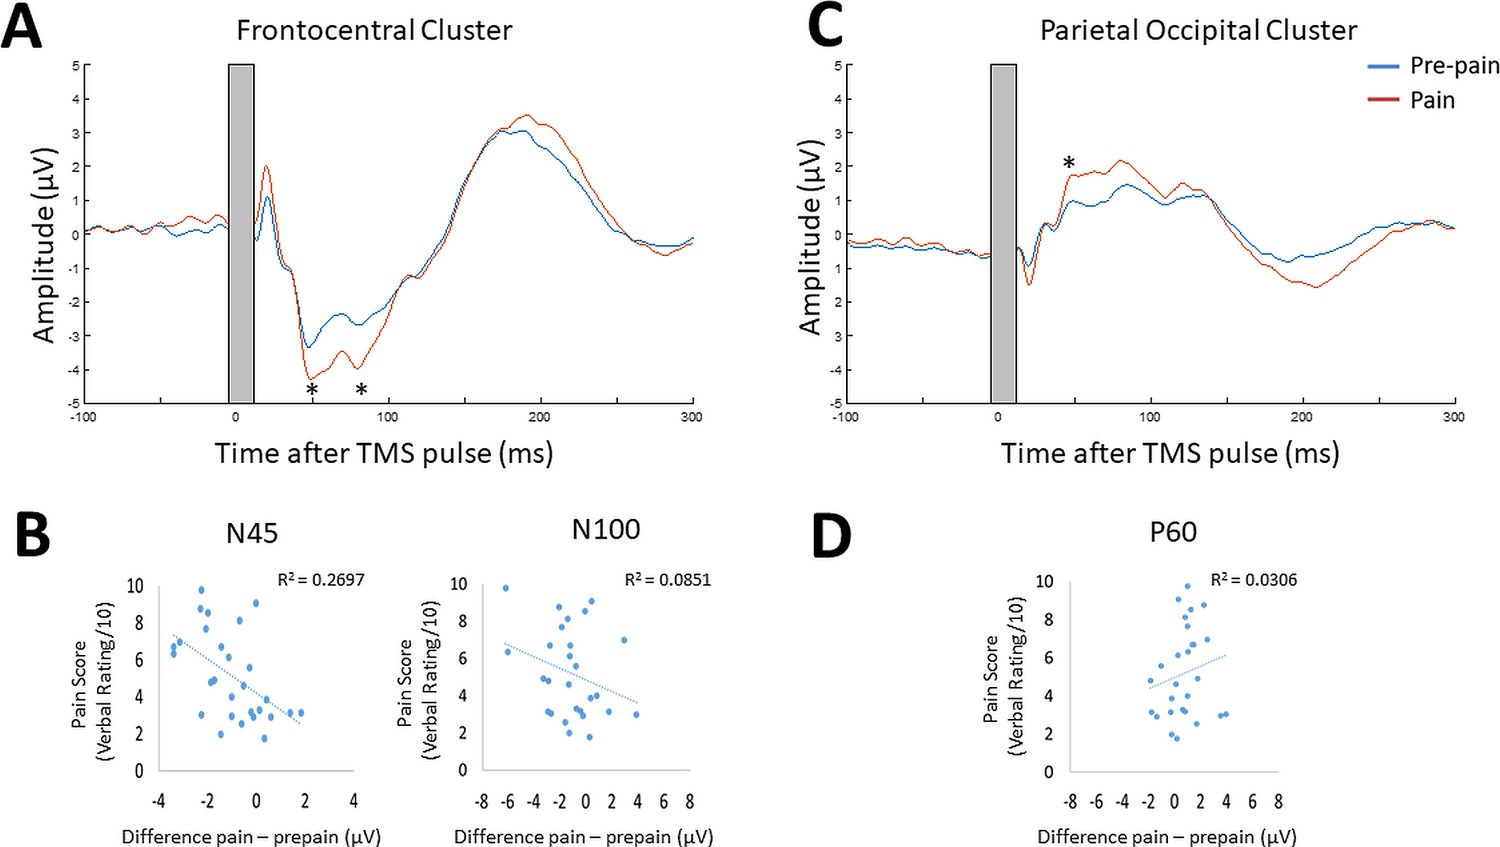
Pain led to increases in N45, P60, and N100 peak amplitude, and individual pain sensitivity was predicted by changes in the N45 peak.
TEPs (n = 28) across pain and pre-pain condition for the frontocentral electrodes (A) and parietal-occipital electrodes (C) identified from the cluster analysis of Experiment 1. The grey shaded area represents the window of interpolation around the transcranial magnetic stimulation (TMS) pulse. For the frontocentral electrodes, there was evidence for stronger negative peaks at ~45 and 85ms post-TMS. For the parietal-occipital electrodes, there was evidence for a stronger positive peak was identified at ~50ms post-TMS. The astericks indicates at least moderate evidence for the alternative hypothesis that the peak amplitude is larger in pain vs. pre-pain (BF10 >3). Individual-level relationship between mean verbal pain ratings provided by each participant and change in peak amplitudes at ~45ms (N45),~85ms (N100) post-TMS (B), and ~50ms (P60) post-TMS (D). The astericks indicates at least moderate evidence for a relationship between change in peak amplitude, and verbal pain ratings (BF10 >3).
Figure 6—figure supplement 1
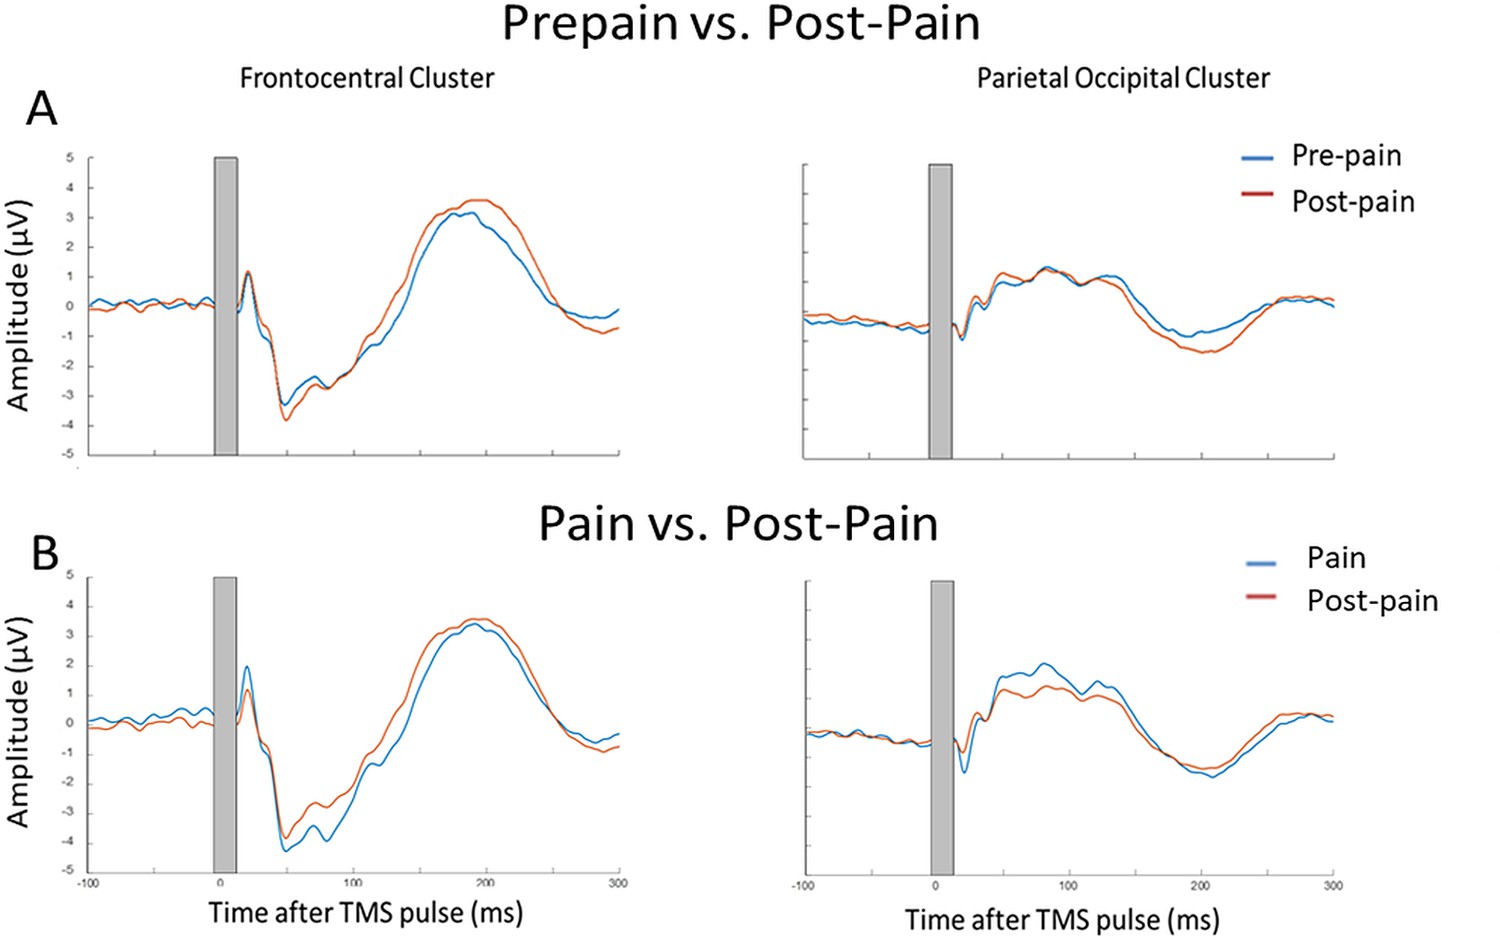
No conclusive evidence of a difference in TEP peak amplitude between post-pain and pre-pain and pain conditions.
Comparison of TEPs (n = 27) for prepain vs. pain for prepain vs. pain (A) and pain vs. post-pain (B) conditions for the frontocentral electrodes (left) and parietal-occipital electrodes (right) identified from the cluster analysis. The gray-shaded area represents the window of interpolation around the transcranial magnetic stimulation (TMS) pulse. For prepain vs. post-pain, Bayes paired t-tests comparing peak amplitude between conditions yielded anecdotal evidence of no difference for the frontocentral N45 (BF10=0.465) and the parietal-occipital P60 (BF10=0.351) and moderate evidence for no difference in the frontocentral N100 (BF10=0.205). For pain vs. post-pain, Bayes paired t-tests comparing peak amplitude between conditions yielded anecdotal evidence of no difference for the frontocentral N45 (BF10=0.992), frontocentral N100 (BF10=0.775), and parietal-occipital P60 (BF10=0.692).
Figure 7
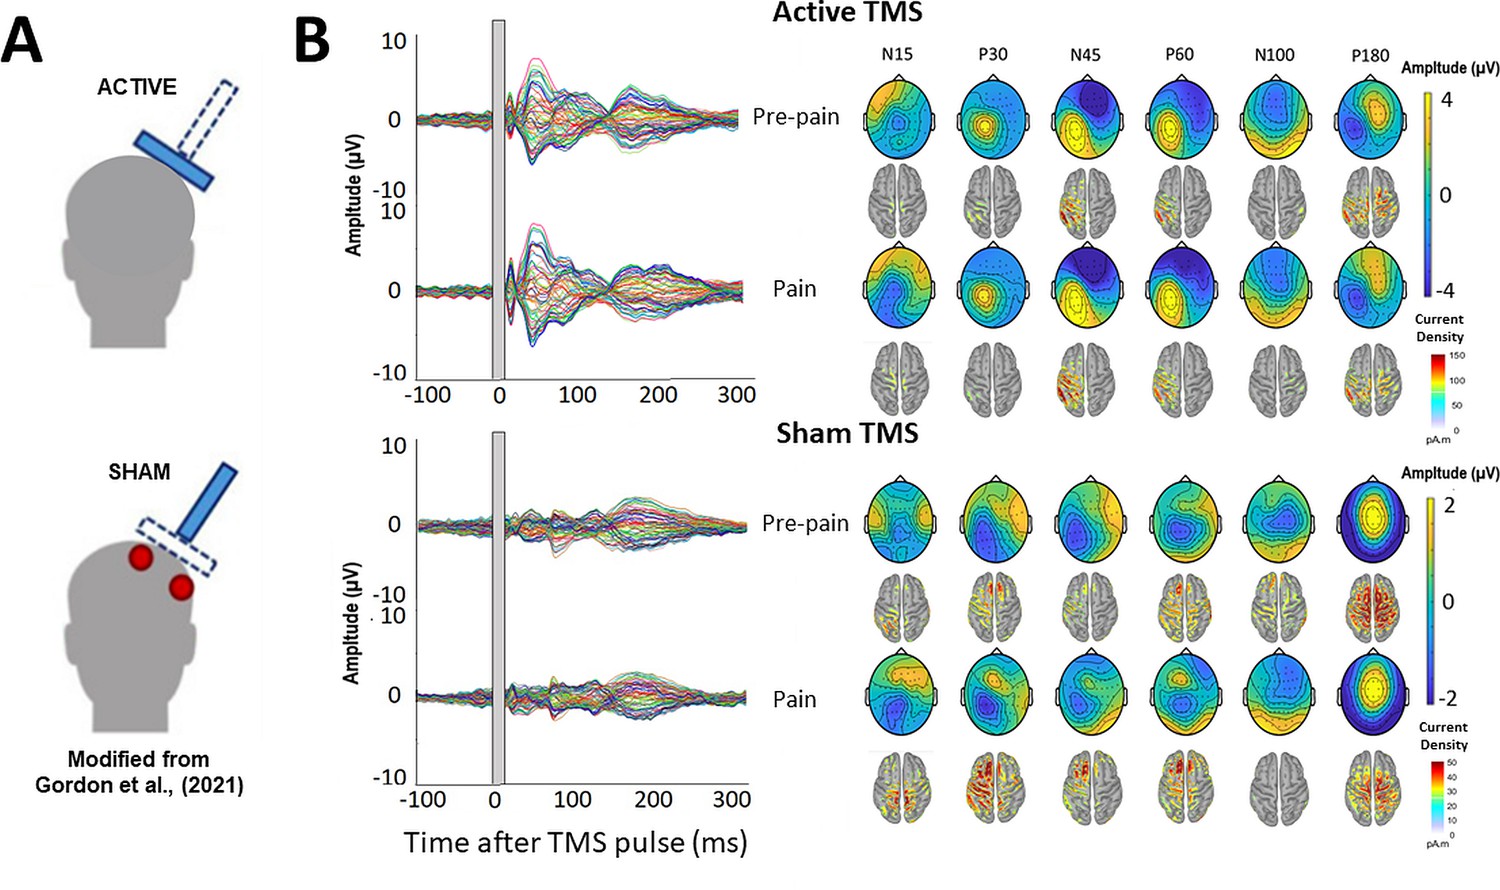
TMS-evoked potentials for Active and Sham TMS.
(A) Schematics showing the delivery of active and sham TMS of Experiment 2. Sham TMS involved scalp electrical stimulation (in red) beneath a sham coil (in dotted blue) to mimic somatosensory stimulation associated with active TMS, and concurrent delivery of active TMS 90° to the scalp (in shaded blue) to mimic auditory stimulation associated with TMS. (B) Left: TEPs (n = 10) during the pre-pain and pain blocks, for both active and sham stimulation. The grey shaded area represents the window of interpolation around the TMS pulse. Right: Scalp topographies and estimated source activity at timepoints where TEP peaks are commonly observed, including the N15, P30, N45, P60, N100, and P180.
Figure 8
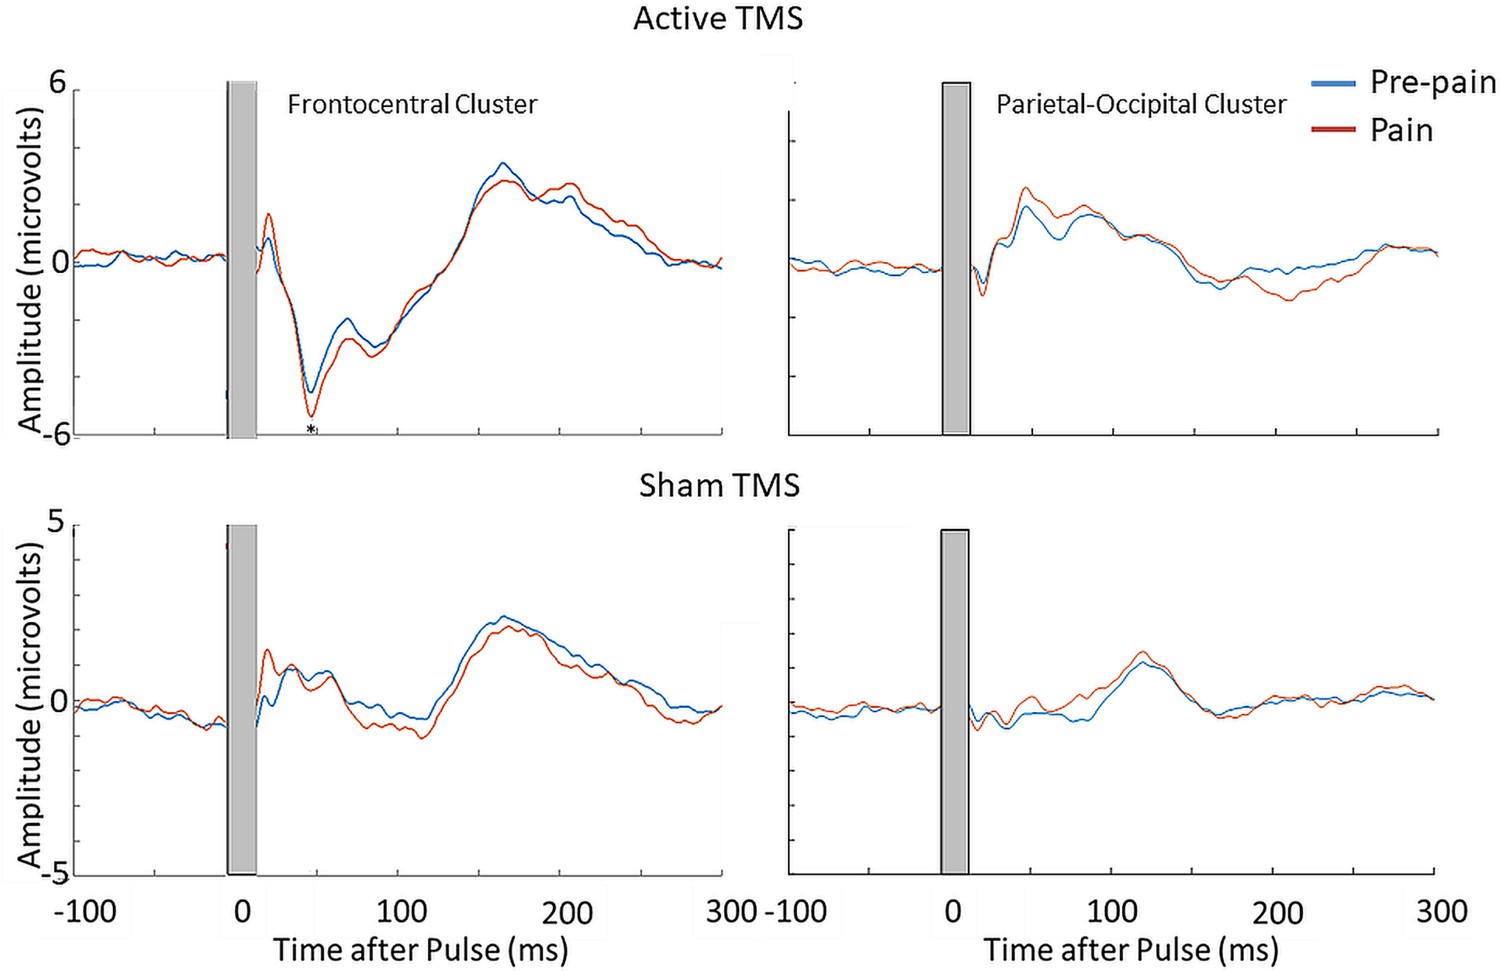
Pain led to an increase in the N45 peak amplitude during active TMS but not sham TMS.
TEPs (n = 10) during pain and pre-pain blocks, across active and sham TMS conditions of Experiment 2, for the frontocentral electrodes (left) and parietal-occipital electrodes (right) identified from the cluster analysis in the main experiment. A significantly stronger frontocentral negative peak was identified ~45ms post-TMS during pain compared to pre-pain, for the active TMS condition. The astericks indicates at least moderate evidence for the alternative hypothesis that the amplitude is larger in pain vs. pre-pain (BF10 >3).
Figure 9
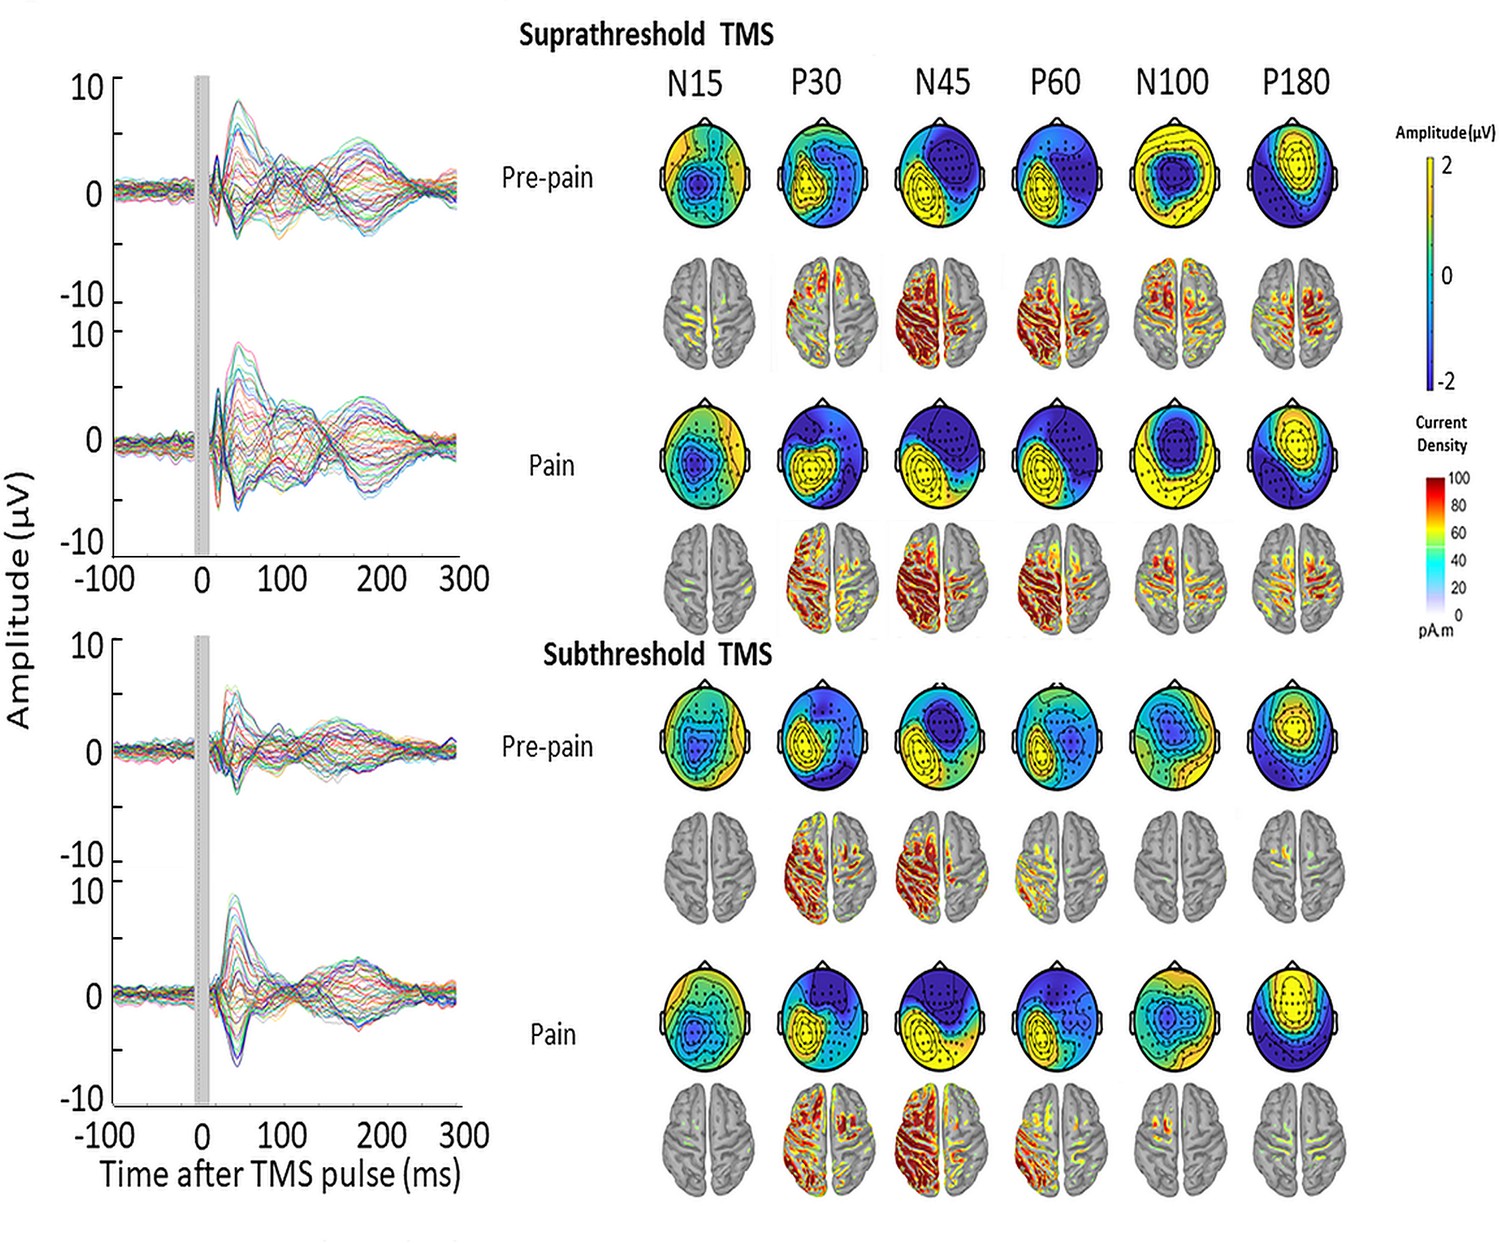
TMS-evoked potentials for supra- and subthreshold TMS.
Left: TEPs (n = 10) during the pre-pain and pain blocks, for both supra- and subthreshold TMS of Experiment 3. The gray-shaded area represents the window of interpolation around the transcranial magnetic stimulation TMS pulse. Right: Scalp topographies and estimated source activity at timepoints where TEP peaks are commonly observed, including the N15, P30, N45, P60, N100, and P180.
Figure 10
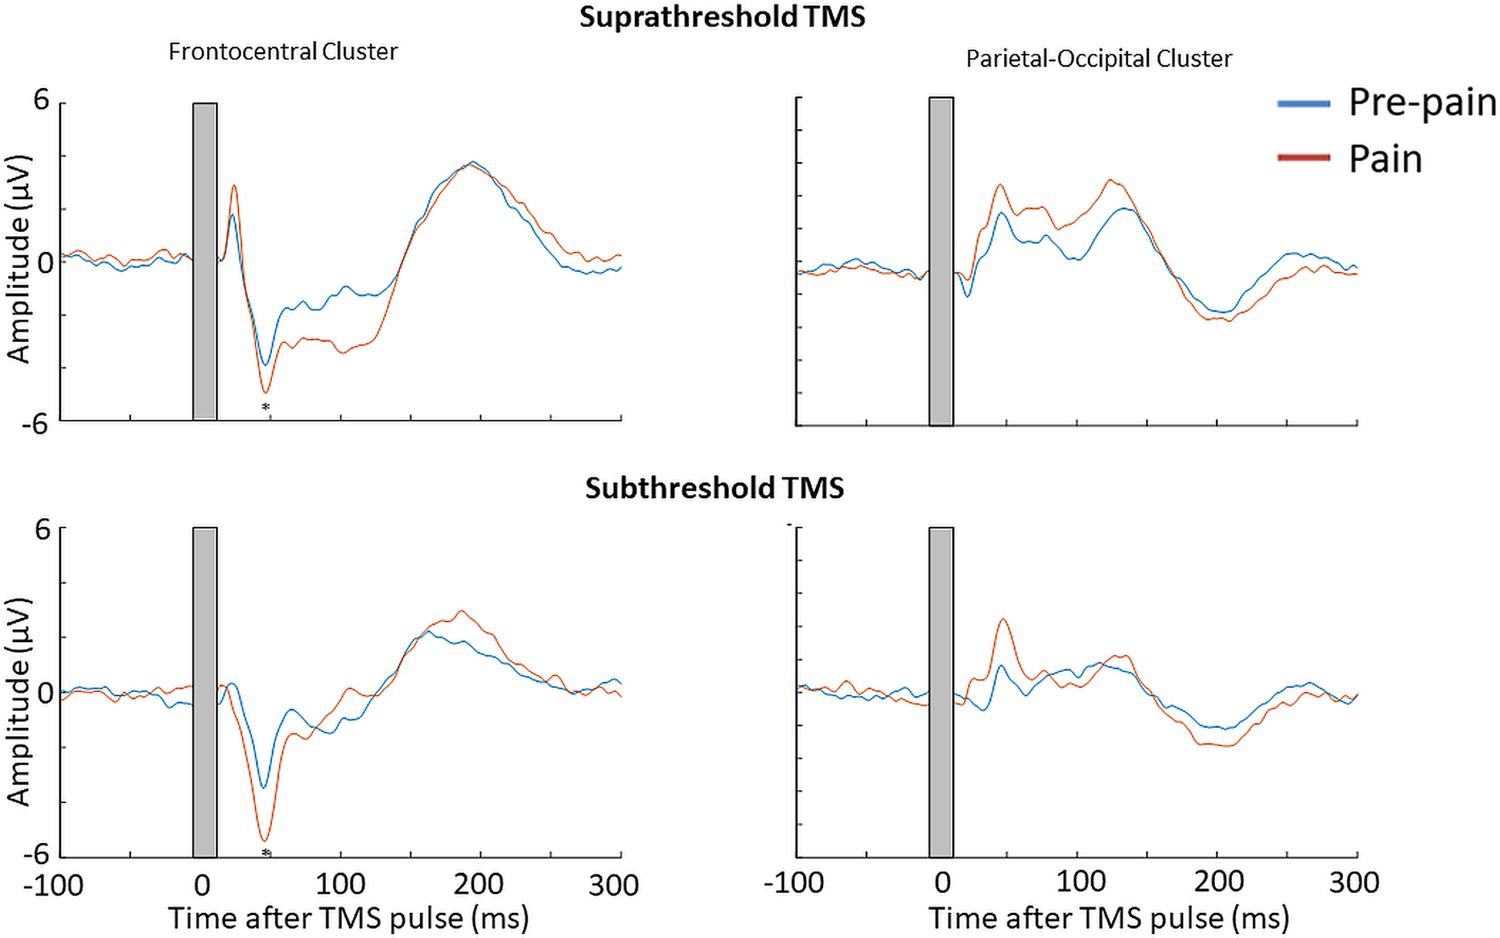
Pain led to an increase in the N45 peak amplitude for both suprathreshold and subthreshold TMS.
TEPs (n = 10) during pain and pre-pain blocks of Experiment 3, across supra- and subthreshold TMS conditions, for the frontocentral electrodes (left) and parietal occipital electrodes (right) identified from the cluster analysis in Experiment 1. A significantly stronger frontocentral negative peak was identified ~45ms post-TMS during pain compared to pre-pain for both supra- and subthreshold stimulation. The astericks indicates at least moderate Bayesian evidence for the alternative hypothesis that the amplitude is larger in pain vs. pre-pain (BF10 >3).
Author response image 1
Additional files
Download links
A two-part list of links to download the article, or parts of the article, in various formats.
Downloads (link to download the article as PDF)
Open citations (links to open the citations from this article in various online reference manager services)
Cite this article (links to download the citations from this article in formats compatible with various reference manager tools)
Combined transcranial magnetic stimulation and electroencephalography reveals alterations in cortical excitability during pain
eLife 12:RP88567.
https://doi.org/10.7554/eLife.88567.3


