Multi-study fMRI outlooks on subcortical BOLD responses in the stop-signal paradigm
- Integrative Model-Based Cognitive Neuroscience Research Unit, University of Amsterdam, Netherlands
- Sensorimotor Neuroscience and Ageing Research Lab, School of Psychological Sciences, University of Tasmania, Australia
- Department of Psychology, Faculty of Social Sciences, Leiden University, Netherlands
- Full brain picture Analytics, Netherlands
Figures
Figure 1
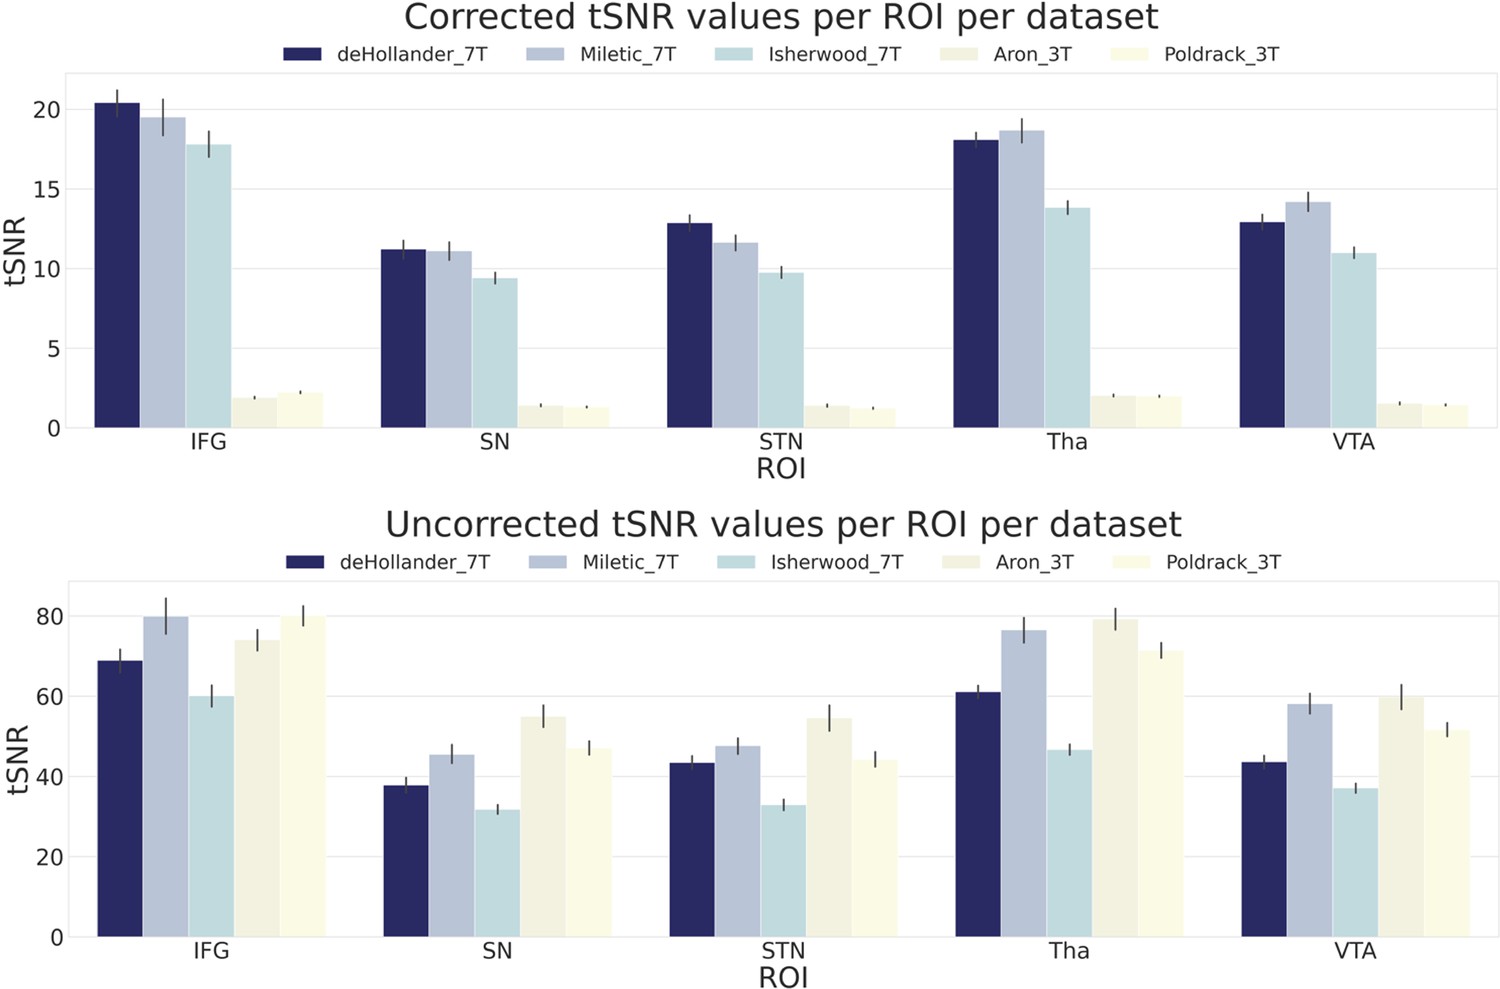
Corrected and uncorrected temporal signal-to-noise ratio (tSNR) values for five regions of interest (ROIs) over all datasets.
The values are derived from the mean tSNR values of both hemispheres. Error bars are standard errors. Corrected tSNRs are equal to the uncorrected tSNRs divided by the volume of a single voxel. IFG, inferior frontal gyrus; SN, substantia nigra; STN, subthalamic nucleus; Tha, thalamus; VTA, ventral tegmental area.
Figure 2 with 4 supplements
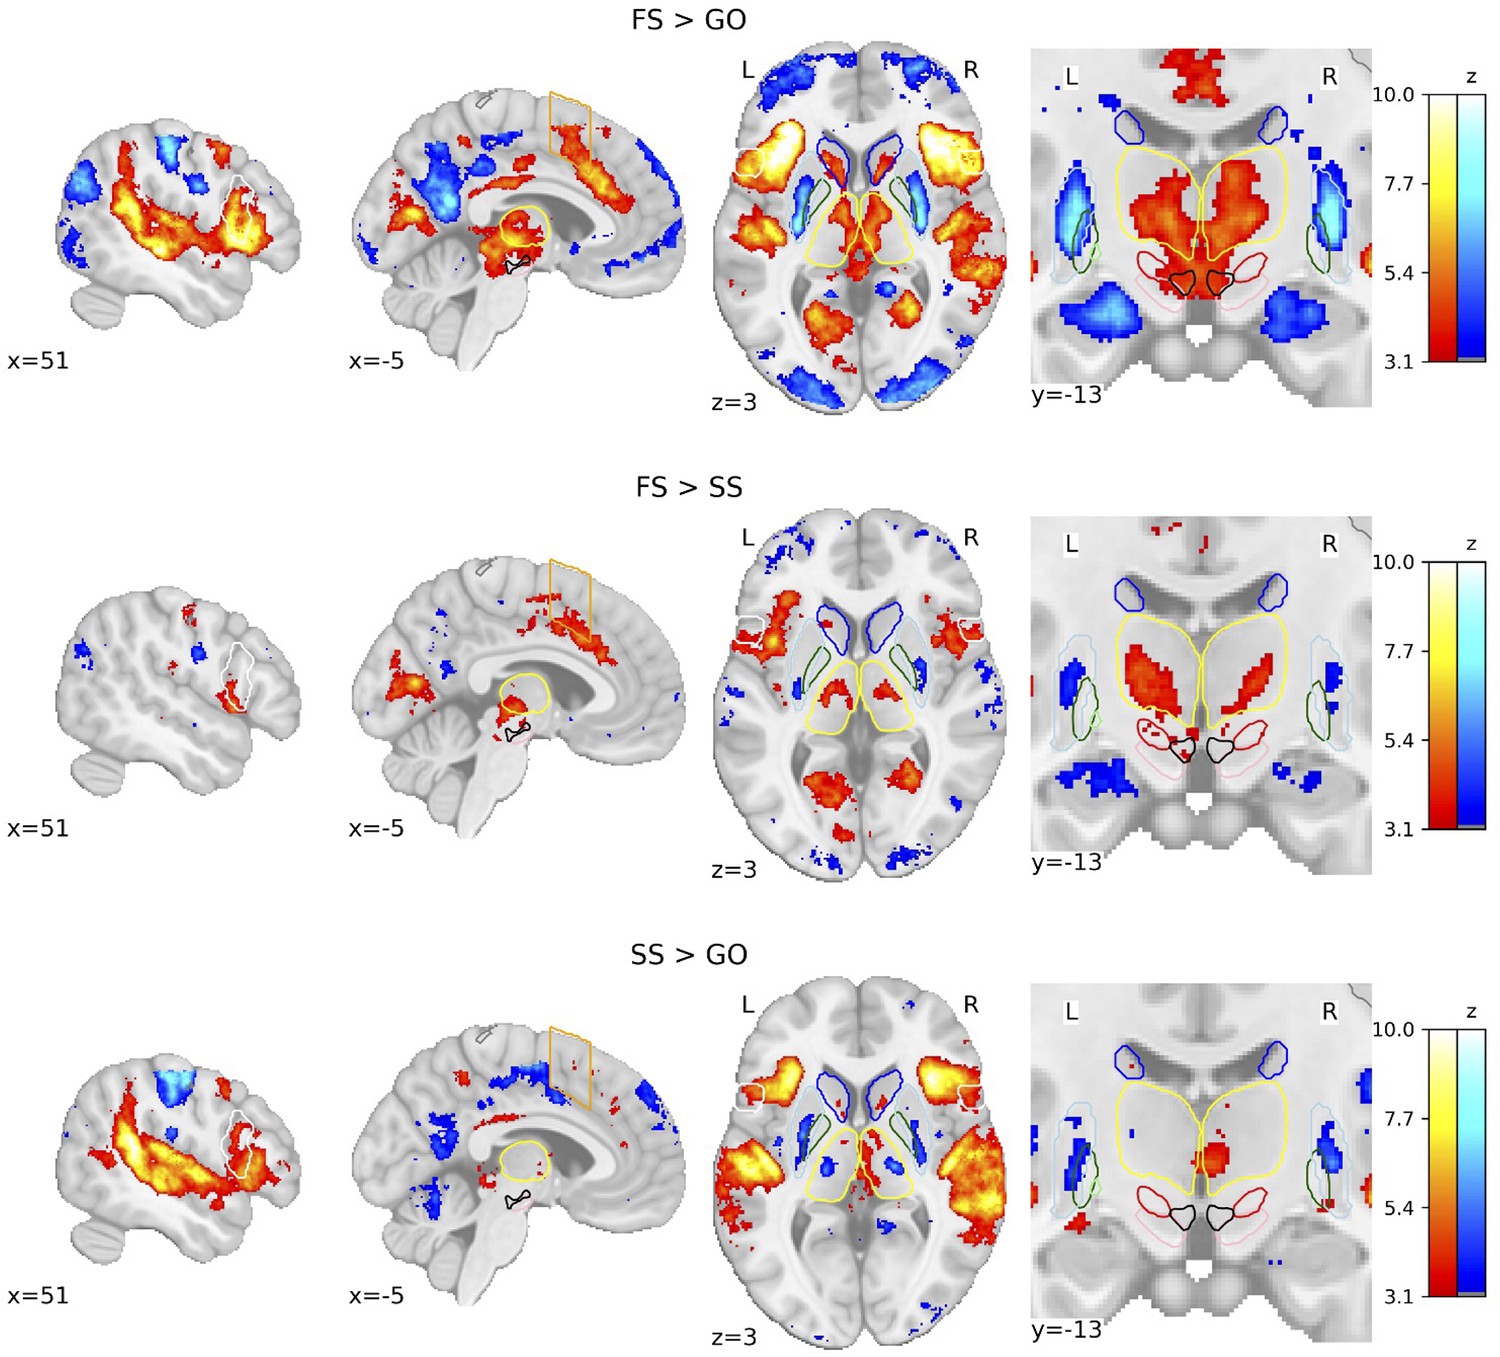
Group-level statistical parametric maps (SPMs) of the three main contrasts of the stop-signal task (SST).
Activation colours indicate false discovery rate (FDR) thresholded (q < 0.05) z-values. Two sagittal, one axial, and one zoomed in coronal view are shown. Coloured contour lines indicate regions of interest (inferior frontal gyrus [IFG] in white, M1 in grey, pre-supplementary motor area [preSMA] in orange, Caudate in dark blue, Putamen in light blue, GPe in dark green, globus pallidus interna [GPi] in light green, substantia nigra [SN] in pink, subthalamic nucleus [STN] in red, thalamus in yellow, and ventral tegmental area [VTA] in black). The background template and coordinates are in MNI2009c (1 mm). FS, failed stop; SS, successful stop.
Figure 2—figure supplement 1
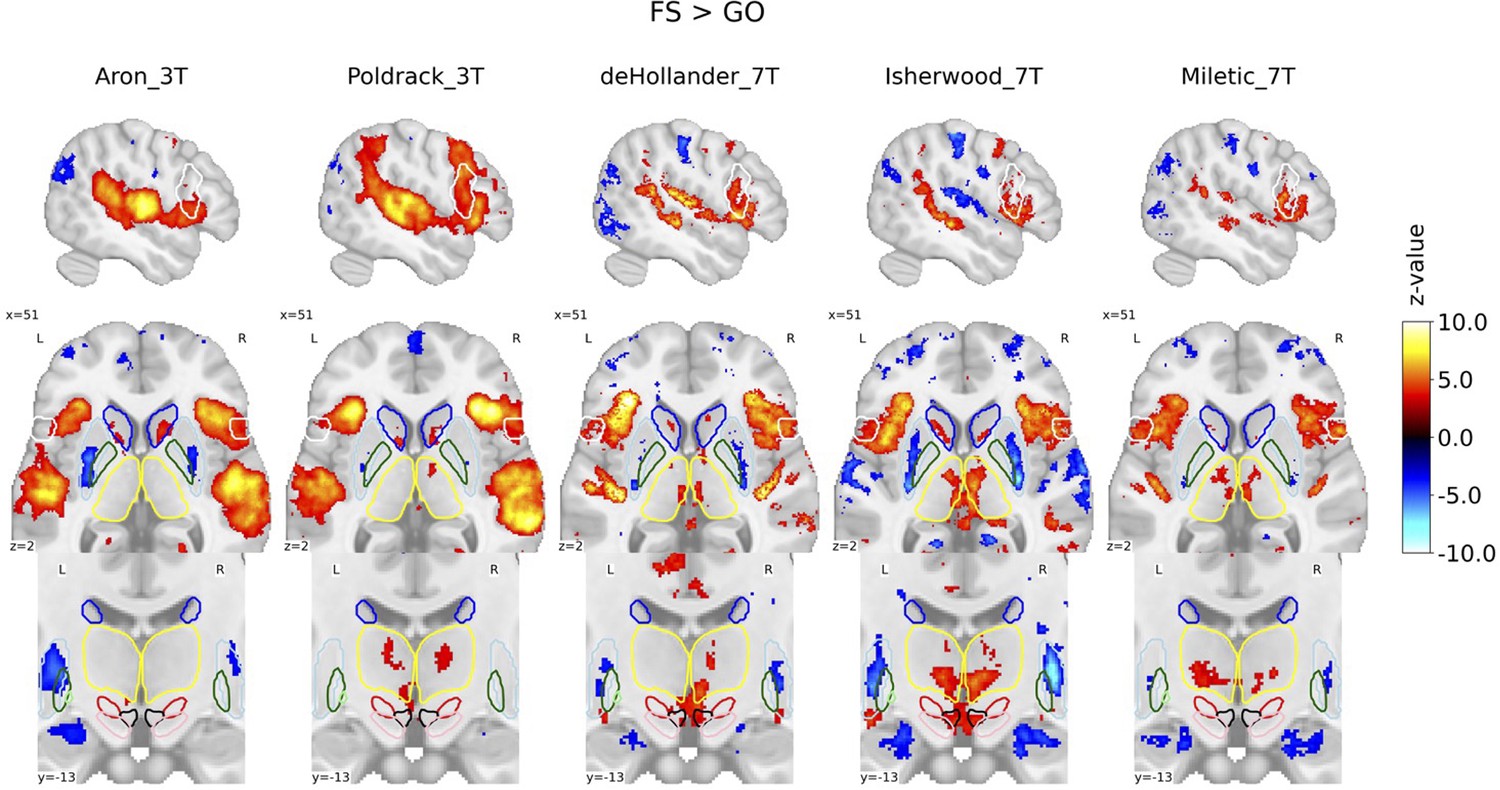
Group-level statistical parametric maps (SPMs) of the FS > GO contrast of the stop-signal task (SST) for each dataset.
Activation colours indicate false discovery rate (FDR) thresholded (q < 0.05) z-values. Sagittal (top), axial (middle), and a zoomed in coronal (bottom) view are shown. Coloured contour lines indicate regions of interest (inferior frontal gyrus [IFG] in white, M1 in grey, pre-supplementary motor area [preSMA] in orange, Caudate in dark blue, Putamen in light blue, GPe in dark green, globus pallidus interna [GPi] in light green, substantia nigra [SN] in pink, subthalamic nucleus [STN] in red, thalamus in yellow, and ventral tegmental area [VTA] in black). The background template and coordinates are in MNI2009c (1 mm); slices are drawn through x = 51 (top), y = −13 (bottom), and z = 2 (middle).
Figure 2—figure supplement 2
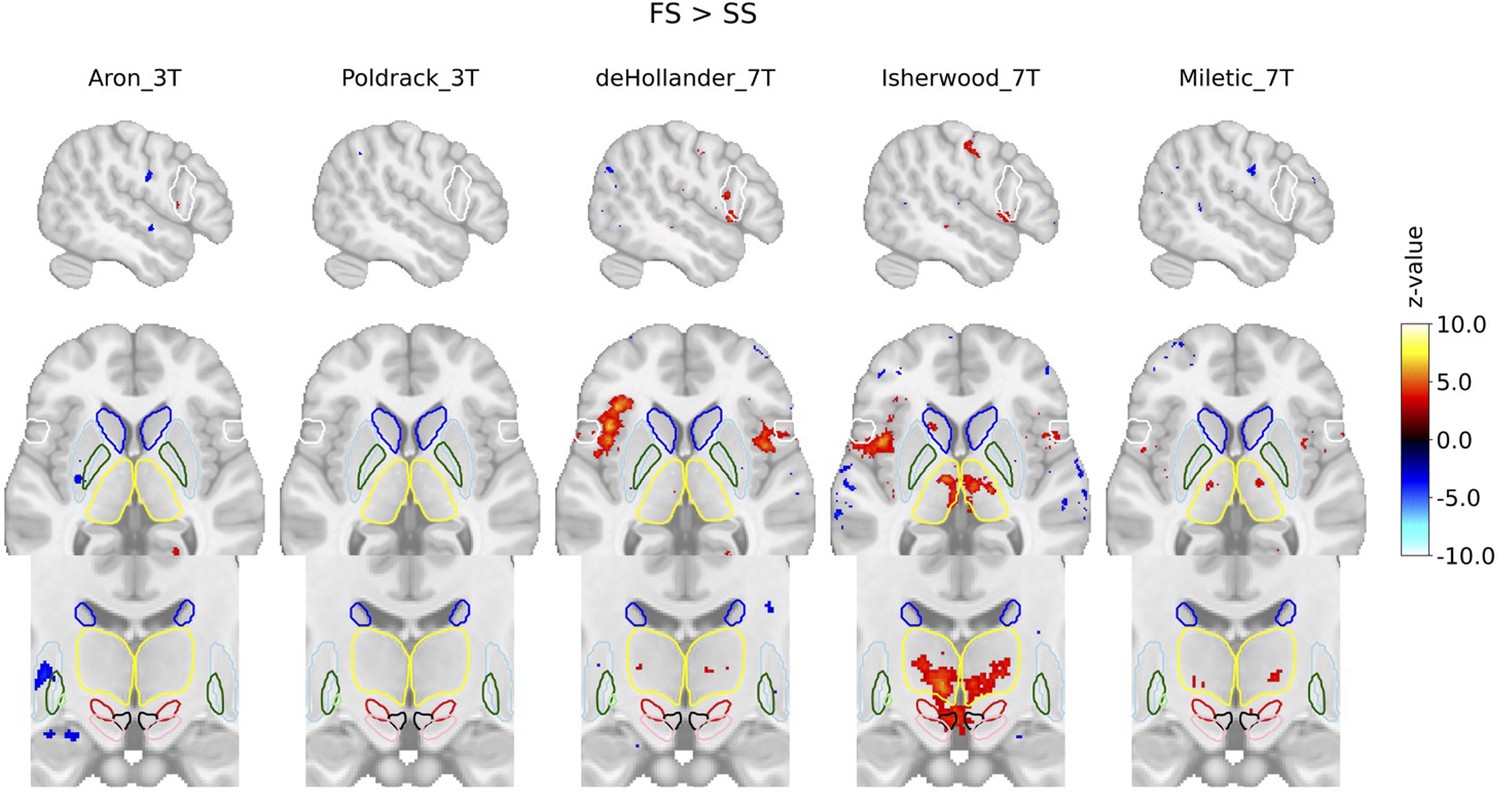
Group-level statistical parametric maps (SPMs) of the FS > SS contrast of the stop-signal task (SST) for each dataset.
Activation colours indicate false discovery rate (FDR) thresholded (q < 0.05) z-values. Sagittal (top), axial (middle), and a zoomed in coronal (bottom) view are shown. Coloured contour lines indicate regions of interest (inferior frontal gyrus [IFG] in white, M1 in grey, pre-supplementary motor area [preSMA] in orange, Caudate in dark blue, Putamen in light blue, GPe in dark green, globus pallidus interna [GPi] in light green, substantia nigra [SN] in pink, subthalamic nucleus [STN] in red, thalamus in yellow, and ventral tegmental area [VTA] in black). The background template and coordinates are in MNI2009c (1 mm); slices are drawn through x = 51 (top), y = −13 (bottom), and z = 2 (middle).
Figure 2—figure supplement 3
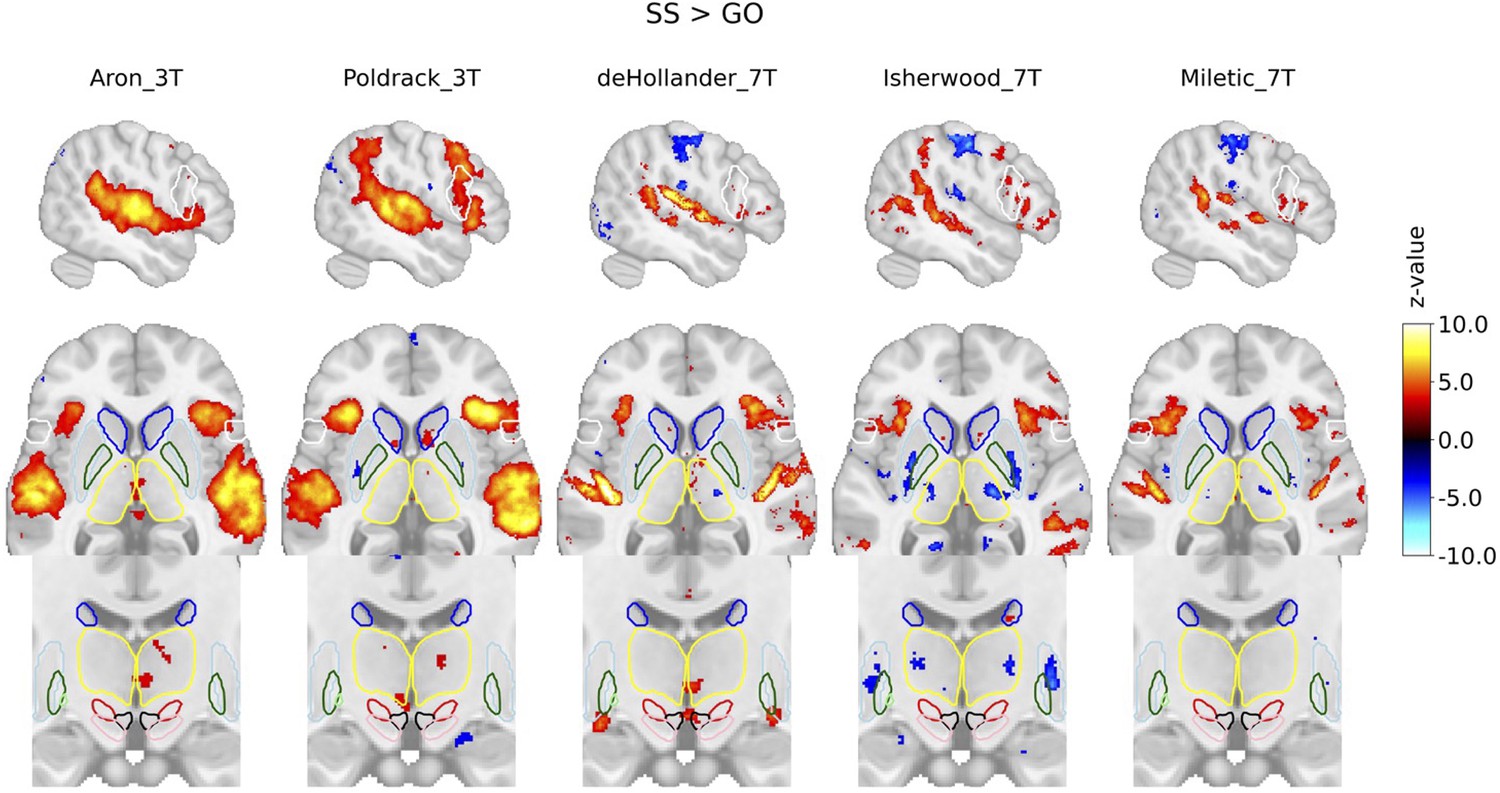
Group-level statistical parametric maps (SPMs) of the SS > GO contrast of the stop-signal task (SST) for each dataset.
Activation colours indicate false discovery rate (FDR) thresholded (q < 0.05) z-values. Sagittal (top), axial (middle), and a zoomed in coronal (bottom) view are shown. Coloured contour lines indicate regions of interest (inferior frontal gyrus [IFG] in white, M1 in grey, pre-supplementary motor area [preSMA] in orange, Caudate in dark blue, Putamen in light blue, GPe in dark green, globus pallidus interna [GPi] in light green, substantia nigra [SN] in pink, subthalamic nucleus [STN] in red, thalamus in yellow, and ventral tegmental area [VTA] in black). The background template and coordinates are in MNI2009c (1 mm); slices are drawn through x = 51 (top), y = −13 (bottom), and z = 2 (middle).
Figure 2—figure supplement 4

Group-level statistical parametric maps (SPMs) of the three main contrasts of the stop-signal task (SST), where SS and FS trials were time-locked to the presentation of the stop signal.
Activation colours indicate false discovery rate (FDR) thresholded (q < 0.05) z-values. Two sagittal, one axial, and one zoomed in coronal view are shown. Coloured contour lines indicate regions of interest (inferior frontal gyrus [IFG] in white, M1 in grey, pre-supplementary motor area [preSMA] in orange, Caudate in dark blue, Putamen in light blue, GPe in dark green, globus pallidus interna [GPi] in light green, substantia nigra [SN] in pink, subthalamic nucleus [STN] in red, thalamus in yellow, and ventral tegmental area [VTA] in black). The background template and coordinates are in MNI2009c (1 mm). FS, failed stop; SS, successful stop.
Figure 3 with 2 supplements
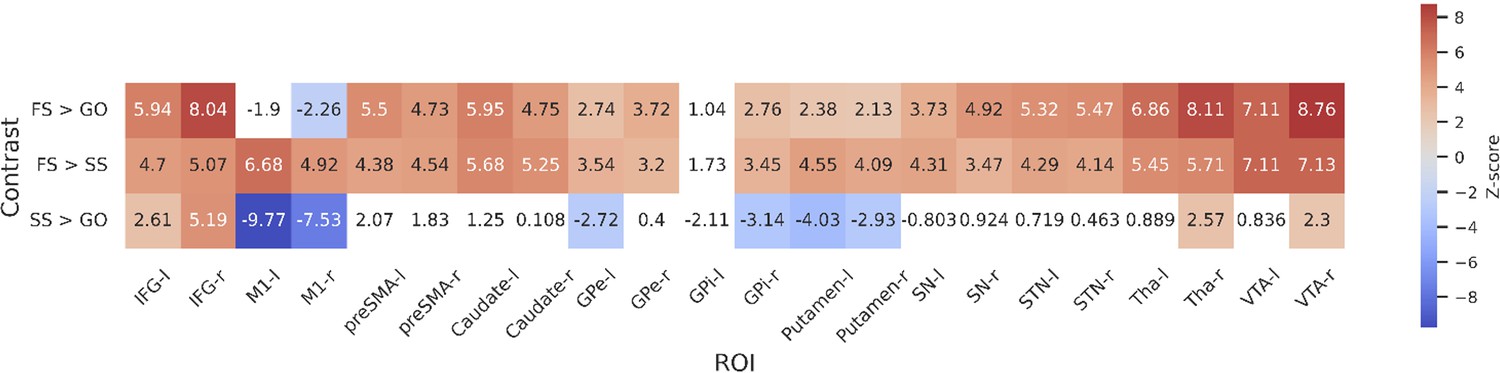
Group-level z-scores from the region of interest (ROI)-wise general linear model (GLM) analysis of included datasets.
Thresholds are set using false discovery rate (FDR) correction (q < 0.05), varying between contrasts. The thresholds for each contrast are as follows: 3.01 for FS > GO, 2.26 for FS > SS, and 3.1 for SS > GO. Regions that do not reach significance are coloured white. Left and right hemispheres are shown separately, denoted by ‘-l’ or ‘-r’, respectively. IFG, inferior frontal gyrus; M1, primary motor cortex; preSMA, pre-supplementary motor area; GPe, globus pallidus externa; GPi, globus pallidus interna; SN, substantia nigra; STN, subthalamic nucleus; Tha, thalamus; VTA, ventral tegmental area.
Figure 3—figure supplement 1
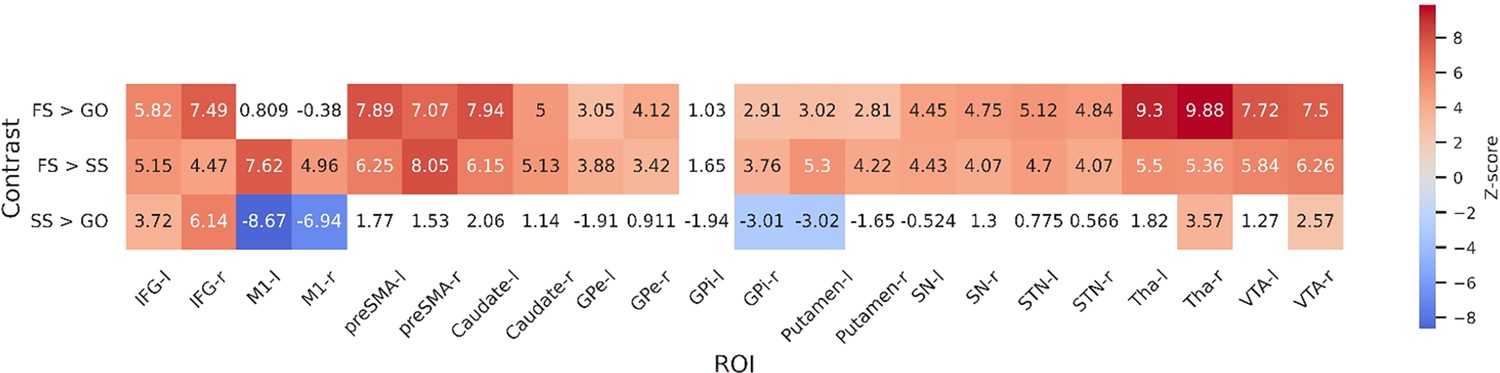
Group-level z-scores from the region of interest (ROI)-wise general linear model (GLM) analysis of included datasets, where SS and FS trials were time-locked to the presentation of the stop signal.
Thresholds are set using false discovery rate (FDR) correction (q < 0.05), varying between contrasts. The thresholds for each contrast are as follows: 3.01 for FS > GO, 2.26 for FS > SS, and 3.1 for SS > GO. Regions that do not reach significance are coloured white. Left and right hemispheres are shown separately, denoted by ‘-l’ or ‘-r’, respectively. IFG, inferior frontal gyrus; M1, primary motor cortex; preSMA, pre-supplementary motor area; GPe, globus pallidus externa; GPi, globus pallidus interna; SN, substantia nigra; STN, subthalamic nucleus; Tha, thalamus; VTA, ventral tegmental area.
Figure 3—figure supplement 2
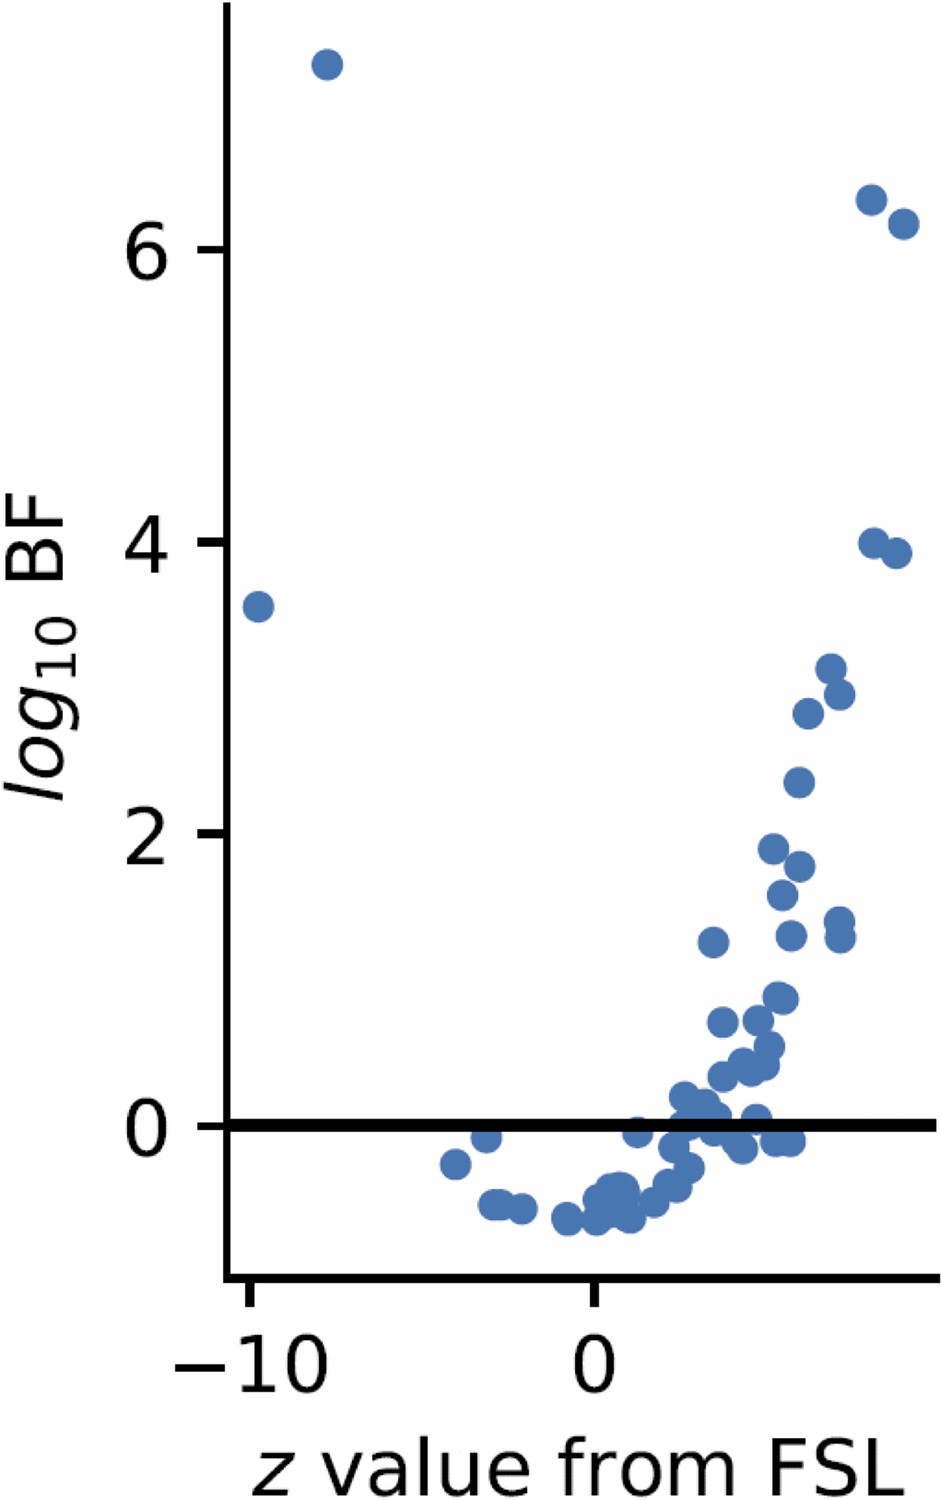
A comparison of the BFs and the frequentist z-scores from FSL.
The 0 point on each axis represents no evidence for an effect. Large absolute z-values are expected to also yield a high log BF, hence the inverted U-shape shows good correspondence between the two estimates.
Figure 4
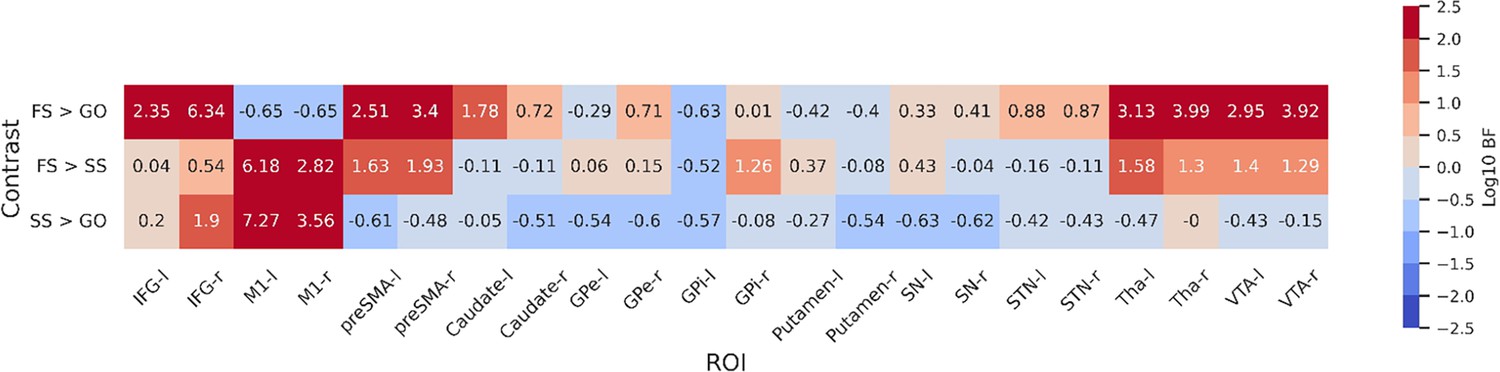
Log-transformed Bayes Factors for each contrast based on parameter estimates from first-level model.
Colouring depicts evidence for each hypothesis based on a variation of Jeffreys’ scale. BFs more than 2 or less than 2 on a log scale are defined as extreme evidence. Refer to Table 4 for details on interpretation of log-transformed BFs. BFs were calculated for each contrast for both hemispheres of each region of interest (ROI). Left and right hemispheres are shown separately, denoted by ‘-l’ or ‘-r’, respectively. IFG, inferior frontal gyrus; M1, primary motor cortex; preSMA, pre-supplementary motor area; GPe, globus pallidus externa; GPi, globus pallidus interna; SN, substantia nigra; STN, subthalamic nucleus; Tha, thalamus; VTA, ventral tegmental area.
Figure 5 with 1 supplement
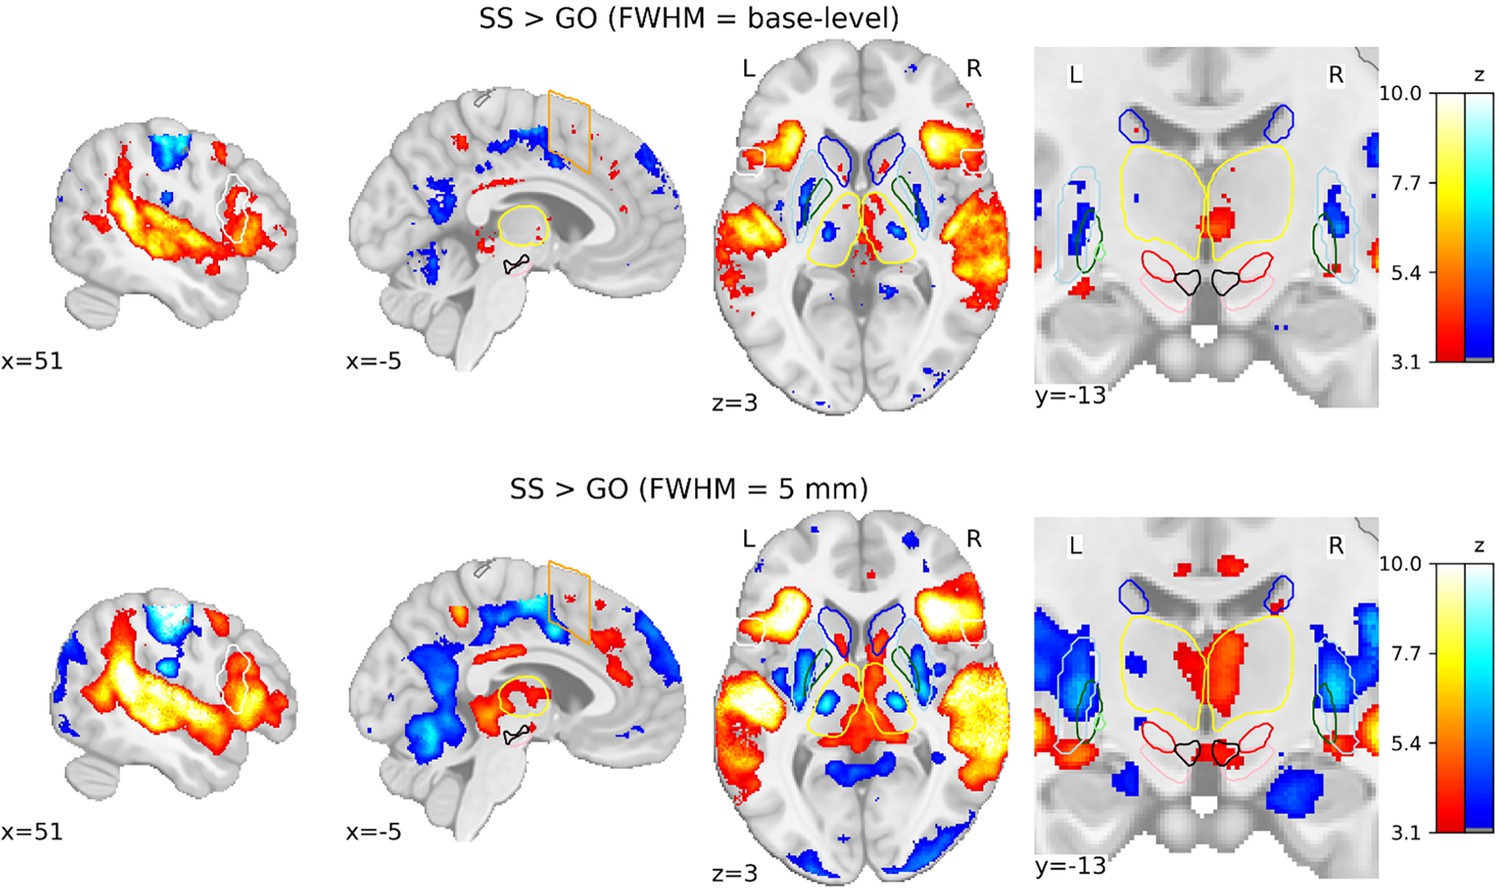
Comparison of group-level statistical parametric maps (SPMs) for the SS > GO contrast using different smoothing kernels.
SPMs resulting from general linear models (GLMs) computed on base-level spatially smoothed data can be seen on the top row, with SPMs resulting from GLMs computed on data spatially smoothed with a full width half maximum (FWHM) of 5 mm. Activation colours indicate false discovery rate (FDR) thresholded (q < 0.05) z-values. Two sagittal, one axial, and one zoomed in coronal view are shown. Coloured contour lines indicate regions of interest (inferior frontal gyrus [IFG] in white, M1 in grey, pre-supplementary motor area [preSMA] in orange, Caudate in dark blue, Putamen in light blue, GPe in dark green, globus pallidus interna [GPi] in light green, substantia nigra [SN] in pink, subthalamic nucleus [STN] in red, thalamus in yellow, and ventral tegmental area [VTA] in black). The background template and coordinates are in MNI2009c (1 mm). FS, failed stop; SS, successful stop.
Figure 5—figure supplement 1
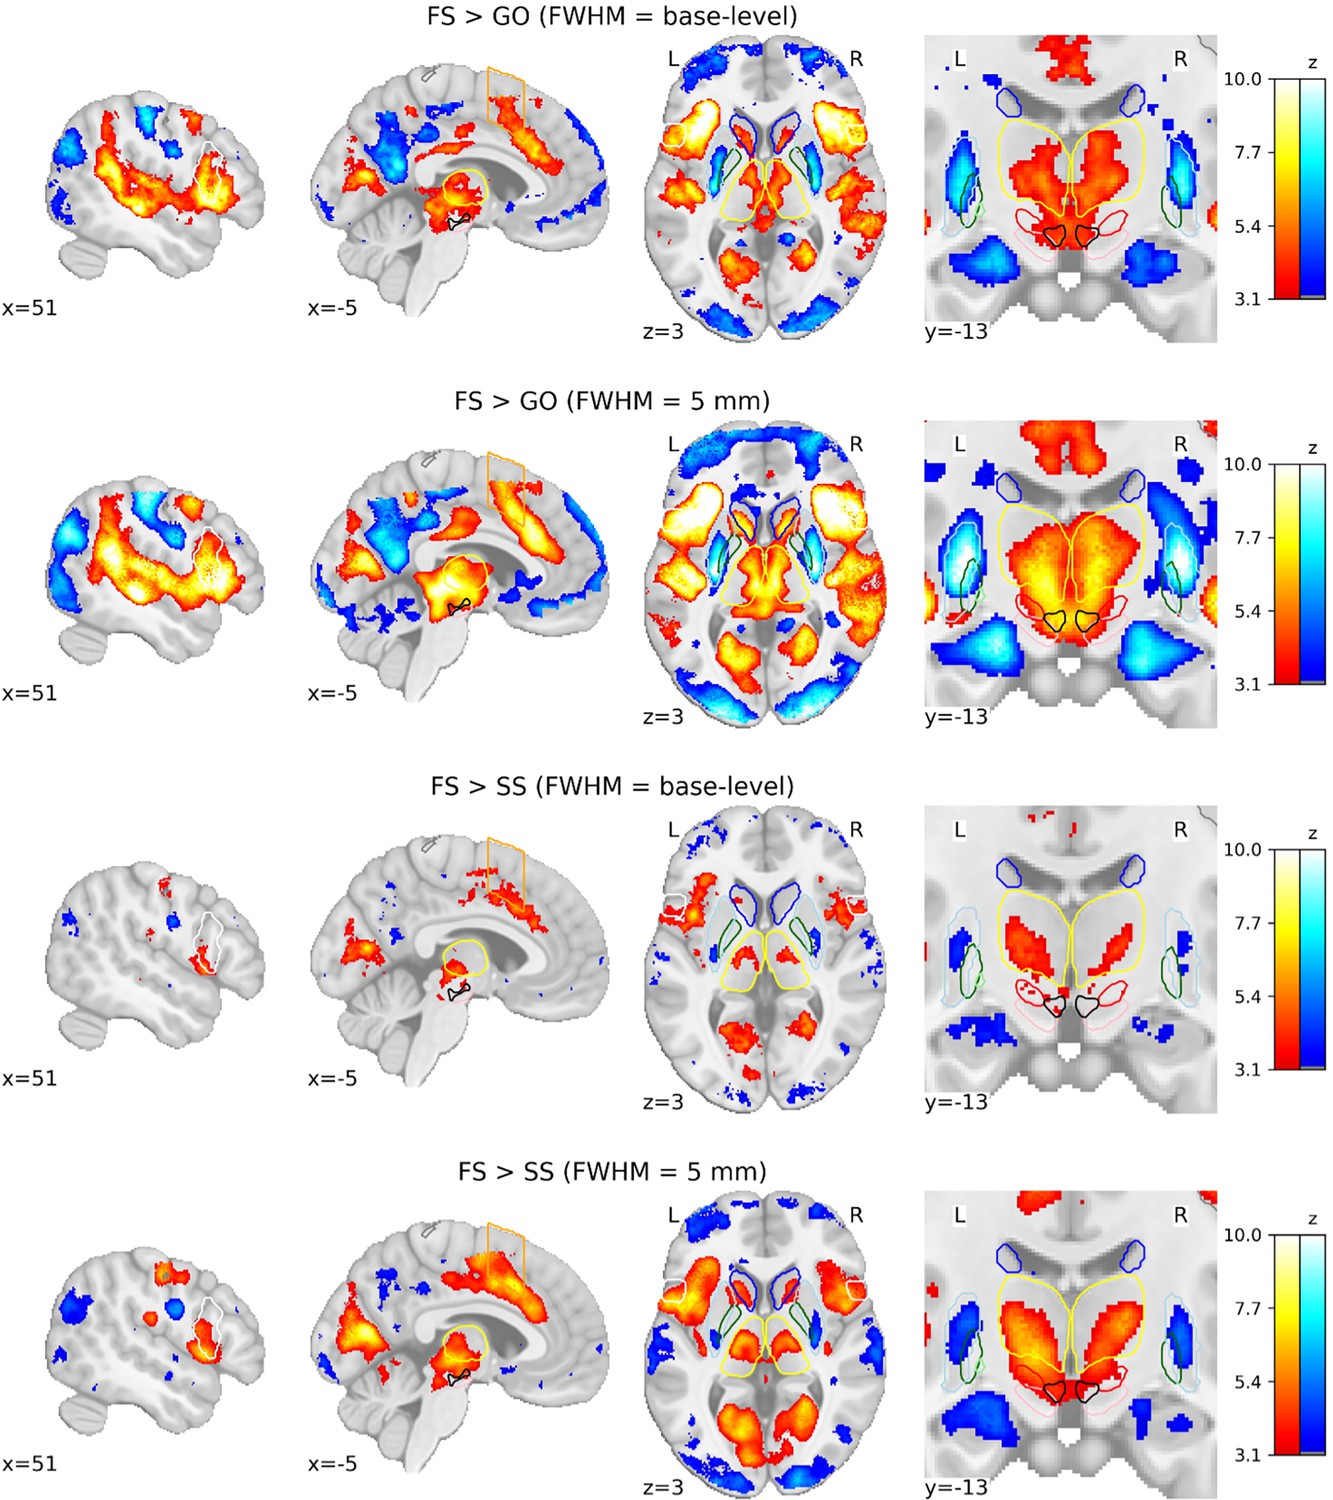
Group-level statistical parametric maps (SPMs) of the FS > GO and FS > SS contrasts using different smoothing kernels.
Activation colours indicate false discovery rate (FDR) thresholded (q < 0.05) z-values. Two sagittal, one axial, and one zoomed in coronal view are shown. Coloured contour lines indicate regions of interest (inferior frontal gyrus [IFG] in white, M1 in grey, pre-supplementary motor area [preSMA] in orange, Caudate in dark blue, Putamen in light blue, GPe in dark green, globus pallidus interna [GPi] in light green, substantia nigra [SN] in pink, subthalamic nucleus [STN] in red, thalamus in yellow, and ventral tegmental area [VTA] in black). The background template and coordinates are in MNI2009c (1 mm). FS, failed stop; SS, successful stop.
Tables
Table 1
Descriptive statistics of behaviour in the SST across each dataset.
Standard errors are given.
| Dataset | Median go RT (ms) | Median failed stop RT (ms) | Go omissions (%) | Go errors (%) | Mean SSRT (ms) | Median SSD (ms) | Mean stopping accuracy (%) |
|---|---|---|---|---|---|---|---|
| Aron_3T | 423 ± 18 | 382 ± 11 | 0.7 ± 0.4 | 0.6 ± 0.2 | 189 ± 8 | 227 ± 17 | 53 ± 1 |
| Poldrack_3T | 466 ± 9 | 426 ± 8 | 0.1 ± 0.04 | 0.9 ± 0.1 | 209 ± 5 | 279 ± 11 | 52 ± .6 |
| deHollander_7T | 472 ± 24 | 439 ± 22 | 1.6 ± 0.5 | 0.3 ± 0.1 | 219 ± 8 | 250 ± 22 | 54 ± 2 |
| Isherwood_7T | 626 ± 25 | 543 ± 22 | 1.9 ± 0.4 | 2.2 ± 0.4 | 256 ± 8 | 350 ± 30 | 54 ± 1 |
| Miletic_7T | 445 ± 17 | 414 ± 15 | 1.1 ± 0.5 | 0.7 ± 0.2 | 219 ± 20 | 230 ± 23 | 50 ± 1 |
Table 2
The principal MR acquisition parameters of the functional scans for each dataset.
| Dataset | TR (ms) | TE (ms) | Voxel size (mm) | FOV (mm) | No. slices | GRAPPA |
|---|---|---|---|---|---|---|
| Aron_3T | 2000 | 30 | 3.125 × 3.125 × 4 | 200 × 200 × 132 | 33 | N/A |
| Poldrack_3T | 2000 | 30 | 3 × 3 × 4 | 192 × 192 × 136 | 34 | N/A |
| deHollander_7T | 2000 | 14 | 1.5 × 1.5 × 1.5 | 192 × 192 × 97 | 60 | 3 |
| Isherwood_7T | 1380 | 14 | 1.5 × 1.5 × 1.5 | 192 × 192 × 128 | 82 | 3 |
| Miletic_7T | 3000 | 14 | 1.6 × 1.6 × 1.6 | 192 × 192 × 112 | 70 | 3 |
Table 3
Task details for the SST in each dataset.
| Dataset | Response modality | Type | Stop-signal duration (ms) | No. staircases | SSD range (ms) | Total no. trials | Stop trials (%) |
|---|---|---|---|---|---|---|---|
| Aron_3T | Hand, R | Auditory | 500 | 4 | 100–250 | 384 | 25 |
| Poldrack_3T | Hand, R | Auditory | 250 | 2 | 0–1000 | 128 | 25 |
| deHollander_7T | Hand, L/R | Auditory | 62 | 4 | 0–900 | 384 | 25 |
| Isherwood_7T | Hand, L/R | Visual | 300 | 1 | 50–900 | 200 | 25 |
| Miletic_7T | Hand, L/R | Auditory | 62 | 2 | 0–900 | 342 | 25 |
Table 4
Approximate interpretation of logarithmically transformed Bayes Factors.
H1 represents the alternative hypothesis, H0 represents the null hypothesis.
| Log10 BF | Interpretation | ||
|---|---|---|---|
| > | 2 | Extreme evidence for H1 | |
| 1.5 | – | 2 | Very strong evidence for H1 |
| 1 | – | 1.5 | Strong evidence for H1 |
| 0.5 | – | 1 | Moderate evidence for H1 |
| 0 | – | 0.5 | Anecdotal evidence for H1 |
| 0 | No evidence | ||
| 0 | – | −0.5 | Anecdotal evidence for H0 |
| −0.5 | – | −1 | Moderate evidence for H0 |
| −1 | – | −1.5 | Strong evidence for H0 |
| −1.5 | – | −2 | Very strong evidence for H0 |
| −2 | > | Extreme evidence for H0 | |
Additional files
Download links
A two-part list of links to download the article, or parts of the article, in various formats.
Downloads (link to download the article as PDF)
Open citations (links to open the citations from this article in various online reference manager services)
Cite this article (links to download the citations from this article in formats compatible with various reference manager tools)
Multi-study fMRI outlooks on subcortical BOLD responses in the stop-signal paradigm
eLife 12:RP88652.
https://doi.org/10.7554/eLife.88652.4


