Hsf1 and the molecular chaperone Hsp90 support a ‘rewiring stress response’ leading to an adaptive cell size increase in chronic stress
- Département de Biologie Moléculaire et Cellulaire, Université de Genève, Switzerland
- On leave from: Department of Pharmacology and Therapeutics, Faculty of Pharmacy, Pharos University in Alexandria, Egypt
- BioCode: RNA to Proteins Core Facility, Département de Microbiologie et Médecine Moléculaire, Faculté de Médecine, Université de Genève, Switzerland
- Institute of Genetics and Genomics of Geneva, Université de Genève, Switzerland
Figures
Figure 1 with 2 supplements
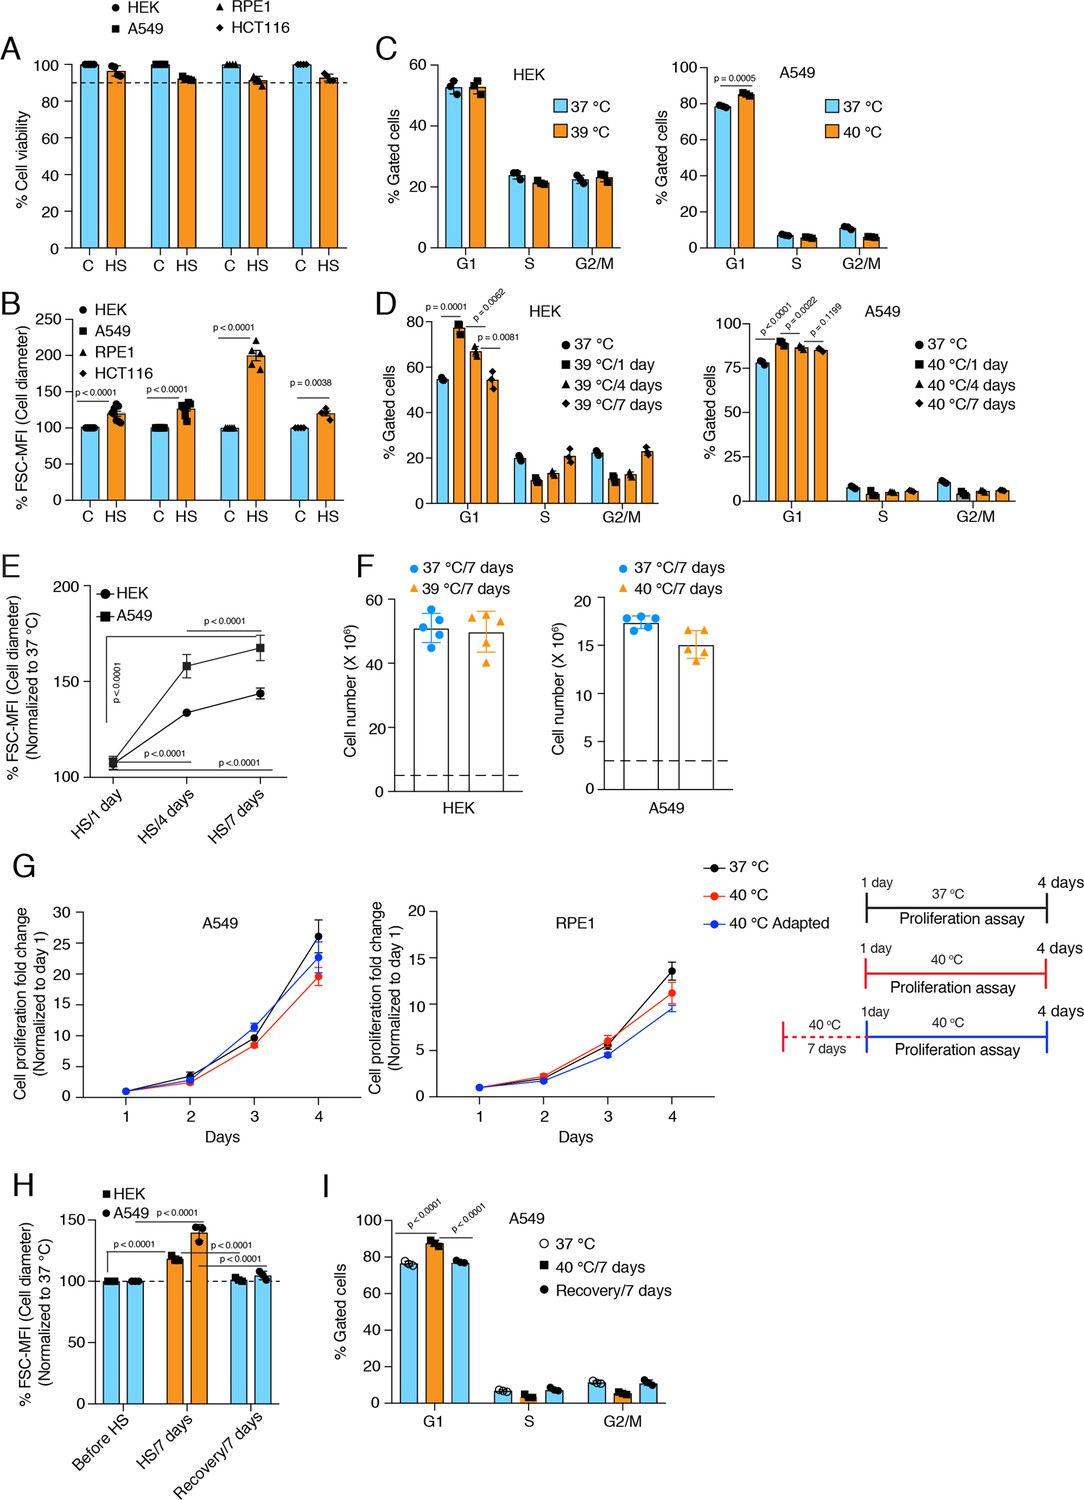
Cells increase their size in response to chronic stress.
(A) Flow cytometric quantification of cell viability under chronic HS for 7 days (HS = 39 °C for HEK and HCT116 cells; HS = 40 °C for A549 and RPE1 cells) (n = 4 biologically independent samples). (B) Flow cytometric quantification of cell size after 7 days of chronic HS (biologically independent samples: n = 6 for HEK and A549; n=5 for RPE1; n = 4 for HCT116). (C and D) Flow cytometric analysis of cell cycle (n=3 biologically independent samples). (E) Flow cytometric quantification of cell size during different time intervals of chronic HS (n=4 biologically independent samples). (F) Proliferation of HEK and A549 cells at the indicated temperature for the indicated period presented as cell numbers. Cells were seeded at a density of 5x10⁶ and 3x10⁶ per 15 cm plate for HEK and A549 cells, respectively. The numbers of live cells counted after 7 days are plotted (n=5 biologically independent experiments). (G) Proliferation of A549 and RPE1 cells measured with a crystal violet assay (n=3 biologically independent experiments). The adapted cells were maintained at 40 °C for 1 week before this experimental start point and continued at 40 °C during the experiment. See scheme of the experiment on the right. Note that the data are normalized to cell numbers on day 1. (H) Flow cytometric quantification of cell size in chronic HS and recovery (n=3 biologically independent samples). (I) Flow cytometric analysis of cell cycle in chronic HS and post HS recovery (n=3 biologically independent samples). The data are represented as mean values ± SEM for all bar and line graphs. The statistical significance between the groups was analyzed by two-tailed unpaired Student’s t-tests.
-
Figure 1—source data 1
Values related to all graphs.
- https://cdn.elifesciences.org/articles/88658/elife-88658-fig1-data1-v2.xlsx
Figure 1—figure supplement 1
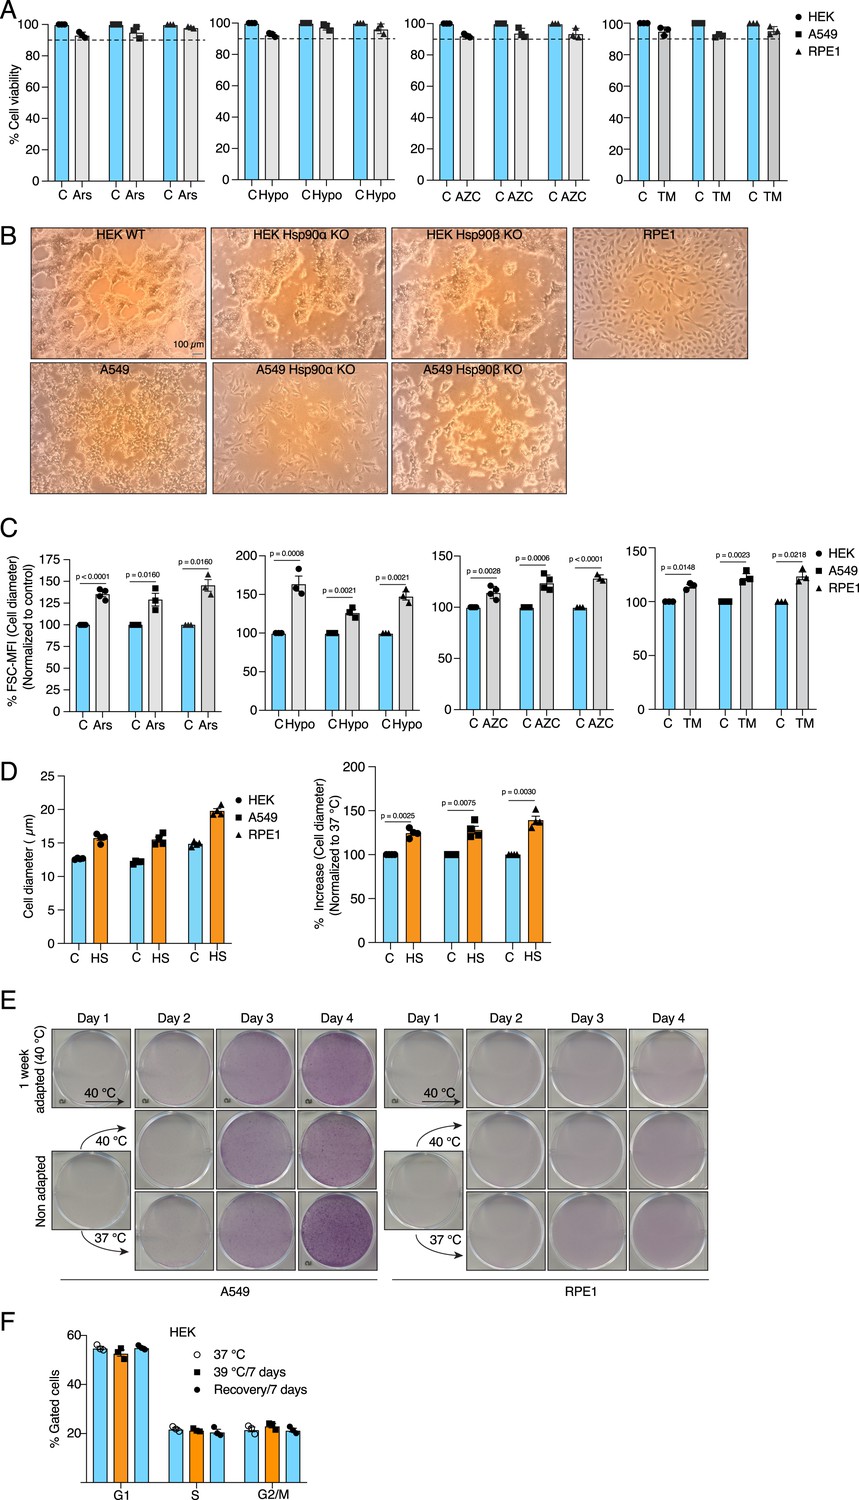
Cells increase their size in response to different types of chronic stress.
(A) Flow cytometric quantification of cell viability after 4 days of treatment with 10 μM sodium arsenite (Ars), 1% hypoxia (Hypo), 5 µM L-azetidine-2-carboxylic acid (AZC), or 250 nM tunicamycin (TM) (n=3 biologically independent samples). (B) Representative phase-contrast micrographs showing the confluency of the indicated cells on the day of harvesting. The size bar in the first macrograph (top left) is 100 μM and applies to all micrographs. (C) Flow cytometric quantification of cell size after 4 days of treatment as indicated (n=4, 3, 4, and 3 biological replicates for Ars, Hypo, AZC, and TM, respectively, for HEK cells; n=3, 3, 4, and 3 for Ars, Hypo, AZC, and TM, respectively, for A549 cells; n=3, 3, 3, and 3 for Ars, Hypo AZC, and TM, respectively, for RPE1). (D) Bar graphs of the measurements of cell diameter by automated cell counter (on the left) and the percent change in cell diameter (on the right) (E) Scanned images of plates with crystal violet-stained cells (representative images of n=3 independent experiments). (F) Flow cytometric analysis of cell cycle after 1 week in chronic HS and post HS recovery (n=3 biologically independent samples). The data are represented as mean values ± SEM for all bar and line graphs. The statistical significance between the groups was analyzed by two-tailed unpaired Student’s t-tests.
-
Figure 1—figure supplement 1—source data 1
Values related to all graphs of Figure 1—figure supplement 1.
- https://cdn.elifesciences.org/articles/88658/elife-88658-fig1-figsupp1-data1-v2.xlsx
Figure 1—figure supplement 2
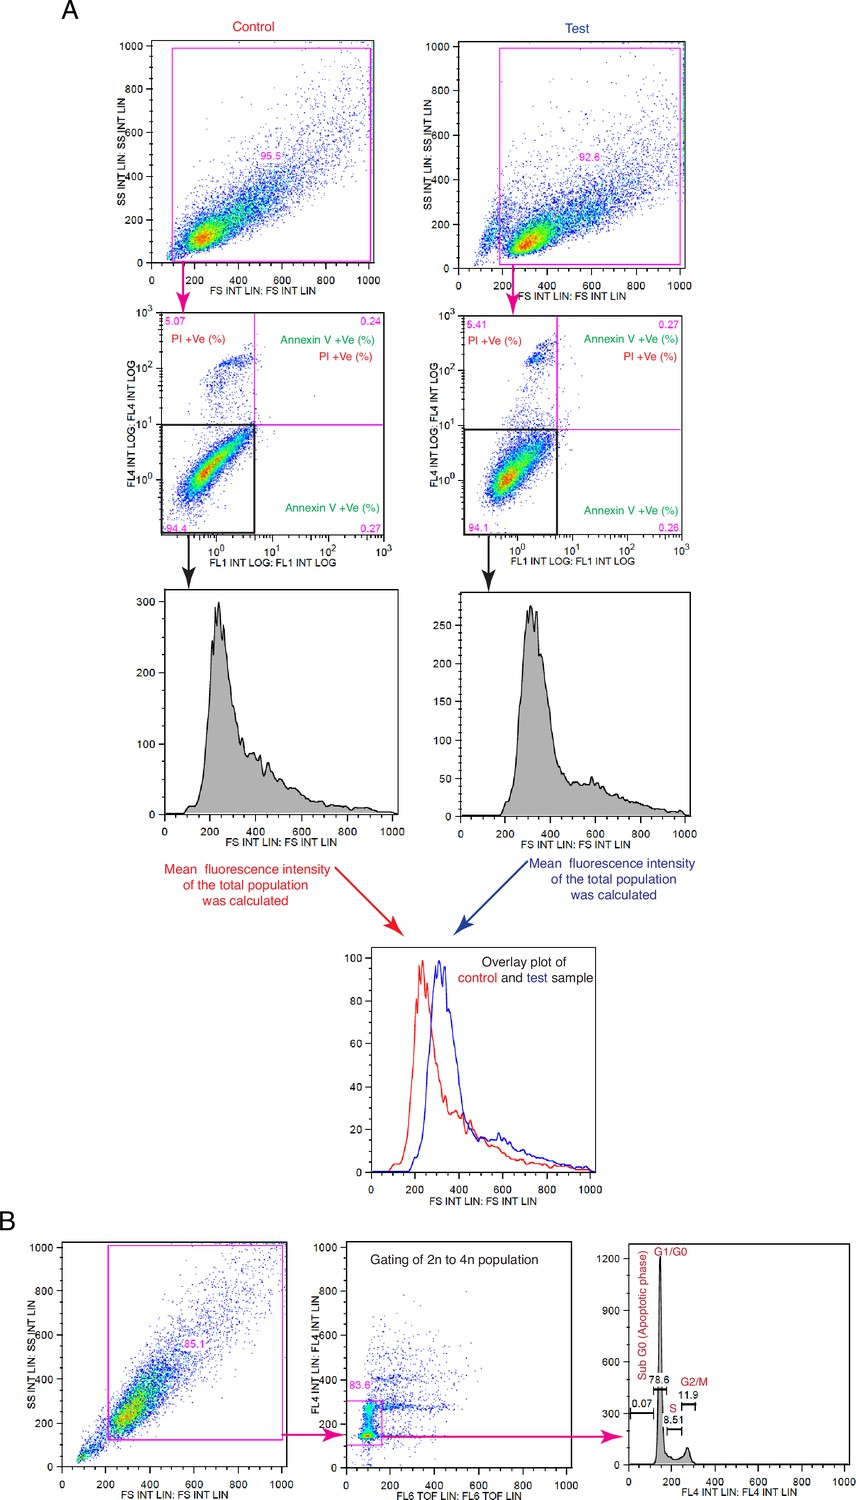
Schematic representation of the flow cytometric strategies for cell size and cell cycle analyses.
(A) Gating and strategy for cell size analyses relevant to Figures 1B, E, H—3E–F, 5B, 6E, 8B and C and F, and Figure 1—figure supplement 1C, Figure 2—figure supplement 1B, Figure 3—figure supplement 1D, G and J, Figure 8—figure supplement 1A, C–F. For size measurements, cell populations were gated based on the values of the forward scatter (FSC). (B) Gating and analysis strategy for cell cycle analyses relevant to Figures 1C, D and I, 10B and C, and Figure 1—figure supplement 1F.
Figure 2 with 1 supplement
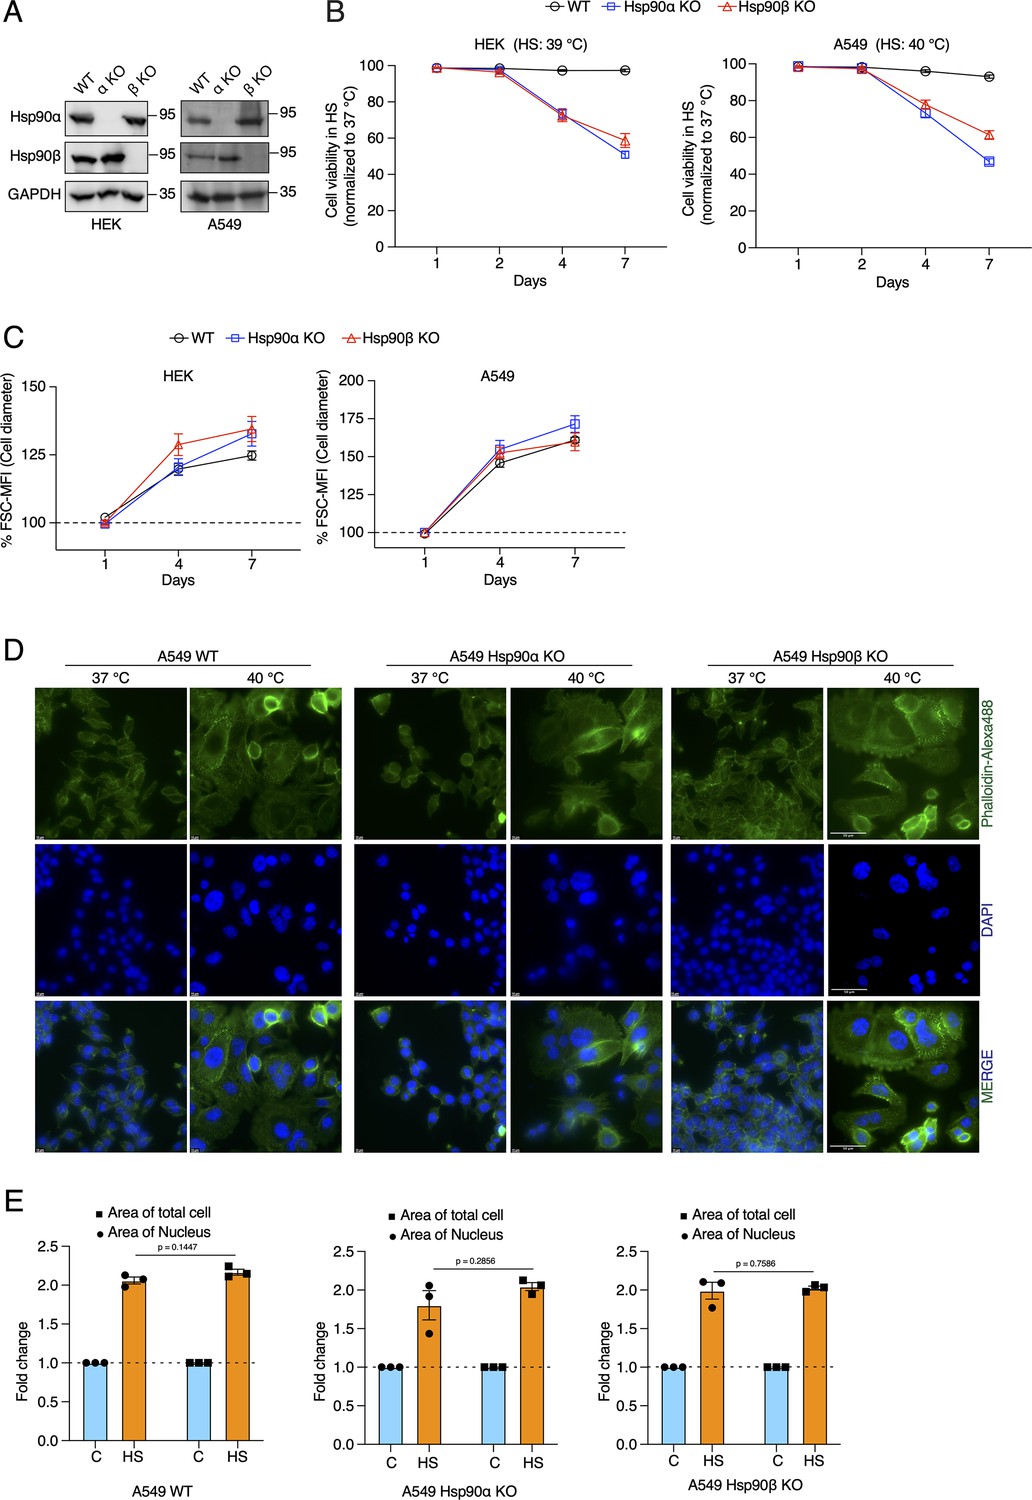
Cells increase their overall size and their nuclei, but are unable to adapt to chronic HS in the absence of one of the cytosolic Hsp90 isoforms.
(A) Immunoblots of Hsp90α and Hsp90β in WT HEK and A549 cells, and their respective Hsp90α/β KO cells. GAPDH serves as the loading control (α KO; Hsp90α KO and β KO; Hsp90β KO) (representative images of n=4 biologically independent experiments). (B) Flow cytometric quantification of cell viability of HEK, A549, and their respective Hsp90α/β KO cells in chronic HS at different time points during a period of 7 days (n=5 biologically independent samples). Note that the X axis does not have a linear scale and that lines connecting the data points are drawn as a visual aid. (C) Flow cytometric quantification of cell size in chronic HS at different time points during a period of 7 days (HS = 39 °C for HEK and 40 °C for A549) (n=4 biologically independent samples) The data are represented as mean values ± SEM for all bar graphs. (D) Fluorescence microscopy images of A549 WT and Hsp90α/β KO cells fixed after 4 days of chronic HS. The cytoskeleton is stained with phalloidin-Alexa488 (green), and the nucleus is stained with DAPI (blue). Images were captured with a fluorescence microscope (Zeiss, Germany). The scale bars on the images in the far right column are 50 μM. (E) Bar graphs of the area of nuclei and whole cells determined from fluorescent micrographs (representative images are shown in panel D) using ImageJ. We used micrographs from three biologically independent experiments. From each experiment, we measured 30 randomly chosen cells, and their average values were used as one data point. The data for all bar graphs are represented as mean values ± SEM. The statistical significance between the groups was analyzed by two-tailed unpaired Student’s t-tests.
-
Figure 2—source data 1
Raw and annotated immunoblots.
- https://cdn.elifesciences.org/articles/88658/elife-88658-fig2-data1-v2.zip
-
Figure 2—source data 2
Values related to all graphs.
- https://cdn.elifesciences.org/articles/88658/elife-88658-fig2-data2-v2.xlsx
Figure 2—figure supplement 1
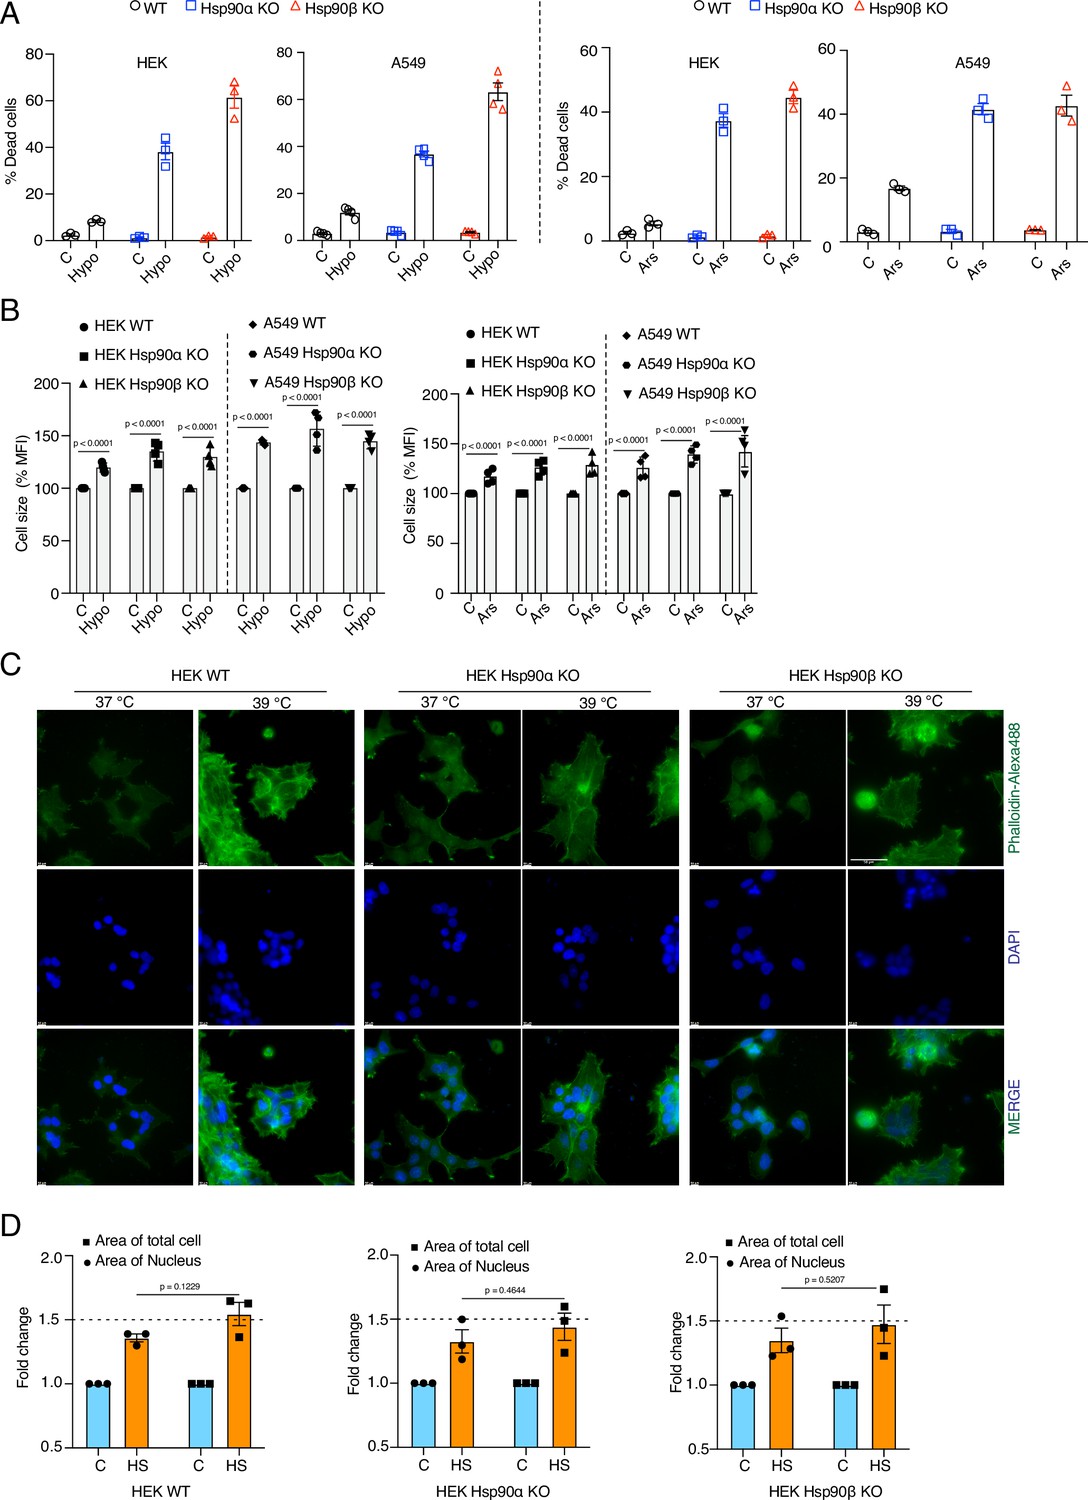
Cells are unable to adapt to chronic stress in the absence of one of the Hsp90 isoforms, but still get larger.
(A) Flow cytometric quantification of cell death of A549 WT and Hsp90α/β KO cells after 4 days in 1% hypoxia (Hypo) and 10 μM sodium arsenite (Ars) treatment (n=3 biologically independent samples). (B) Flow cytometric quantification of cell size after 4 days in 1% hypoxia (Hypo) and 10 μM sodium arsenite (Ars) treatment (n=4 biologically independent samples). (C) Fluorescence microscopy images of HEK WT and Hsp90α/β KO cells after 4 days of chronic HS. The cytoskeleton is stained with Phalloidin-Alexa488 (green), and the nucleus is stained with DAPI (blue). The scale bars on each image are 10 μM, and 50 µM on the image at the top right. (D) Bar graphs of the area of nuclei and whole cells determined from fluorescent micrographs (representative images are shown in panel C) using ImageJ. We used micrographs from three biologically independent experiments. From each experiment, we measured 30 randomly chosen cells, and their average values were used as one data point. The data of all bar graphs in the figure are represented as mean values ± SEM for all bar graphs. The statistical significance between the groups was analyzed by two-tailed unpaired Student’s t-tests.
-
Figure 2—figure supplement 1—source data 1
Values related to all graphs of Figure 2—figure supplement 1.
- https://cdn.elifesciences.org/articles/88658/elife-88658-fig2-figsupp1-data1-v2.xlsx
Figure 3 with 1 supplement
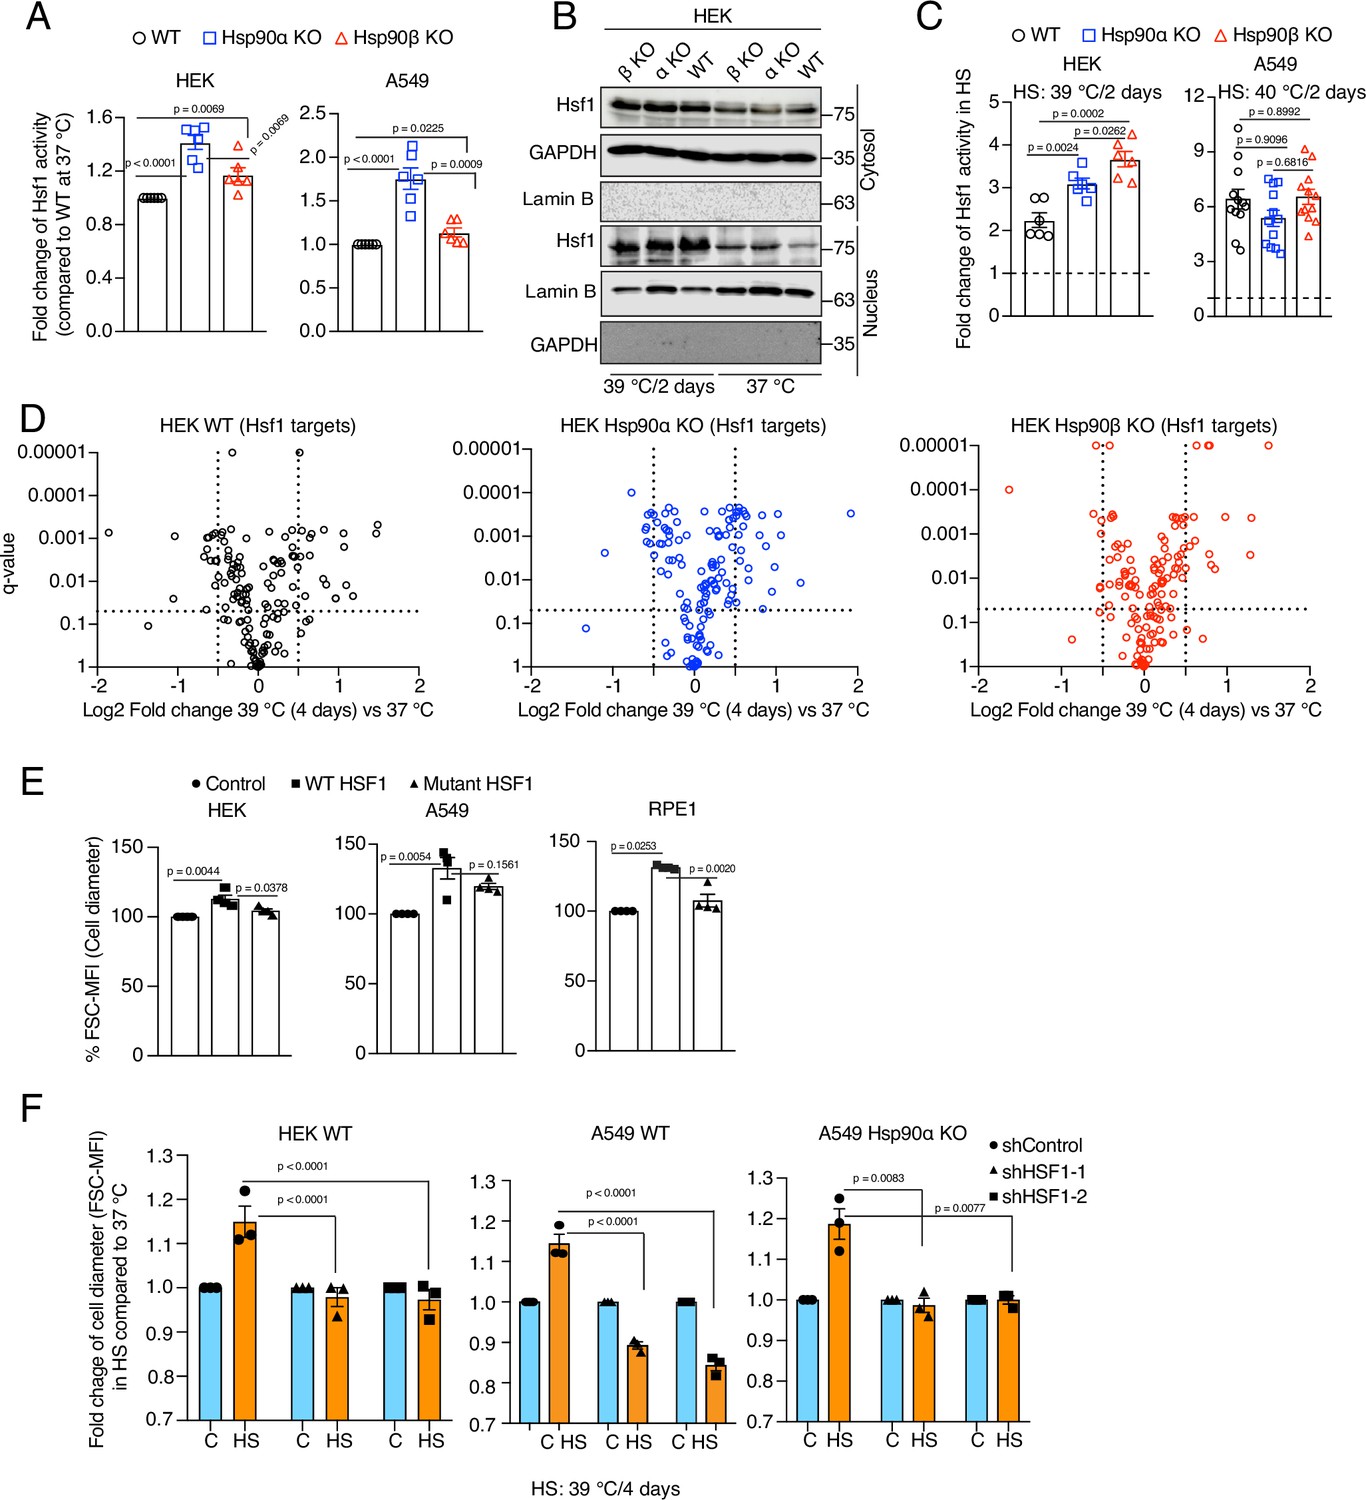
Hsf1 regulates cell size in response to stress.
(A) Fold change of Hsf1 activity of HEK WT, A549 WT, and their respective Hsp90α/β KO cells at 37 °C as measured by luciferase reporter assay (n=3 biologically independent samples and 2 experimental replicates each time). (B) Immunoblots of Hsf1 in the cytosolic and nuclear fractions of HEK WT and Hsp90α/β KO cells (α KO, Hsp90αKO; β KO, Hsp90βKO). GAPDH and lamin B1 serve as loading controls (representative blots of n=2 biologically independent experiments). (C) Fold change of Hsf1 activity of HEK WT, A549 WT, and their respective Hsp90α/β KO cells in chronic HS as measured by luciferase reporter assay (n=3 biologically independent samples, and 2 experimental replicates each time for HEK; n=3 biologically independent samples, and 4 experimental replicates each time for A549). (D) Volcano plots of the normalized fold changes in protein levels of some core Hsf1 target genes (list obtained from https://hsf1base.org/) in chronic HS, determined by quantitative label-free proteomic analysis of Hsp90α/β KO and WT HEK cells. Molecular chaperones, whose expression is regulated by Hsf1, are excluded from this dataset. Each genotype was compared with its respective 37 °C control (n=3 biologically independent samples). Log2 fold changes of >0.5 or <–0.5 with q-values (adjusted p-values) of <0.05 were considered significant differences for a particular protein. (E) Flow cytometric quantification of cell size of HEK, A549, and RPE1 cells upon overexpression of WT Hsf1 (with plasmid pcDNA-Flag HSF1 wt) or mutant Hsf1 (with plasmid pcDNA-Flag HSF1 C205; retaining only the first 205 amino acids)(Kijima et al., 2018), and with plasmid pcDNA3.1(+) as empty vector control. Transfected cells to be measured were identified on the basis of their coexpression of EGFP (n=4 biologically independent experiments). (F) Flow cytometric quantification of cell size in chronic HS after knockdown of Hsf1 in HEK WT, A549 WT and Hsp90αKO cells. Here the chronic HS for A549 cells is at 39 °C instead of 40 °C to reduce HS-induced damage in Hsf1 knockdown conditions (n=3 biologically independent samples). For all bar graphs, the statistical significance between the groups was analyzed by two-tailed unpaired Student’s t-tests.
-
Figure 3—source data 1
Values related to all graphs.
- https://cdn.elifesciences.org/articles/88658/elife-88658-fig3-data1-v2.xlsx
-
Figure 3—source data 2
Raw and annotated immunoblots.
- https://cdn.elifesciences.org/articles/88658/elife-88658-fig3-data2-v2.zip
Figure 3—figure supplement 1
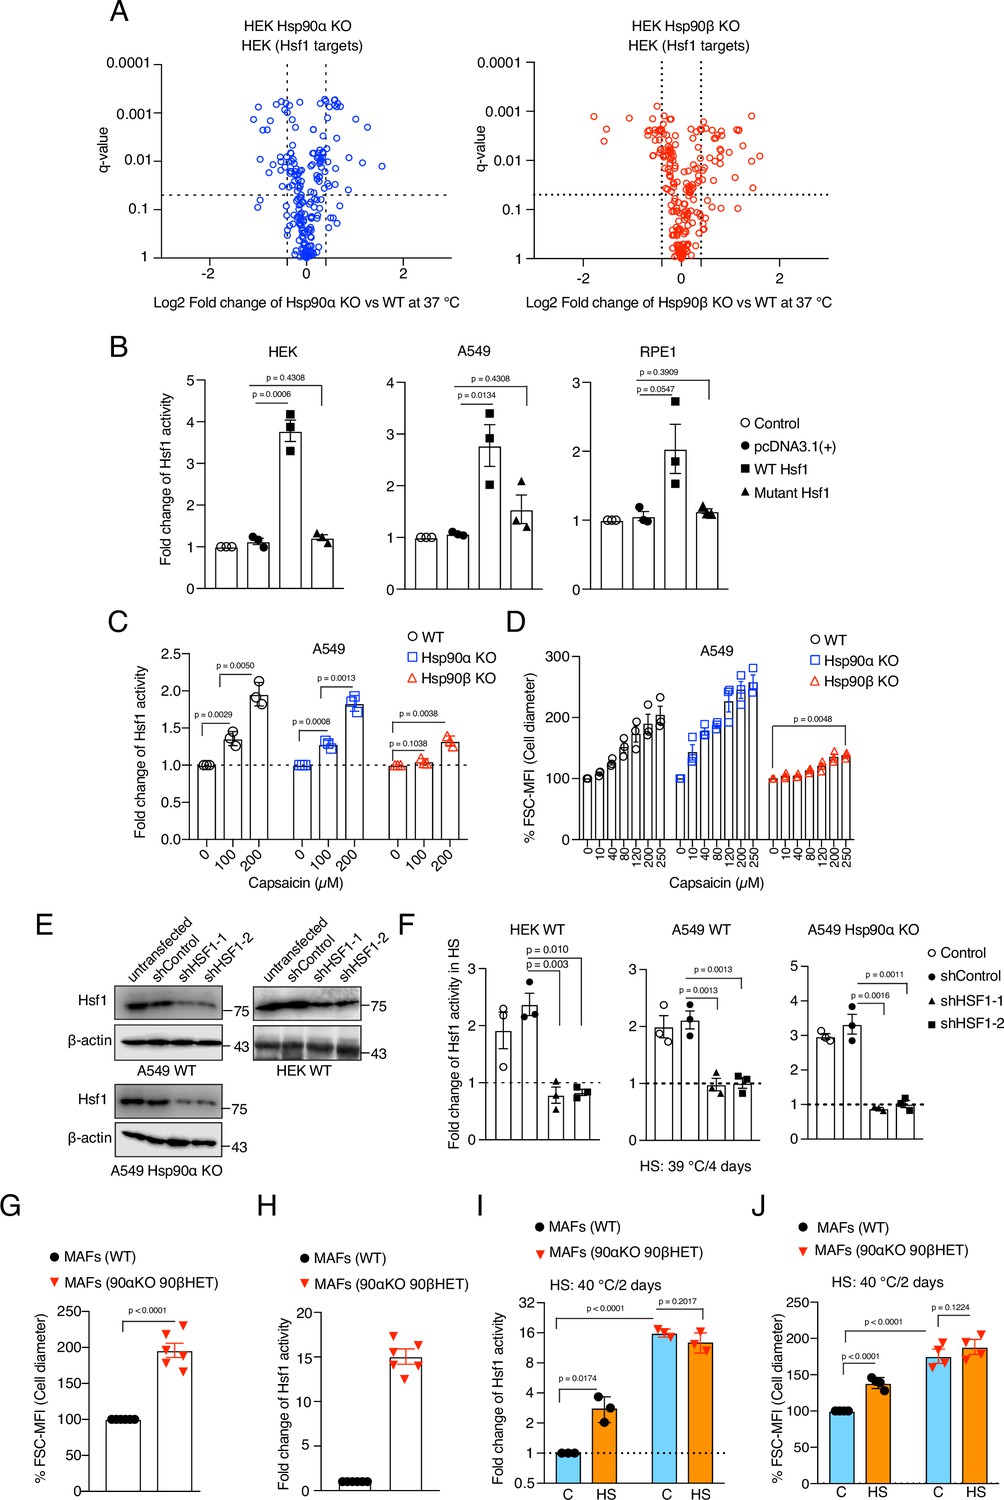
Hsf1 induces cell size in response to stress.
(A) Volcano plots of the normalized fold changes in protein levels of some of the core Hsf1 target genes (list obtained from https://hsf1base.org/) in Hsp90α/β KO cells compared to WT HEK as determined by quantitative label-free proteomic analysis (extracted from Source data 1). Molecular chaperones, whose expression is regulated by Hsf1, are excluded from this dataset (n=3 biologically independent samples). Log2 fold changes of >0.5 or <–0.5 with a q-value (adjusted p-value) of <0.05 were considered significant differences for a particular protein. (B) Fold change of Hsf1 activity of HEK, A549, and RPE1 cells upon overexpressing WT and mutant Hsf1 in combination with EGFP, as measured with the Hsf1 luciferase reporter. Control is transfected with only Hsf1 reporter plasmid and pEGFP-C1, those are common to all the experimental conditions; (n=3 biologically independent samples). (C) Fold change of Hsf1 activity in A549 WT, Hsp90α KO, and Hsp90β KO cells after 4 days of capsaicin treatment as measured by luciferase reporter assay (n=3 biologically independent samples). (D) Flow cytometric quantification of cell size after 4 days of capsaicin treatment of Hsp90α/β KO and WT A549 cells (n=3 biologically independent samples). (E) Immunoblots of Hsf1 after Hsf1 knockdown in A549 WT, A549 Hsp90α KO, and HEK WT cells. β-actin serves as the loading control (representative of n=2 independent experiments). (F) Fold change of Hsf1 activity in HEK WT, A549 WT, and A549 Hsp90α KO cells in chronic HS after Hsf1 knockdown as measured by luciferase reporter assays. Here the chronic HS for A549 cells is 39 °C to instead of 40 °C to reduce HS-induced damage in Hsf1 knockdown conditions (n=3 biologically independent samples). (G) Flow cytometric quantification of cell size of mouse fibroblast. (90αKO, 90β HET), homozygous hsp90α KO, heterozygous hsp90β KO cells (n=6 biologically independent samples). (H) Fold change of Hsf1 activity in (90αKO, 90β HET) MAFs compared to WT at 37 °C, as measured by luciferase reporter assays (n=3 biologically independent samples). (I) Fold change of Hsf1 activity in MAFs subjected to chronic HS (orange bars) compared to 37 °C (blue bars), as measured by luciferase reporter assay (n=3 biologically independent samples). (J) Flow cytometric quantification of cell size of MAFs subjected to chronic HS (orange bars) by comparison to 37 °C (blue bars; n=4 biologically independent samples). The data are represented as mean values ± SEM for all bar graphs. The statistical significance between the groups was analyzed by two-tailed unpaired Student’s t-tests.
-
Figure 3—figure supplement 1—source data 1
Values related to all graphs of Figure 3—figure supplement 1.
- https://cdn.elifesciences.org/articles/88658/elife-88658-fig3-figsupp1-data1-v2.xlsx
-
Figure 3—figure supplement 1—source data 2
Raw and annotated immunoblots of Figure 3—figure supplement 1.
- https://cdn.elifesciences.org/articles/88658/elife-88658-fig3-figsupp1-data2-v2.zip
Figure 4 with 2 supplements
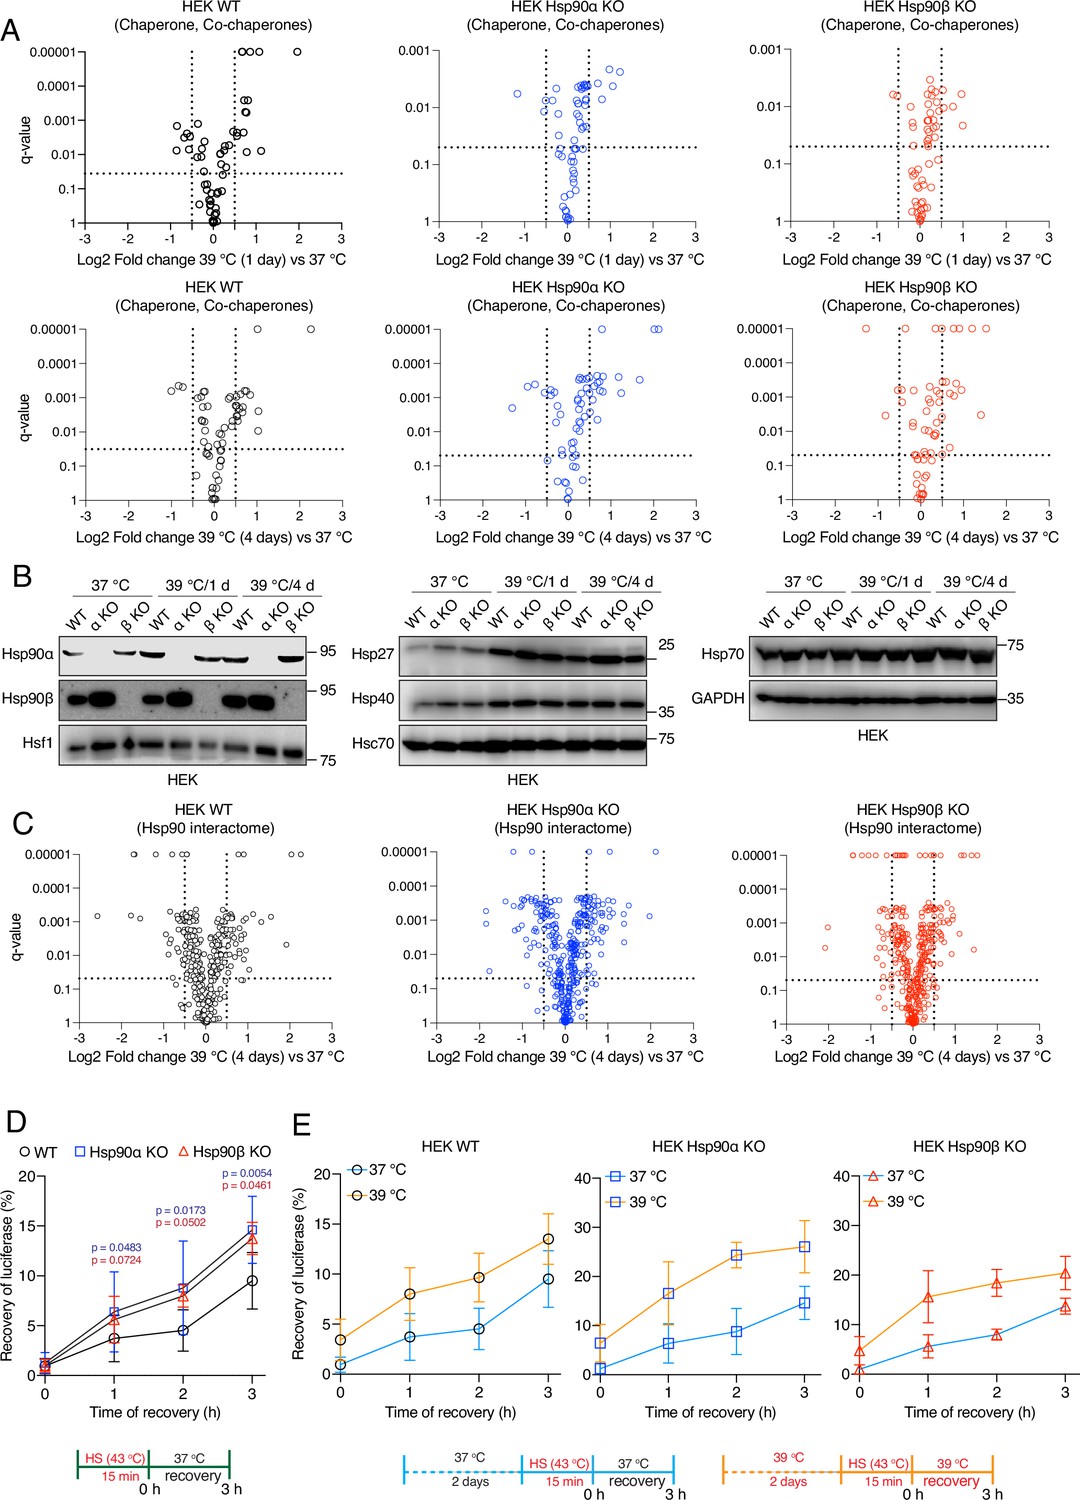
Hsp90α/β KO cells maintain chaperones, co-chaperones, and Hsp90 interactors during chronic stress adaptation.
(A) Volcano plots of the normalized fold changes of molecular chaperones and co-chaperones after 1 and 4 days (first and second rows, respectively) of chronic HS determined by quantitative label-free proteomic analyses of Hsp90α/β KO and WT HEK cells. Each genotype was compared with its respective 37 °C control (n=3 biologically independent samples). Log2 fold changes of >0.5 or <–0.5 with q-values (adjusted p-values) of <0.05 (indicated as stippled lines) were considered significant differences for a particular protein. (B) Immunoblots of different molecular chaperones in HEK WT and Hsp90α/β KO cells (α KO, Hsp90αKO; β KO, Hsp90βKO). GAPDH serves as the loading control for all three panels (representative of n=2 independent experiments). (C) Volcano plots of the normalized fold changes of the Hsp90 interactors (list obtained from https://www.picard.ch/Hsp90Int) after 4 days of chronic HS determined by quantitative label-free proteomic analyses of Hsp90α/β KO and WT HEK cells. Each genotype was compared with its respective 37 °C control (n=3 biologically independent samples). (D and E) In vivo refolding of heat-denatured luciferase of control cells (blue line) and cells heat-adapted to 39 °C (orange line). Luciferase activity before the acute HS (at 43 °C) is set to 100% (n=3 biologically independent samples). See scheme of the experiment below. Note the different scales of the Y axes of the bar graphs in panel E. The data are represented as mean values ± SEM for all bar graphs. The statistical significance between the groups was analyzed by two-tailed unpaired Student’s t-tests. The p-values for Hsp90α and Hsp90β KO cells are in blue and red, respectively. All p-values are for comparisons to the respective WT.
-
Figure 4—source data 1
Raw and annotated immunoblots.
- https://cdn.elifesciences.org/articles/88658/elife-88658-fig4-data1-v2.zip
-
Figure 4—source data 2
Values related to all graphs.
- https://cdn.elifesciences.org/articles/88658/elife-88658-fig4-data2-v2.xlsx
Figure 4—figure supplement 1
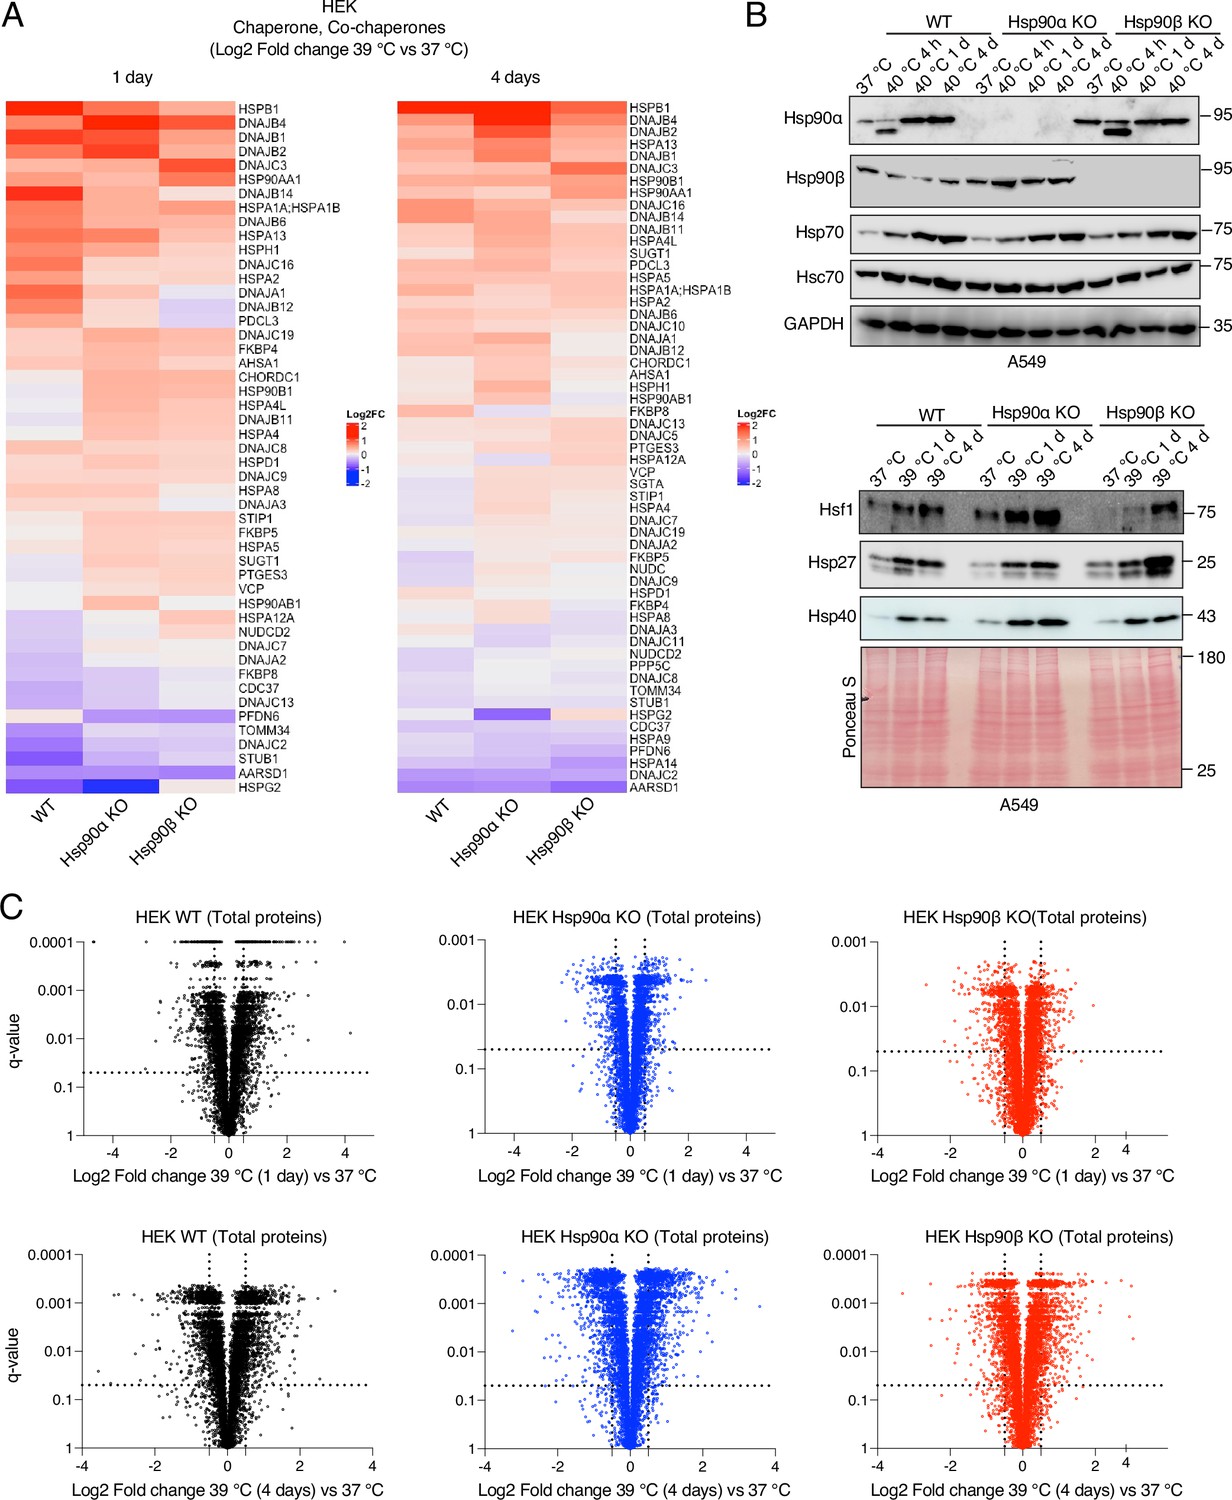
Hsp90α/β KO cells maintain molecular chaperones, co-chaperones, and total proteins.
(A) Heat maps of the normalized fold changes (log2) of molecular chaperones and co-chaperones of HEK cells subjected to 1 and 4 days of chronic HS as determined by quantitative label-free proteomics (n=3 biologically independent samples); only proteins whose abundance changed with q-values (adjusted p-values) of <0.05 were considered significant and are shown in the heat map (extracted from Source data 1). (B) Immunoblots of some molecular chaperones of A549 WT and Hsp90α/β KO cells. GAPDH and the Ponceau S-stained nitrocellulose filter serve as loading controls. (C) Volcano plots of the normalized fold changes of total proteins of cells subjected to chronic HS for 1 and 4 days (first and second rows, respectively) determined by quantitative label-free proteomics (extracted from Source data 1). Each genotype was compared with its respective 37 °C control (n=3 biologically independent samples). Log2 fold changes of >0.5 or <–0.5 with q-values (adjusted p-values) of <0.05 were considered significant differences for a particular protein.
-
Figure 4—figure supplement 1—source data 1
Raw and annotated immunoblots of Figure 4—figure supplement 1.
- https://cdn.elifesciences.org/articles/88658/elife-88658-fig4-figsupp1-data1-v2.zip
Figure 4—figure supplement 2
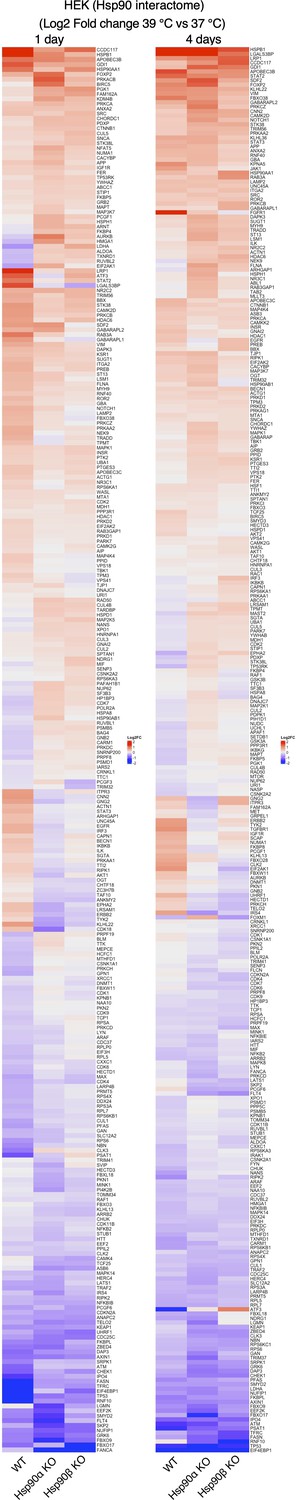
Hsp90α/β KO cells maintain Hsp90 interactors in chronic stress.
Heat maps of the normalized fold changes (log2) of Hsp90 interactors of HEK cells subjected to 1 and 4 days of chronic HS as determined by quantitative label-free proteomics (n=3 biologically independent samples); only proteins whose abundance changed with q-values (adjusted p-values) of <0.05 were considered significant and are shown in the heat map (extracted from Source data 1).
Figure 5 with 1 supplement
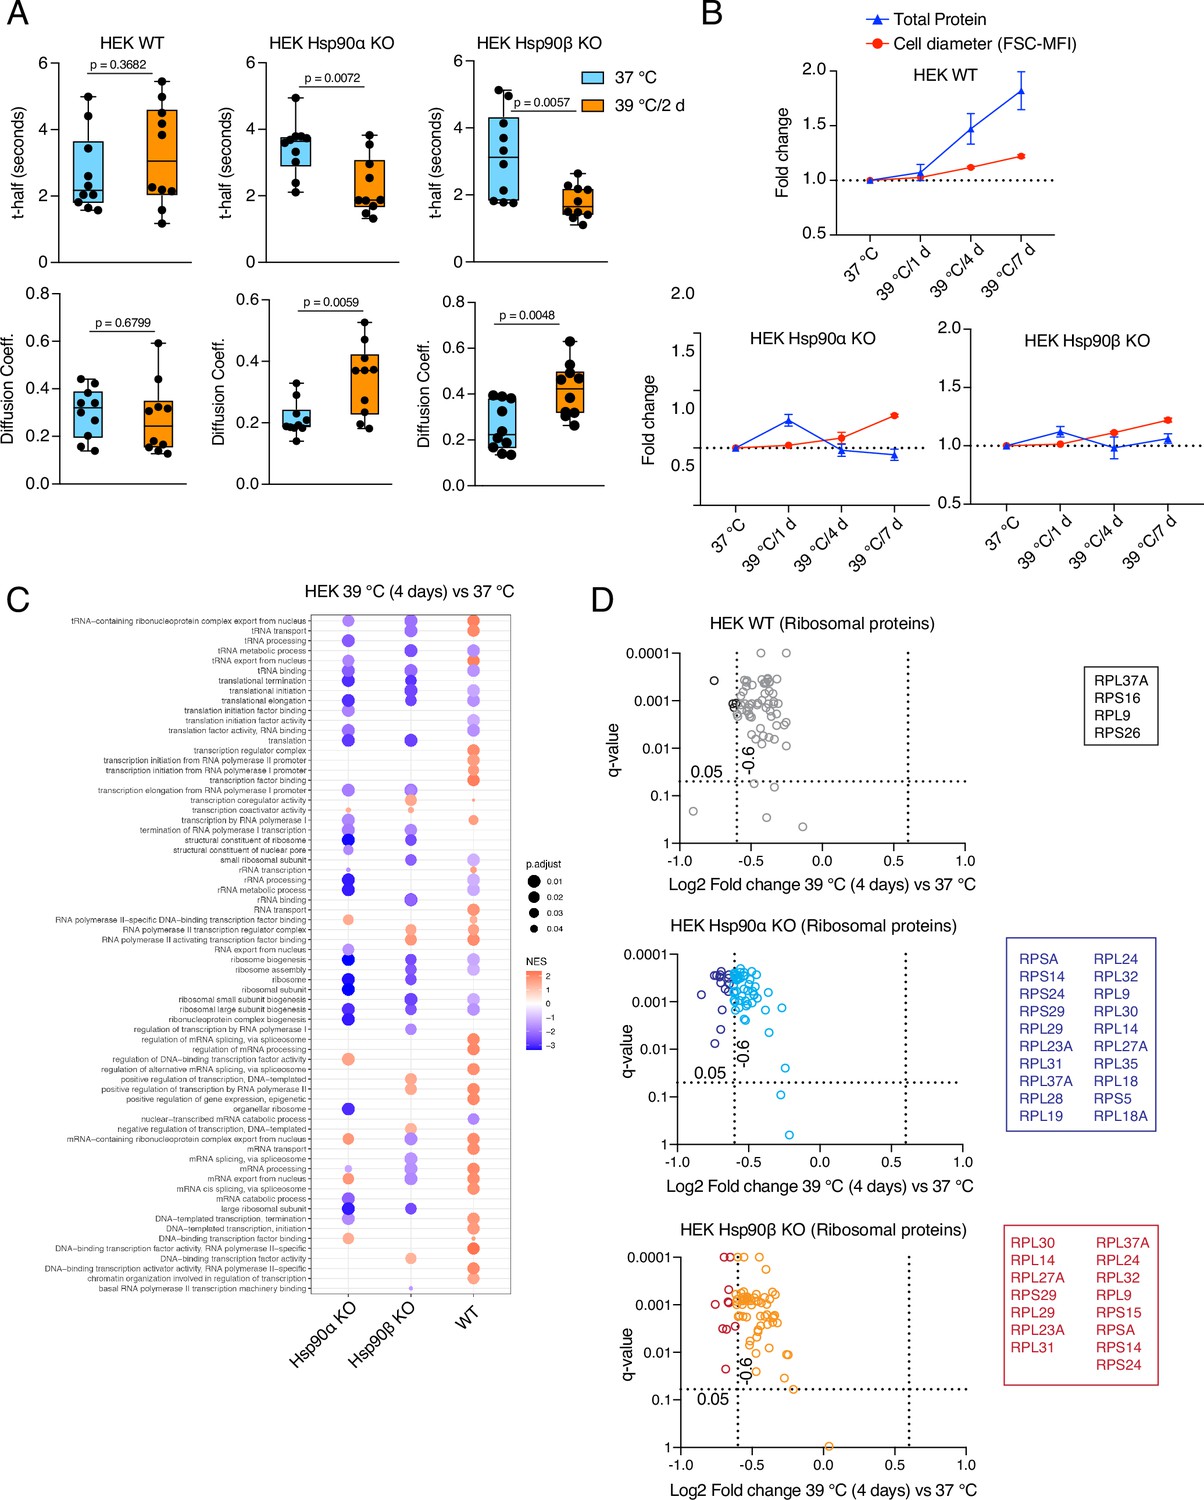
Hsp90α/β KO cells suffer from cytoplasmic protein dilution during adaptation to chronic stress.
(A) FRAP experiments with control and heat-adapted live cells expressing EGFP. The respective box plots show the t-half values of recovery of EGFP fluorescence and the apparent EGFP diffusion coefficients (n=10 cells from two biologically independent experiments). The statistical significance between the groups was analyzed by two-tailed unpaired Student’s t-tests. (B) Fold change of cell size (represented by the FSC-MFI values) and total proteins (determined as MFI-FL1 values) in chronic HS as analyzed by flow cytometry. Cells were fixed, and total proteins were stained using Alexa Fluor 488 NHS ester (n=3 biologically independent experiments). Lines connecting the data points are drawn as a visual aid. (C) GSEA plot showing the up- or down-regulation (red and blue, respectively) of pathways associated with cellular transcription and translation after 4 days of chronic HS compared to the respective 37 °C controls; NES, normalized enrichment score. (D) Volcano plots of the normalized fold changes of the ribosomal proteins (list obtained from http://ribosome.med.miyazaki-u.ac.jp/) after 4 days of chronic HS determined by quantitative label-free proteomic analysis in Hsp90α/β KO and WT HEK cells. Each genotype was compared with its respective 37 °C control (n=3 biologically independent samples). Log2 fold changes of >0.6 or <–0.6 with q-values (adjusted p-values) of <0.05 (indicated as stippled lines) were considered significant differences for a particular protein. The boxes beside the volcano plots list the corresponding proteins that were significantly downregulated.
-
Figure 5—source data 1
Values related to all graphs.
- https://cdn.elifesciences.org/articles/88658/elife-88658-fig5-data1-v2.xlsx
Figure 5—figure supplement 1
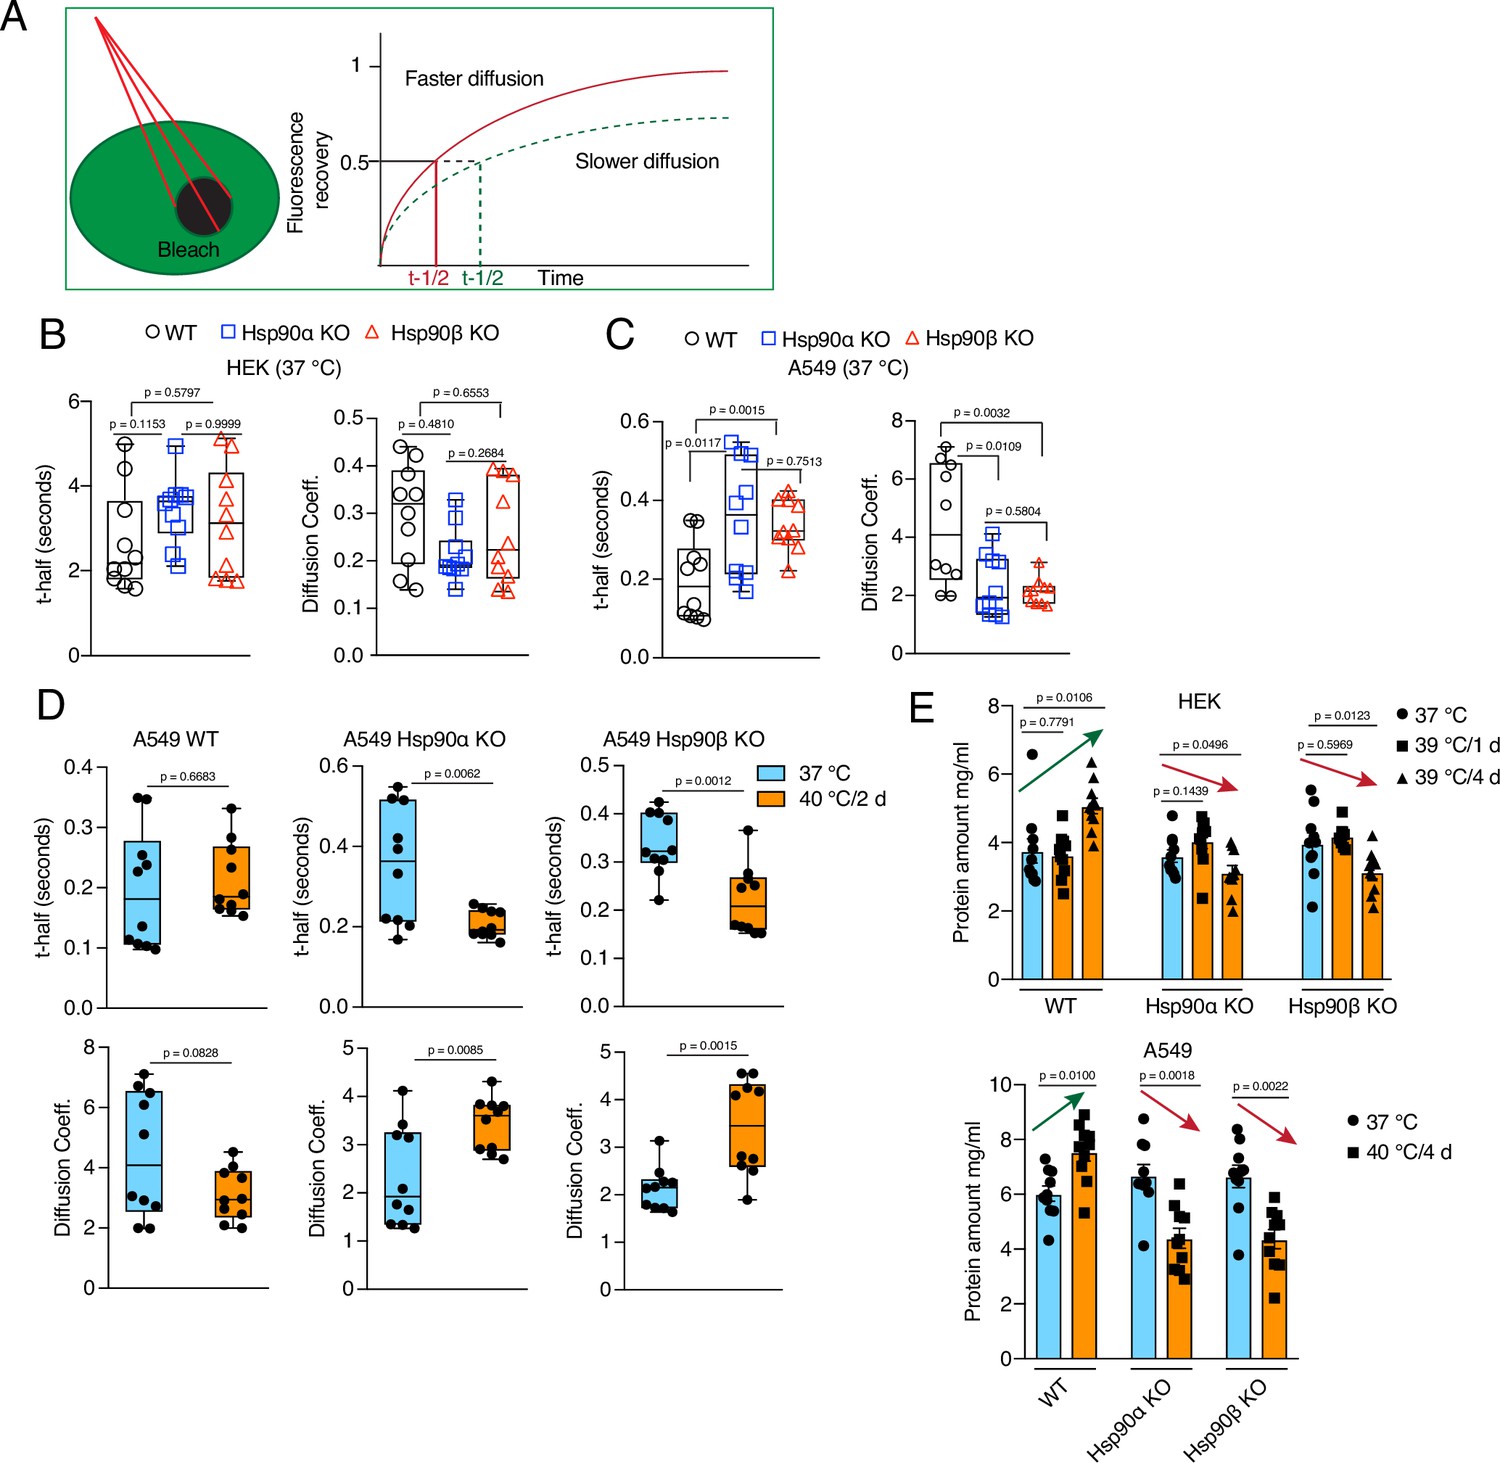
Wild-type cells maintain cytoplasmic density and total protein ratio during stress-induced cell size increase.
(A) Scheme of the FRAP experiments. (B to D) FRAP experiments with live cells expressing EGFP. The respective box plots represent the t-half values of recovery of EGFP fluorescence and the apparent EGFP diffusion coefficients (n=10 cells from two biologically independent experiments). (E) Protein amount in cell lysates (5000 cells lysed in 200 μl lysis buffer) of control cells and cells adapted to chronic HS as measured by Bradford assay.
-
Figure 5—figure supplement 1—source data 1
Values related to all graphs of Figure 5—figure supplement 1.
- https://cdn.elifesciences.org/articles/88658/elife-88658-fig5-figsupp1-data1-v2.xlsx
Figure 6 with 3 supplements
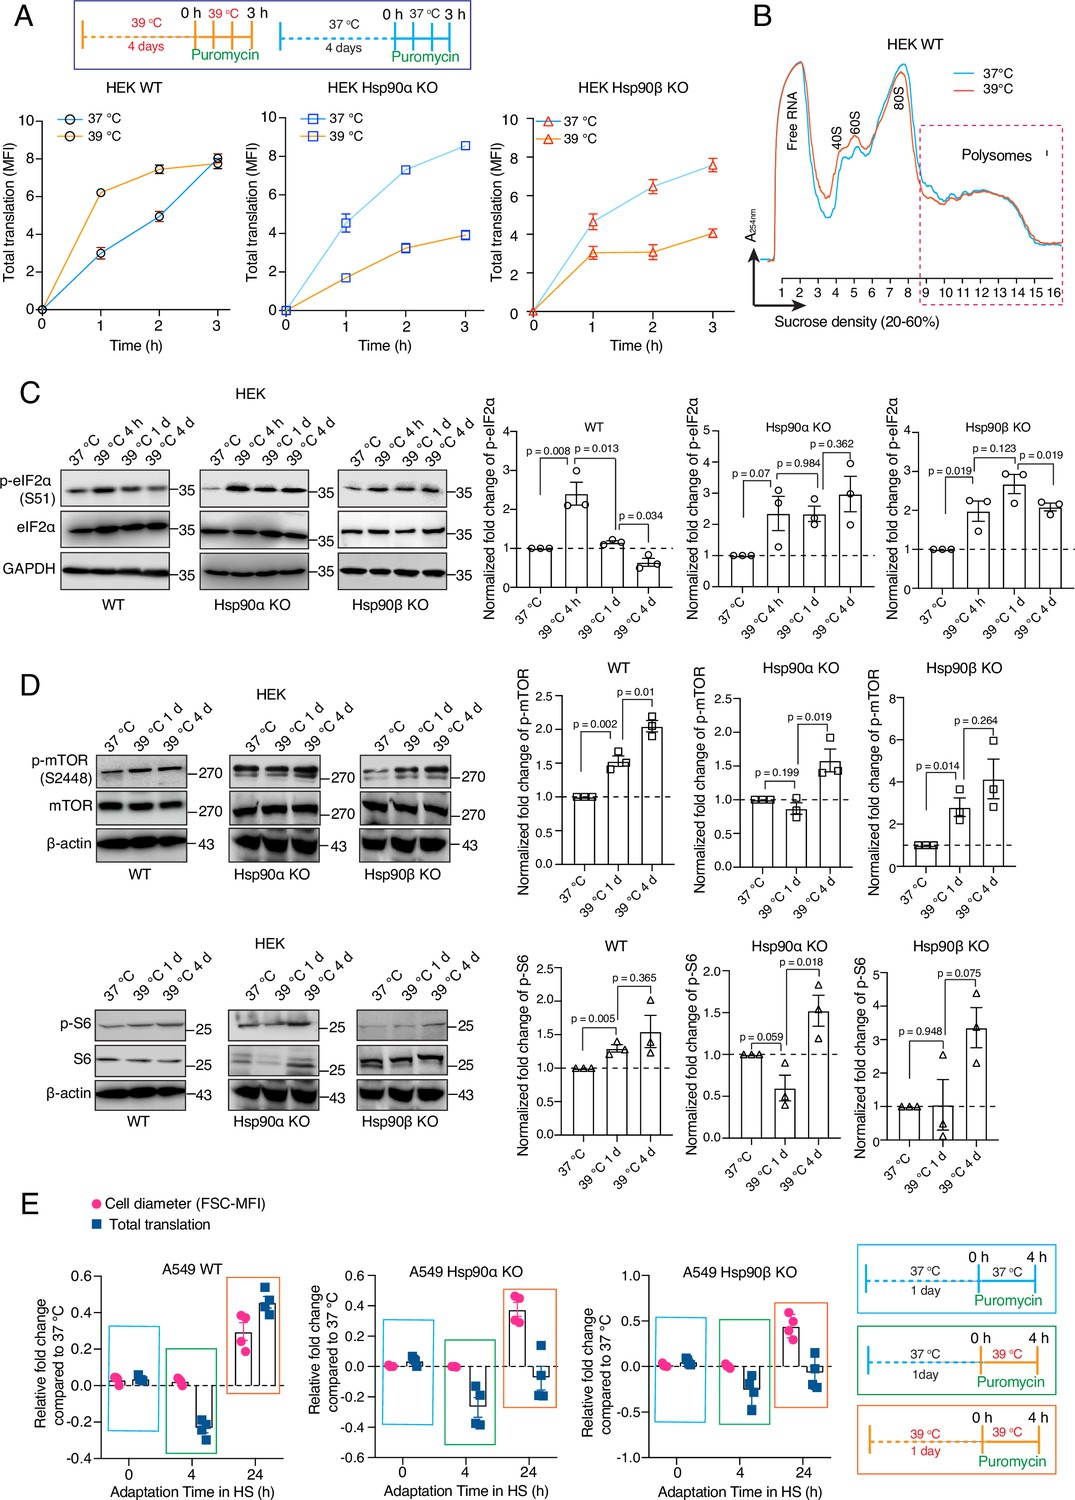
Hsp90 is crucial for adapting translation to chronic stress.
(A) Flow cytometric analysis of total translation of HEK WT and Hsp90α/β KO cells at 37 °C and after 4 days of chronic HS (see scheme of the experiment on the top). Nascent polypeptide chains were labeled with OP-puromycin during cell culture, and the incorporation of puromycin at different time points was analyzed (n=4 experimental samples). (B) Representative polysome profiles of HEK WT cells at 37 °C and after 4 days of chronic HS (representative of n=2 biologically independent experiments). (C and D) Immunoblots of the translation-related proteins eIF2α, mTOR, and S6. GAPDH and β-actin serve as loading controls. Note that the same β-actin immunoblot is used twice as internal loading control since the other immunoblots of panel D are from the same experiment. Representative immunoblots are shown, but the corresponding bar graphs on the right are based on the quantitation of three biological replicates. Values were normalized to the loading controls, and the phosphoproteins were normalized to their respective total protein. (E) Relative fold changes of total translation and cell size in the early phase of adaptation to chronic HS (see schemes of experiments on the right) for A549 WT and Hsp90α/β KO cells. The data are represented as mean values ± SEM for all bar graphs. The statistical significance between the groups was analyzed by two-tailed unpaired Student’s t-tests.
-
Figure 6—source data 1
Values related to all graphs.
- https://cdn.elifesciences.org/articles/88658/elife-88658-fig6-data1-v2.xlsx
-
Figure 6—source data 2
Raw and annotated immunoblots.
- https://cdn.elifesciences.org/articles/88658/elife-88658-fig6-data2-v2.zip
Figure 6—figure supplement 1
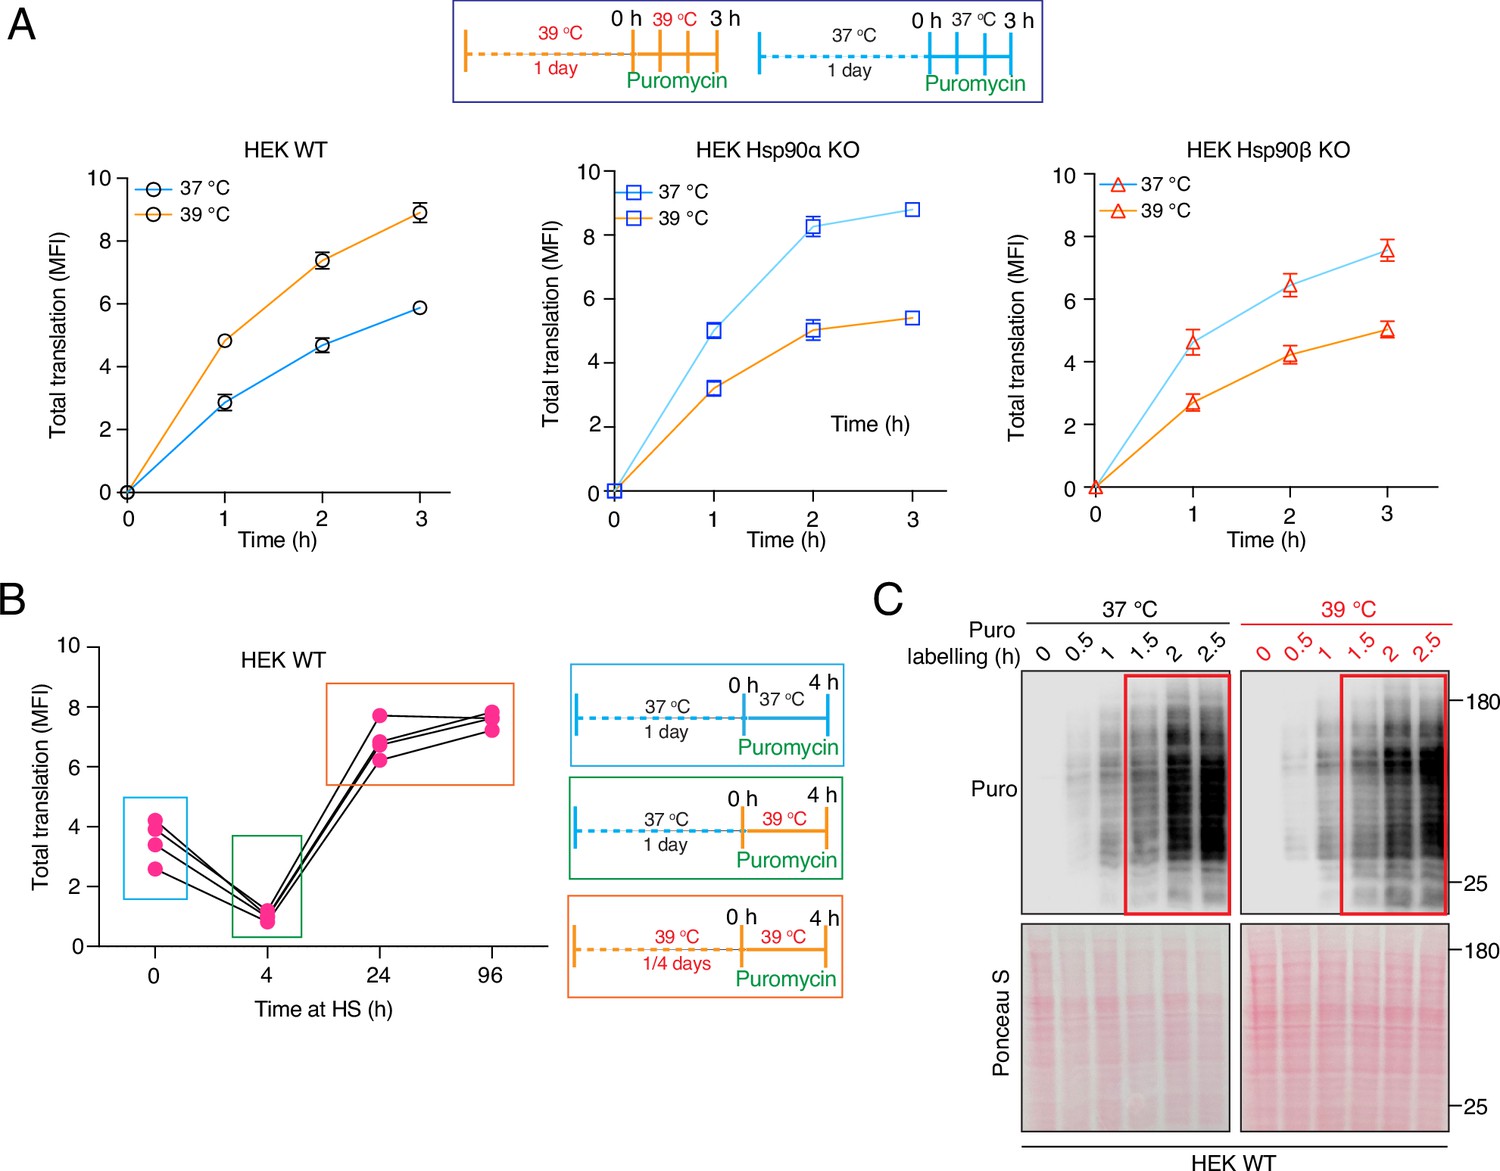
Hsp90 requirement for cellular translation during adaptation to chronic stress, and early time points of translational adaptation of wild-type cells.
(A) Flow cytometric analysis of global translation of HEK WT and Hsp90α/β KO cells at 37 °C and after 1 day under chronic HS. See scheme of the experiment on the top. Nascent polypeptide chains were labeled with OP-puromycin during cell culture, and the incorporation of puromycin at different time points was analyzed (n=4 experimental samples). (B) Total translation of HEK WT cells during a 4 hr time span during different phases of chronic HS. (C) Immunoblot analysis of global translation as indicated by incorporation of puromycin into nascent polypeptides during the first 2.5 hr of shifting cells to chronic HS conditions, compared to cells remaining at 37 °C. The 0 hr time point of puromycin labeling serves as a negative control, and the Ponceau S-stained nitrocellulose filter as loading control (representative images from n=2 biologically independent experiments).
-
Figure 6—figure supplement 1—source data 1
Values related to all graphs of Figure 6—figure supplement 1.
- https://cdn.elifesciences.org/articles/88658/elife-88658-fig6-figsupp1-data1-v2.xlsx
-
Figure 6—figure supplement 1—source data 2
Raw and annotated immunoblots of Figure 6—figure supplement 1.
- https://cdn.elifesciences.org/articles/88658/elife-88658-fig6-figsupp1-data2-v2.zip
Figure 6—figure supplement 2
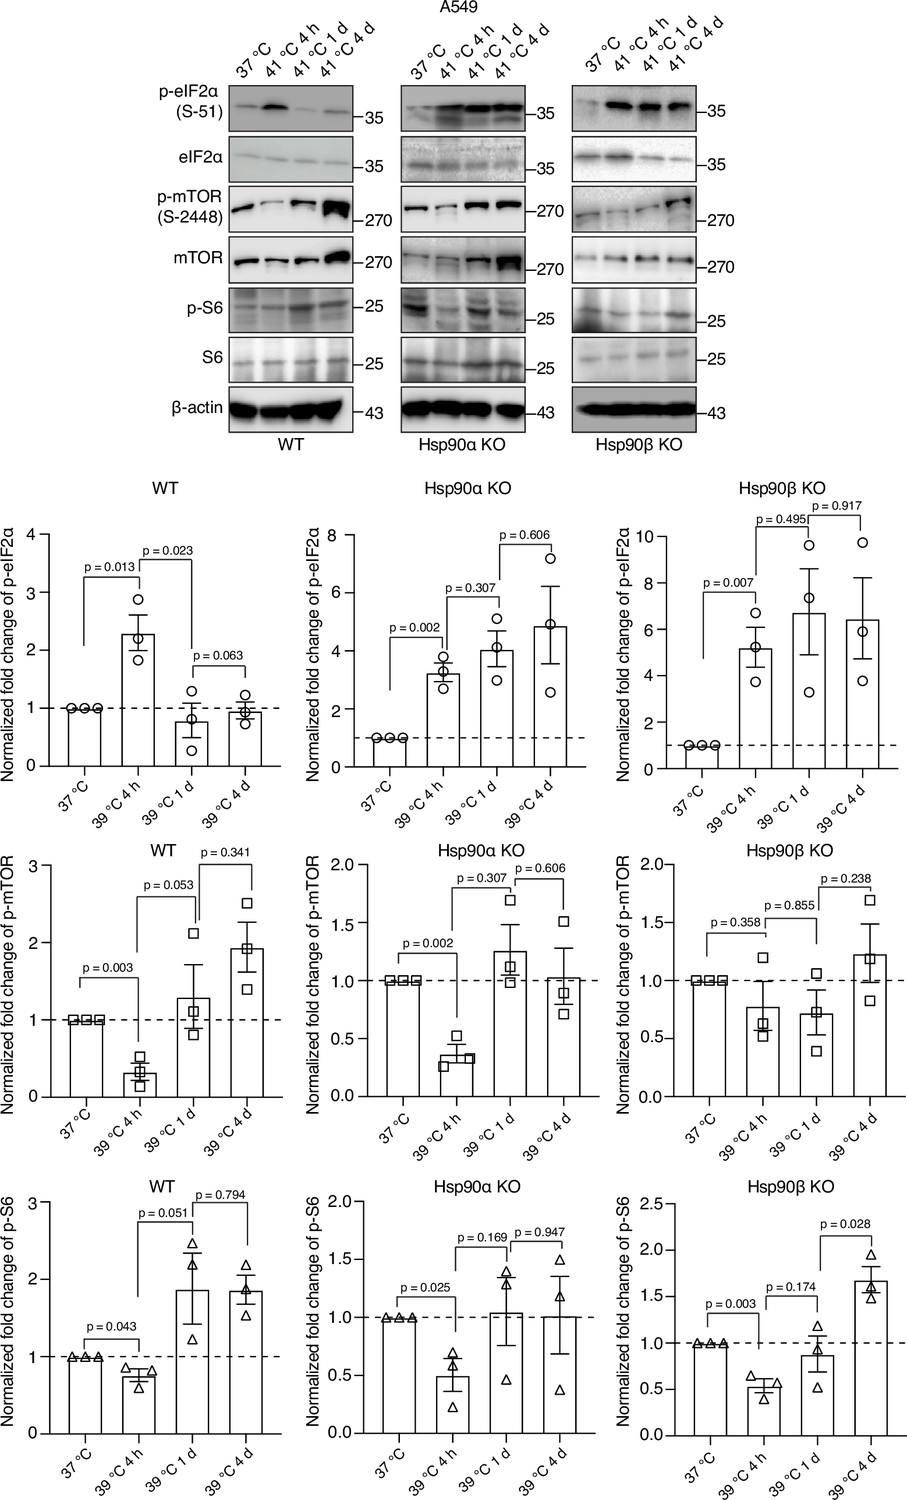
Differential effects of Hsp90 levels on eIF2α, mTOR, and S6.
Representative immunoblots of some translation-related proteins in A549 cells. β-actin serves as the loading control. The bar graphs show the quantitation of three biologically independent experiments, with densitometric scores determined from immunoblots. Values were normalized to the loading control β-actin. The phosphoproteins were normalized to the respective total proteins. The data are represented as mean values ± SEM. The statistical significance between the groups was analyzed by two-tailed unpaired Student’s t-tests.
-
Figure 6—figure supplement 2—source data 1
Raw and annotated immunoblots of Figure 6—figure supplement 2.
- https://cdn.elifesciences.org/articles/88658/elife-88658-fig6-figsupp2-data1-v2.zip
-
Figure 6—figure supplement 2—source data 2
Values related to all graphs of Figure 6—figure supplement 2.
- https://cdn.elifesciences.org/articles/88658/elife-88658-fig6-figsupp2-data2-v2.xlsx
Figure 6—figure supplement 3
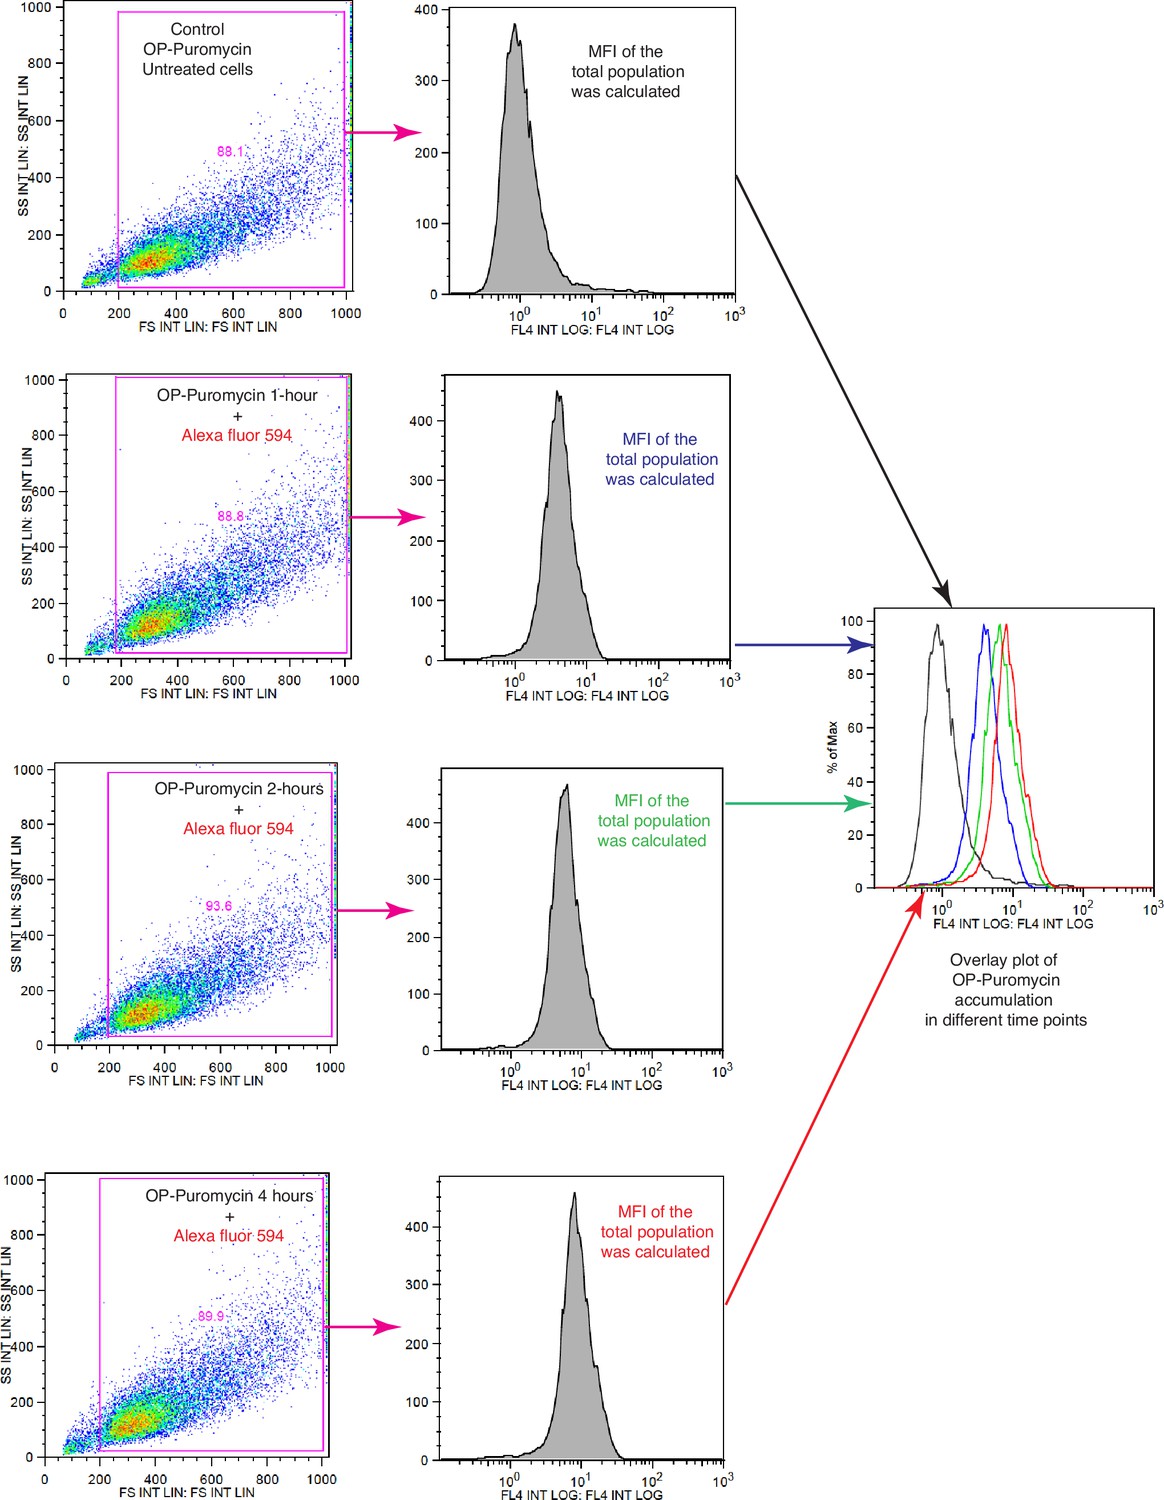
Schematic representation of the flow cytometric strategies to measure translation.
Relevant to Figure 6A and E and Figure 6—figure supplement 1A and B.
Figure 7 with 2 supplements
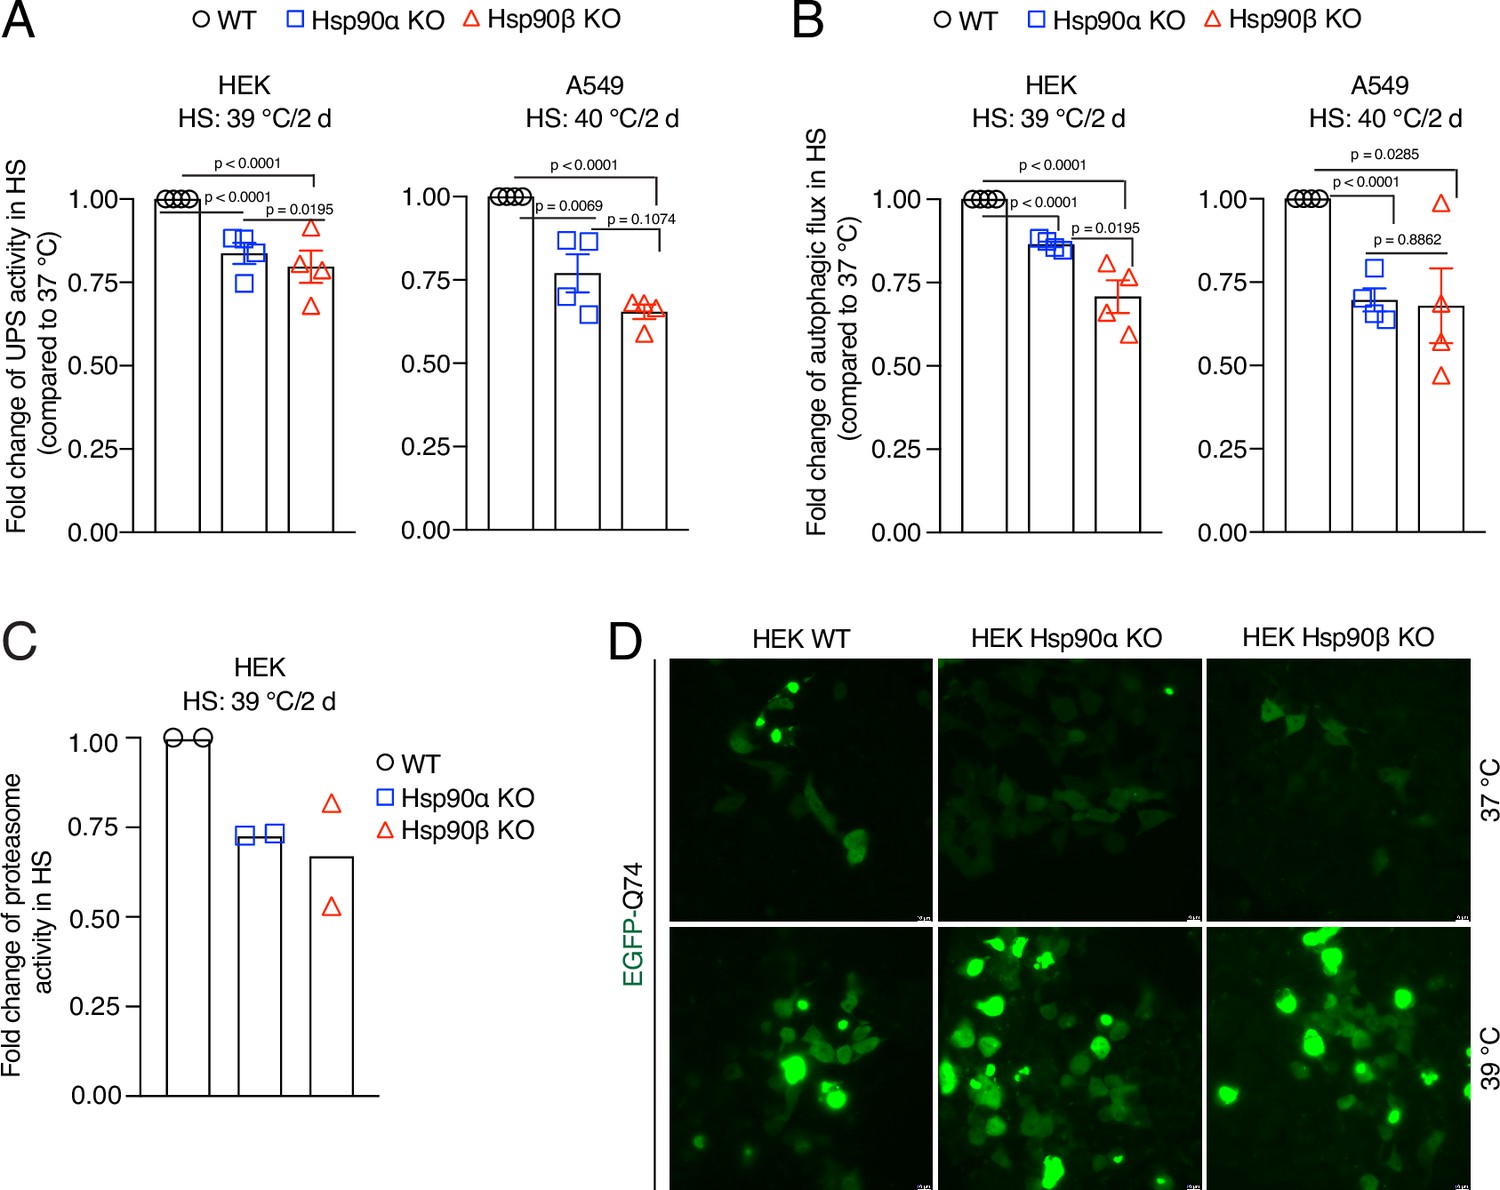
Hsp90 is crucial for cellular proteostasis during adaptation to chronic stress.
(A) Flow cytometric determination of the in vivo UPS activity in chronic HS compared to 37 °C, using the Ub-M-GFP and Ub-R-GFP reporter proteins (n=4 biologically independent samples). (B) Flow cytometric measurement of autophagic flux in chronic HS compared to 37 °C, using a mCherry-GFP-LC3 reporter. Flux is calculated as the ratio of the mean fluorescence intensities of mCherry and GFP-positive cells (n=4 biologically independent samples). (C) In vitro steady-state proteasomal activity with lysates of HEK WT, and Hsp90α and Hsp90β KO cells determined by measuring fluorescence of the cleaved substrate suc-LLVY-AMC (n=2 biologically independent samples). (D) Fluorescence micrographs of cells expressing the fusion protein EGFP-Q74 visible as aggregates with green fluorescence. The scale bars in the zoomable micrographs indicate 10 μm (images are representative of n=2 independent biological samples). The data are represented as mean values ± SEM for all bar graphs. The statistical significance between the groups was analyzed by two-tailed unpaired Student’s t-tests.
-
Figure 7—source data 1
Values related to all graphs.
- https://cdn.elifesciences.org/articles/88658/elife-88658-fig7-data1-v2.xlsx
Figure 7—figure supplement 1
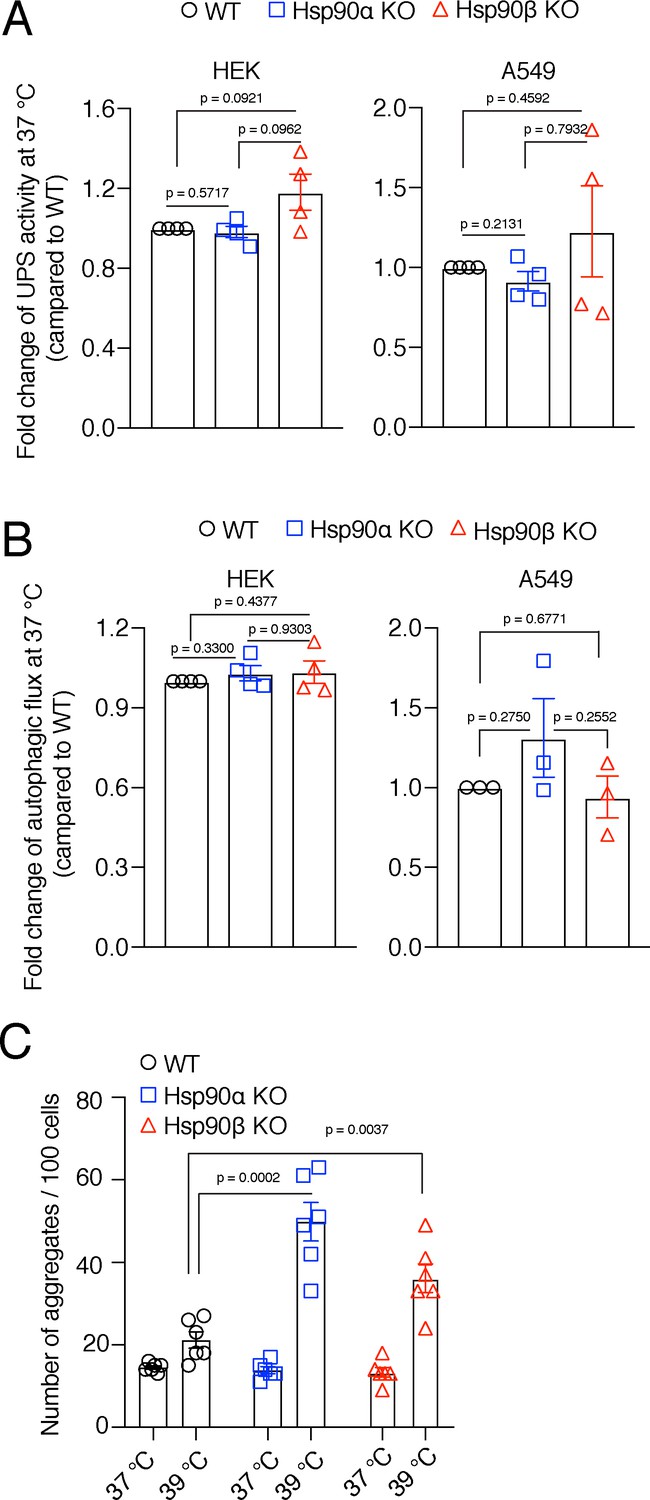
Hsp90α/β KO cells maintain WT levels of protein degradation activities in unstressed conditions, but have more protein aggregates.
(A) Flow cytometric determination of the in vivo UPS activity using the Ub-M-GFP and Ub-R-GFP reporter plasmids (n=4 biologically independent samples). (B) Flow cytometric measurement of autophagic flux using a mCherry-GFP-LC3 reporter. Flux is calculated as the ratio of the mean fluorescence intensities of mCherry and GFP-positive cells (n=4 biologically independent samples). (C) Quantitation of the number of EGFP-Q74 aggregates per 100 cells from representative micrographs such as the ones of Figure 7D. For each bar, data are from six different experiments, each normalized to 100 cells. The data are represented as mean values ± SEM for all bar graphs. The statistical significance between the groups was analyzed by two-tailed unpaired Student’s t-tests.
-
Figure 7—figure supplement 1—source data 1
Values related to all graphs of Figure 7—figure supplement 1.
- https://cdn.elifesciences.org/articles/88658/elife-88658-fig7-figsupp1-data1-v2.xlsx
Figure 7—figure supplement 2
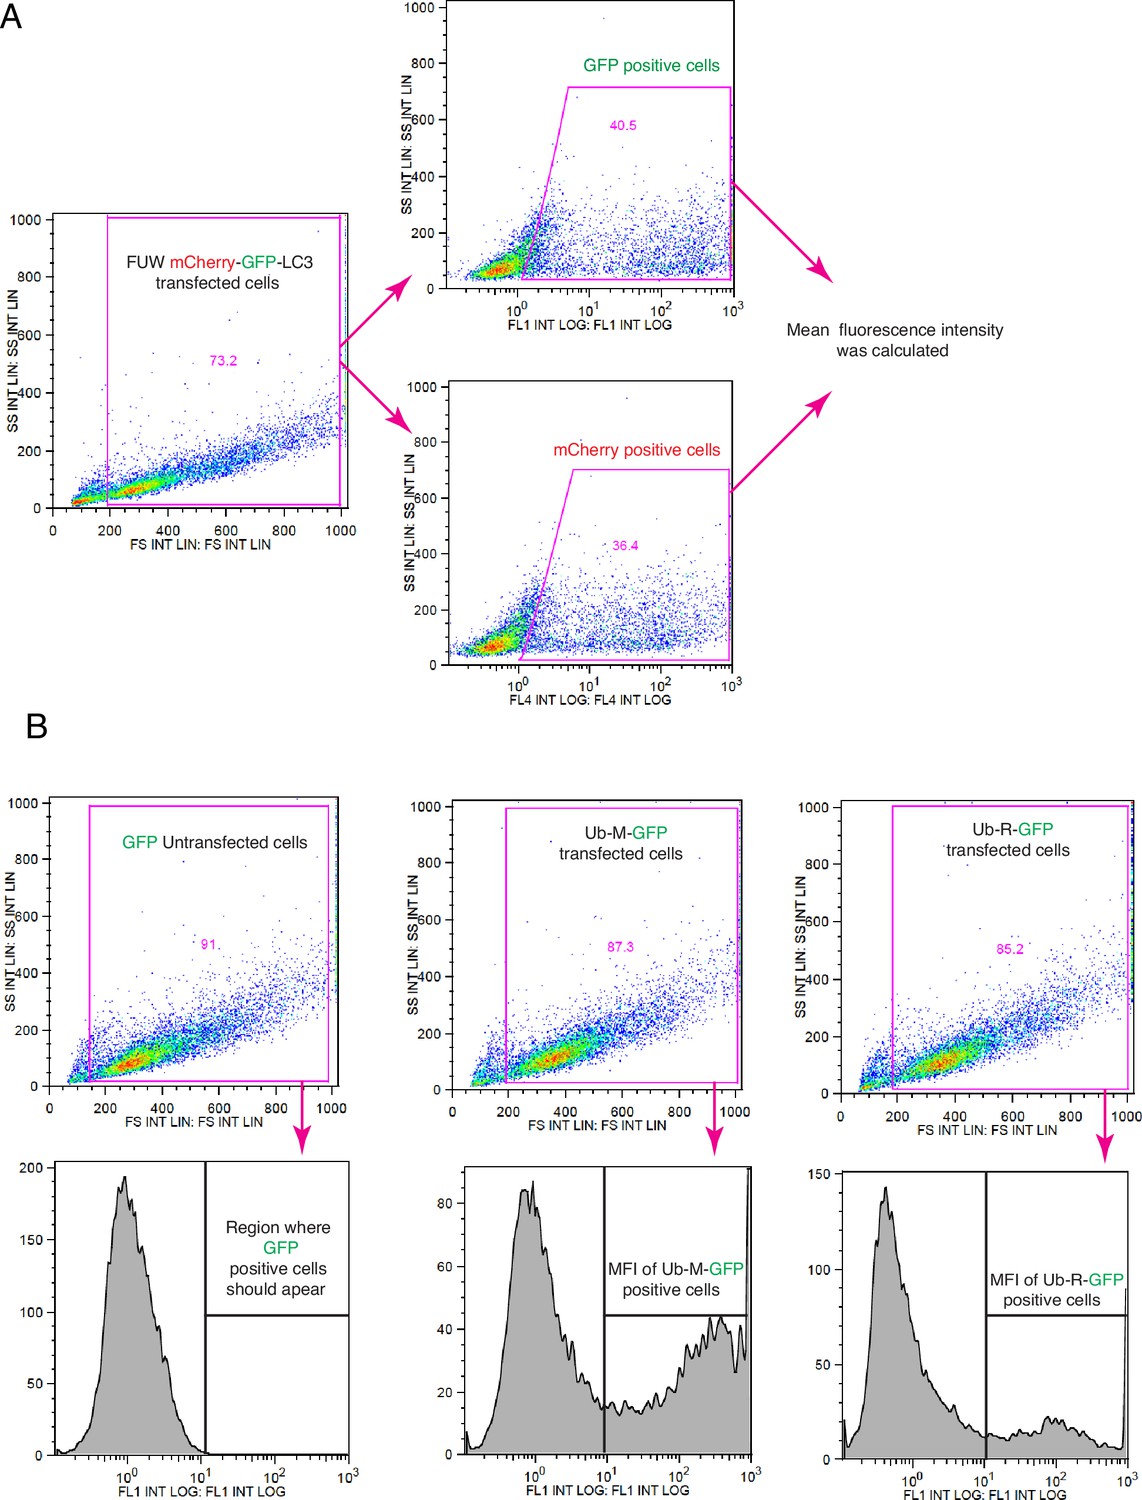
Schematic representation of the flow cytometric strategies for measuring autophagic flux and in vivo UPS activities.
(A) Gating strategy for autophagic flux measurements, relevant to Figure 7B and Figure 7—figure supplement 1B. (B) Gating strategy for measuring UPS activity; related to Figure 7A and Figure 7—figure supplement 1A.
Figure 8 with 1 supplement
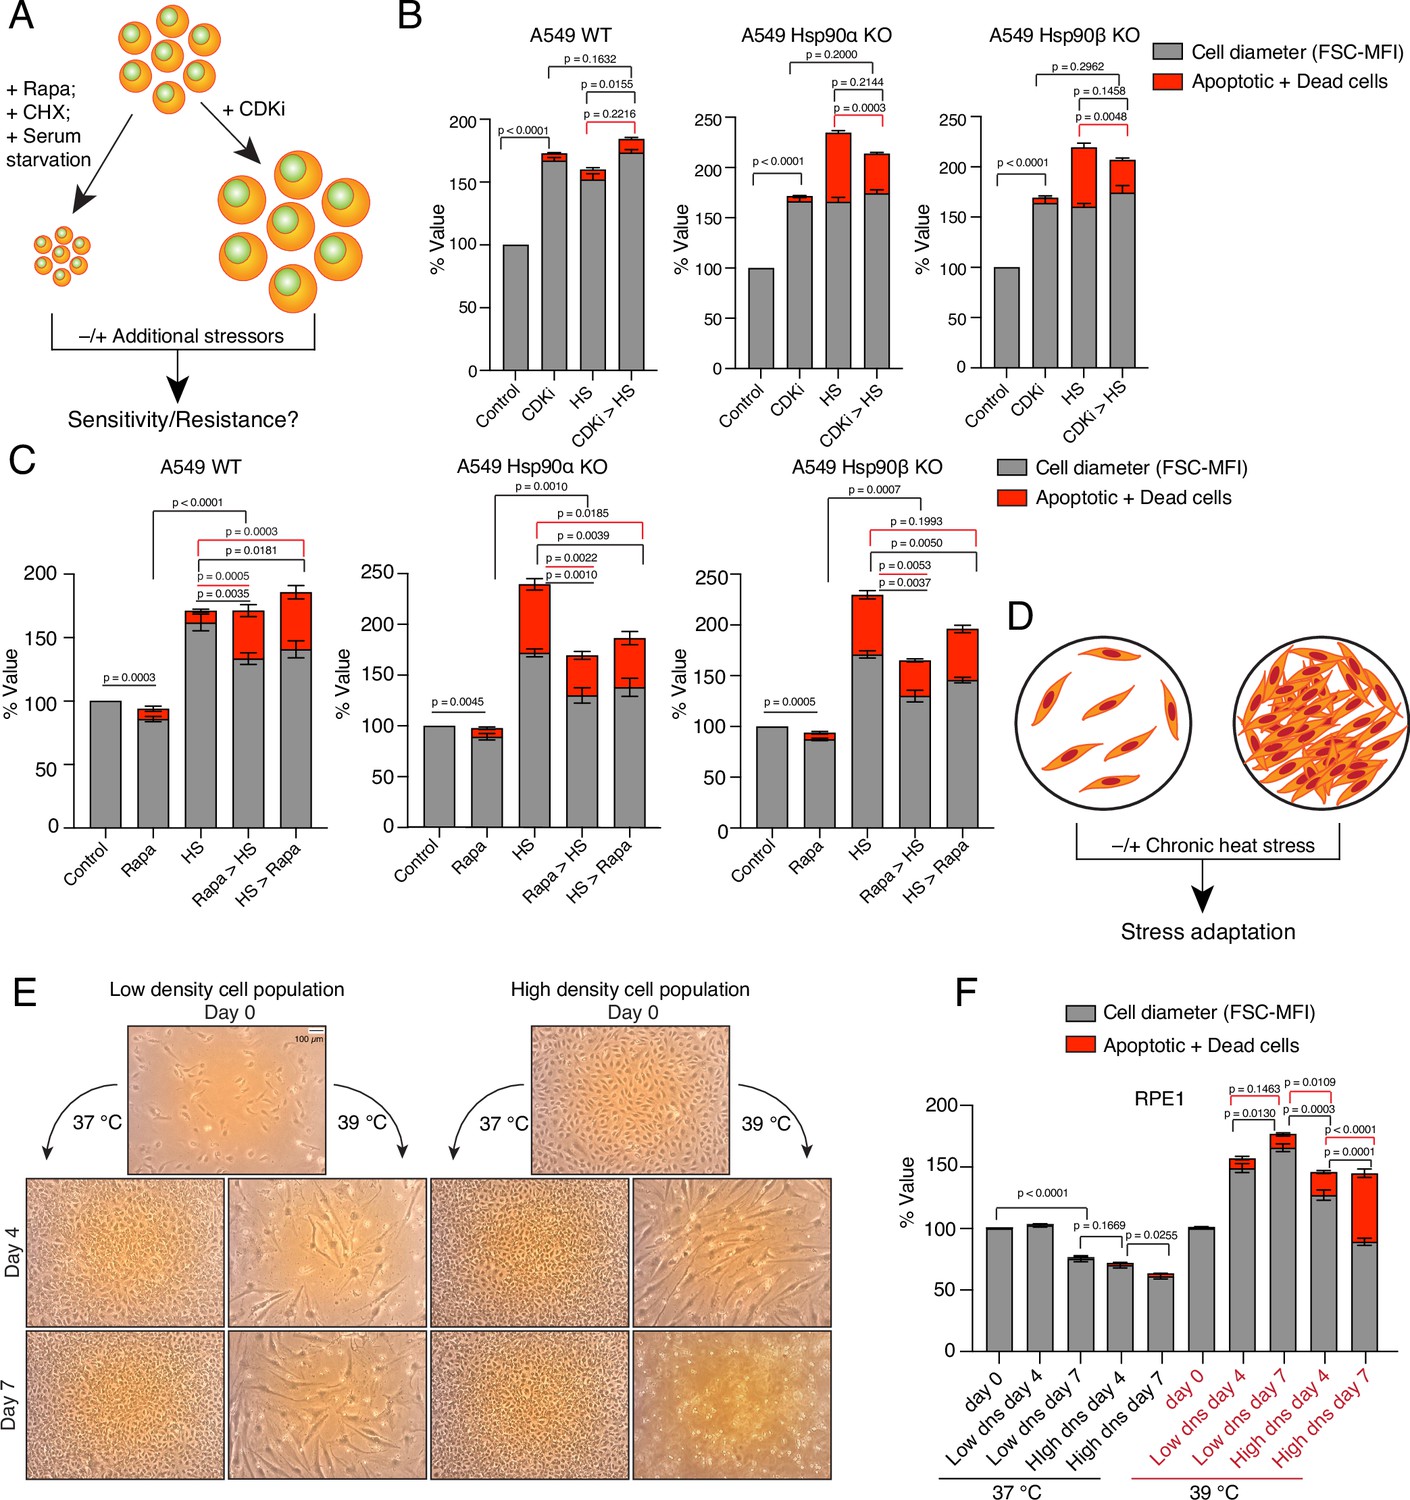
Enlarged cells are more resistant to additional stress.
(A) Scheme of cell size enlargement or reduction experiments. CHX, cycloheximide; CDKi, CDK4/6 inhibitor. (B) Cell size was first enlarged by treating cells with 100 nM CDKi for 3 days; then, cells were washed and subjected to chronic HS at 40 °C for 3 more days (CDKi >HS). Cell size (% FSC-MFI; grey part of the bars) and cell death (% annexin V and PI-positive; red part of the bars) were measured by flow cytometry. The values for cell size and death in the different experimental conditions are normalized to the respective 37 °C controls (n=3 biologically independent experiments). (C) Cells were first pretreated with 7.5 nM rapamycin (Rapa) for 3 days to reduce the cell size. After that, the cells were subjected to chronic HS at 40 °C for 3 days (Rapa >HS). HS >Rapa, the two treatments were done the other way around. The cell size (% FSC-MFI) and relative cell death (% annexin V and PI-positive) were quantified by flow cytometry. The values for cell size and death in different experimental conditions are normalized to the respective 37 °C control (n=3 biologically independent experiments). (D) Scheme of experiments aimed at determining impact of limiting physical space on cell size increase. (E and F) Phase-contrast micrographs of RPE1 cells seeded in different numbers to restrict the space for cell size increase during adaptation to chronic HS (representative images of n=4 biologically independent experiments). The size bar in the top left panel indicates 100 µM. The cell size (% FSC-MFI) and relative cell death (% annexin V-PI positive) are quantified by flow cytometry. For the bar graphs, the values for cell size and death in different conditions are normalized to the low density (dns) cell population at 37 °C day 0 (n=4 biologically independent experiments). The data are represented as mean values ± SEM for all bar graphs. The statistical significance between the groups was analyzed by two-tailed unpaired Student’s t-tests.
-
Figure 8—source data 1
Values related to all graphs.
- https://cdn.elifesciences.org/articles/88658/elife-88658-fig8-data1-v2.xlsx
Figure 8—figure supplement 1
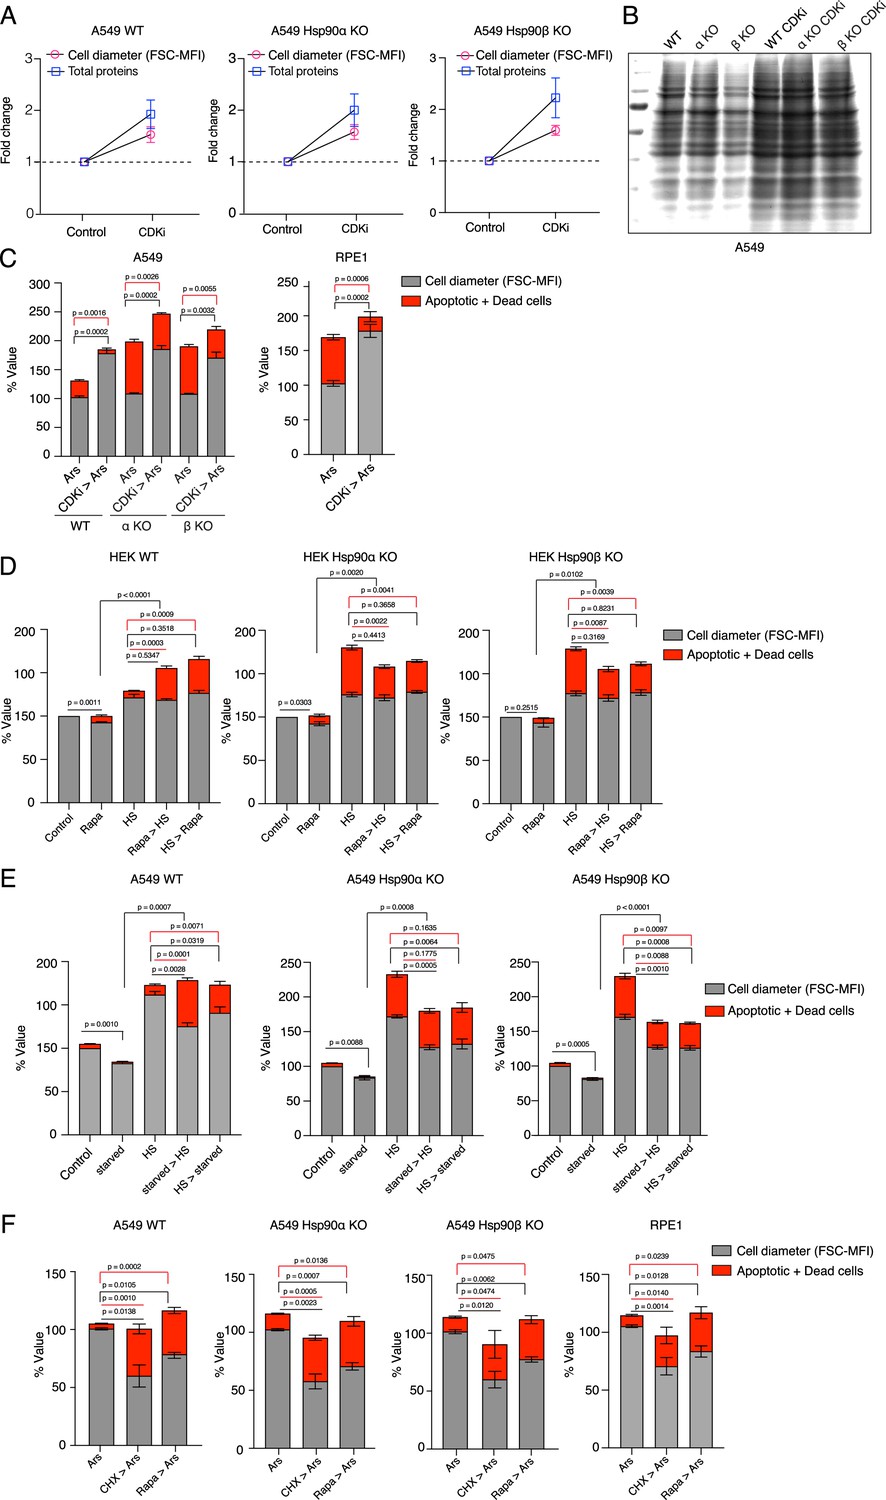
Smaller cells are more susceptible to additional stress.
(A) Cell size was enlarged by treating cells with 100 nM CDKi for 3 days. Fold change of cell size (represented by the FSC-MFI values) and total proteins (determined as MFI-FL1 values) were analyzed by flow cytometry. Cells were fixed, and total proteins were stained using Alexa Fluor 488 NHS ester (n=3 biologically independent experiments). (B) Coomassie-stained protein gel showing protein samples from equal numbers of cells treated or not with CDKi (representative images of n=2 biologically independent experiments). (C) Cell size was enlarged by treating cells with CDKi for 3 days, before cells were treated with sodium arsenite (40 μM) for 3 days. Cell size (% MFI) and cell death (% annexin V and PI-positive) are measured by flow cytometry. α KO, Hsp90α KO; β KO, Hsp90β KO cells. (D) Order of treatment experiment as in Figure 8C, but with HEK cells. Cell size (% MFI) and relative cell death (% annexin V and PI-positive) are quantified by flow cytometry. The values for cell size and death in the different experimental conditions are normalized to the respective 37 °C controls (n=3 biologically independent experiments). (E) Cell size was reduced by serum starvation (starved) for 3 days before subjecting cells to chronic HS for 3 additional days (starved >HS). HS >starved, the two treatments were done the other way around (HS >starved). Cell size (% MFI) and relative cell death (% annexin V-PI positive) were quantified by flow cytometry and normalized to the respective 37 °C controls (n=3 experimental samples). (F) Order of treatment experiment with CHX and rapamycin to reduce cell size first for 3 days and then subjecting cells to oxidative stress with 10 µM sodium arsenite (Ars) for 1 day. Cell size (% MFI) and relative cell death (% annexin V and PI-positive) were quantified by flow cytometry and normalized to the Ars single treatment controls (n=3 experimental samples).
-
Figure 8—figure supplement 1—source data 1
Values related to all graphs of Figure 8—figure supplement 1.
- https://cdn.elifesciences.org/articles/88658/elife-88658-fig8-figsupp1-data1-v2.xlsx
Figure 9
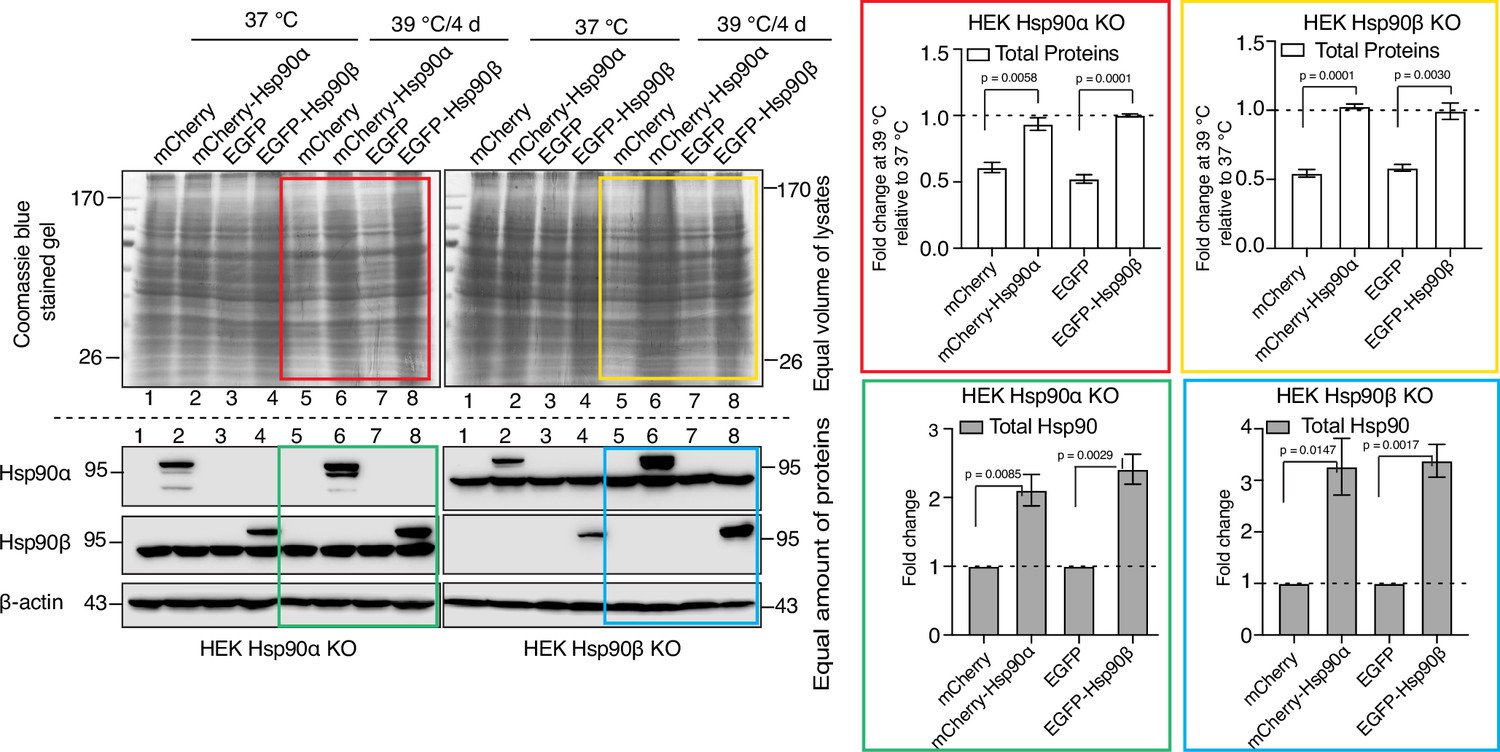
Adaptation to chronic stress requires cytosolic Hsp90 above a threshold level.
Immunoblots in the lower panels show the endogenous Hsp90α and Hsp90β, and the exogenously overexpressed larger fusion proteins of Hsp90α (as mCherry-Hsp90α) and Hsp90β (as EGFP-Hsp90β). Images of the Coomassie-stained gels in the upper panels show the corresponding levels of total proteins. Colored boxes indicate lanes for samples from cells subjected to chronic HS. The bar graphs on the right show the corresponding quantitation of three biologically independent experiments, with the colored rectangles using the same color code as the rectangles over the immunoblots on the left. The band densities of all blots were normalized to the loading controls. The data are represented as mean values ± SEM. The statistical significance between the groups was analyzed by two-tailed unpaired Student’s t-tests.
-
Figure 9—source data 1
Raw and annotated immunoblots.
- https://cdn.elifesciences.org/articles/88658/elife-88658-fig9-data1-v2.zip
-
Figure 9—source data 2
Values related to all graphs.
- https://cdn.elifesciences.org/articles/88658/elife-88658-fig9-data2-v2.xlsx
Figure 10
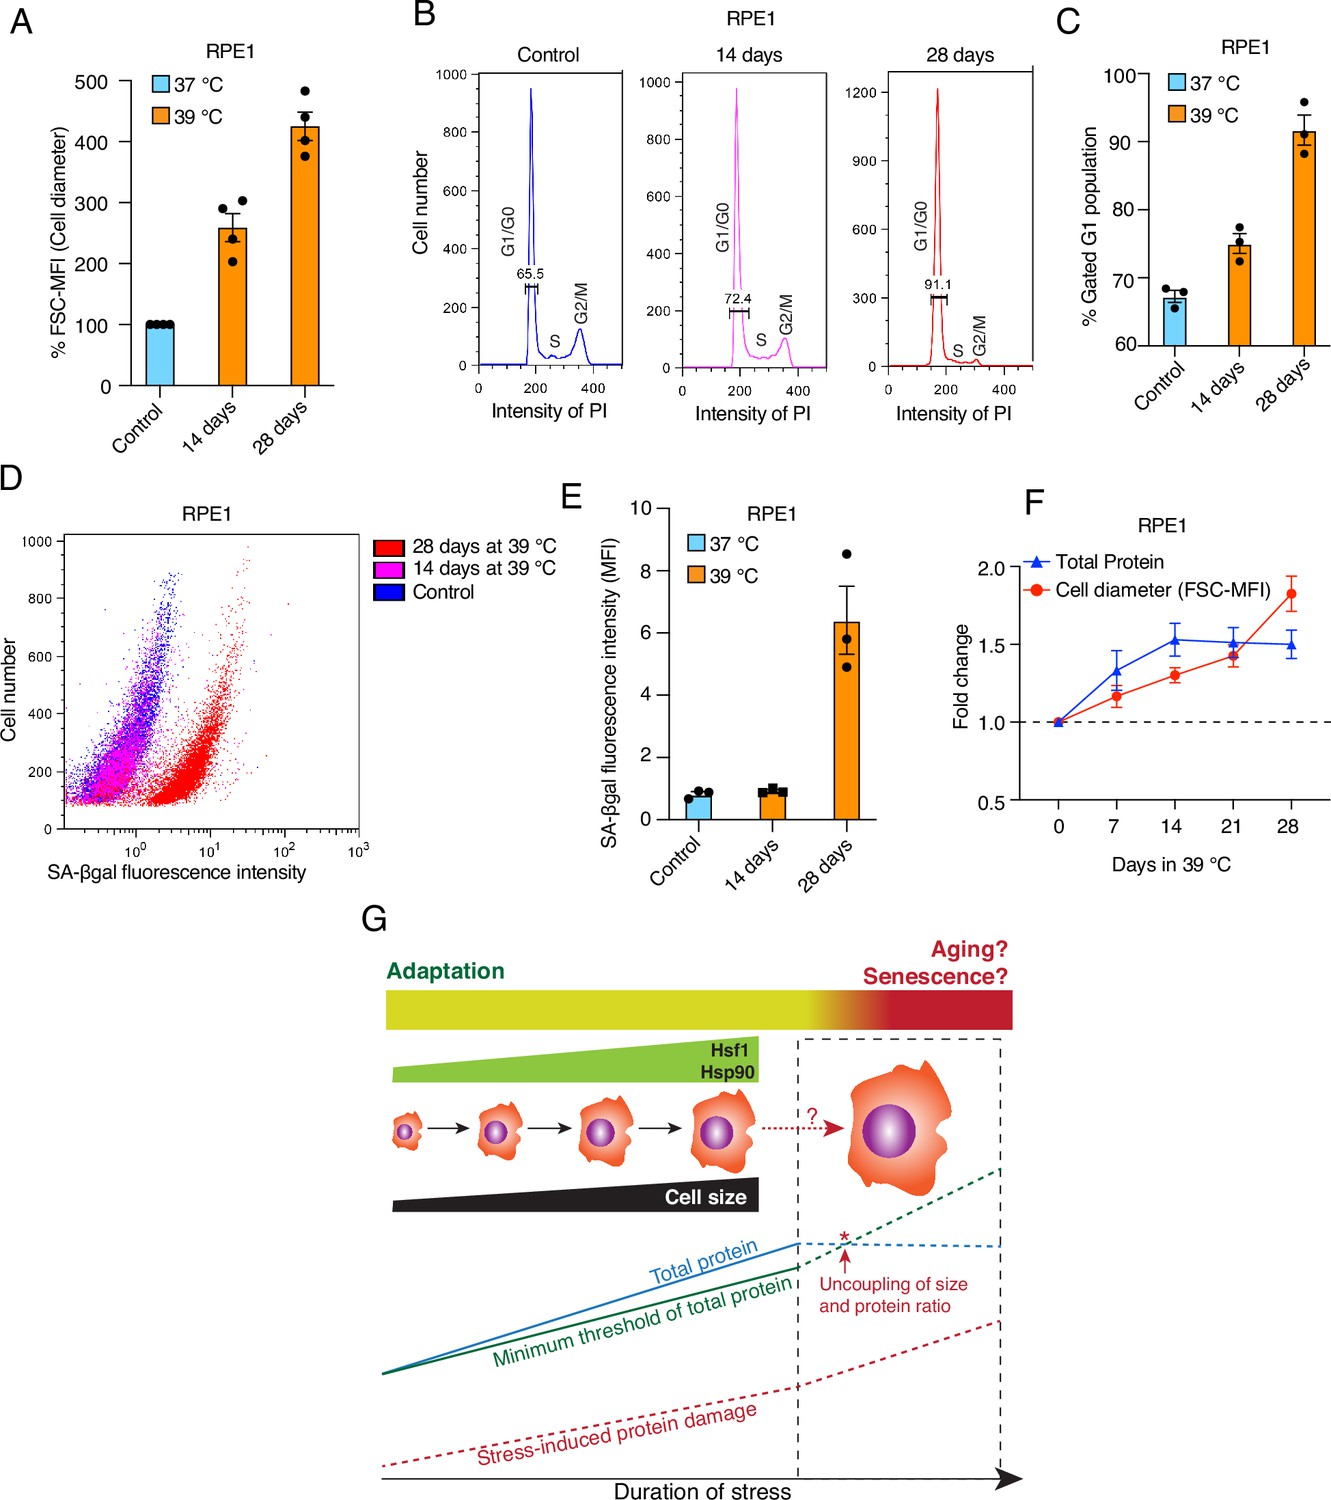
Prolonged mild chronic stress triggers excessively bigger cell size and senescence.
(A) Flow cytometric quantification of cell size of RPE1 cells exposed to prolonged mild HS (n = 4 biologically independent samples). (B) Histograms representing the cell cycle distribution of RPE1 cells exposed to prolonged mild HS as indicated, as determined by flow cytometry. (C) Quantitation of flow cytometric analyses of the cell cycle (n=3 biologically independent samples). (D) Dot plot representing numbers of cells as a function of SA-βgal staining analyzed by flow cytometry. (E) Bar graph showing the mean fluorescent intensities of three biologically independent SA-βgal staining experiments of the type shown in panel D. (F) Fold change of cell size (represented by the FSC-MFI values) and total proteins (determined as MFI-FL1 values) in prolonged chronic HS, as analyzed by flow cytometry. Cells were fixed, and total proteins were stained using Alexa Fluor 488 NHS ester (n=3 biologically independent experiments). Lines connecting the data points are solely drawn as a visual aid. Note that the quantitative differences of cell size increases between panels A and F may be due to technical differences (live cell versus fixed cell analyses, respectively; see Materials and Methods for further details). (G) Schematic representation of the impact of chronic mild stress on cells. Wild-type cells initially adapt by enlarging their size and increasing total protein to maintain a minimum threshold level of functional proteins. The right part of the scheme (surrounded by a stippled box), shows what happens if stress persists for much longer: cell size enlargement and total amount of proteins are uncoupled, and because of protein damage, which continues to accumulate, cells become senescent and/or die. The data for all the bar graphs are represented as mean values ± SEM.
-
Figure 10—source data 1
Values related to all graphs.
- https://cdn.elifesciences.org/articles/88658/elife-88658-fig10-data1-v2.xlsx
Tables
Key resources table
| Reagent type (species) or resource | Designation | Source or reference | Identifiers | Additional information |
|---|---|---|---|---|
| Cell line (Homo-sapiens) | HEK293, Human embryonic kidney cells | ATCC | CRL-3216 | corresponding Hsp90α/β KO cell lines were generated |
| Cell line (Homo-sapiens) | A549, human lung epithelial carcinoma cells | ATCC | CCL-185 | corresponding Hsp90α/β KO cell lines were generated |
| Cell line (Homo-sapiens) | RPE1, human retinal epithelial cells | ATCC | CRL-4000 | |
| Cell line (Homo-sapiens) | HCT116, human colon carcinoma Cells | ATCC | CCL-247 | |
| Cell line (Mus musculus) | Mouse adult fibroblasts (MAFs) | Bhattacharya et al., 2022 | ||
| Recombinant DNA reagent | pcDNA-Flag HSF1 wt (plasmid) | a gift from Len Neckers (Kijima et al., 2018) | transient overexpression of WT Hsf1 | |
| Recombinant DNA reagent | pcDNA-Flag HSF1 C205 (plasmid) | a gift from Len Neckers (Kijima et al., 2018) | This express the Hsf1 mutant comprising only the N-terminal 205 amino acids | |
| Recombinant DNA reagent | pcDNA3.1(+) (plasmid) | Thermo Fisher Scientific | #V79020 | |
| Recombinant DNA reagent | pCherry.90α (plasmid) | Picard et al., 2006 | transient overexpression of Hsp90α | |
| Recombinant DNA reagent | pEGFP.90β (plasmid) | Picard et al., 2006 | transient overexpression of Hsp90β | |
| Recombinant DNA reagent | pmCherry-C1 (plasmid) | Picard et al., 2006 | Control for pCherry.90α | |
| Recombinant DNA reagent | pEGFP-C1 (plasmid) | Clontech | #6084–1 | |
| Recombinant DNA reagent | FUW mCherry-GFP-LC3 (plasmid) | a gift from Anne Brunet (Leeman et al., 2018) | Addgene #110060 | autophagy reporter plasmid |
| Recombinant DNA reagent | Ub-M-GFP (plasmid) and Ub-R-GFP (plasmid) | a gift from Nico Dantuma (Dantuma et al., 2000) | Addgene #11938 and #11939 | |
| Recombinant DNA reagent | HSE (WT)-Luc (plasmid) | a gift from Ueli Schibler (Reinke et al., 2008) | Hsf1 reporter plasmid | |
| Recombinant DNA reagent | pEGFP-Q74 (plasmid) | a gift from David Rubinsztein (Narain et al., 1999) | Addgene # 40261 | |
| Recombinant DNA reagent | pRL-CMV (plasmid) | Promega | #E2261 | |
| Recombinant DNA reagent | pSpCas9(BB)–2A-Puro (PX459) (plasmid) | a gift from Feng Zhang (Ran et al., 2013) | Addgene #48139 | |
| Recombinant DNA reagent | pGL3-CMV.Luc (plasmid) | a gift from Laurent Guillemot (University of Geneva) | ||
| Sequence-based reagent | shHSF1-1 | This paper, from Microsynth | HSF1 shRNA 3UTR forward | 5'-CCG GGC AGG TTG TTC ATA GTC AGA ACT CGA GTT CTG ACT ATG AAC AAC CTG CTT TTT G-3' |
| Sequence-based reagent | shHSF1-1 | This paper, from Microsynth | HSF1 shRNA 3UTR reverse | 5'-AAT TCA AAA AGC AGG TTG TTC ATA GTC AGA ACT CGA GTT CTG ACT ATG AAC AAC CTG C-3' |
| Sequence-based reagent | shHSF1-2 | This paper, from Microsynth | HSF1 shRNA CDS forward | 5'-CCG GCC AGC AAC AGA AAG TCG TCA ACT CGA GTT GAC GAC TTT CTG TTG CTG GTT TTT G-3' |
| Sequence-based reagent | shHSF1-2 | This paper, from Microsynth | HSF1 shRNA CDS reverse | 5'-AAT TCA AAA ACC AGC AAC AGA AAG TCG TCA ACT CGA GTT GAC GAC TTT CTG TTG CTG G-3' |
| Chemical compound | L-azetidine-2-carboxylic acid (AZC) | Sigma-Aldrich | #P8783 | |
| Chemical compound | Tunicamycin | Cell Signalling | #12819 | |
| Chemical compound | Propidium iodide (PI) | Cayman Chemical | #14289–10 | |
| Chemical compound | Annexin V | Biolegend | #640906 | |
| Chemical compound | Phalloidin-Alexa488 | Thermo Fisher Scientific | #A12379 | |
| Chemical compound | Diamidino-2-phenylindole dye (DAPI) | Thermo Fisher Scientific | #62248 | 1:30,000 in PBS, from 1 mg/ml stock solution |
| Chemical compound, drug | Abemaciclib | MedChemExpress | #HY-16297A-5MG | |
| Chemical compound, drug | Rapamycin | Sigma-Aldrich | #553210 | |
| Commercial assay, kit | Dual-Luciferase detection kit | Promega | #E1910 | |
| Commercial assay, kit | Alexa Fluor 488 NHS Ester (succinimidyl ester) | Thermo Fisher Scientific | #A20100 | |
| Commercial assay, kit | Click-iT Plus OPP Alexa Fluor 594 | Thermo Fisher Scientific | #C10457 | |
| Commercial assay, kit | N-succinyl-Leu-Leu-Val-Tyr-7-amino-4-methyl-coumarin (suc-LLVY-AMC) | Enzo Life Sciences | #BML-P802-0005 | |
| Commercial assay, kit | CellEvent Senescence Green Flow Cytometry Assay Kit | Invitrogen | #C10840 | |
| Antibody | Anti-GAPDH (Mouse monoclonal) | HyTest Ltd. | 5G4 | 1:1000 |
| Antibody | Anti-Hsp25/27 (Mouse monoclonal) | StressMarq | SMC-114 | 1:1000 |
| Antibody | Anti-puromycin (Mouse monoclonal) | Sigma-Aldrich | MABE343 | 1:22000 |
| Antibody | Anti-Lamin B1 (Rabbit polyclonal) | Cell Signaling Technology | 12586 | 1:1000 |
| Antibody | Anti-Hsp40/Hdj1 (Rabbit polyclonal) | Enzo Lifesciences | ADI-SPA-400 | 1:1000 |
| Antibody | Anti-Hsf1 (Rabbit polyclonal) | Enzo Lifesciences | ADI-SPA-901 | 1:1000 |
| Antibody | Anti-Hsp70 (Mouse monoclonal) | StressMarq | SMC-100 | 1:1000 |
| Antibody | Anti-Phospho-eIF2α (Ser51) (Rabbit polyclonal) | Cell Signaling Technology | 3597 | 1:1000 |
| Antibody | Anti-eIF2α (Rabbit polyclonal) | Cell Signaling Technology | 9722 | 1:1000 |
| Antibody | Anti-Hsp90α (9D2) (Rat monoclonal) | Enzo Lifesciences | ADI-SPA-840 | 1:1000 |
| Antibody | Anti-Hsp90β (scFv H90-10) (Mouse monoclonal) | Geneva Antibody Facility | ABCD_A0870 | 1:2000 |
| Antibody | Anti-mTOR (Rabbit polyclonal) | Cell Signaling Technology | 2983 | 1:2000 |
| Antibody | Anti-Phospho-mTOR (Ser2448) (Rabbit polyclonal) | Cell Signaling Technology | 2971 | 1:1000 |
| Antibody | Anti-Phospho-S6 Ribosomal Protein (Ser235/236) (Rabbit polyclonal) | Cell Signaling Technology | 4858 | 1:1000 |
| Antibody | Anti-S6 Ribosomal Protein (Rabbit polyclonal) | GeneTex | GTX130450 | 1:1000 |
| Antibody | Anti-Hsc70 (Mouse monoclonal) | StressMarq | SMC-151 | 1:2000 |
Additional files
Download links
A two-part list of links to download the article, or parts of the article, in various formats.
Downloads (link to download the article as PDF)
Open citations (links to open the citations from this article in various online reference manager services)
Cite this article (links to download the citations from this article in formats compatible with various reference manager tools)
Hsf1 and the molecular chaperone Hsp90 support a ‘rewiring stress response’ leading to an adaptive cell size increase in chronic stress
eLife 12:RP88658.
https://doi.org/10.7554/eLife.88658.3


