I-Spin live, an open-source software based on blind-source separation for real-time decoding of motor unit activity in humans
- Nantes Université, Laboratory “Movement, Interactions, Performance” (UR 4334), France
- Université Côte d'Azur, LAMHESS, France
- The University of Queensland, School of Biomedical Sciences, Australia
- Department of Bioengineering, Faculty of Engineering, Imperial College London, United Kingdom
Figures
Figure 1 with 1 supplement
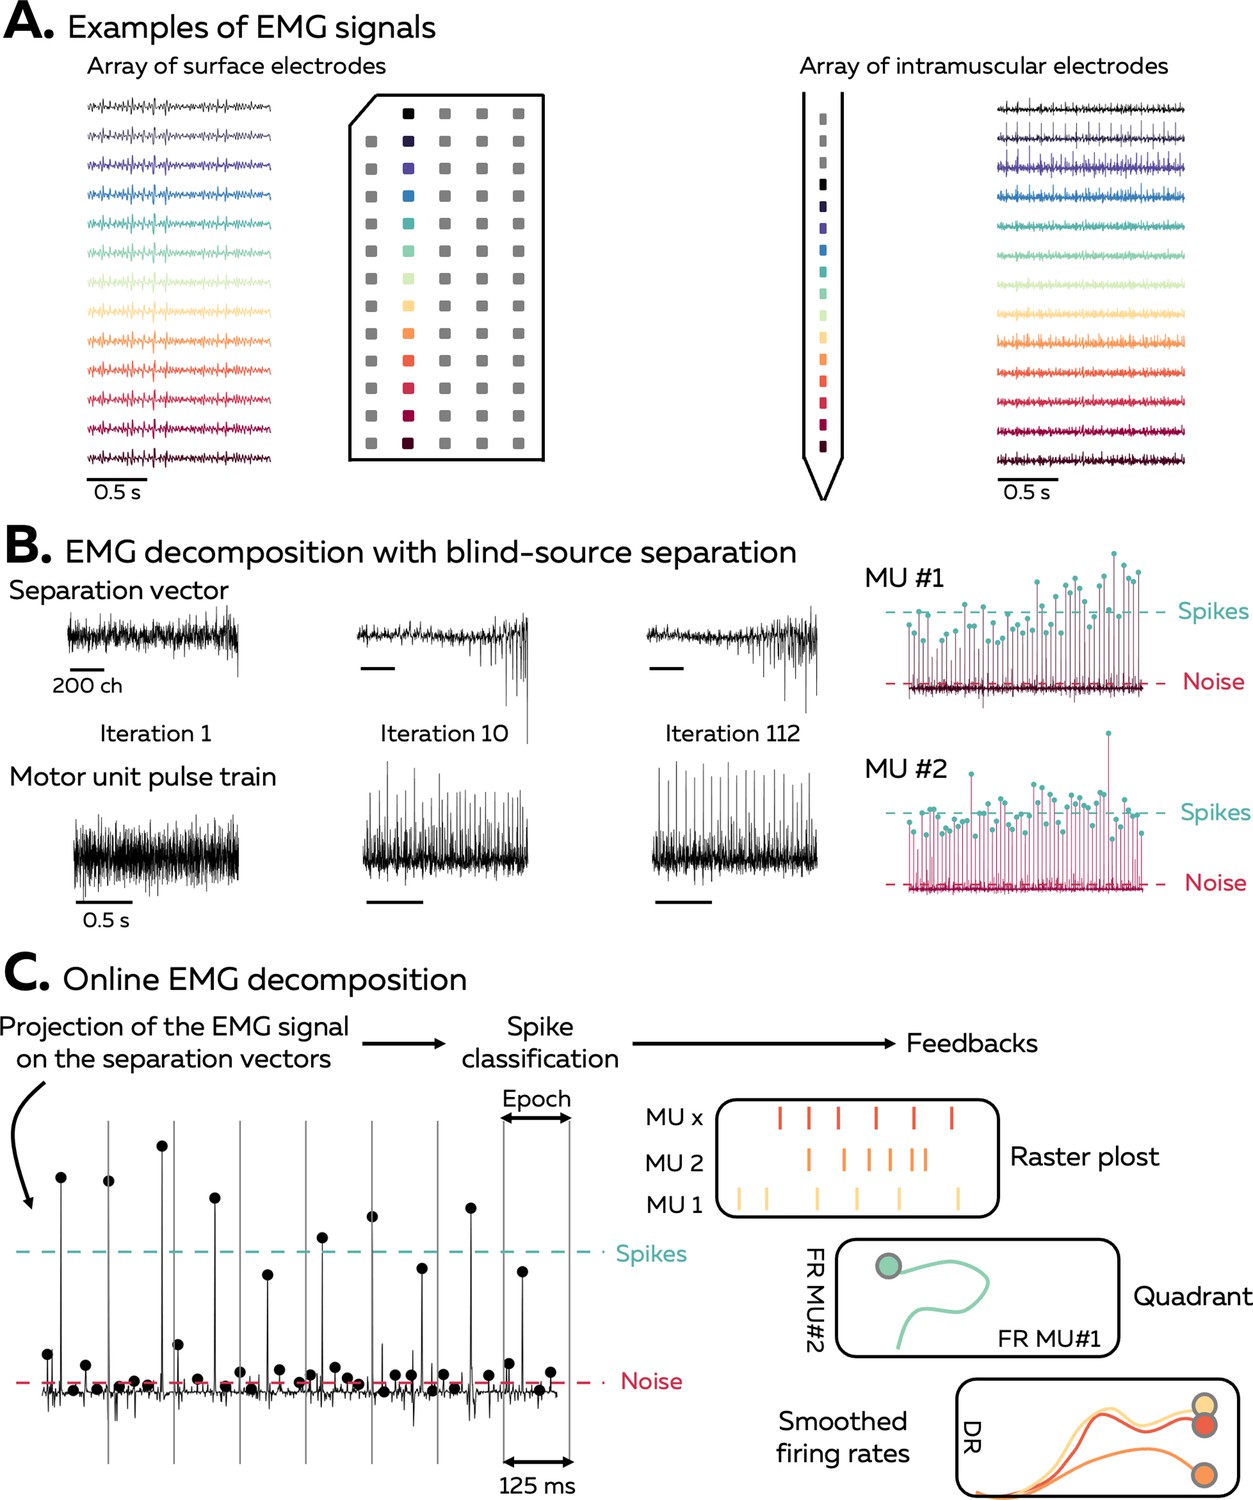
Overview of the approach.
(A) During isometric contractions, electromyographic (EMG) signals can be considered as the sum of all action potentials that originate from the muscle fibres of all the active motor units that lie within the electrodes recording zone. The shape of the recorded action potentials differs across electrodes when recorded with an array of surface or intramuscular electrodes. The EMG signal and each individual MUAP profile depends on the position of the electrode, as highlighted by the different colours. (B) Decomposing EMG signals consists of solving the inverse problem, that is, to estimate the discharge times of the active motor units from the EMG signals. Our software uses a fast independent component analysis (fasICA) to optimise a set of separation vectors for each motor unit. To this end, each separation vector is iteratively optimised to maximise the sparseness of the motor unit pulse train. At the end of this step, the motor unit pulse train is refined, and a k-mean classification is applied to separate the high peaks, which represent the targeted motor unit spikes, from the low peaks (other motor units and noise). (C) During the online EMG decomposition, the extended EMG signals recorded over 125 ms segments are projected on the separation vectors, and the peaks are detected using the function ‘islocalmax’. Each peak is classified as spike or noise depending on the distance separating them from the centroids of the classes identified during the calibration. At the end of this process, the motor unit firing activity is translated into visual feedback, in the form of a raster plot, a quadrant, or the smoothed firing rate of an identified motor unit.
Figure 1—figure supplement 1
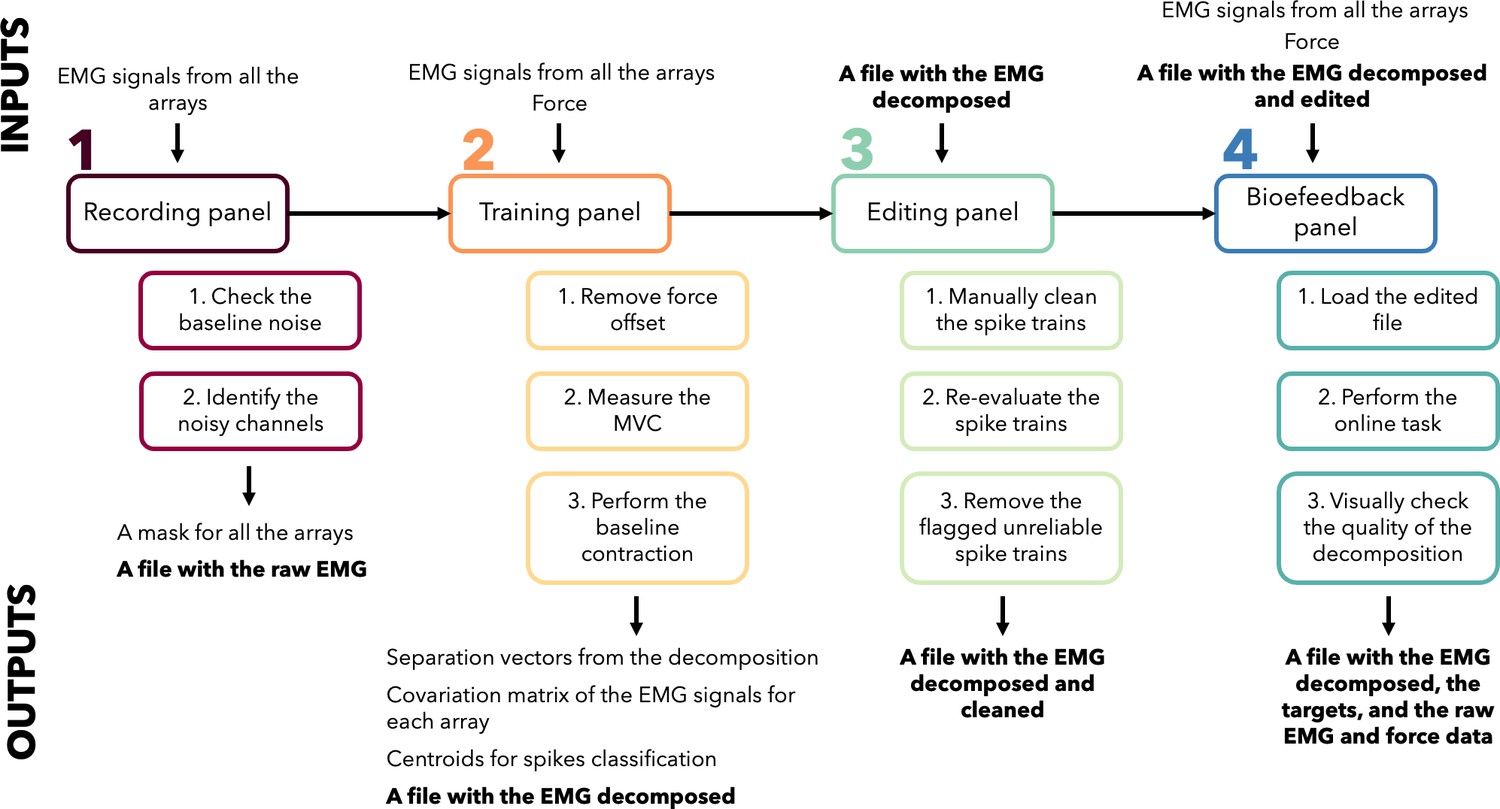
Workflow of a typical experimental session with I-Spin live.
Figure 2
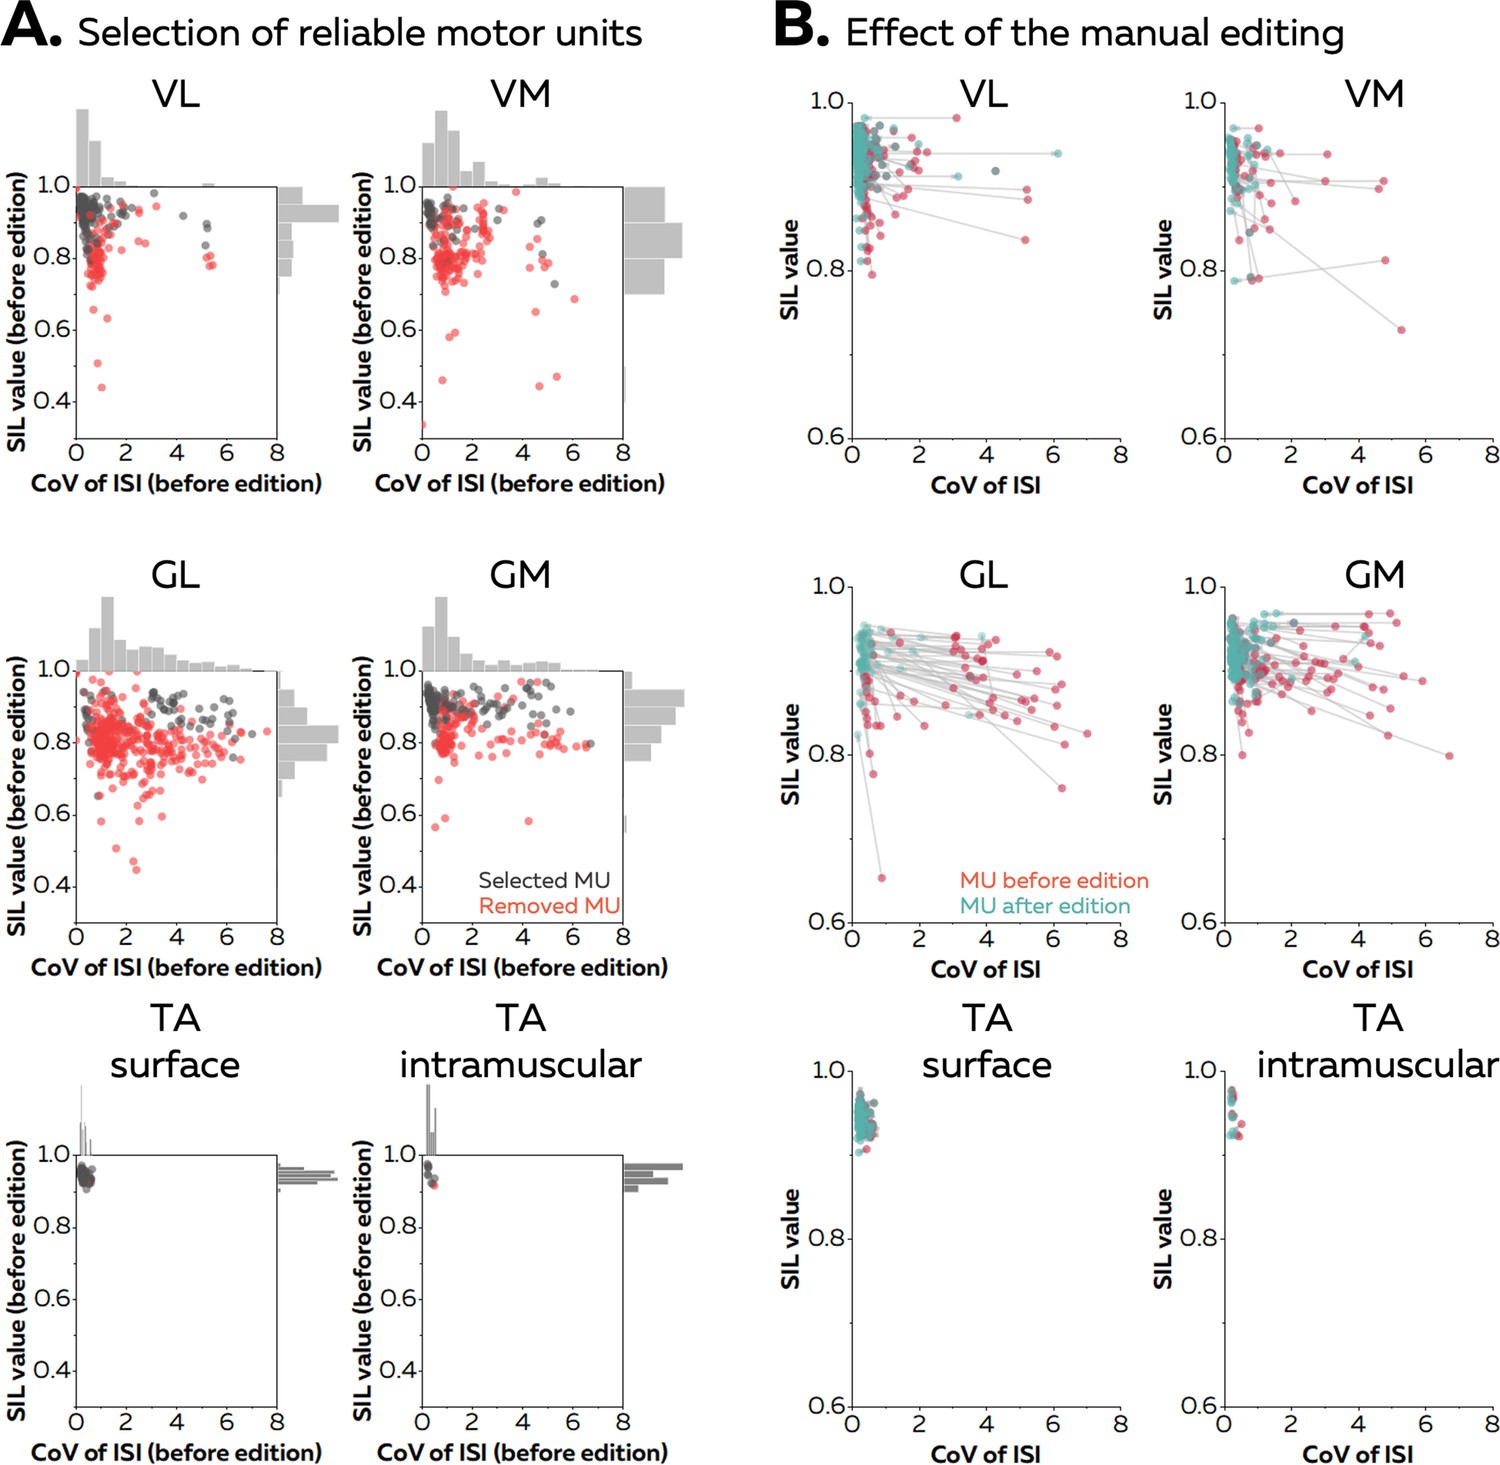
Effect of the manual editing on the reliability of motor unit pulse trains.
Once the participants completed the baseline contraction, we ran an automatic offline decomposition. Then, an operator visually inspected and removed all the motor units for which the spikes were not clearly separated from the noise (red dots in A). The remaining motor units were manually edited (black dots in A). (B) The manual editing consisted of removing false positives and adding the false negatives, before updating the motor unit filter. The effect of this step on the SIL value and the coefficient of variation of the interspike intervals (CoV of ISI, without units) is shown on the right panel. The CoV of ISI estimates the regularity of spiking for each motor unit, an expected behaviour during isometric contractions at consistent levels of force. The red dots are the motor units before editing and the green dots are the motor units after editing. These scatters are connected with a grey vector to show the changes in SIL value and CoV of ISI. Vastus lateralis (VL), vastus medialis (VM), gastrocnemius lateralis (GL), gastrocnemius medialis (GM), and tibialis anterior (TA).
Figure 3
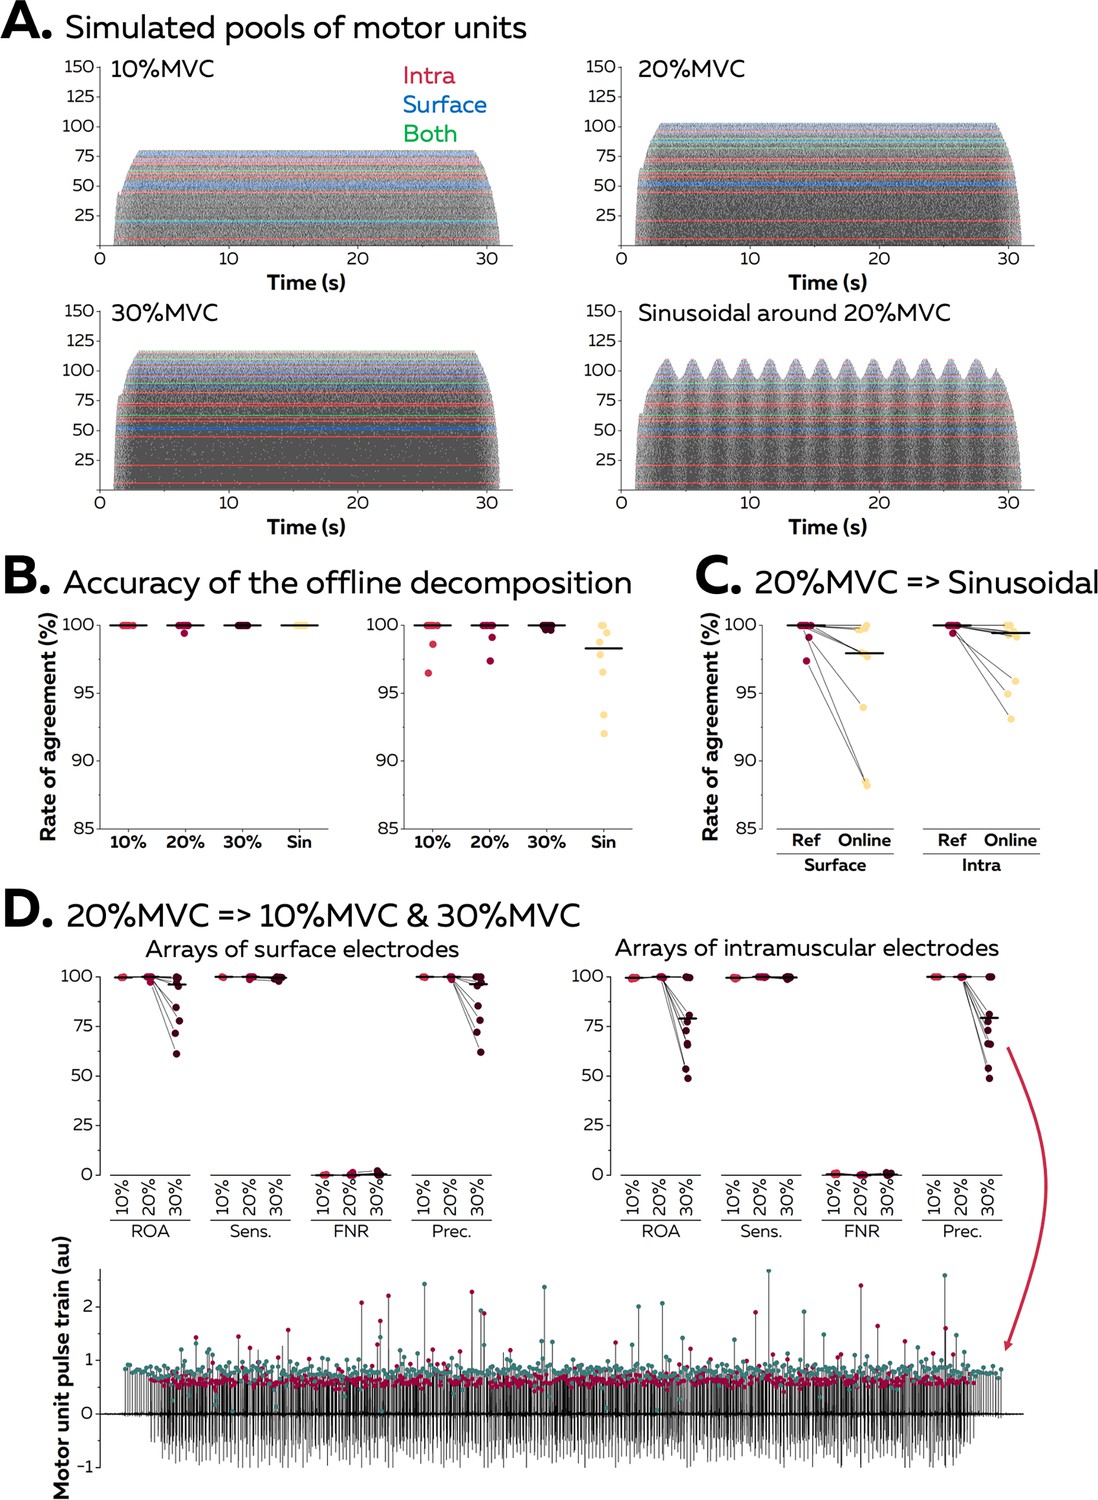
Validation of the algorithm with synthetic electromyographic (EMG) signals.
Surface and intramuscular EMG signals were generated using an anatomical model with 150 motor units. (A) Raster plots of the active motor units during simulated trapezoidal contractions performed at 10, 20, and 30% of the maximal force (maximal voluntary contraction [MVC]), and during a sinusoidal contraction with the force varying between 15 and 25% MVC at a rate of 0.5 Hz. The spike trains in red, blue, or green were respectively identified from intramuscular, surface, or both EMG signals. (B) The identified discharge times were compared to the ground truth, that is, the simulated discharge times, using the rate of agreement. Each dot is a motor unit, and the line is the median. (C) The motor unit filters identified from the reference contraction (i.e. trapezoidal contraction at 20% MVC) were then applied in real-time on the incoming EMG signals simulated during the sinusoidal contraction. The rates of agreement are displayed for each motor unit; the line is the median. (D) The motor unit filters identified at 20% MVC were applied in real-time on signals simulated during contractions at 10 and 30% MVC. Rates of agreement, sensitivity (sens.), false negative rates (FNR.), and precision (prec.) are displayed for each motor unit. The lower precision for motor units identified in real time at 30% MVC can be explained by the presence of a merged motor unit, as highlighted on this example. The red dots represent the discharge times of this merged motor unit while the green dots represent the discharge times of the targeted motor unit.
Figure 4
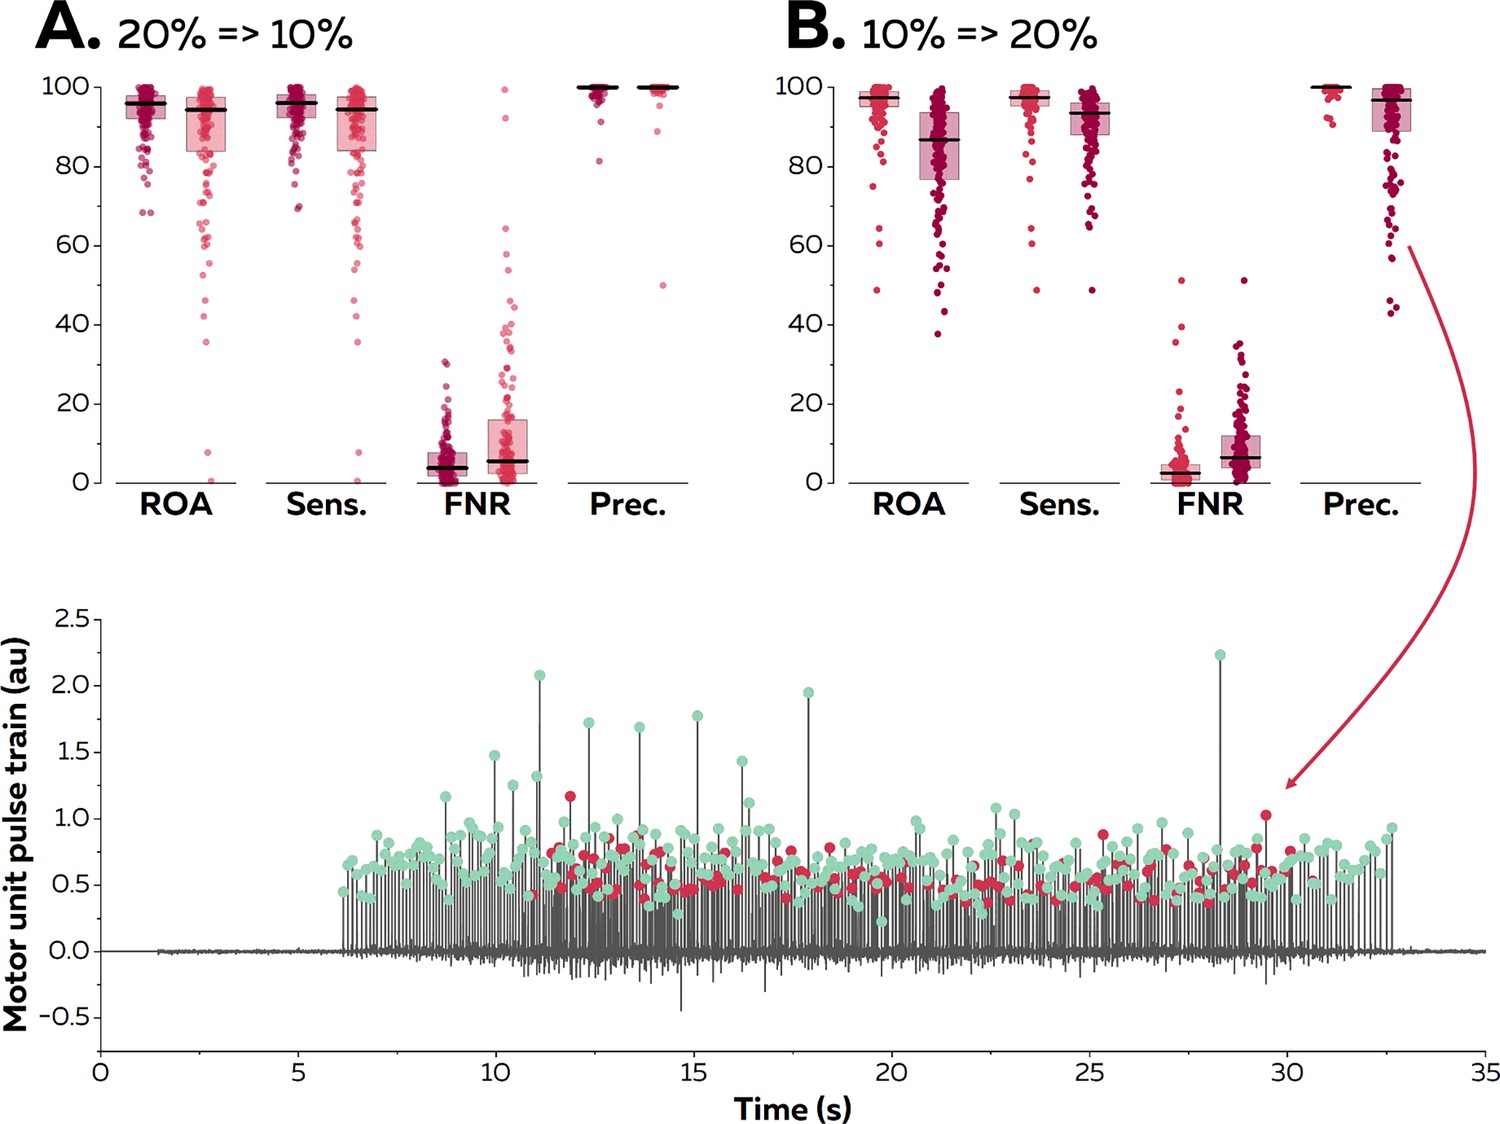
Reapplication of motor unit filters on electromyographic (EMG) signals recorded at varying contraction intensities.
Surface EMG signals were recorded during isometric contractions at 10 and 20% maximal voluntary contraction (MVC). We compared the motor unit spike trains identified in real time with their manually edited version. The contraction intensity of the test contraction was either equal to (20% => 20% in A; dark red & 10% => 10% in B; light red), below (20% => 10% in A; light red), or above (10%=>20% in B; dark red) the level of the baseline contraction. We calculated the rate of agreement (ROA), the sensitivity (Sens.), the false negative rate (FNR.), and the precision (Prec.) for each motor unit. Each dot is an individual motor unit, each box represents the 25th and 75th percentiles of the distribution of values, and each line is the median. The lower precision in (B) was caused by the presence of a merged motor unit in the motor unit pulse train. The red dots represent the discharge times of this merged motor units while the green dots represent the discharge times of the targeted motor unit.
Figure 5
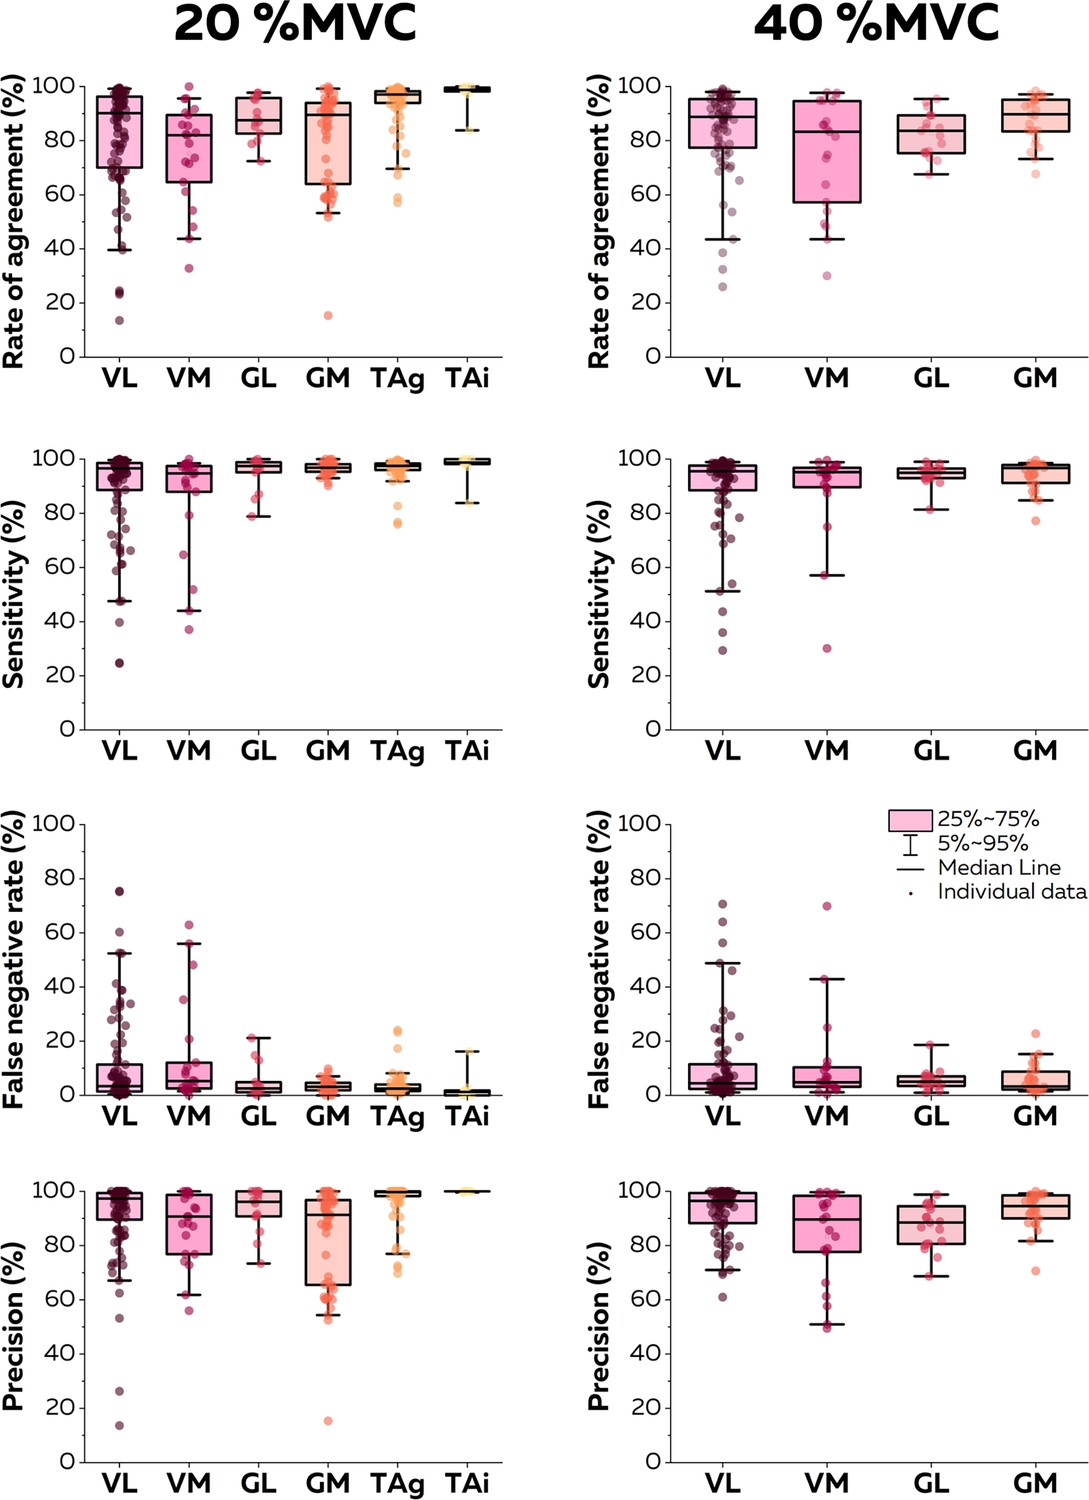
Accuracy of the online electromyographic (EMG) decomposition.
We compared the motor unit spike trains identified in real time with their manually edited version. We calculated the rate of agreement, the sensitivity, the false negative rate, and the precision for each motor unit. Each dot is an individual motor unit, each box represents the 25th and 75th percentiles of the distribution of values, each bar represents the 5th and 95th percentiles of the distribution of values, and each line is the median. VL: vastus lateralis, VM: vastus medialis, GL: gastrocnemius lateralis, GM: gastrocnemius medialis, TAg: tibialis anterior recorded with a high-density grid of electrodes, and TAi: tibialis anterior recorded with an intramuscular array of electrodes.
Figure 6
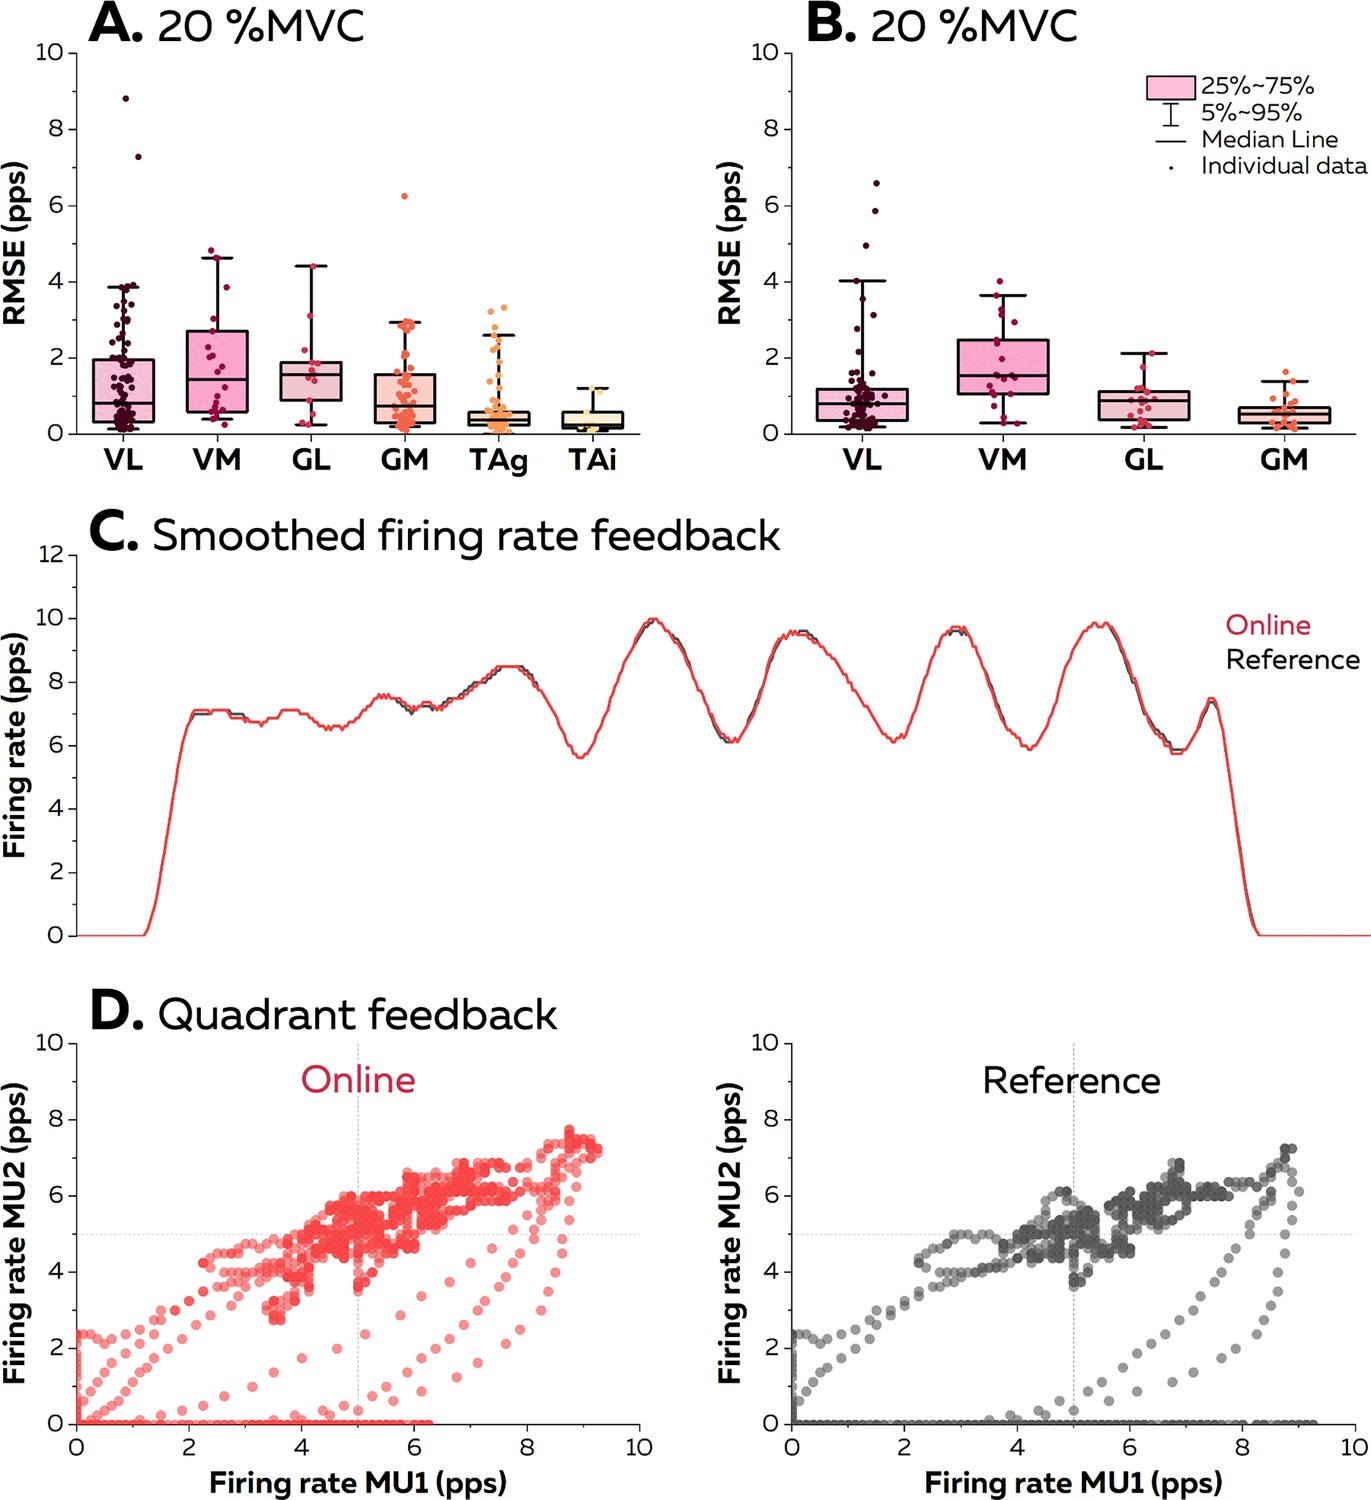
Accuracy of the visual feedback based on the motor unit smoothed firing rates.
The online electromyographic (EMG) decomposition was provided to the participants in the form of different visual feedback. We estimated the accuracy of the feedback by calculating the root mean squared error (RMSE) between the smoothed firing rates estimated from the motor unit spike trains identified in real time and from their manually edited version at 20% maximal voluntary contraction (MVC) (A) and 40% MVC (B). Each dot is an individual motor unit, each box represents the 25th and 75th percentiles of the distribution of values, each bar represents the 5th and 95th percentiles of the distribution of values, and each line is the median. VL: vastus lateralis, VM: vastus medialis, GL: gastrocnemius lateralis, GM: gastrocnemius medialis, TAg: tibialis anterior recorded with a high-density grid of surface electrodes, and TAi: tibialis anterior recorded with an intramuscular array of electrodes. (C) Smoothed firing rate of a motor unit provided in real time (Real time, red) vs. its manually edited version (Reference, grey). (D) Quadrant plot provided in real time (Real time, red) vs. its manually edited version (Reference, grey). Each dot represents the position of the cursor during one window of 125 ms.
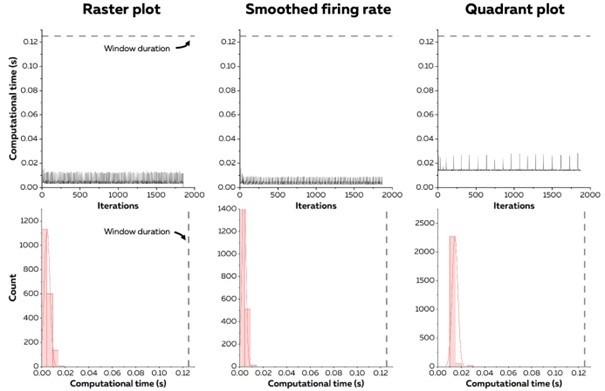
Figure 7
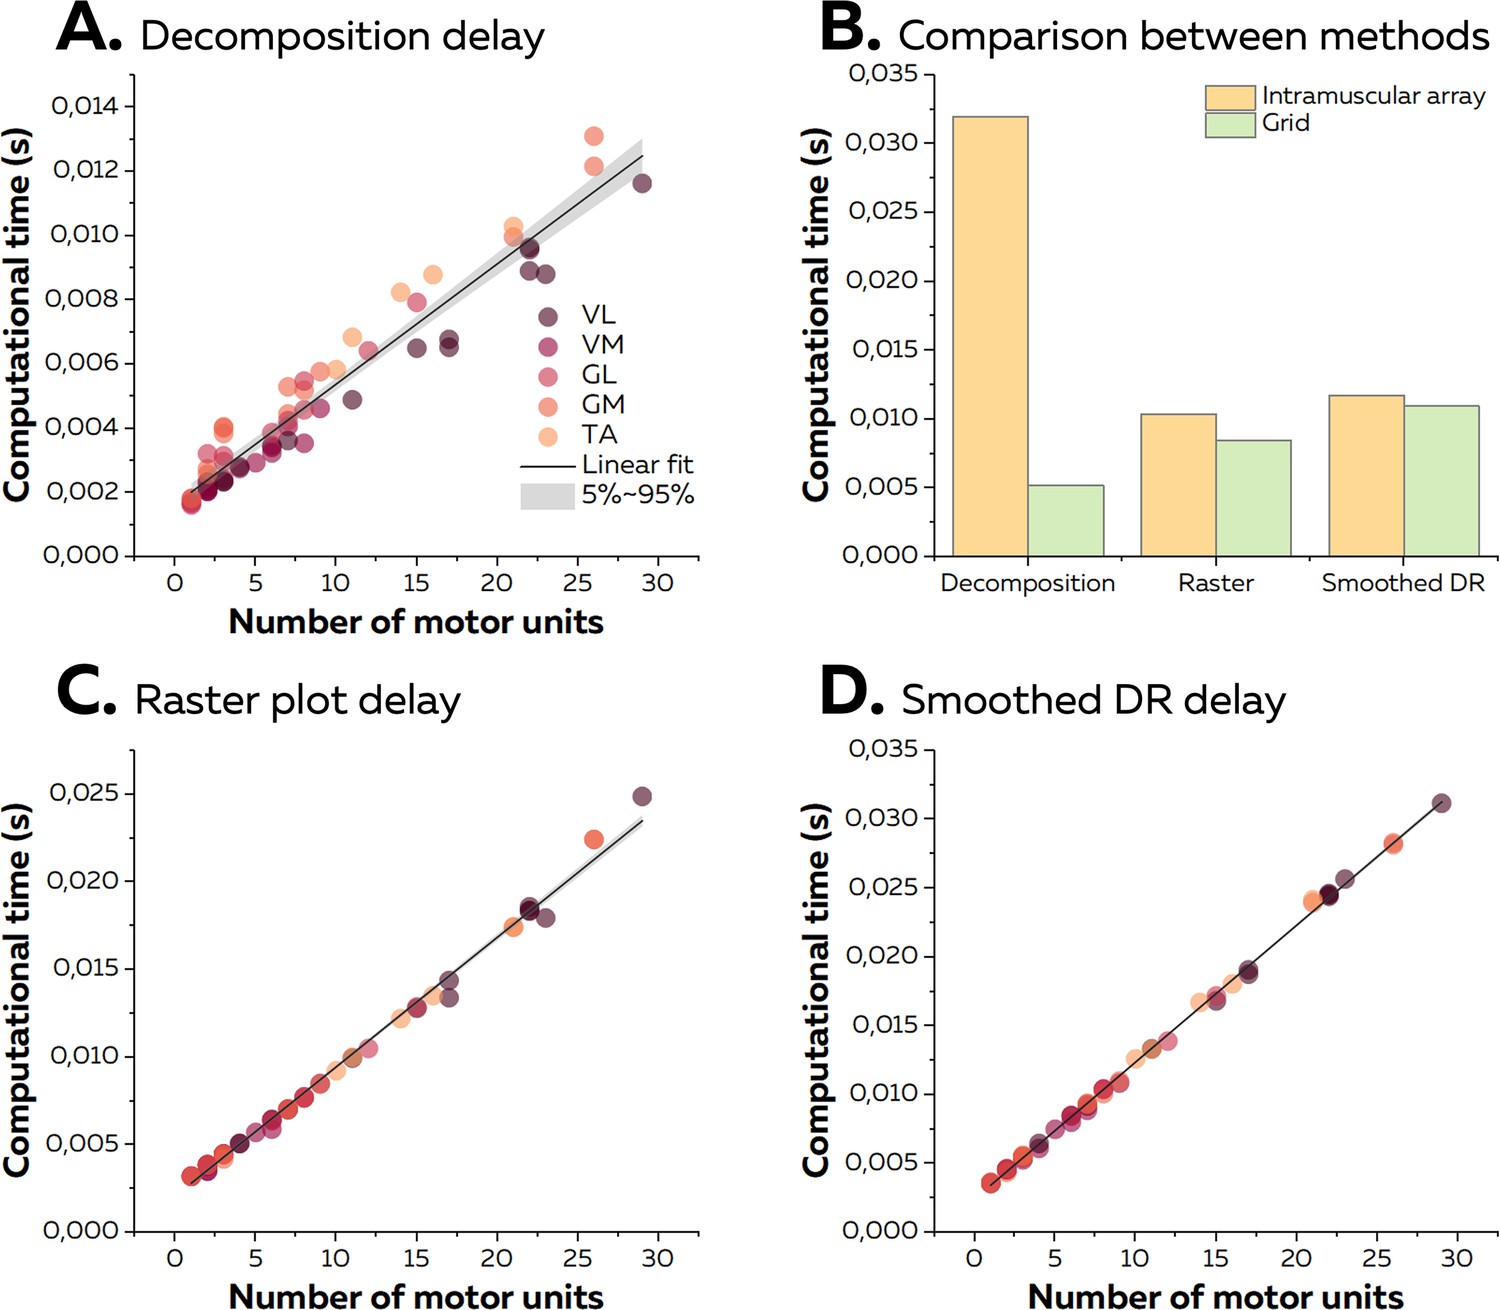
Computational time of the online electromyographic (EMG) decomposition.
(A) We considered the computational time for the decomposition as the time between the reception of the EMG signals and the identification of the spikes for all the motor units. We computed the linear regression between the number of identified motor units and the computational time and considered the slope as the computational time per motor unit. Each dot represents one decomposition, and the colour scheme depends on the muscle. (B) As the sampling frequency differed between recordings with high-density grids and intramuscular arrays of electrodes, we compared the computational times for both techniques with the same number of identified motor units (i.e. 9). (C, D) After the decomposition, the motor unit discharge activity was translated into visual feedback, either in the form of a raster plot or the smoothed firing rates for all the identified motor units. As for the decomposition, we normalised the computational time per motor unit using a linear regression.
Author response image 1
Additional files
Download links
A two-part list of links to download the article, or parts of the article, in various formats.
Downloads (link to download the article as PDF)
Open citations (links to open the citations from this article in various online reference manager services)
Cite this article (links to download the citations from this article in formats compatible with various reference manager tools)
I-Spin live, an open-source software based on blind-source separation for real-time decoding of motor unit activity in humans
eLife 12:RP88670.
https://doi.org/10.7554/eLife.88670.3


