Vglut2-based glutamatergic signaling in central noradrenergic neurons is dispensable for normal breathing and chemosensory reflexes
- Department of Neuroscience, Baylor College of Medicine, United States
- Department of Integrative Physiology, Baylor College of Medicine, United States
- McNair Medical Institute, United States
Figures
Figure 1 with 1 supplement
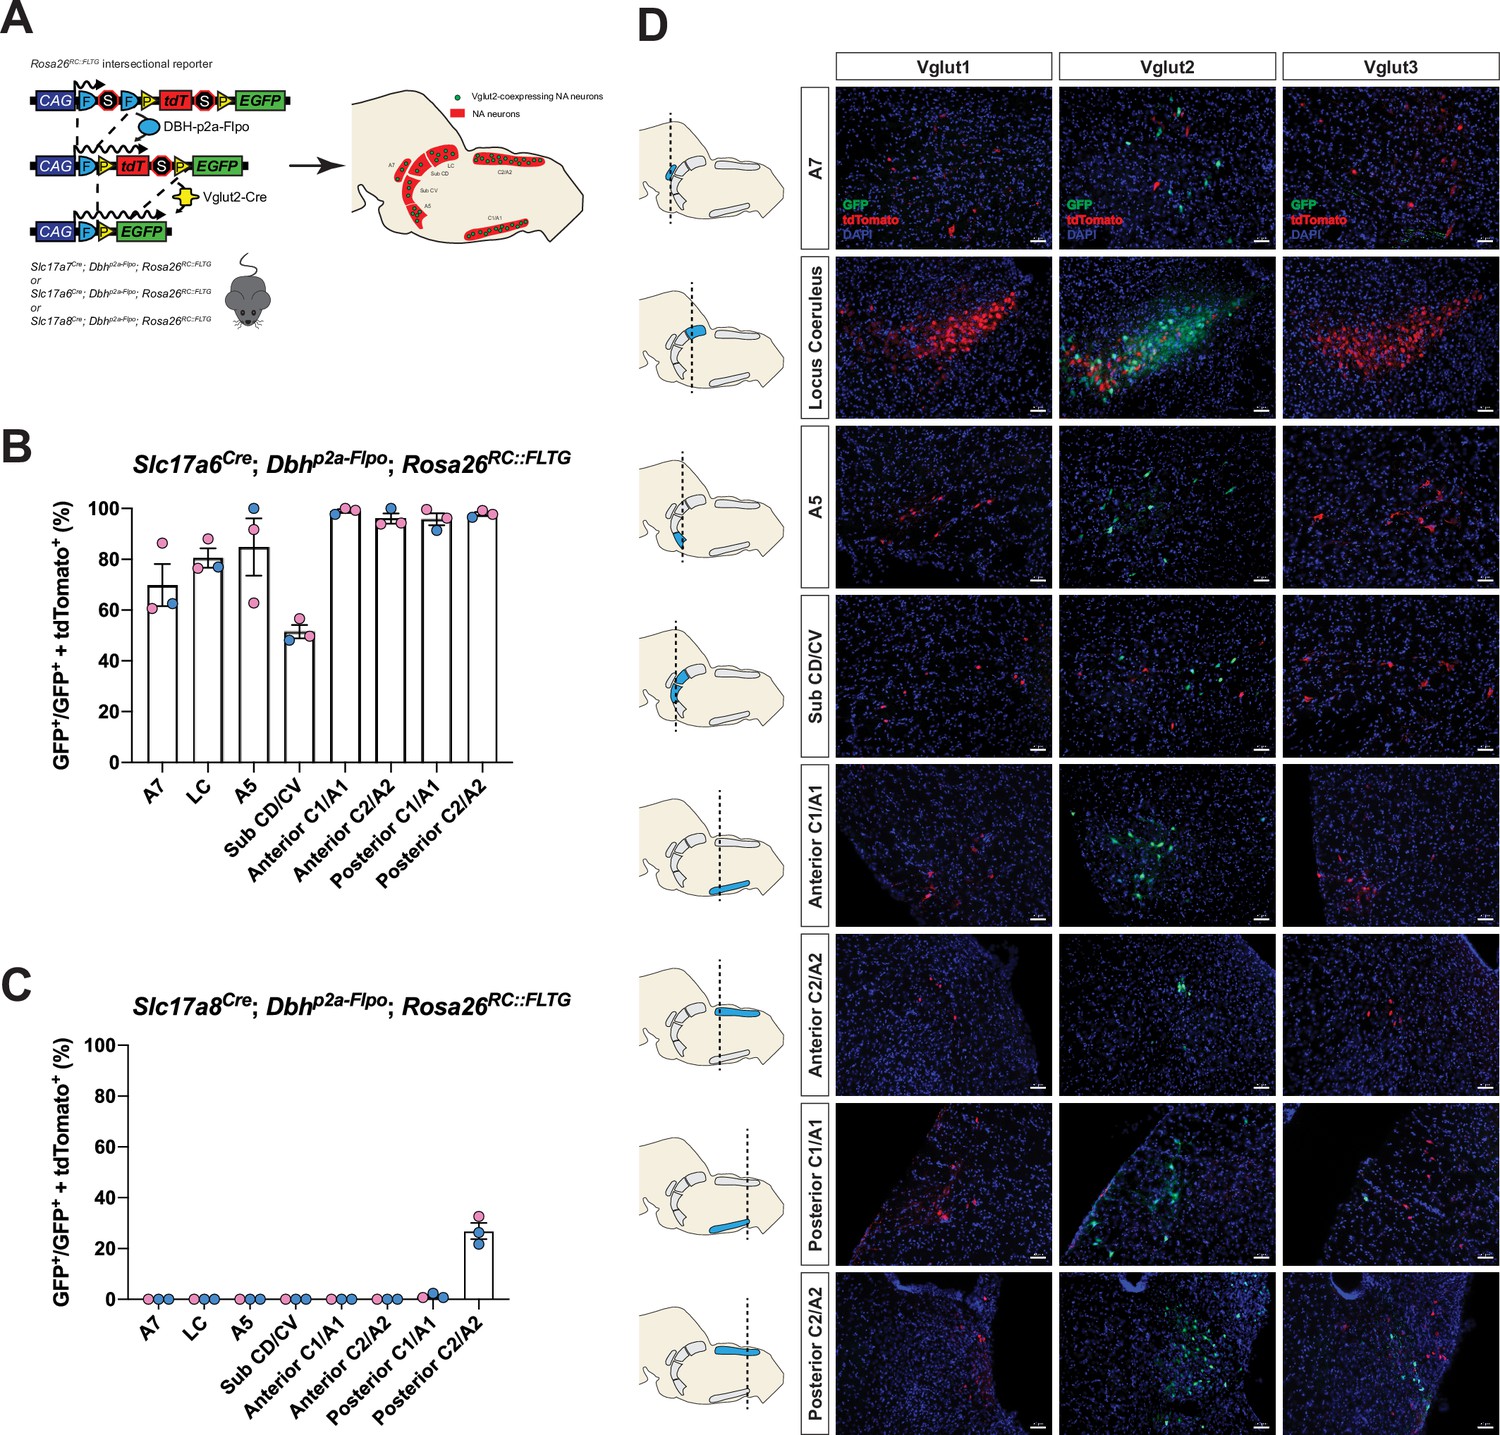
Cumulative fate maps of glutamate co-expressing noradrenergic (NA) neurons characterized by intersectional genetics.
(A) Breeding schematic to generate the three intersectional reporter lines Slc17a7Cre; Dbhp2a-Flpo; Rosa26RC::FLTG, Slc17a6Cre; Dbhp2a-Flpo; Rosa26RC::FLTG, Slc17a8Cre; Dbhp2a-Flpo; Rosa26RC::FLTG. In each of the three intersectional reporter crosses, NA neurons co-expressing either Vglut1, Vglut2, or Vglut3 are labeled by green fluorescent protein (eGFP) while NA neurons without any Vglut1, 2, or 3 expressions are labeled by red fluorescent protein (tdTomato). Shown as an example is the Slc17a6Cre; Dbhp2a-Flpo; Rosa26RC::FLTG (Vglut2-Cre/+; DBH-p2a-Flpo/+; RC::FLTG/+) intersectional reporter line. (B) Quantification of the percentage of Vglut2-coexpressing NA neurons among NA neurons in each brainstem NA nuclei including A7, LC, A5, sub CD/CV, anterior C1/A1 and C2/A2, posterior C1/A1 and C2/A2. Pink data points represent female data while blue data points represent male data. (C) Quantification of the percentage of Vglut3-coexpressing NA neurons among NA neurons in each NA nucleus. Pink data points represent female data while blue data points represent male data. (D) Fluorescent expression of tdTomato (red) and eGFP (green) in coronal sections of Vglut1, Vglut2, or Vglut3 intersectional reporter lines in brainstem NA nuclei. Nucleus is labeled by 4′,6-diamidino-2-phenylindole (DAPI) (blue). Scale bar 50 μm.
-
Figure 1—source data 1
Cell quantification for Vglut2-coexpressing noradrenergic (NA) neurons in the cumulative fate map.
- https://cdn.elifesciences.org/articles/88673/elife-88673-fig1-data1-v1.xlsx
-
Figure 1—source data 2
Cell quantification for Vglut3-coexpressing noradrenergic (NA) neurons in the cumulative fate map.
- https://cdn.elifesciences.org/articles/88673/elife-88673-fig1-data2-v1.xlsx
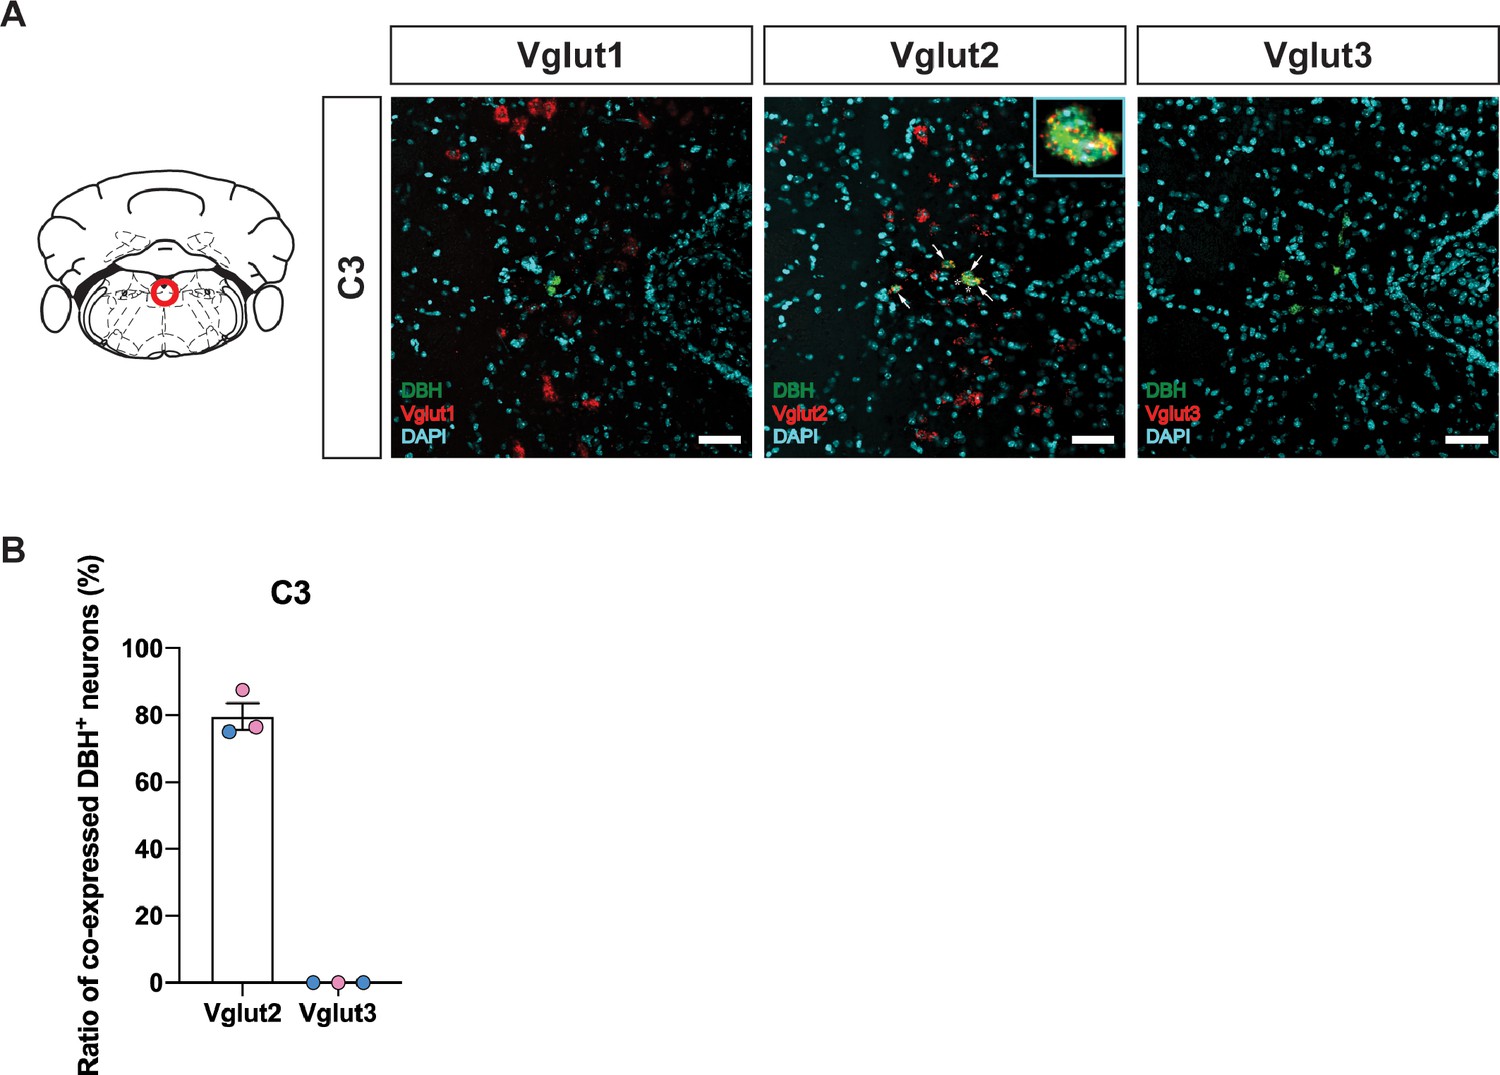
Figure 1—figure supplement 1
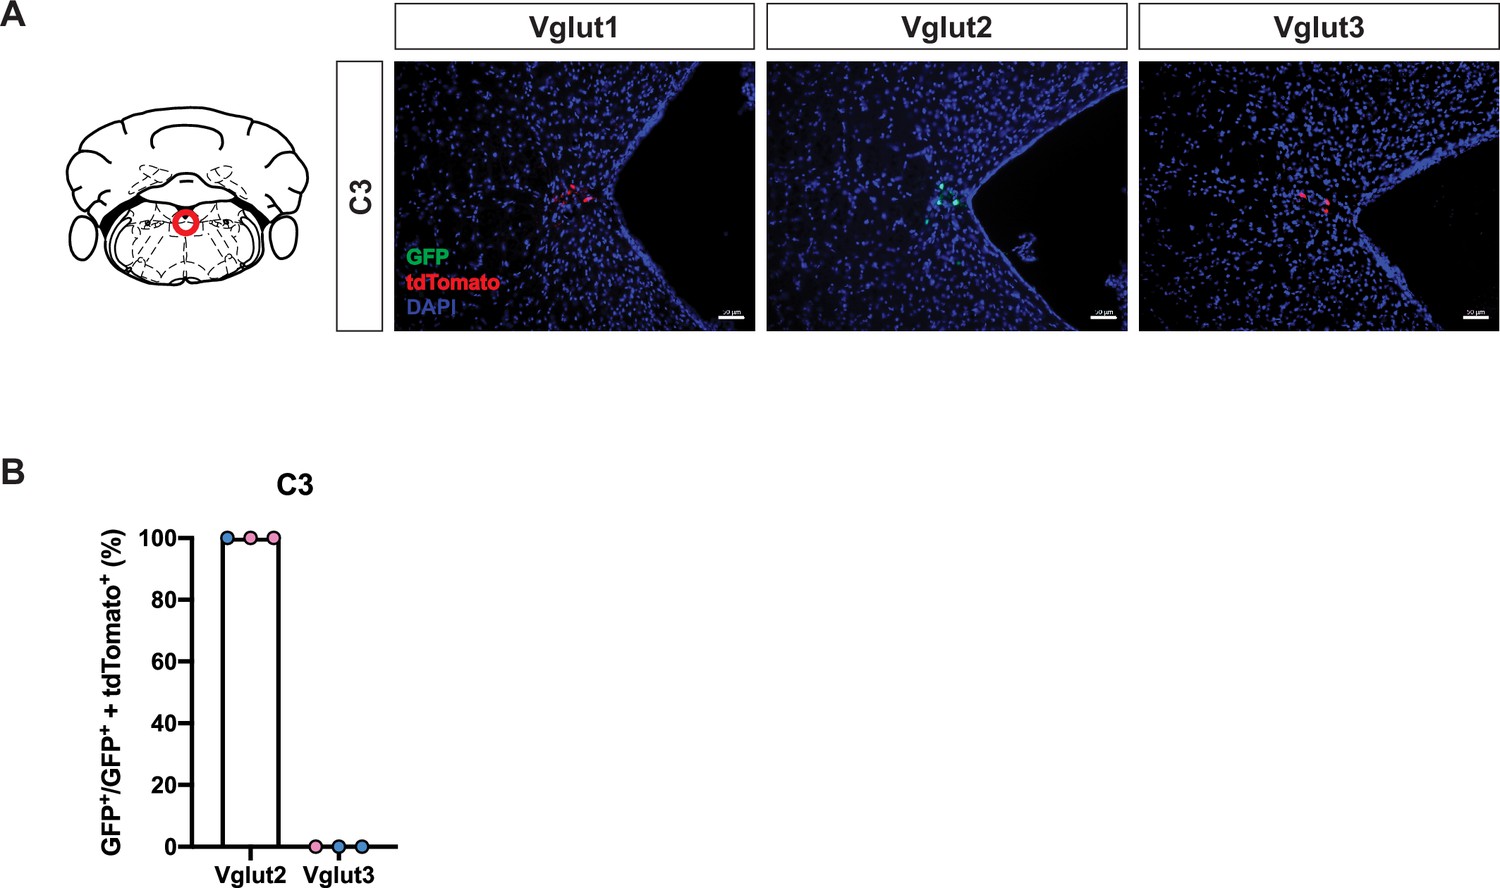
Cumulative fate maps of glutamate co-expressing noradrenergic (NA) neurons in C3 NA nucleus.
(A) Fluorescent expression of tdTomato (red) and eGFP (green) in coronal sections of Vglut1, Vglut2, or Vglut3 intersectional reporter lines in C3 NA nucleus. Nucleus is labeled by DAPI (blue). Scale bar 50 μm. (B) Quantification of the percentage of Vglut2- or Vglut3-coexpressing NA neurons among NA neurons in C3 NA nucleus. Female data (pink), male data (blue).
Figure 2 with 2 supplements
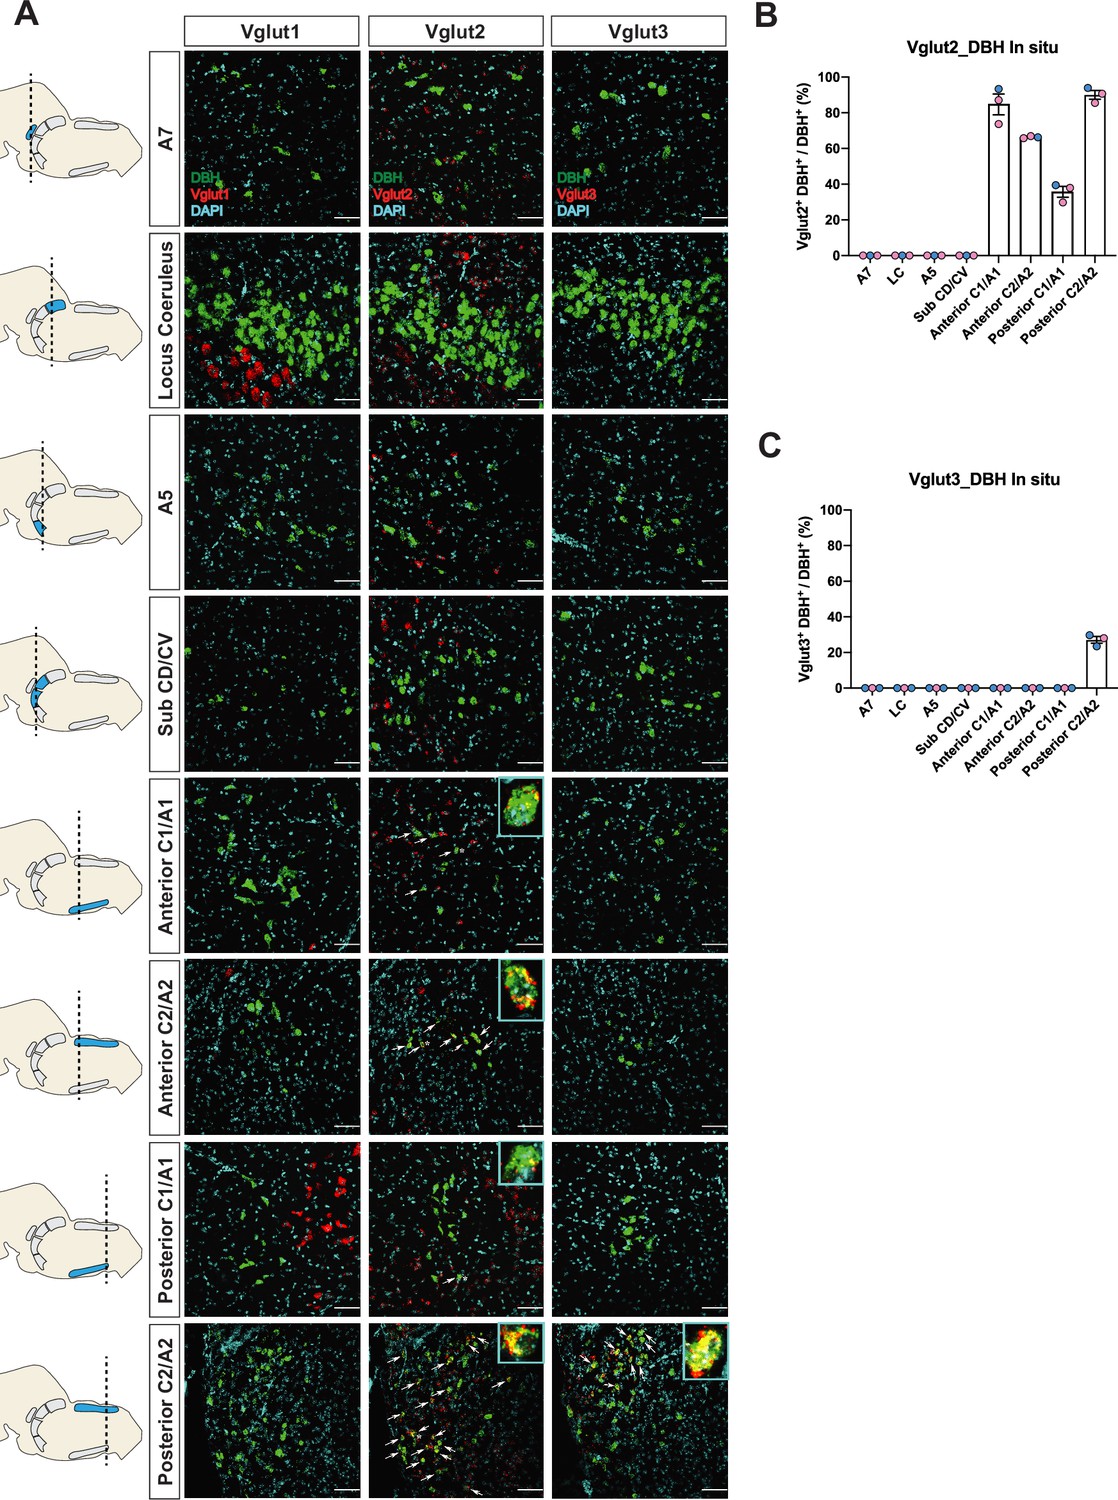
Characterization of real-time co-expression of Vglut1, Vglut2, and Vglut3 in brainstem noradrenergic (NA) neurons in adult mice by fluorescent in situ hybridization.
(A) Representative images of Slc17a7 (Vglut1), Slc17a6 (Vglut2), and Slc17a8 (Vglut3) and Dbh (DBH) double ISH in coronal sections of WT mice in all of brainstem NA nuclei in adult mice. DBH (green), Vglut1/2/3 (red), DAPI (cyan). Scale bar 50 μm. (B) Quantification of the percentage of Slc17a6 (Vglut2) co-expression in NA neurons in each NA nucleus. Female data (pink), male data (blue). (C) Quantification of the percentage of Slc17a8 (Vglut3) co-expression in NA neurons in each NA nucleus. Female data (pink), male data (blue).
-
Figure 2—source data 1
Cell quantification for Vglut2-coexpressing noradrenergic (NA) neurons in the in situ hybridization.
- https://cdn.elifesciences.org/articles/88673/elife-88673-fig2-data1-v1.xlsx
-
Figure 2—source data 2
Cell quantification for Vglut3-coexpressing noradrenergic (NA) neurons in the in situ hybridization.
- https://cdn.elifesciences.org/articles/88673/elife-88673-fig2-data2-v1.xlsx
Figure 2—figure supplement 1
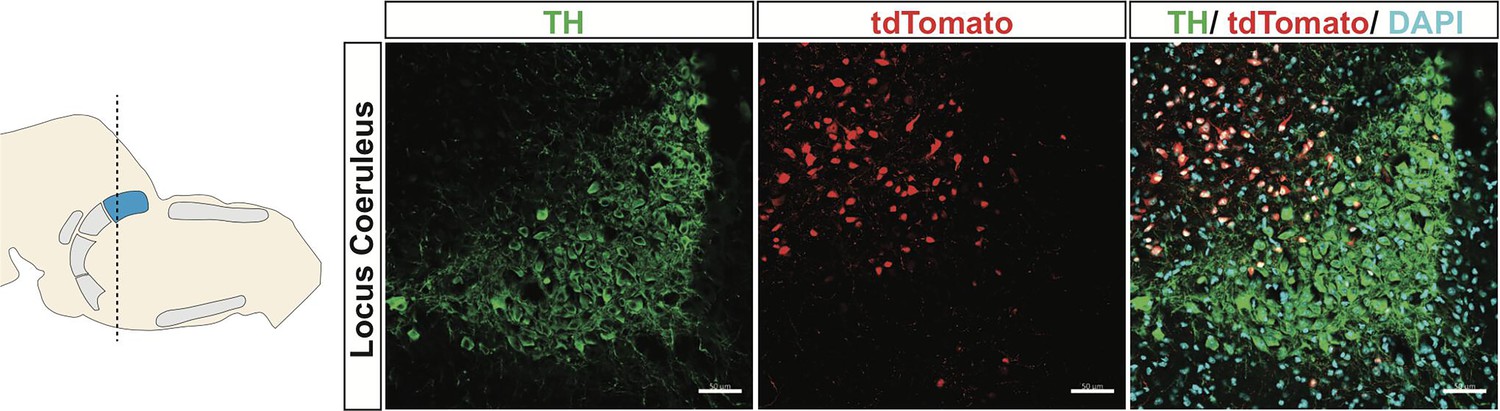
Virus injection of Cre-dependent tdTomato into LC of Slc17a6Cre mice.
TH (green), tdTomato (red), nuclei (DAPI). Scale bar 50 μm.
Figure 2—figure supplement 2
Characterization of real-time co-expression of Vglut1, Vglut2, and Vglut3 in C3 noradrenergic (NA) neurons in adult mice by fluorescent in situ hybridization.
(A) Representative images of Slc17a7 (Vglut1), Slc17a6 (Vglut2), and Slc17a8 (Vglut3) and Dbh (DBH) double ISH in coronal sections of WT mice in C3 NA nuclei in adult mice. DBH (green), Vglut1/2/3 (red), DAPI (cyan). Scale bar 50 μm. (B) Quantification of the percentage of Slc17a6 (Vglut2)/Slc17a8 (Vglut3) co-expression in C3 NA nucleus. Female data (pink), male data (blue).
Figure 3 with 1 supplement
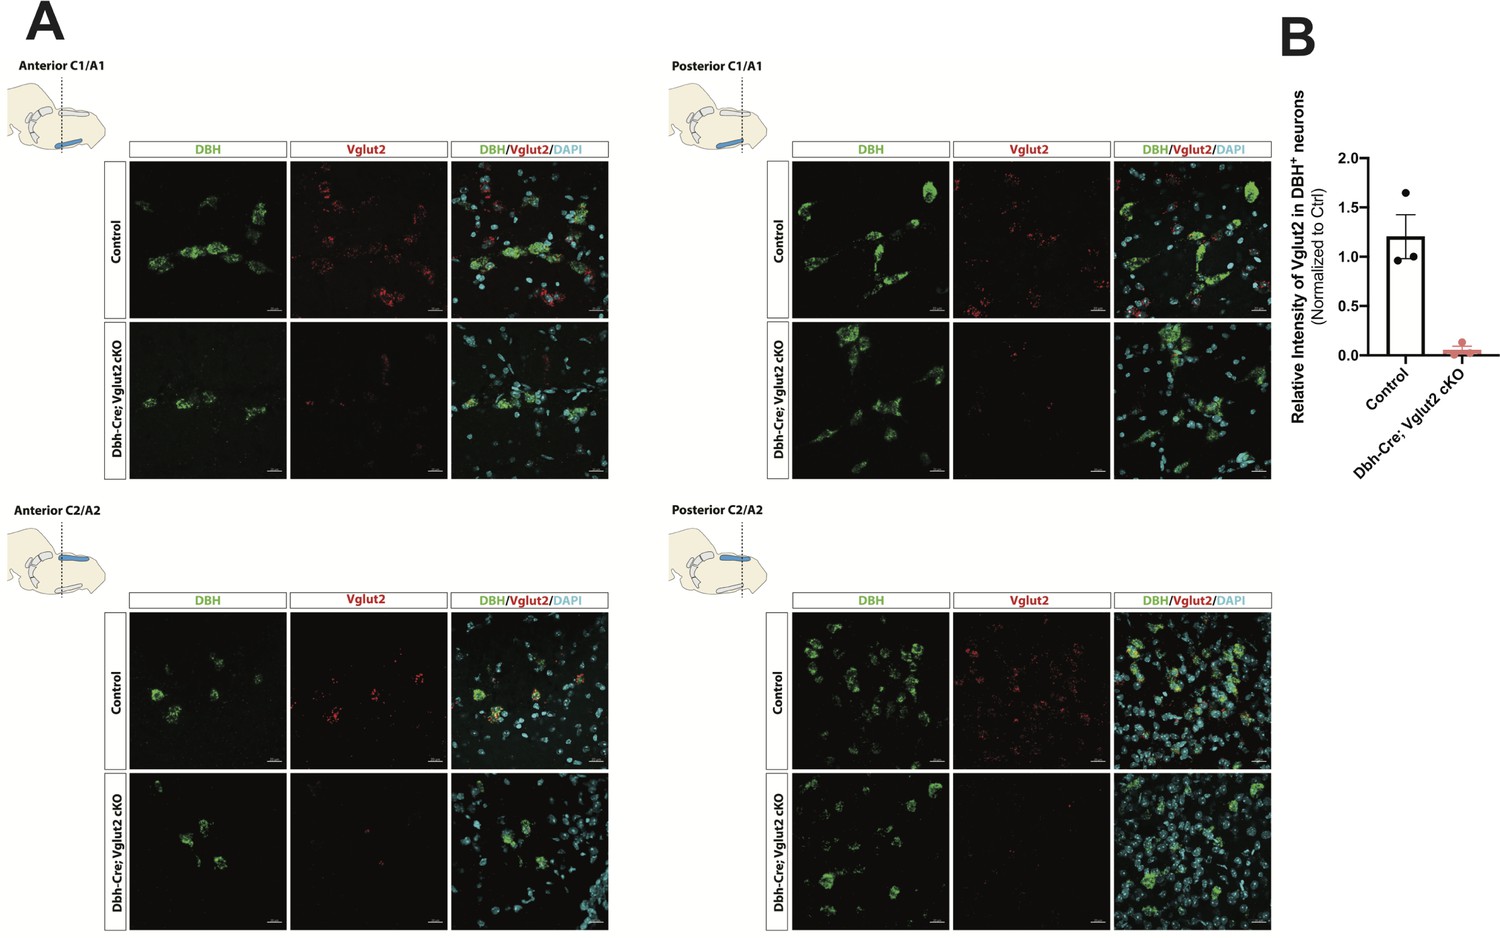
DBH with Vglut2 co-staining by fluorescent in situ hybridization confirms that Vglut2 expression is disrupted in the whole central noradrenergic (NA) system in Dbh-Cre; Vglut2 cKO mice.
(A) Representative images of Slc17a6 (Vglut2) and Dbh (DBH) double ISH in anterior C1/A1, posterior C1/A1, anterior C2/A2, and posterior C2/A2 in control and Dbh-Cre; Vglut2 cKO mice. DBH (green), Vglut2 (red), DAPI (cyan). Scale bar 20 μm.(B) Quantification of intensity of Slc17a6 (Vglut2) signal in control and Dbh-Cre; Vglut2 cKO mice.
-
Figure 3—source data 1
Image quantification for Vglut2 signal intensity in Dbh-Cre; Vglut2 cKO and their littermate controls.
- https://cdn.elifesciences.org/articles/88673/elife-88673-fig3-data1-v1.xlsx
Figure 3—figure supplement 1
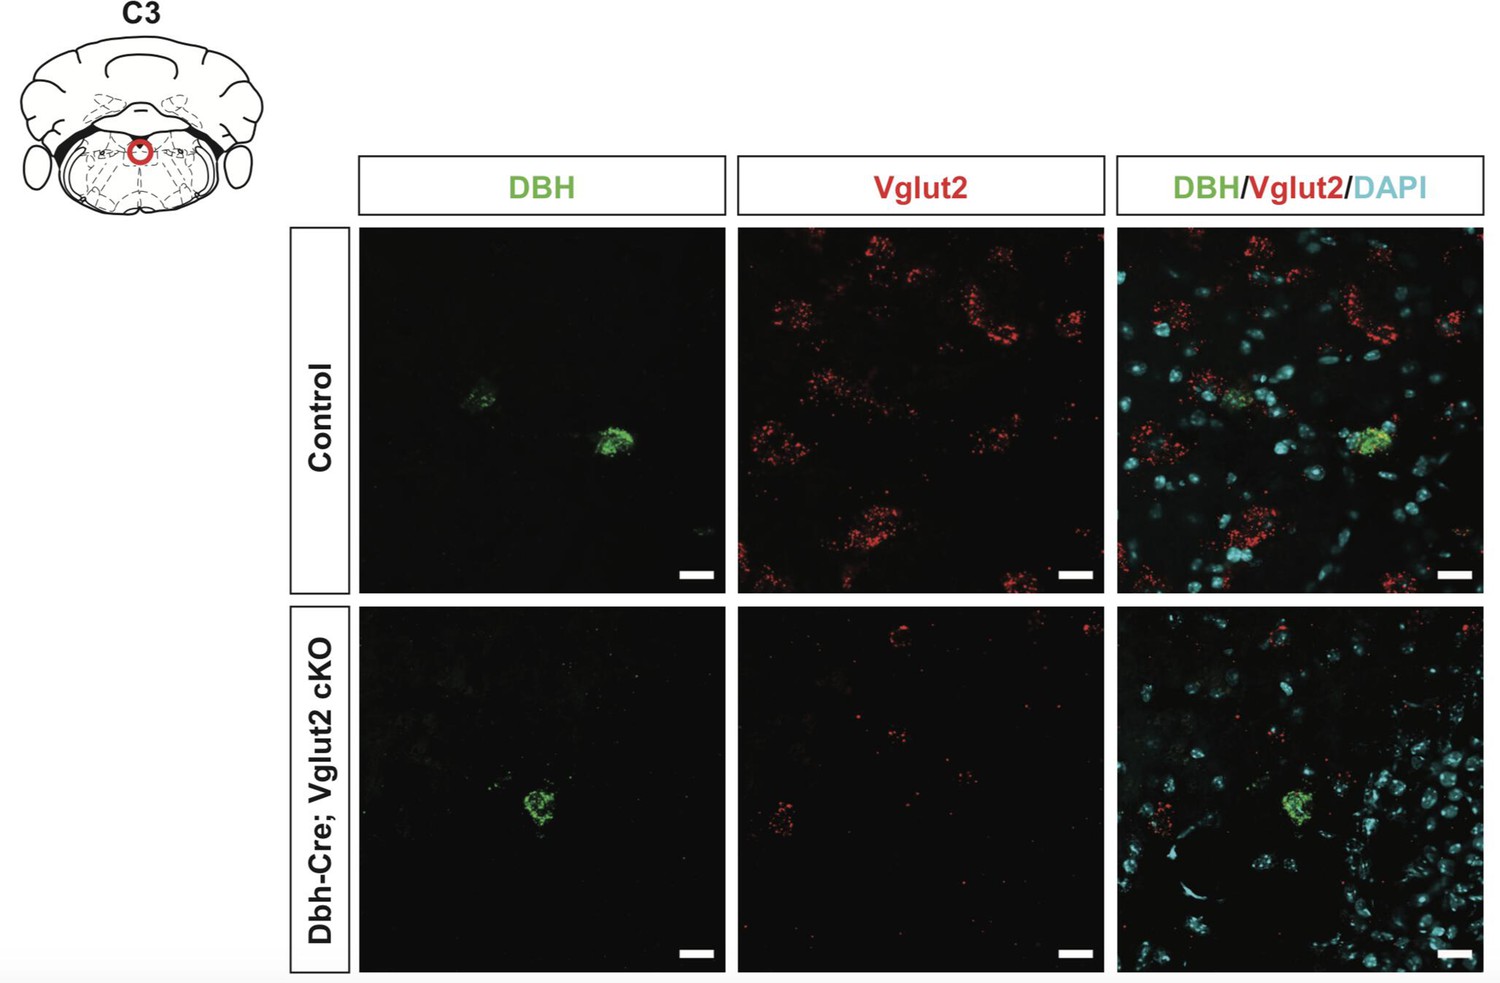
DBH with Vglut2 co-staining by fluorescent in situ hybridization confirms that Vglut2 expression is disrupted in C3 noradrenergic (NA) nucleus in Dbh-Cre; Vglut2 cKO mice.
DBH (green), Vglut2 (red), DAPI (cyan). Scale bar 20 μm.
Figure 4 with 1 supplement
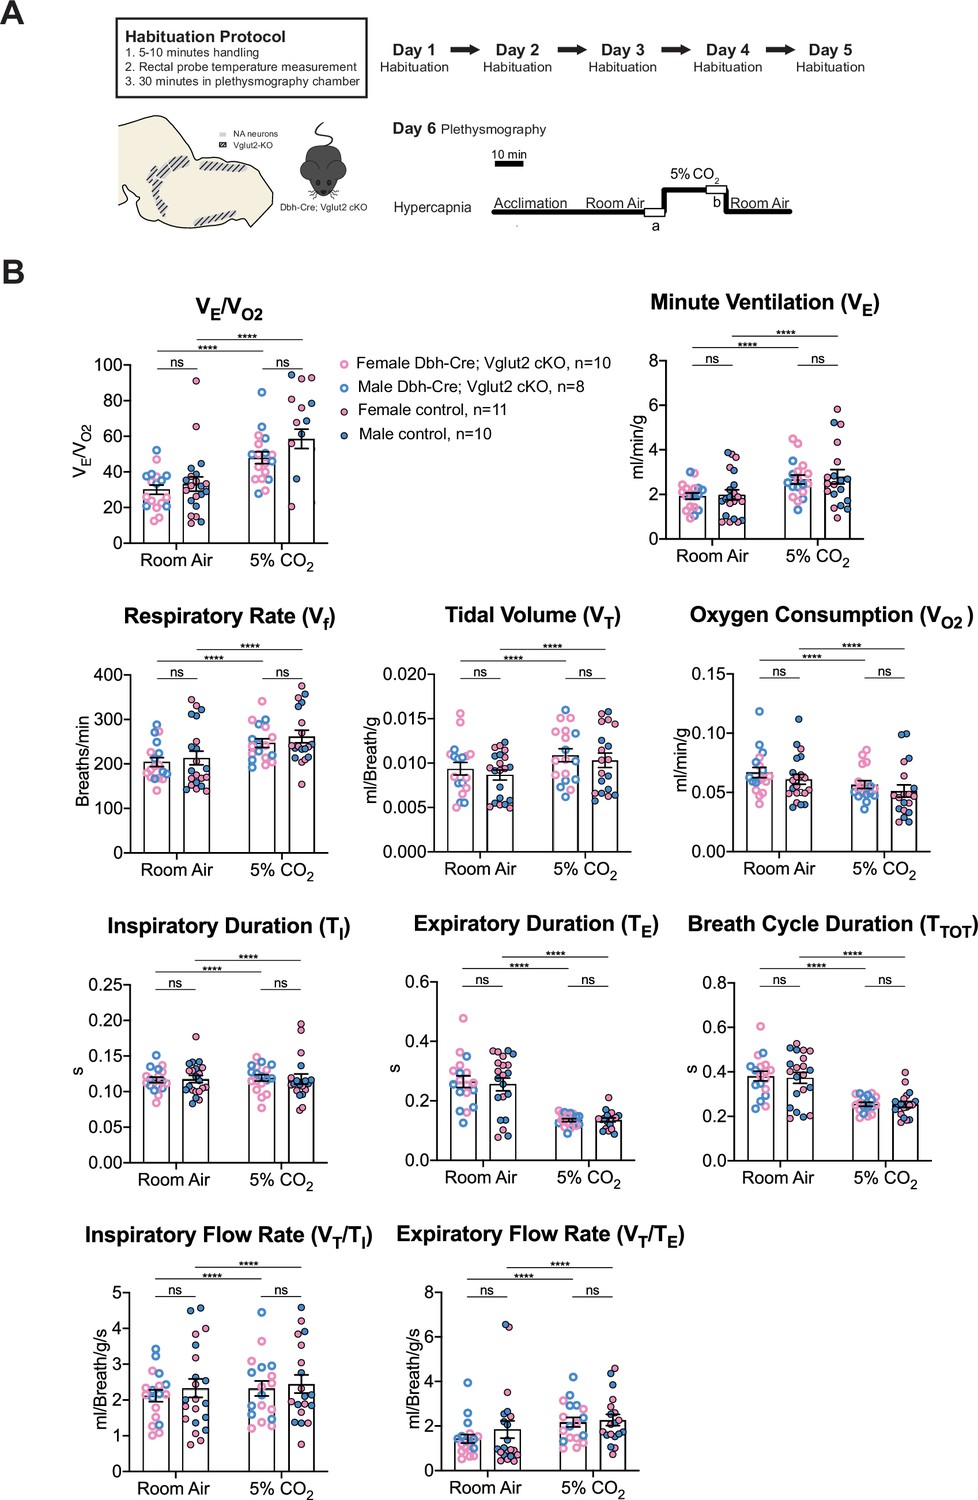
Vglut2 conditional knockout in central noradrenergic neurons fails to alter baseline breathing and the hypercapnic ventilatory reflex (5% CO2).
(A) Mouse model schematic and experimental protocol including habituation and hypercapnia protocol (5% CO2). (B) Under both room air and hypercapnia (5% CO2), Dbh-Cre; Vglut2 cKO mice did not show significant changes in respiratory output (VE/VO2), minute ventilation (VE), respiratory rate (Vf), tidal volume (VT), metabolism demand (VO2), inspiratory duration (TI), expiratory duration (TE), breath cycle duration (TTOT), inspiratory flow rate (VT/TI), and expiratory flow rate (VT/TE). Linear mixed-effects regression model, ****p < 0.0001, ns: p ≥ 0.05.
Figure 4—figure supplement 1
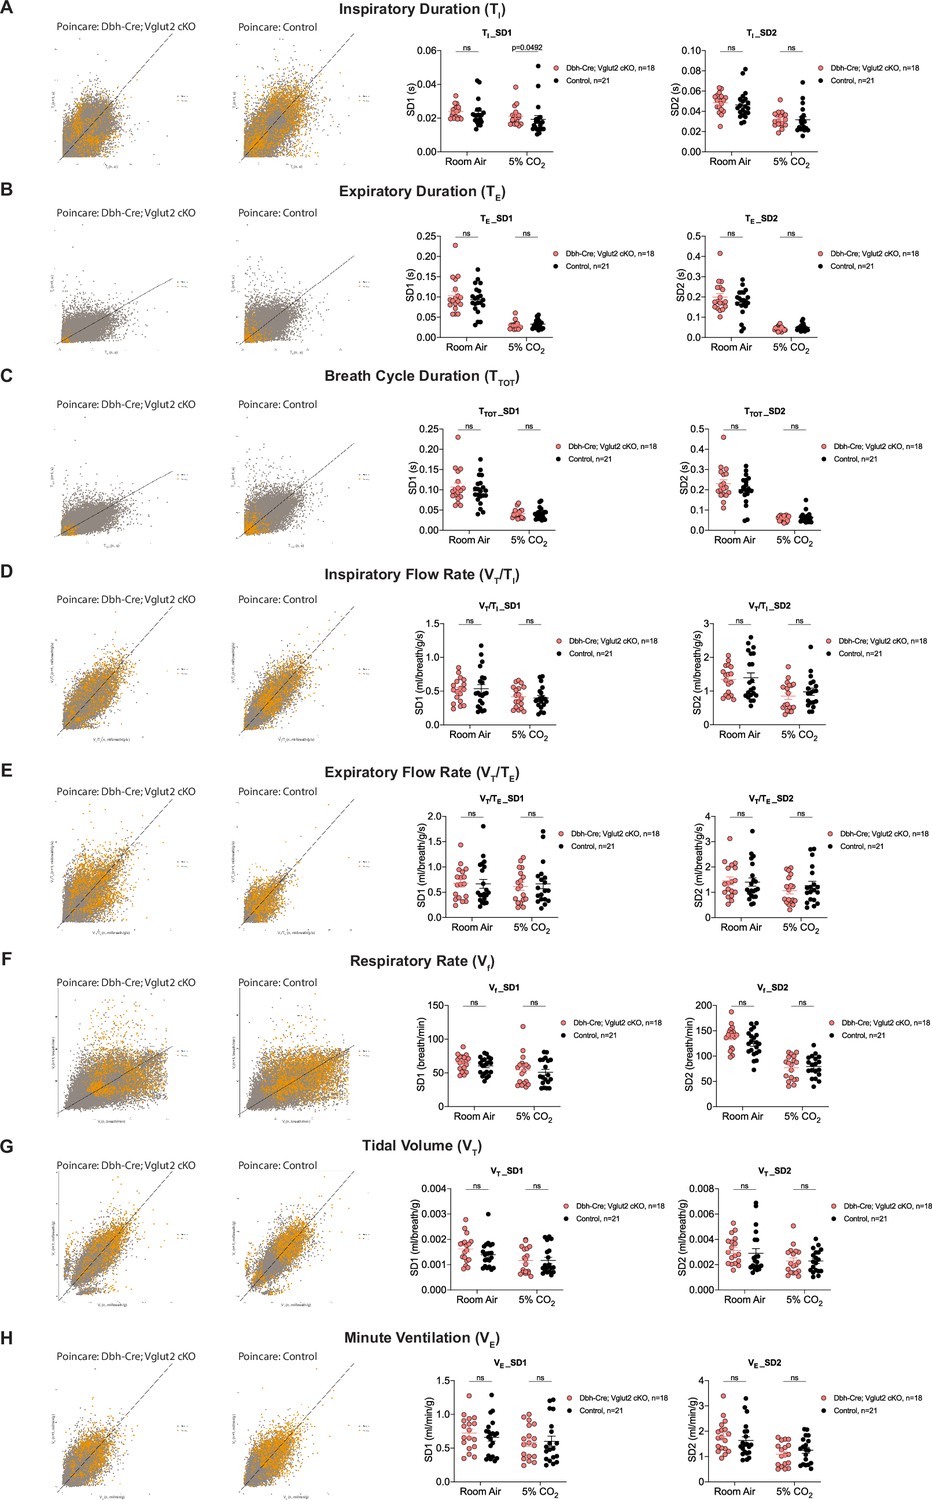
Characterization of dynamic patterns of breathing in Dbh-Cre; Vglut2 cKO mice under room air and hypercapnia (5% CO2).
Poincaré plots and the measurement of SD1 and SD2 of inspiratory duration (TI) (A), expiratory duration (TE) (B), breath cycle duration (TTOT) (C), inspiratory flow rate (VT/TI) (D), expiratory flow rate (VT/TE) (E), respiratory rate (Vf) (F), tidal volume (VT) (G), and minute ventilation (VE) (H) in Dbh-Cre; Vglut2 cKO mice and their littermate controls under room air and 5% CO2 challenge. Mann–Whitney U test, ns: p ≥ 0.05, p value was shown if p < 0.05.
Figure 5 with 1 supplement

Vglut2 conditional knockout in central noradrenergic (NA) neurons fails to alter the majority of hypercapnic ventilation parameters and metabolism under 7% CO2.
(A) Mouse model schematic and experimental protocol including habituation and hypercapnia protocol (7% CO2). (B) Knocking out Vglut2 in the whole NA system failed to alter VE/VO2, Vf, VE, VO2, TI, TE, TTOT, VT/TE but only showed a significantly reduce in VT and VT/TI under 7% CO2 condition. Linear mixed-effects regression model, ****p < 0.0001, **p < 0.01, *p < 0.05, ns: p ≥ 0.05.
Figure 5—figure supplement 1
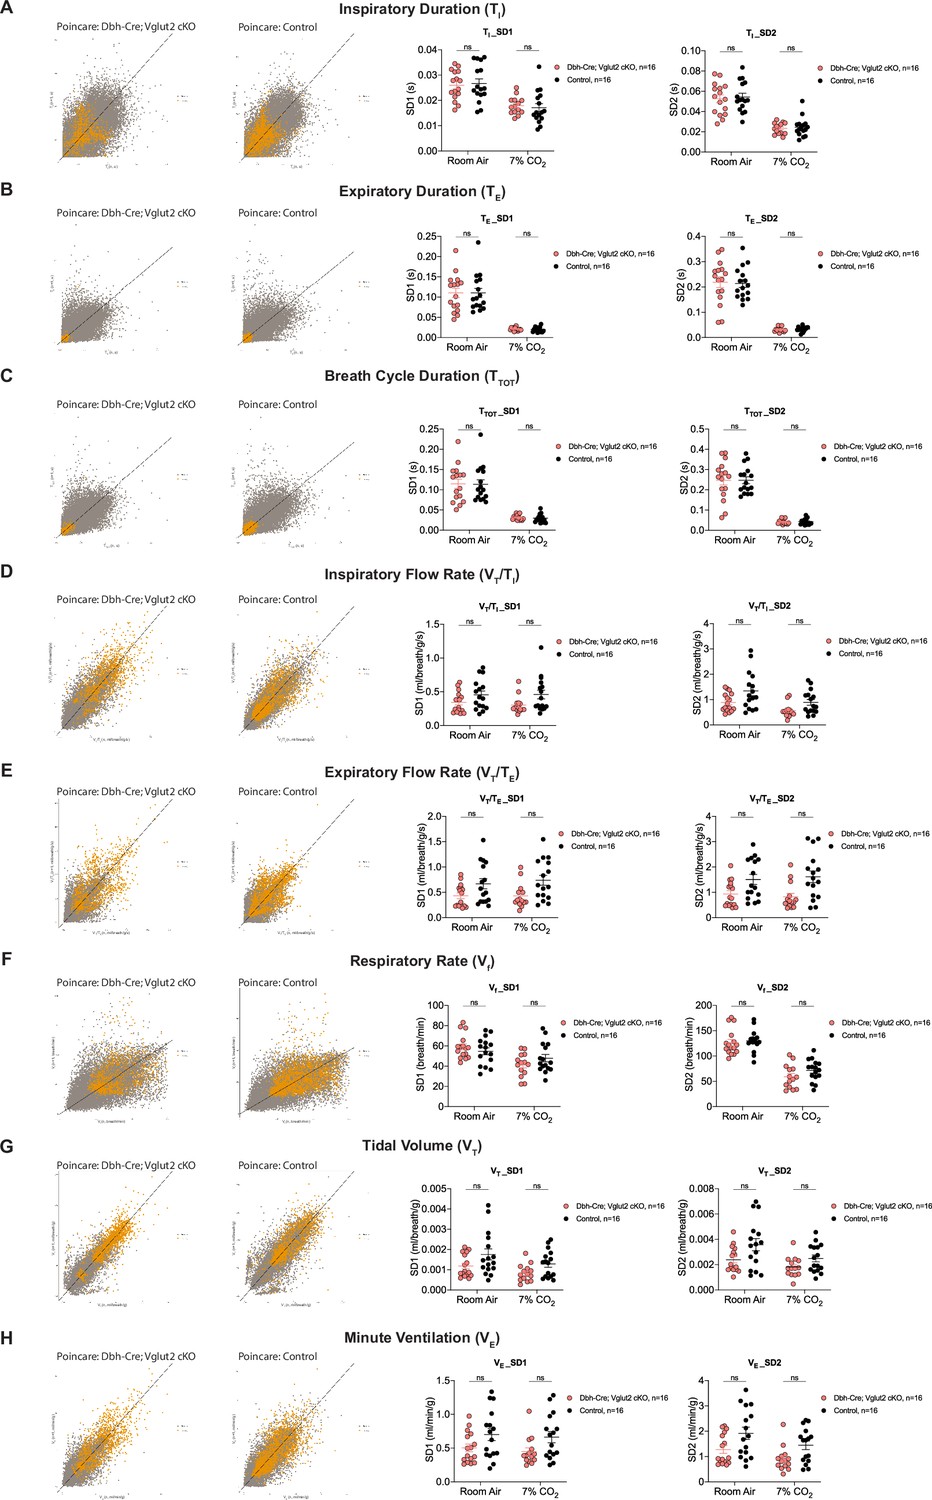
Characterization of dynamic patterns of breathing in Dbh-Cre; Vglut2 cKO mice under room air and hypercapnia (7% CO2).
Poincaré plots and the measurement of SD1 and SD2 of TI (A), TE (B), TTOT (C), VT/TI (D), VT/TE (E), Vf (F), VT (G), and VE (H) in Dbh-Cre; Vglut2 cKO mice and their littermate controls under room air and 7% CO2 challenge. Mann–Whitney U test, ns: p ≥ 0.05, p value was shown if p < 0.05.
Figure 6 with 1 supplement
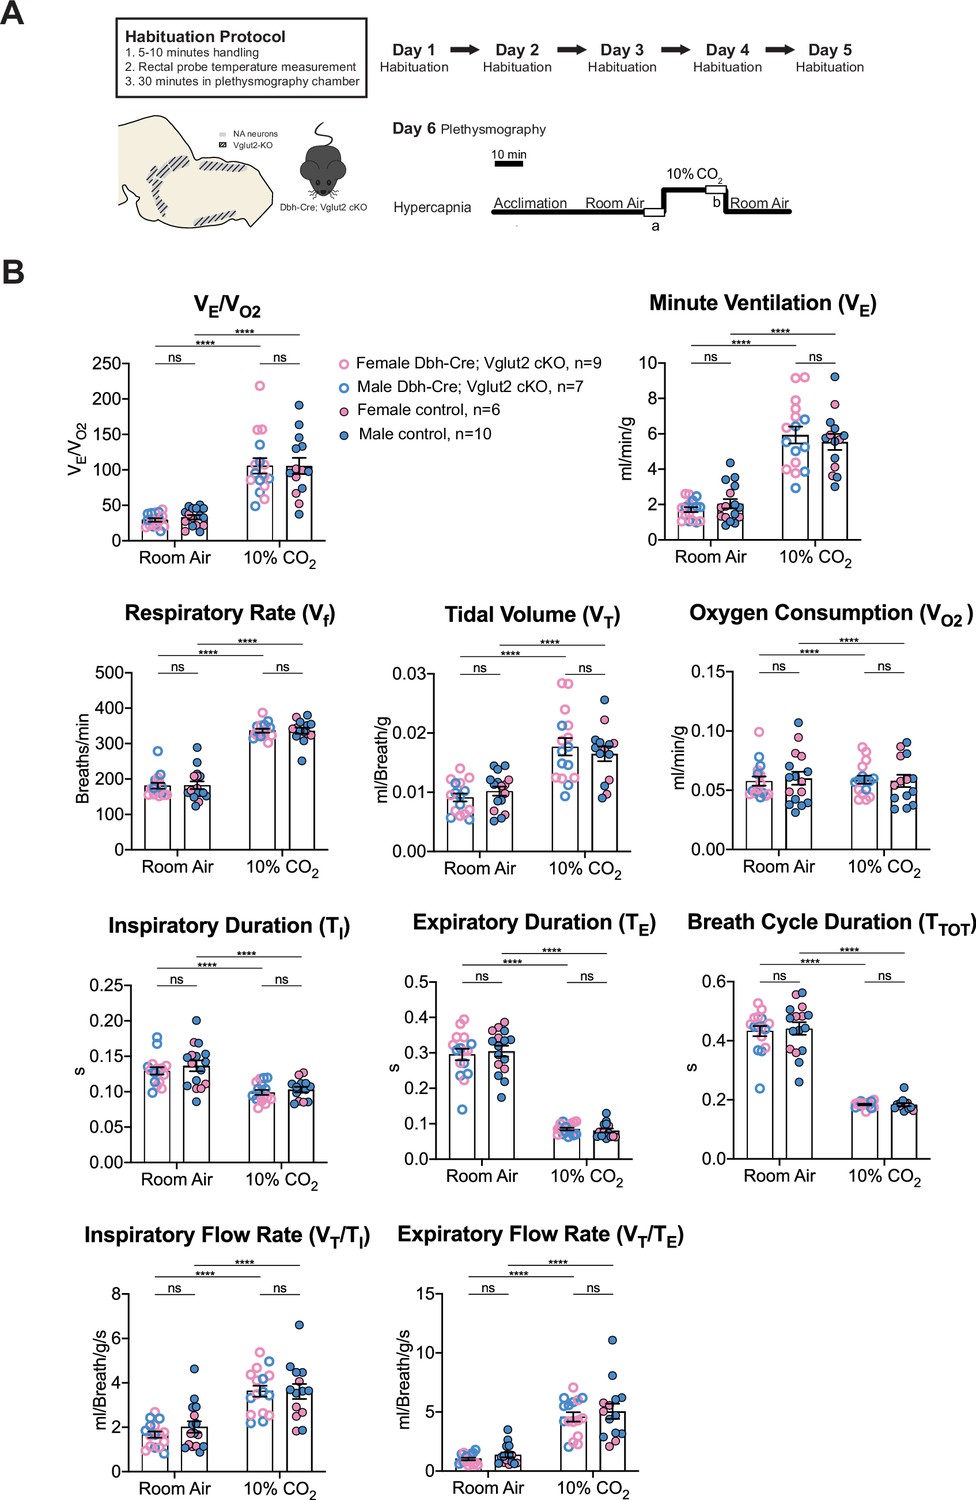
Vglut2 conditional knockout in central noradrenergic (NA) neurons fails to alter the hypercapnic ventilatory reflex (10% CO2).
(A) Mouse model schematic and experimental protocol including habituation and hypercapnia protocol (10% CO2). (B) Knocking out Vglut2 in the whole NA system did not significantly alter VE/VO2, Vf, VT, VE, VO2, TI, TE, TTOT, VT/TI, and VT/TE under 10% CO2 condition. Linear mixed-effects regression model, ****p < 0.0001, ns: p ≥ 0.05.
Figure 6—figure supplement 1
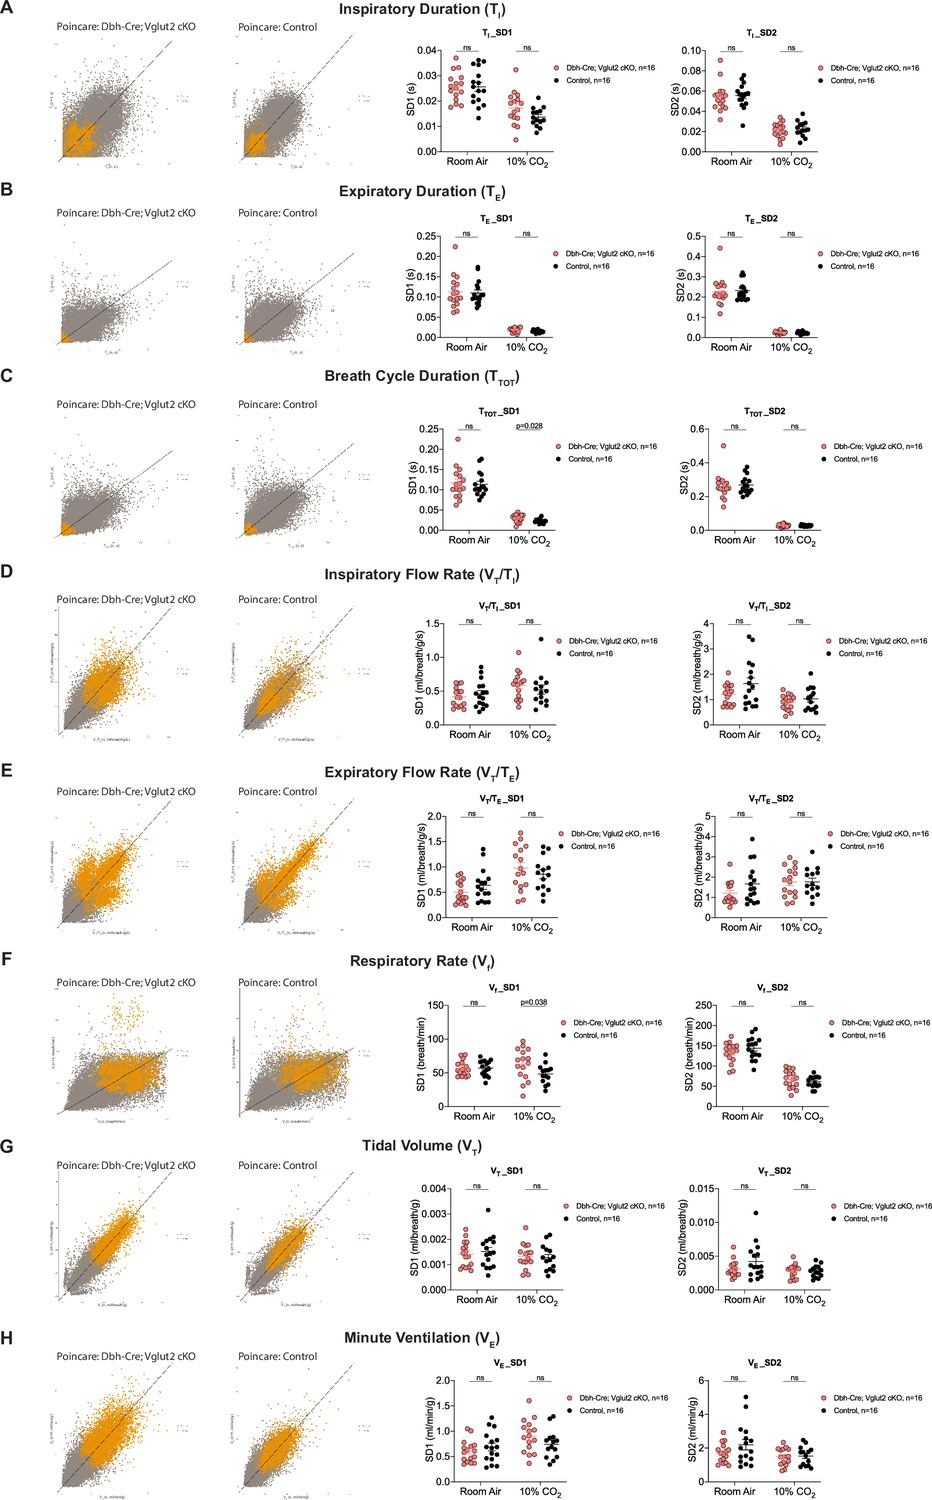
Characterization of dynamic patterns of breathing in Dbh-Cre; Vglut2 cKO mice under room air and hypercapnia (10% CO2).
Poincaré plots and the measurement of SD1 and SD2 of TI (A), TE (B), TTOT (C), VT/TI (D), VT/TE (E), Vf (F), VT (G), and VE (H) in Dbh-Cre; Vglut2 cKO mice and their littermate controls under room air and 10% CO2 challenge. Mann–Whitney U test, ns: p ≥ 0.05, p value was shown if p < 0.05.
Figure 7 with 1 supplement
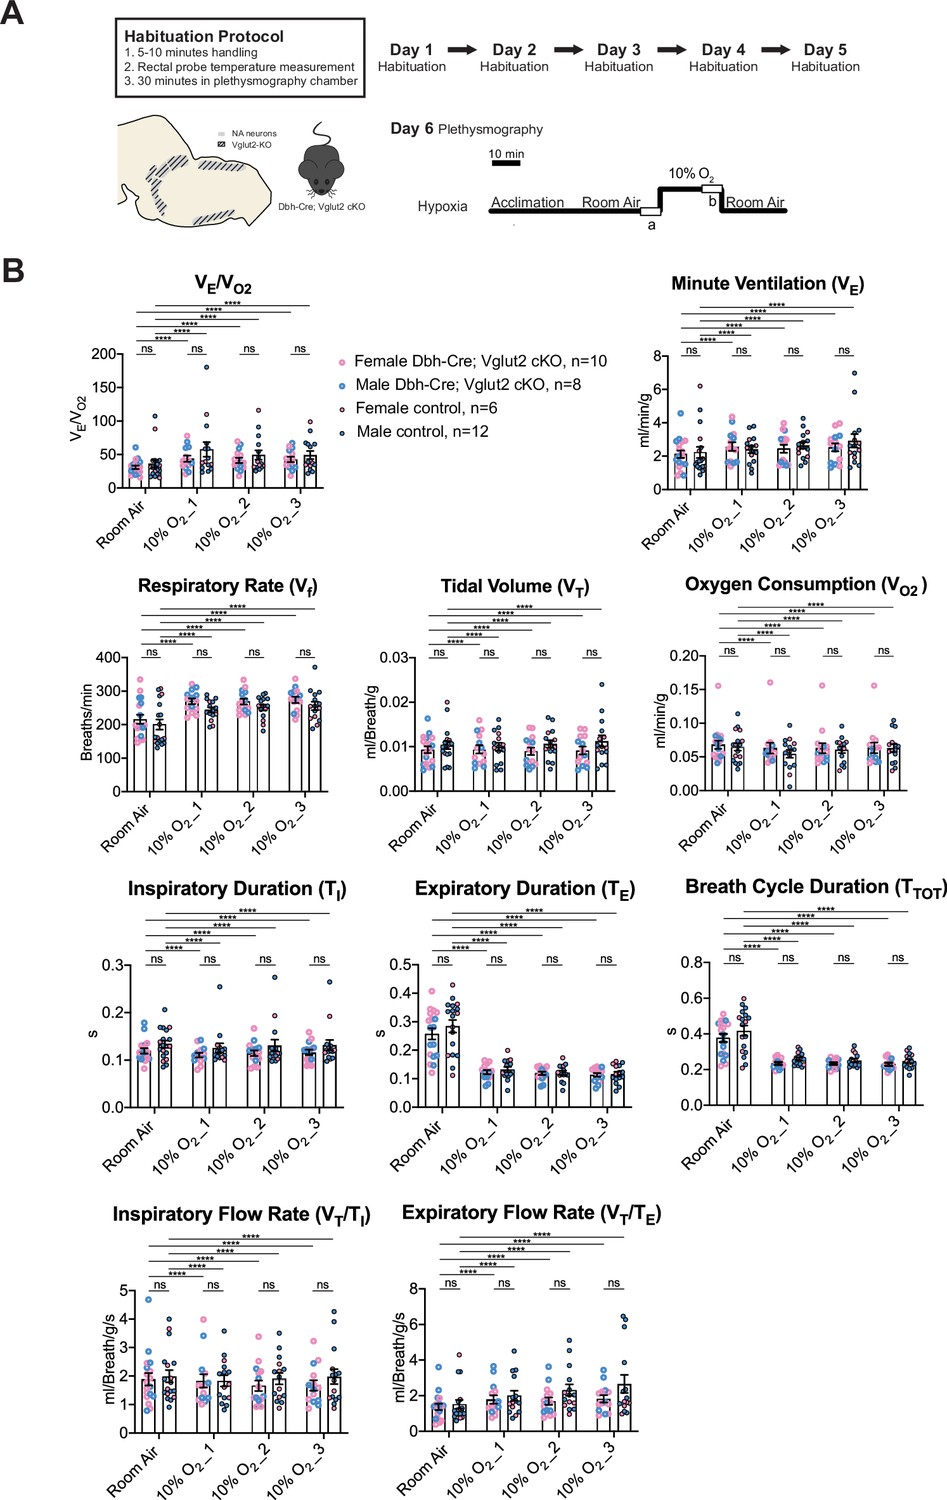
Vglut2 conditional knockout in central noradrenergic (NA) neurons fails to alter the hypoxic ventilatory reflex (10% O2).
(A) Mouse model schematic and experimental protocol including habituation and hypoxia protocol (10% O2). (B) Knocking out Vglut2 in the whole NA system did not show significant breathing changes including VE/VO2, VE, Vf, VT, VO2, TI, TE, TTOT, VT/TI, and VT/TE in either of the three 5-min time periods under hypoxia (10% O2). Linear mixed-effects regression model, ****p < 0.0001, ns: p ≥ 0.05.
Figure 7—figure supplement 1
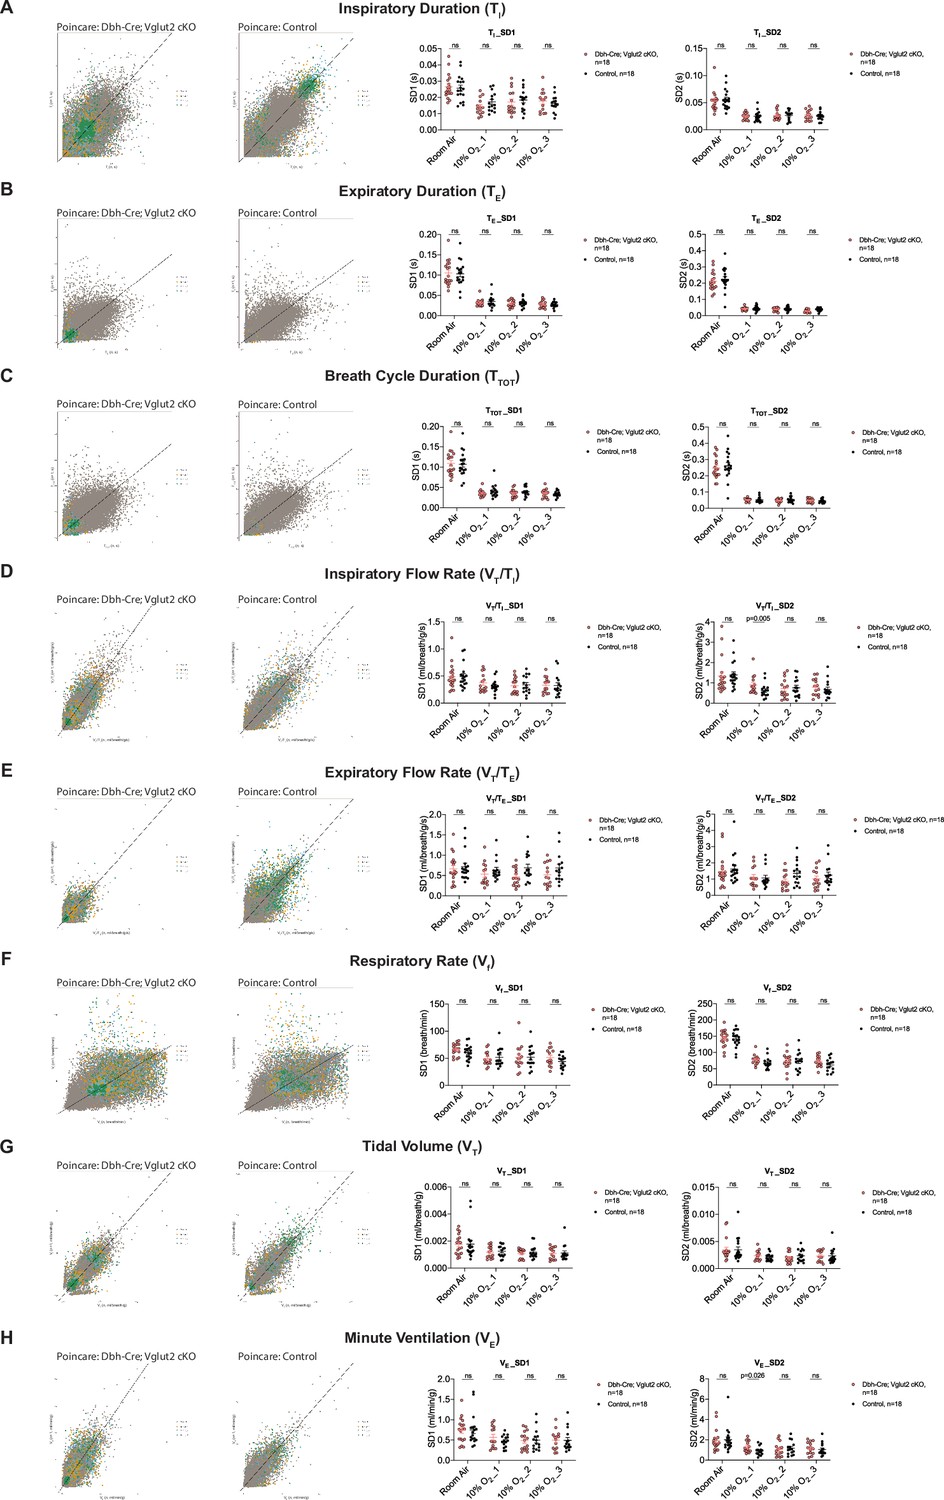
Characterization of dynamic patterns of breathing in Dbh-Cre; Vglut2 cKO mice under room air and hypoxia (10% O2).
Poincaré plots and the measurement of SD1 and SD2 of TI (A), TE (B), TTOT (C), VT/TI (D), VT/TE (E), Vf (F), VT (G), and VE (H) in Dbh-Cre; Vglut2 cKO mice and their littermate controls under room air and 10% O2 challenge. Mann–Whitney U test, ns: p ≥ 0.05, p value was shown if p < 0.05.
Tables
Table 1
Respiratory and metabolic values under room air conditions and the statistical tests.
| Dbh-Cre; Vglut2 cKOMean ± SEM | ControlMean ± SEM | Dbh-Cre; Vglut2 cKO vs. Control linear mixed-effects regression model | |
|---|---|---|---|
| VE/VO2 | 30.01 ± 2.58 | 33.22 ± 3.97 | p = 0.98 |
| Vf (Breaths/min) | 204.08 ± 10.04 | 213.58 ± 15.36 | p = 0.98 |
| VT (ml/Breath/g) | 0.009 ± 0.0007 | 0.009 ± 0.0006 | p = 0.88 |
| VE (ml/min/g) | 1.93 ± 0.14 | 1.98 ± 0.22 | p = 0.995 |
| VO2 (ml/min/g) | 0.067 ± 0.004 | 0.061 ± 0.004 | p = 0.78 |
| TI (s) | 0.117 ± 0.004 | 0.118 ± 0.005 | p = 0.9999 |
| TE (s) | 0.265 ± 0.020 | 0.255 ± 0.021 | p = 0.996 |
| TTOT (s) | 0.381 ± 0.022 | 0.373 ± 0.024 | p = 0.99997 |
| VT/TI (ml/Breath/g/s) | 2.12 ± 0.16 | 2.33 ± 0.26 | p = 0.996 |
| VT/TE (ml/Breath/g/s) | 1.43 ± 0.19 | 1.85 ± 0.39 | p = 0.99 |
Table 2
Respiratory and metabolic values under 5% CO2 conditions and the statistical tests.
| Dbh-Cre; Vglut2 cKOMean ± SEM | ControlMean ± SEM | Dbh-Cre; Vglut2 cKO vs. Control linear mixed-effects regression model | |
|---|---|---|---|
| VE/VO2 | 47.99 ± 3.28 | 58.60 ± 5.44 | p = 0.33 |
| Vf (Breaths/min) | 246.72 ± 9.78 | 261.66 ± 14.00 | p = 0.24 |
| VT (ml/Breath/g) | 0.011 ± 0.0007 | 0.010 ± 0.0008 | p = 0.81 |
| VE (ml/min/g) | 2.67 ± 0.20 | 2.80 ± 0.32 | p = 0.98 |
| VO2 (ml/min/g) | 0.057 ± 0.003 | 0.051 ± 0.005 | p = 0.42 |
| TI (s) | 0.119 ± 0.004 | 0.118 ± 0.007 | p = 0.62 |
| TE (s) | 0.135 ± 0.005 | 0.136 ± 0.007 | p = 0.42 |
| TTOT (s) | 0.255 ± 0.009 | 0.254 ± 0.013 | p = 0.32 |
| VT/TI (ml/Breath/g/s) | 2.32 ± 0.21 | 2.45 ± 0.25 | p = 0.99 |
| VT/TE (ml/Breath/g/s) | 2.17 ± 0.21 | 2.27 ± 0.25 | p = 0.91 |
Table 3
Respiratory and metabolic values under 7% CO2 conditions and the statistical tests.
| Dbh-Cre; Vglut2 cKOMean ± SEM | ControlMean ± SEM | Dbh-Cre; Vglut2 cKO vs. Control linear mixed-effects regression model | |
|---|---|---|---|
| VE/VO2 | 58.48 ± 4.29 | 74.70 ± 6.22 | p = 0.23 |
| Vf (Breaths/min) | 262.69 ± 12.82 | 284.44 ± 10.59 | p = 0.98 |
| VT (ml/Breath/g) | 0.011 ± 0.0011 | 0.015 ± 0.0012 | p = 0.023* |
| VE (ml/min/g) | 2.90 ± 0.32 | 4.23 ± 0.43 | p = 0.16 |
| VO2 (ml/min/g) | 0.051 ± 0.004 | 0.059 ± 0.006 | p = 0.64 |
| TI (s) | 0.114 ± 0.005 | 0.112 ± 0.007 | p = 0.90 |
| TE (s) | 0.128 ± 0.008 | 0.111 ± 0.005 | p = 0.69 |
| TTOT (s) | 0.242 ± 0.012 | 0.223 ± 0.009 | p = 0.81 |
| VT/TI (ml/Breath/g/s) | 1.93 ± 0.22 | 2.96 ± 0.33 | p = 0.0016** |
| VT/TE (ml/Breath/g/s) | 1.86±0.25 | 3.18 ± 0.41 | p = 0.075 |
-
**p < 0.01, *p < 0.05.
Table 4
Respiratory and metabolic values under 10% CO2 conditions and the statistical tests.
| Dbh-Cre; Vglut2 cKOMean ± SEM | ControlMean ± SEM | Dbh-Cre; Vglut2 cKO vs. Control linear mixed-effects regression model | |
|---|---|---|---|
| VE/VO2 | 105.77 ± 10.80 | 105.69 ± 11.51 | p = 0.9996 |
| Vf (Breaths/min) | 336.31 ± 5.26 | 336.38 ± 8.52 | p = 0.9997 |
| VT (ml/Breath/g) | 0.018 ± 0.0015 | 0.016 ± 0.0012 | p = 0.98 |
| VE (ml/min/g) | 5.94 ± 0.48 | 5.54 ± 0.45 | p = 0.9996 |
| VO2 (ml/min/g) | 0.059 ± 0.003 | 0.058 ± 0.005 | p = 0.9999999 |
| TI (s) | 0.099 ± 0.003 | 0.103 ± 0.004 | p = 0.97 |
| TE (s) | 0.085 ± 0.004 | 0.081 ± 0.006 | p = 0.63 |
| TTOT (s) | 0.184 ± 0.003 | 0.184 ± 0.005 | p = 0.995 |
| VT/TI (ml/Breath/g/s) | 3.62 ± 0.25 | 3.61 ± 0.34 | p = 0.9995 |
| VT/TE (ml/Breath/g/s) | 4.59 ± 0.39 | 5.06 ± 0.65 | p = 0.86 |
Table 5
Respiratory and metabolic values under 10% O2 conditions and the statistical tests.
| Dbh-Cre; Vglut2 cKOMean ± SEM | ControlMean ± SEM | Linear mixed-effects regression model | Dbh-Cre; Vglut2 cKOMean ± SEM | ControlMean ± SEM | Linear mixed-effects regression model | Dbh-Cre; Vglut2 cKOMean ± SEM | ControlMean ±SEM | Linear mixed-effects regression model | |
|---|---|---|---|---|---|---|---|---|---|
| 10% O2_1 | 10% O2_2 | 10% O2_3 | |||||||
| VE/VO2 | 43.79 ± 4.57 | 57.75 ± 10.88 | p=0.99 | 41.30 ± 3.85 | 49.36±6.93 | p=0.99 | 42.82±3.97 | 49.19±6.02 | p=0.99 |
| Vf (Breaths/min) | 269.71 ± 8.49 | 243.89 ± 7.64 | p=0.67 | 268.38 ± 8.40 | 251.15 ± 8.67 | p=0.83 | 273.96 ± 9.31 | 255.84 ± 12.19 | p=0.80 |
| VT (ml/Breath/g) | 0.009 ± 0.0009 | 0.010 ± 0.0009 | p=0.89 | 0.009 ± 0.0008 | 0.011 ± 0.0009 | p=0.85 | 0.009 ± 0.0009 | 0.011 ± 0.0013 | p=0.64 |
| VE (ml/min/g) | 2.58 ± 0.25 | 2.40 ± 0.21 | p=0.999998 | 2.45 ± 0.24 | 2.65 ± 0.21 | p=0.9998 | 2.53 ± 0.24 | 2.92 ± 0.41 | p=0.998 |
| VO2 (ml/min/g) | 0.063 ± 0.008 | 0.055 ± 0.006 | p=0.995 | 0.063 ± 0.007 | 0.061 ± 0.005 | p=0.9998 | 0.064 ± 0.008 | 0.063 ± 0.006 | p=0.99999999 |
| TI (s) | 0.111 ± 0.005 | 0.126 ± 0.010 | p=0.44 | 0.115 ± 0.006 | 0.131 ± 0.012 | p=0.51 | 0.116 ± 0.006 | 0.132 ± 0.011 | p=0.44 |
| TE (s) | 0.123 ± 0.007 | 0.133 ± 0.009 | p=0.995 | 0.119 ± 0.006 | 0.121 ± 0.008 | p=0.9999 | 0.114 ± 0.007 | 0.117 ± 0.008 | p=0.9997 |
| TTOT (s) | 0.234 ± 0.007 | 0.259 ± 0.009 | p=0.53 | 0.234 ± 0.007 | 0.252 ± 0.009 | p=0.75 | 0.230 ± 0.008 | 0.248 ± 0.011 | p=0.69 |
| VT/TI (ml/Breath/g/s) | 1.83 ± 0.23 | 1.83 ± 0.20 | p=0.9999 | 1.66 ± 0.19 | 1.91 ± 0.20 | p=0.998 | 1.67 ± 0.18 | 1.98 ± 0.26 | p=0.99 |
| VT/TE (ml/Breath/g/s) | 1.79 ± 0.24 | 2.00 ± 0.29 | p=0.9994 | 1.69 ± 0.21 | 2.32 ± 0.32 | p=0.99 | 1.83 ± 0.21 | 2.67 ± 0.51 | p=0.98 |
Additional files
-
Supplementary file 1
Vglut2 positive innervations from central noradrenergic neurons to the brain nuclei important in breathing control.
- https://cdn.elifesciences.org/articles/88673/elife-88673-supp1-v1.docx
-
MDAR checklist
- https://cdn.elifesciences.org/articles/88673/elife-88673-mdarchecklist1-v1.docx
Download links
A two-part list of links to download the article, or parts of the article, in various formats.
Downloads (link to download the article as PDF)
Open citations (links to open the citations from this article in various online reference manager services)
Cite this article (links to download the citations from this article in formats compatible with various reference manager tools)
Vglut2-based glutamatergic signaling in central noradrenergic neurons is dispensable for normal breathing and chemosensory reflexes
eLife 12:RP88673.
https://doi.org/10.7554/eLife.88673.4


