Periaqueductal gray activates antipredatory neural responses in the amygdala of foraging rats
- Department of Psychology, University of Washington, United States
- Department of Psychiatry and Behavioral Sciences, University of Washington, United States
- Department of Brain and Cognitive Sciences, Scranton College, Ewha Womans University, Republic of Korea
- Brain Disease Research Institute, Ewha Brain Institute, Ewha Womans University, Republic of Korea
- Program in Neuroscience, University of Washington, United States
Figures
Figure 1 with 1 supplement
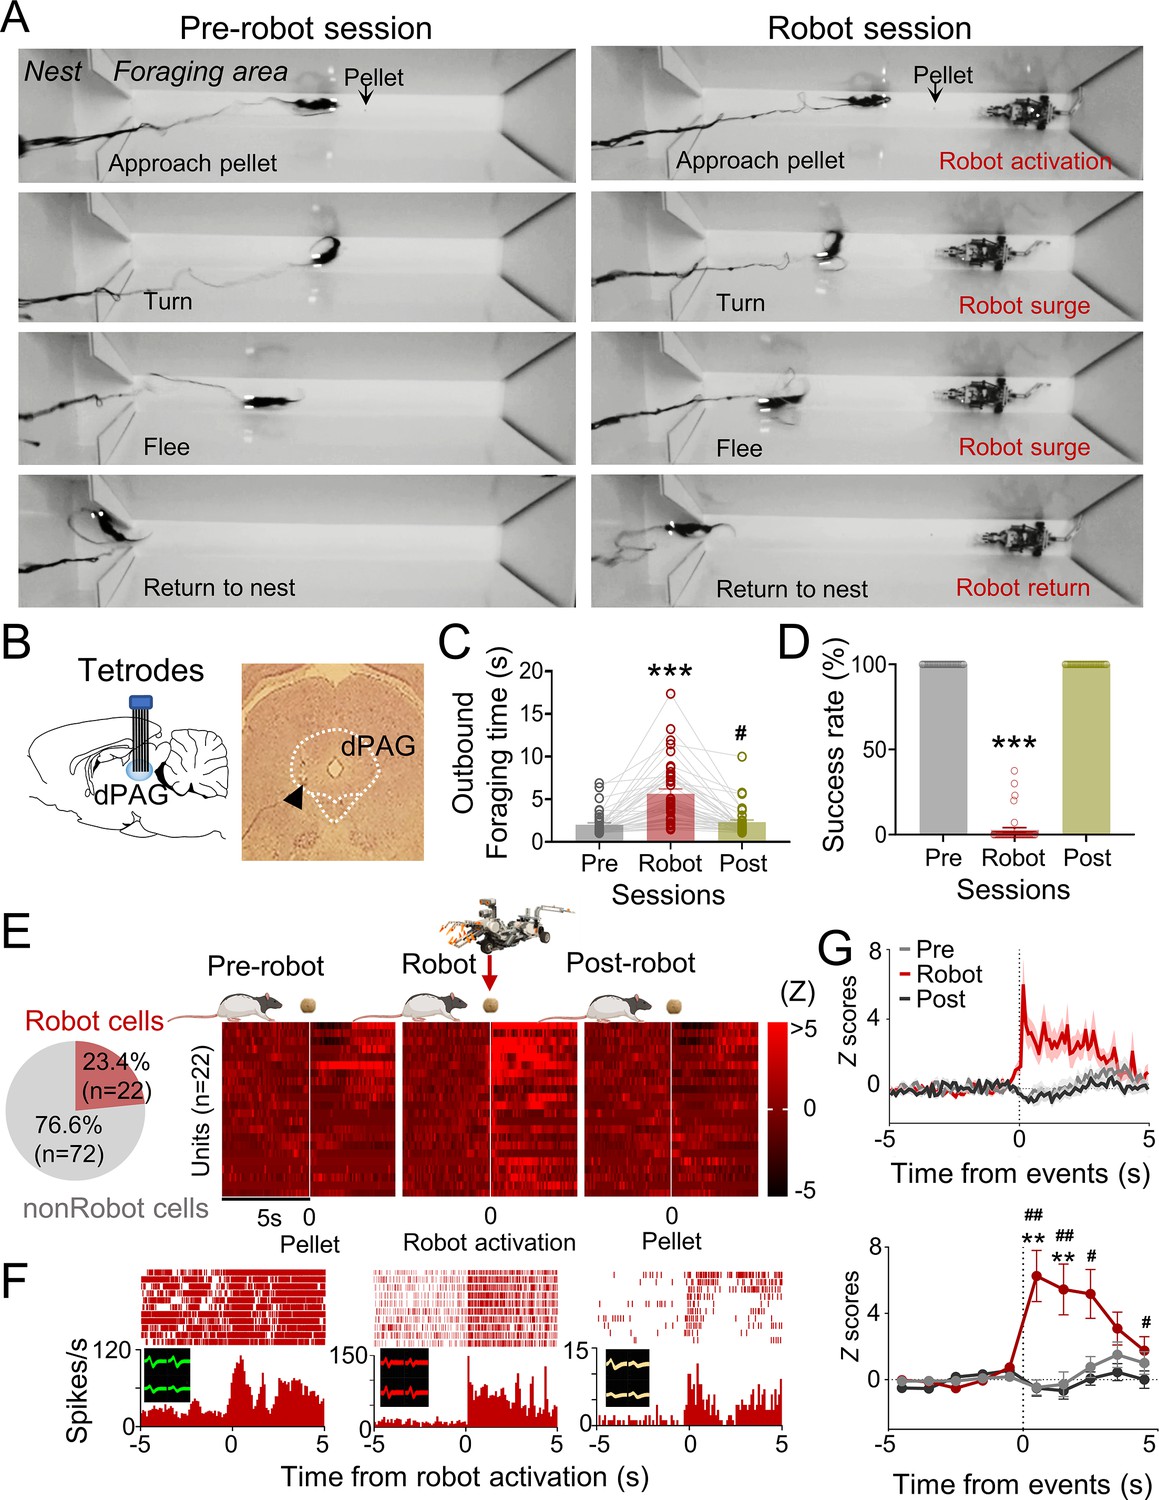
Dorsal periaqueductal gray (dPAG) single-unit recordings during risky foraging.
(A) Rats underwent pre-robot, robot, and post-robot sessions, successfully securing pellets in pre- and post-robot trials, and failing during robot trials due to robot interference. (B) Tetrode implantation in dPAG with a photomicrograph of the tip (arrowhead). (C) Outbound foraging time increased significantly in the robot session (Χ2 = 64.00, p<0.0001, Friedman test; ps<0.05 for all comparisons, Dunn’s test, n = 42 recording days from 5 rats). ***p<0.001 compared to pre-robot and post-robot sessions. #p<0.05 compared to the pre-robot session. (D) The pellet success rate significantly decreased during robot session (Χ2 = 84.00, p<0.0001, Friedman test; ps<0.0001 for all comparisons, Dunn’s test, n = 42 recording days from 5 rats). ***p<0.001 compared to pre-robot and post-robot sessions. (E) Cell-type proportions revealed that 23.4% cells responded to robot activation (robot cells). (F) Representative dPAG robot cell raster/event histograms aligned with robot activations. (G) Population activity of robot cells around the time of robot activation (t = 0) with 0.1 s and 1 s bins. Firing rates of the robot cells were higher during robot session (0–3 s blocks; Friedman test, all Χ2s > 6.952, all ps<0.05; Dunn’s test, all ps<0.05, n = 22 units). Shaded areas indicate SEM. **p<0.01 compared to pre-robot session. #, ##, and ### denote p<0.05, p<0.01, and p<0.001, respectively, compared to post-robot session. Panel (E) created with BioRender.com, and published using a CC BY-NC-ND license with permission.
© 2024, BioRender Inc. Figure 1E was created using BioRender, and is published under a CC BY-NC-ND 4.0. Further reproductions must adhere to the terms of this license.
Figure 1—figure supplement 1
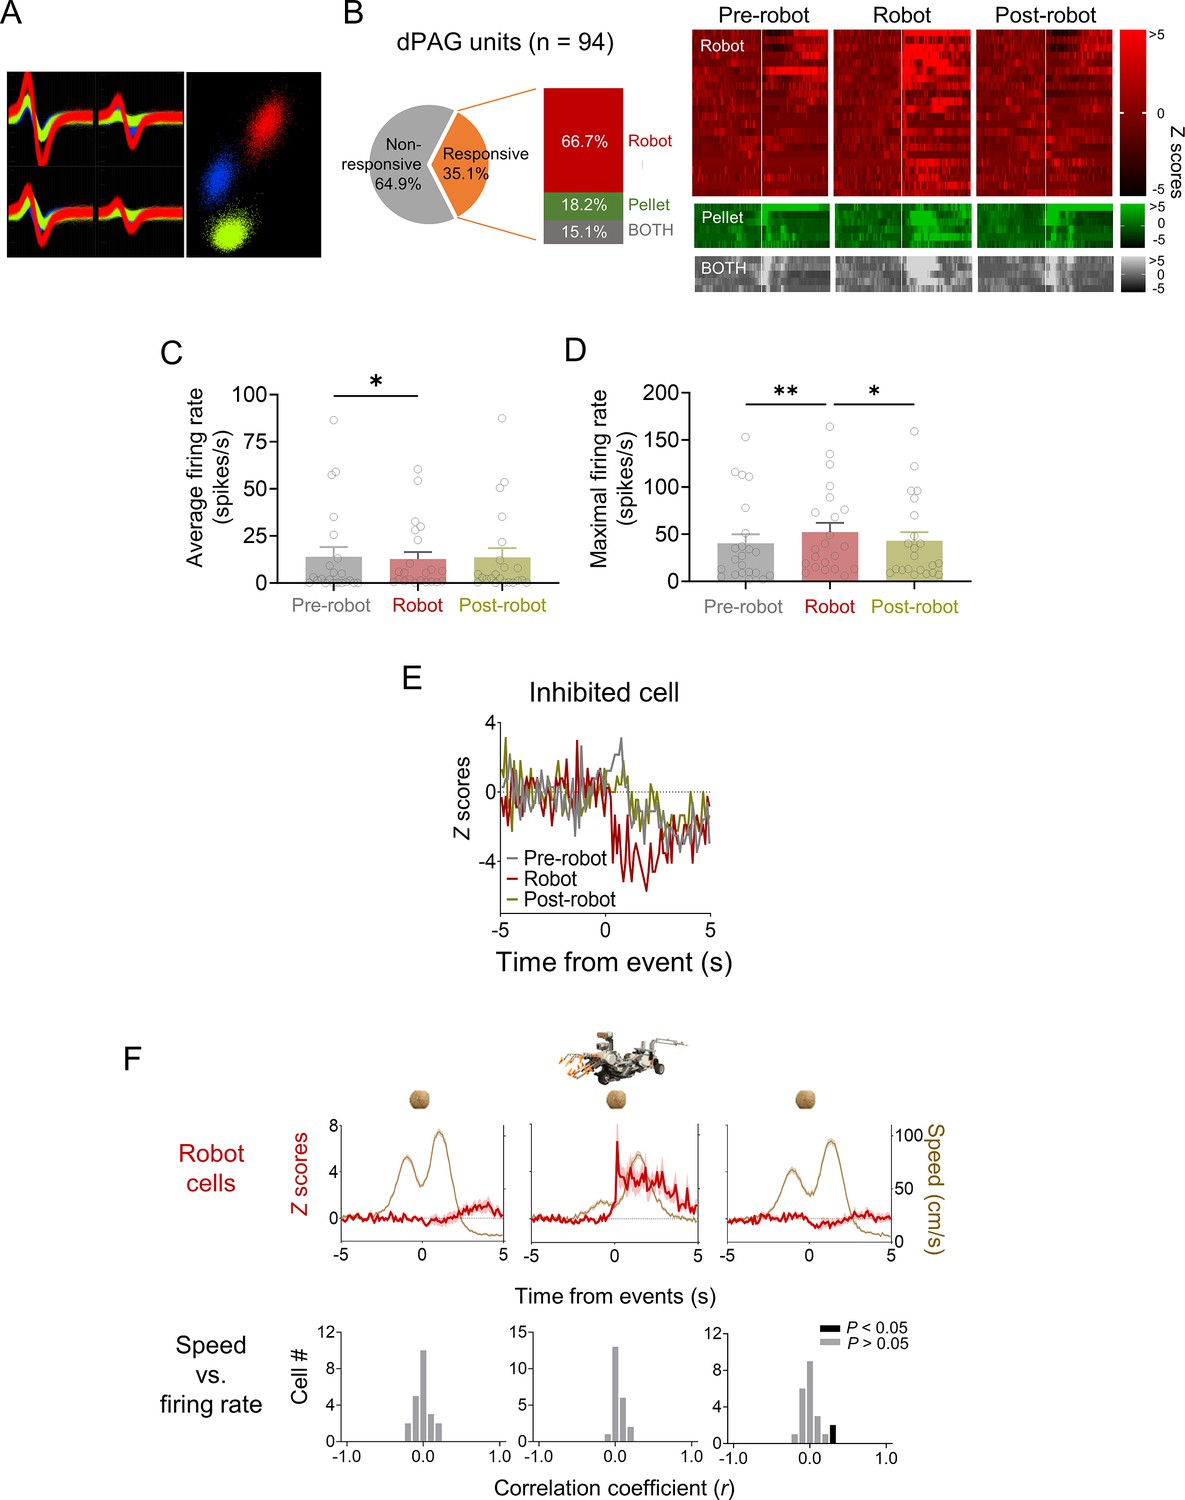
Dorsal periaqueductal gray (dPAG) unit cell types.
(A) Representative multiple single units recorded in the dPAG. (B) A subset (35.1%) of dPAG neurons showed increased firing rates in response to the robot, food pellet, or both, with 66.7% responding exclusively to the robot. Units were categorized based on z-score responses: ‘robot cells’ for z > 3 during robot phase and z < 3 during pre-robot phase; ‘pellet cells’ for z > 3 during pre-robot phase and z < 3 during robot phase; and ‘BOTH cells’ for z > 3 in both phases. Raster plots display activity of robot, pellet, and BOTH cells across pre-robot, robot, and post-robot sessions. (C, D) Average (C) and maximum (D) firing rates of dPAG robot cells during pre-robot, robot, and post-robot sessions (average firing rate: Χ2 = 7.636, p<0.05, Friedman test, p<0.05, Pre-robot vs. Robot, Dunn’s test, n = 22 units; maximum firing rate: Χ2 = 12.29, p<0.01, Friedman test; p<0.05, Pre-robot vs. Robot, Dunn’s test, n = 22 units). (E) One neuron showed decreased firing rates (z –3) in response to the robot during the robot phase. (F) Top row: mean firing rate (± SEM; shaded areas) of robot cells and movement speed (± SEM; shaded areas) of animals across sessions (n = 22 units). Bottom row: correlation coefficients between firing rate and movement speed for the robot cell group during each session. * and ** denote p<0.05 and p<0.01, respectively.
Figure 2 with 1 supplement
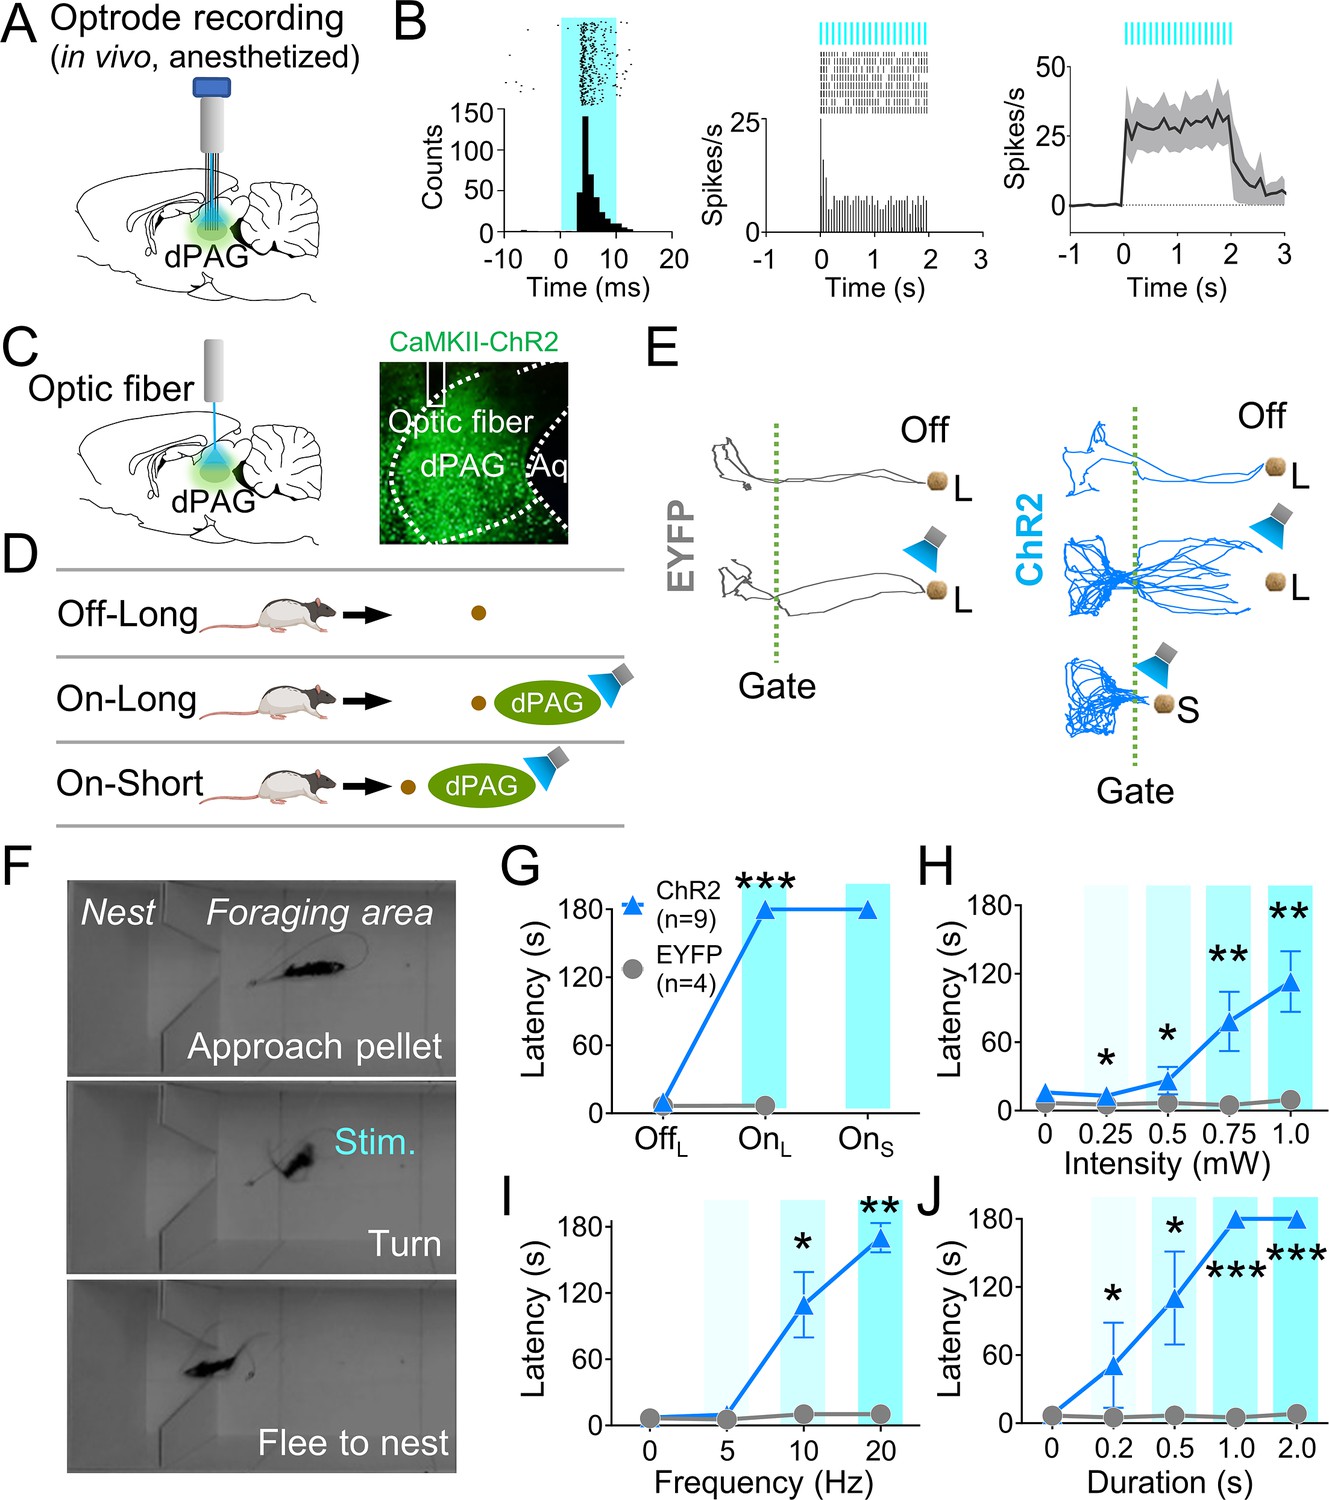
Dorsal periaqueductal gray (dPAG) optical stimulation evokes fear.
(A) Virus injection, optrode implantation in dPAG, and light stimulation during single-unit recordings in anesthetized rats. (B) Raster plots and peri-event time histograms for 20 Hz light stimulations (10 ms width, left; 2 s duration, center). 48% of 25 units had increased firing during 2 s light stimulation (right). (C) Virus injection, expression, and optic fiber placement in dPAG. (D) Stimulation testing: baseline trials at 75 cm distance (long) without light; stimulation trials with 2 s light as the rat approached (~25 cm) long pellet; light applied as the rat approached 25 cm (short) pellet if long pellet unsuccessful. (E) Representative trajectories for EYFP- and ChR2-expressing rats during stimulation testing. (F) Rat behaviors during light stimulation trials. (G) ChR2 (n = 9) rats showed increased latency to procure pellet upon opto-stimulation (OnL) compared to EYFP (n = 4) rats (OffL, Z = 1.013, p=0.311; OnL, U = 0.0, p<0.001; Mann–Whitney U test). (H–J) ChR2 group (n = 9) exhibited increased latency to procure pellet compared to EYFP group (n = 4) based on stimulation intensity (H; Us <for all intensities < 3.5, ps for all intensities <0.025; Mann–Whitney U test), frequency (I; Us for 10 Hz and 20 Hz <2.5, ps for 10 and 20 Hz <0.014; Mann–Whitney U test), and duration (J; Us for all durations <4.5, ps for all durations <0.032; Mann–Whitney U test). *, **, and *** denote p<0.05, p<0.01, and p<0.001, respectively. Panel D created with BioRender.com, and published using a CC BY-NC-ND license with permission.
© 2024, BioRender Inc. Figure 2D was created using BioRender, and is published under a CC BY-NC-ND 4.0. Further reproductions must adhere to the terms of this license.
Figure 2—figure supplement 1
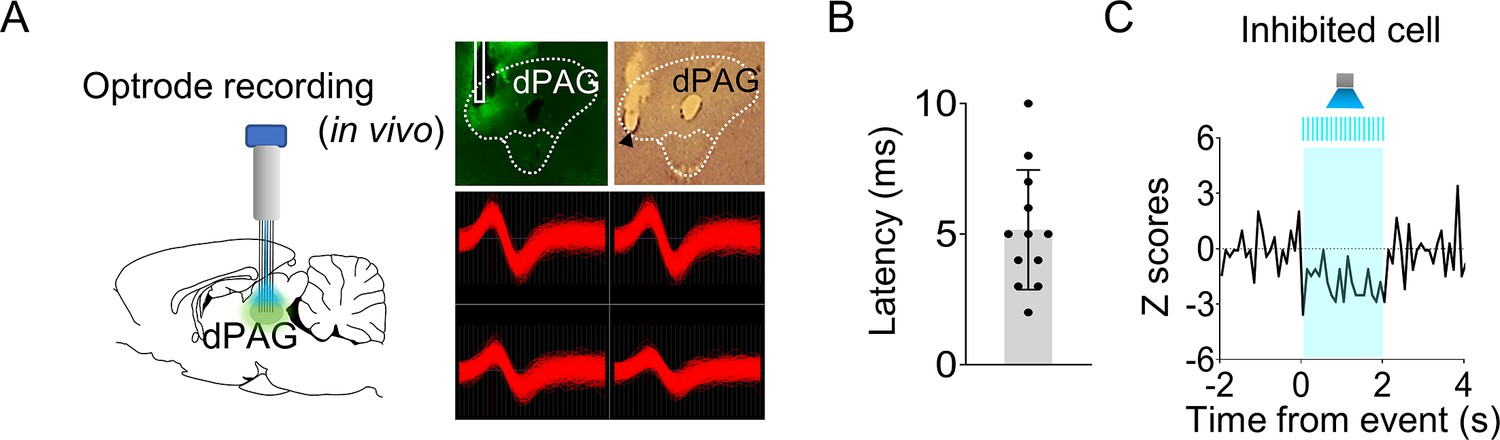
Optrode recording in the dorsal periaqueductal gray (dPAG).
(A) Virus injection and optrode implantation targeted at the dPAG (left). Photomicrographs display virus expression, optic fiber/electrode tips, and a representative dPAG neuron (right). Light stimulation was applied during single-unit recordings in anesthetized rats. (B) Response latencies of stimulation-responsive dPAG cells (n = 12 cells). (C) A single dPAG cell exhibited inhibited responses to optical stimulation of the dPAG.
Figure 3 with 2 supplements
Dorsal periaqueductal gray (dPAG) optical stimulation and amygdala recordings.
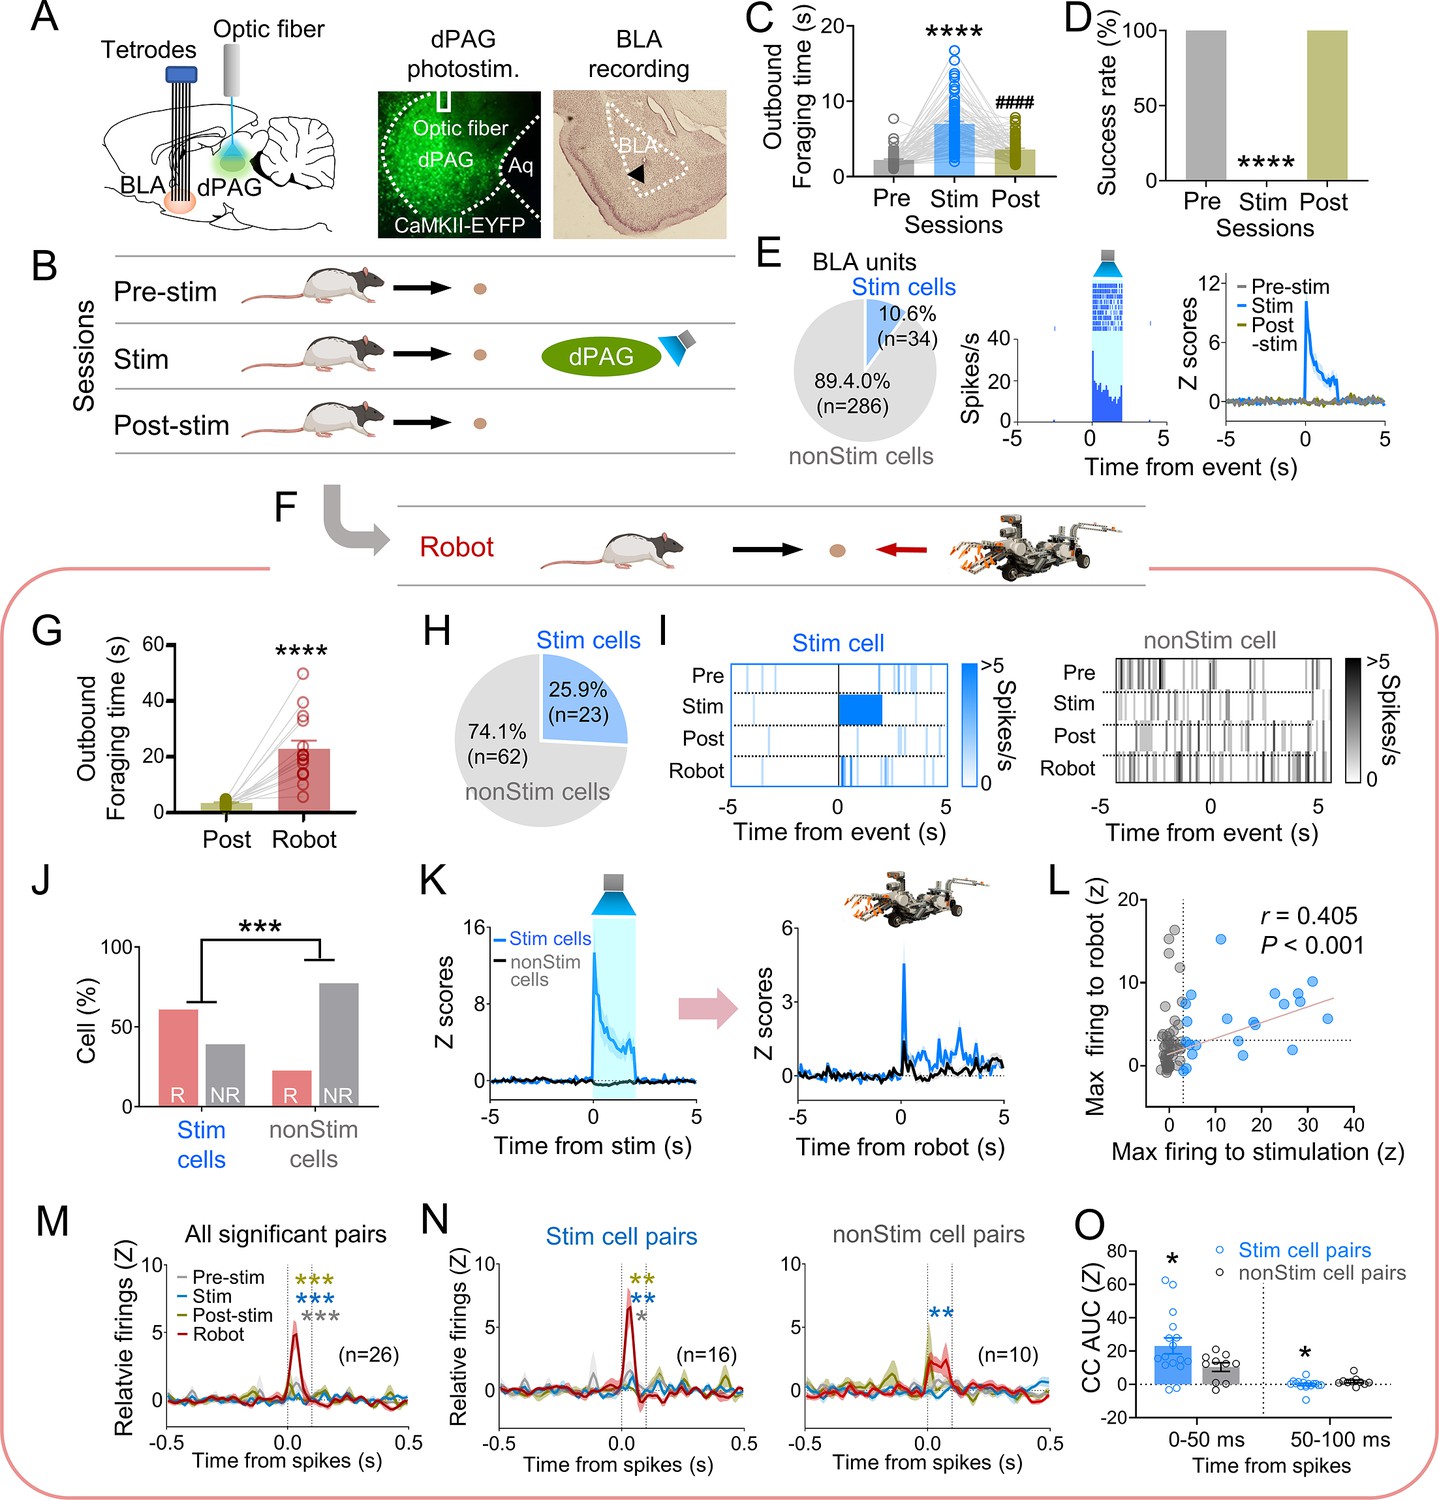
(A) Virus injection in dPAG and tetrode array implantation targeting basolateral amygdala (BLA). Light stimulation during single-unit recordings in freely moving rats. (B) Stimulation testing sessions: in pre- and post-stim trials, rats freely procured pellets; in stim trials, optical stimulation prevented procurement of pellets. (C, D) During dPAG stimulation, animals showed increased outbound foraging time (C; Χ2 = 117.8, p<0.0001, Friedman test; ps<0.0001, Dunn’s test, n = 78 recording days from 7 rats) and decreased success rate (D; Χ2 = 154.0, p<0.0001, Friedman test; ps<0.0001, Dunn’s test, n = 78 recording days from 7 rats). ****p<0.0001 compared to pre-robot and post-robot sessions. ####p<0.0001 compared pre-robot session. (E) Subset of BLA units (10.0%) responsive to optical stimulation (Stim cells; left), and a representative (center) and all stimulation-responsive (Stim cells; right; n = 320 cells) raster plots with peri-event time histograms (PETHs). (F) Subset of animals (n = 3 rats) underwent additional robot trials following the post-stim session. (G) Increased outbound foraging time during robot session compared to post-stimulation session (t(15) = 6.655, p<0.0001; paired t-test; 16 recording days from 3 rats). ****p<0.0001. (H) Twenty-two BLA units were dPAG stimulation-responsive. (I) Representative raster plots of dPAG stimulation-responsive and -nonresponsive units. (J) Proportions of robot vs. non-robot cells differed between stimulation-responsive and -nonresponsive units (Χ2 = 11.134, p<0.001; chi-square test). ***p<0.001. (K) PETHs of stim (n = 23 cells) and non-stim cells (n = 62 cells) during stimulation and robot sessions. (L) Relationship between maximal firing rates during first 500 ms subsequent to robot activation and maximal firing rates during first 500 ms after stimulation onset (r(85) = 0.405, p<0.001; Pearson correlation). (M) Population cross-correlograms (CCs) with significant synchrony during robot session (n = 26 CCs) were higher than other sessions. Dotted vertical lines indicate 0–100 ms window for testing significance. Gray, blue, and dark yellow ***p<0.001 compared to pre-stimulation, stimulation, and post-stimulation sessions, respectively. (N) Among synchronized BLA cell pairs, those including dPAG stimulation-responsive cell(s) (stim pairs; 61.5%; n = 16 pairss) showed increased correlated firings (area under the curve [AUC] during 0–100 ms window) during the robot session compared to other sessions. In contrast, synchronized BLA cell pairs that consisted of stimulation nonresponsive cells only (n = 10 pairs) showed no AUC differences across sessions. Gray *, blue **, and dark yellow **p<0.05 compared to pre-stimulation, p<0.01 compared to stimulation, and p<0.001 compared to post-stimulation sessions, respectively. (O) Comparing CCs during testing windows (0–50 ms and 50–100 ms) between stim (n = 16) and non-stim pairs (n = 10), stim pairs exhibited higher correlated firing than non-stim pairs during the 0–50 ms block (t(21.99) = 2.342, p=0.0286; t-test), while displaying decreased correlated firings in the second block (50–100 ms; U = 42, p=0.045; Mann–Whitney U test). *p<0.05 compared to the non-stim pairs. Panels B and F created with BioRender.com, and published using a CC BY-NC-ND license with permission.
© 2024, BioRender Inc. Figure 3B was created using BioRender, and is published under a CC BY-NC-ND 4.0. Further reproductions must adhere to the terms of this license.
© 2024, BioRender Inc. Figure 3F was created using BioRender, and is published under a CC BY-NC-ND 4.0. Further reproductions must adhere to the terms of this license.
Figure 3—figure supplement 1
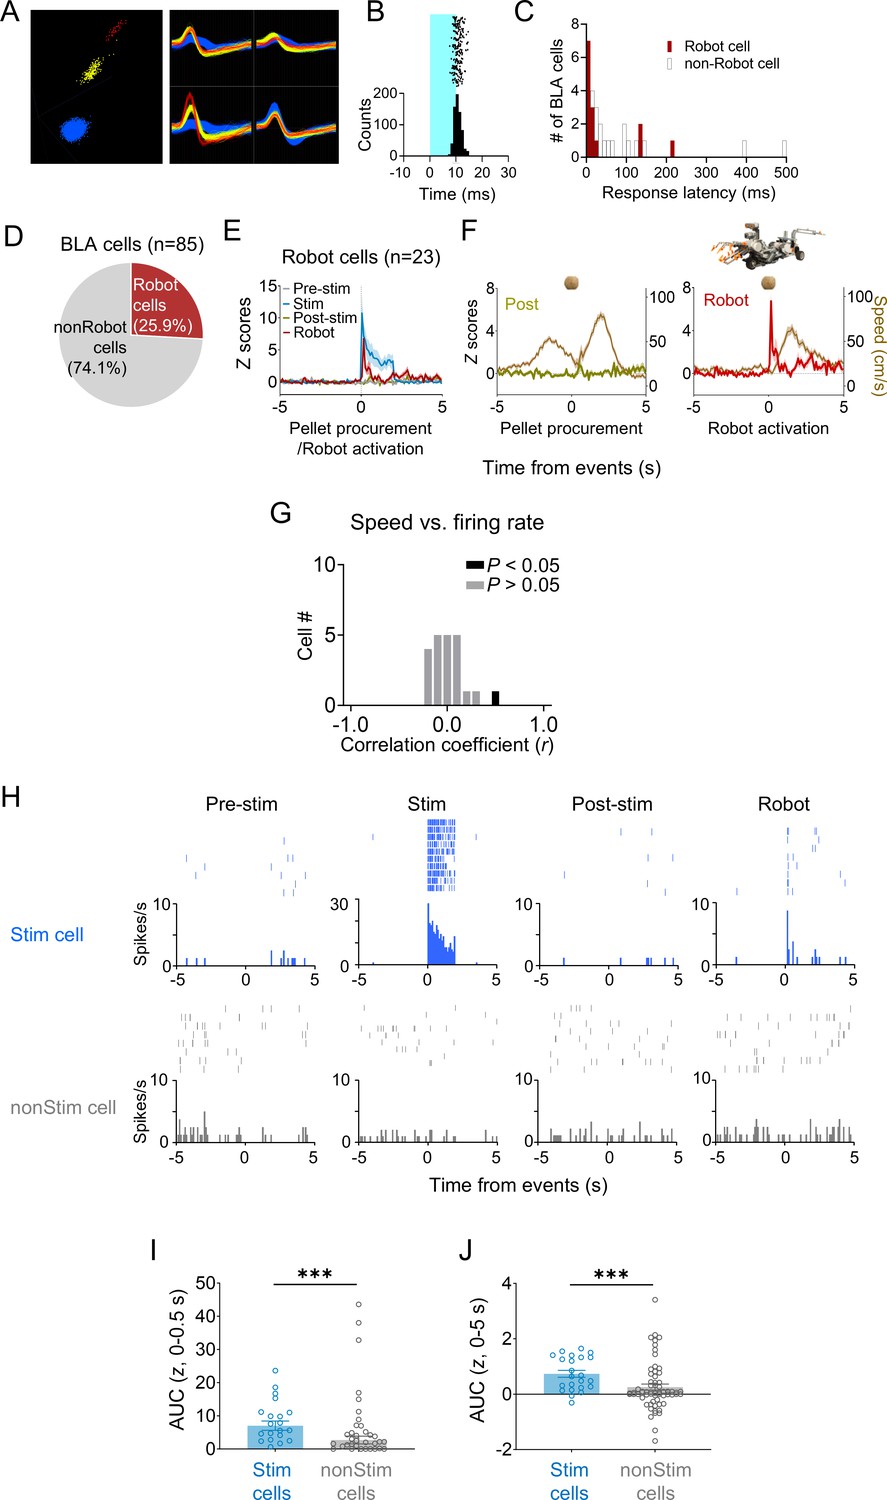
Characteristics of basolateral amygdala (BLA) cells.
(A) Representative waveforms of BLA cells. (B) A representative raster plot and peri-event time histograms for 20 Hz light stimulations (10 ms pulse width, 2 s duration). (C) Response latencies of BLA cells to dorsal periaqueductal gray (dPAG) stimulation. (D) Out of 85 units from the BLA, 25.9% immediately responded to the robot. (E) A pre-event time histogram aligning BLA activity (n = 23) with pellet procurement (pre-stim and post-stim sessions), dPAG stimulation (stim session), or robot activation (robot session). (F) Firing rates of robot cells and movement speeds during pellet procurement (post-robot session) and robot activation (robot sessions). (G) All but one BLA cell showed no significant correlation between firing rate and movement speed. (H) Representative raster plots and peri-event time histograms for a dPAG stimulation-responsive BLA cell reacting to the robot predator (top; also see Figure 3I, left column) and a dPAG stimulation-nonresponsive BLA cell (bottom; also see Figure 3I, right column). (I, J) dPAG stimulation-responsive units (n = 23) showed higher levels of robot-evoked firings than stimulation-nonresponsive units (n = 62) during both short (I; 0–0.5 s post-robot activation; U = 339.0, p=0.0001; Mann–Whitney U test) and extended (J; 0–5 s post-robot activation; U = 384.5, p=0.0009; Mann–Whitney U test) periods. *** denotes p<0.001 compared to the non-stim pairs.
Figure 3—figure supplement 2
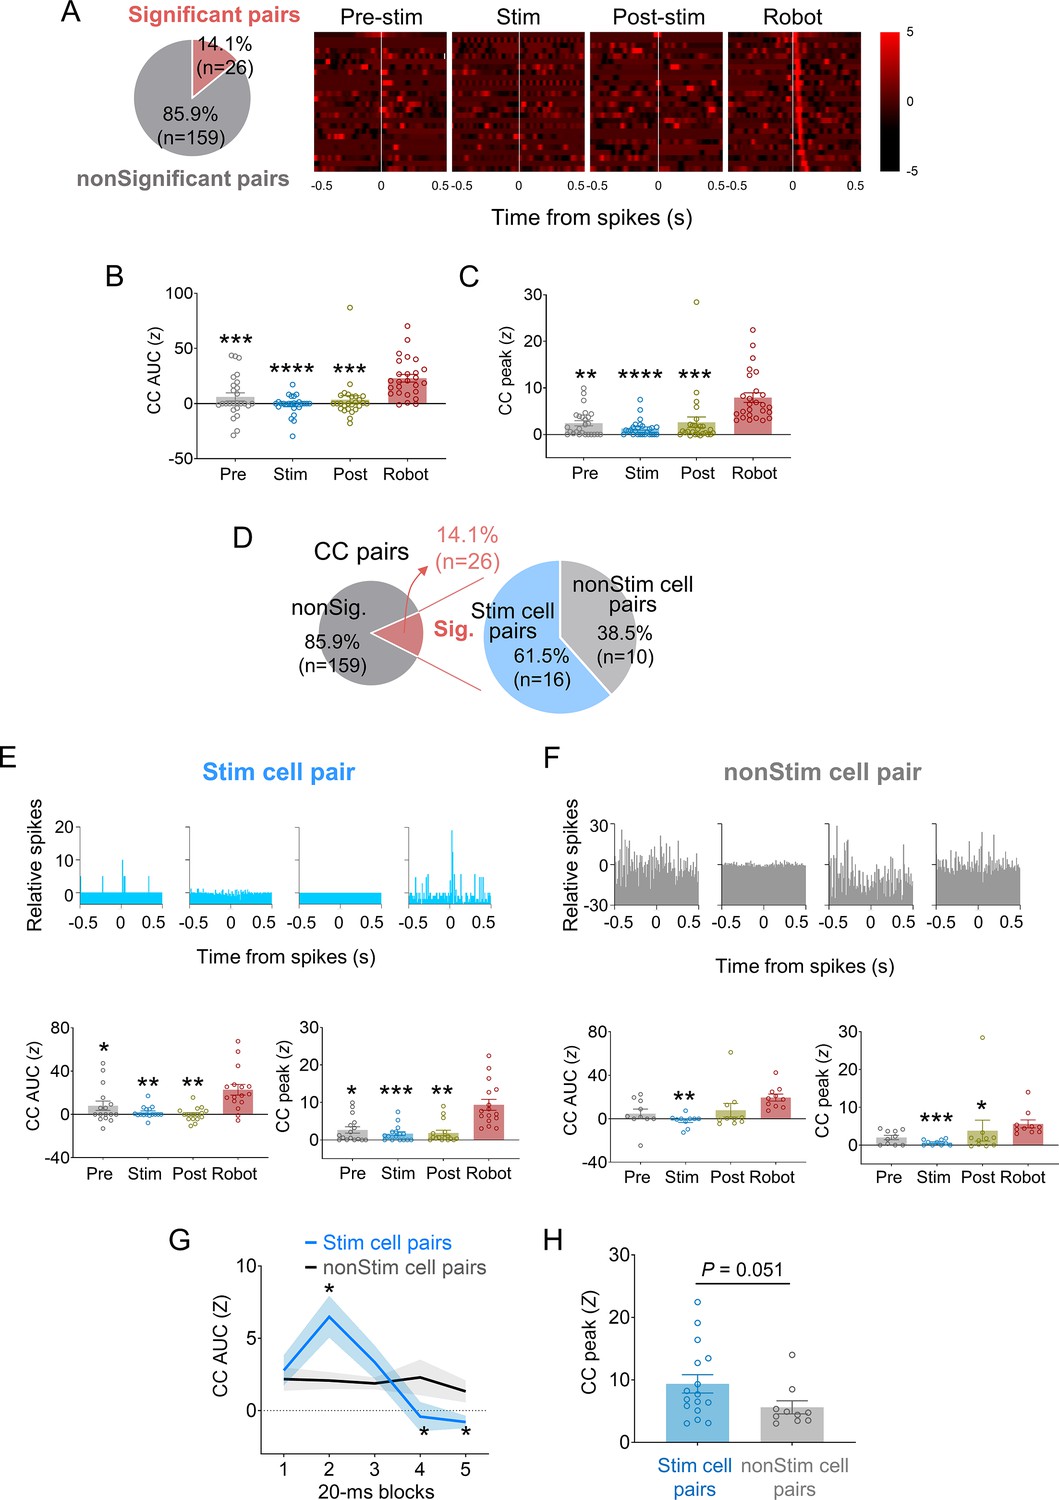
Spike synchrony in dorsal periaqueductal gray (dPAG)-stimulated basolateral amygdala (BLA) neurons under predatory threats.
(A) Of 185 cross-correlograms (CCs) from simultaneously recorded BLA neuron pairs, 14.1% exhibited significant peaks (z > 3) during robot sessions. (B, C) Mean CC area under the curve (AUC) (B) and CC peak values (C) increased during robot sessions compared to other sessions (Zs > 29.36, p<0.0001, Friedman test; ps<0.01 for pre-stimulation vs. robot, stimulation vs. robot, and post-stimulation vs. robot sessions comparisons, Dunn’s test; n = 26 pairs). **, ***, and **** denote p<0.01, p<0.001, and p<0.0001 compared to robot session, respectively. (D) Among BLA cell pairs with significant synchrony during robot sessions, 61.5% included dPAG-stimulated BLA cells (stim pairs) and 38.5% did not (non-stim pairs). (E) Stim pairs (top, a representative pair) showed enhanced spike synchrony during robot sessions, with higher mean CC AUC (bottom left) and peak (bottom right) values compared to other sessions (Zs > 17.42, p<0.001, Friedman test; ps<0.037 for pre-stimulation vs. robot, stimulation vs. robot, and post-stimulation vs. robot sessions comparisons, Dunn’s test; n = 16 pairs). *, **, and *** denote p<0.05, p<0.01, and p<0.001 compared to the robot session, respectively. (F) Non-stim pairs (top, a representative pair) also displayed significant synchrony during robot sessions, with no difference in CC AUC (bottom left) between robot and pellet-only sessions, but higher peak area during robot vs. stimulation session (Z = 13.84, p<0.01, Friedman test; p=0.0017 for the stimulation vs. robot sessions comparison, Dunn’s test; n = 10 pairs). CC peak (bottom right) during robot session was higher than during stimulation and post-stimulation sessions (Z = 15.92, p<0.01, Friedman test; ps<0.0335 for stimulation vs. robot and post-stimulation vs. robot sessions comparisons, Dunn’s test), but not the pre-stimulation session. *, **, and *** denote p<0.05, p<0.01, and p<0.001 compared to the robot session, respectively. (G) Stim pairs (n = 16) had higher correlated firing than non-stim pairs (n = 10) during the 20–40 ms post-fire period (U = 32, p=0.011; Mann–Whitney U test) but lower during the 60–100 ms window (Us < 37, ps<0.023; Mann–Whitney U test). *denotes p<0.05 compared to the non-stim pairs. (H) CC peaks of stim pairs during the robot session tended to be higher than those of non-stim pairs (U = 43.0, p=0.051; Mann–Whitney U test).
Figure 4 with 1 supplement
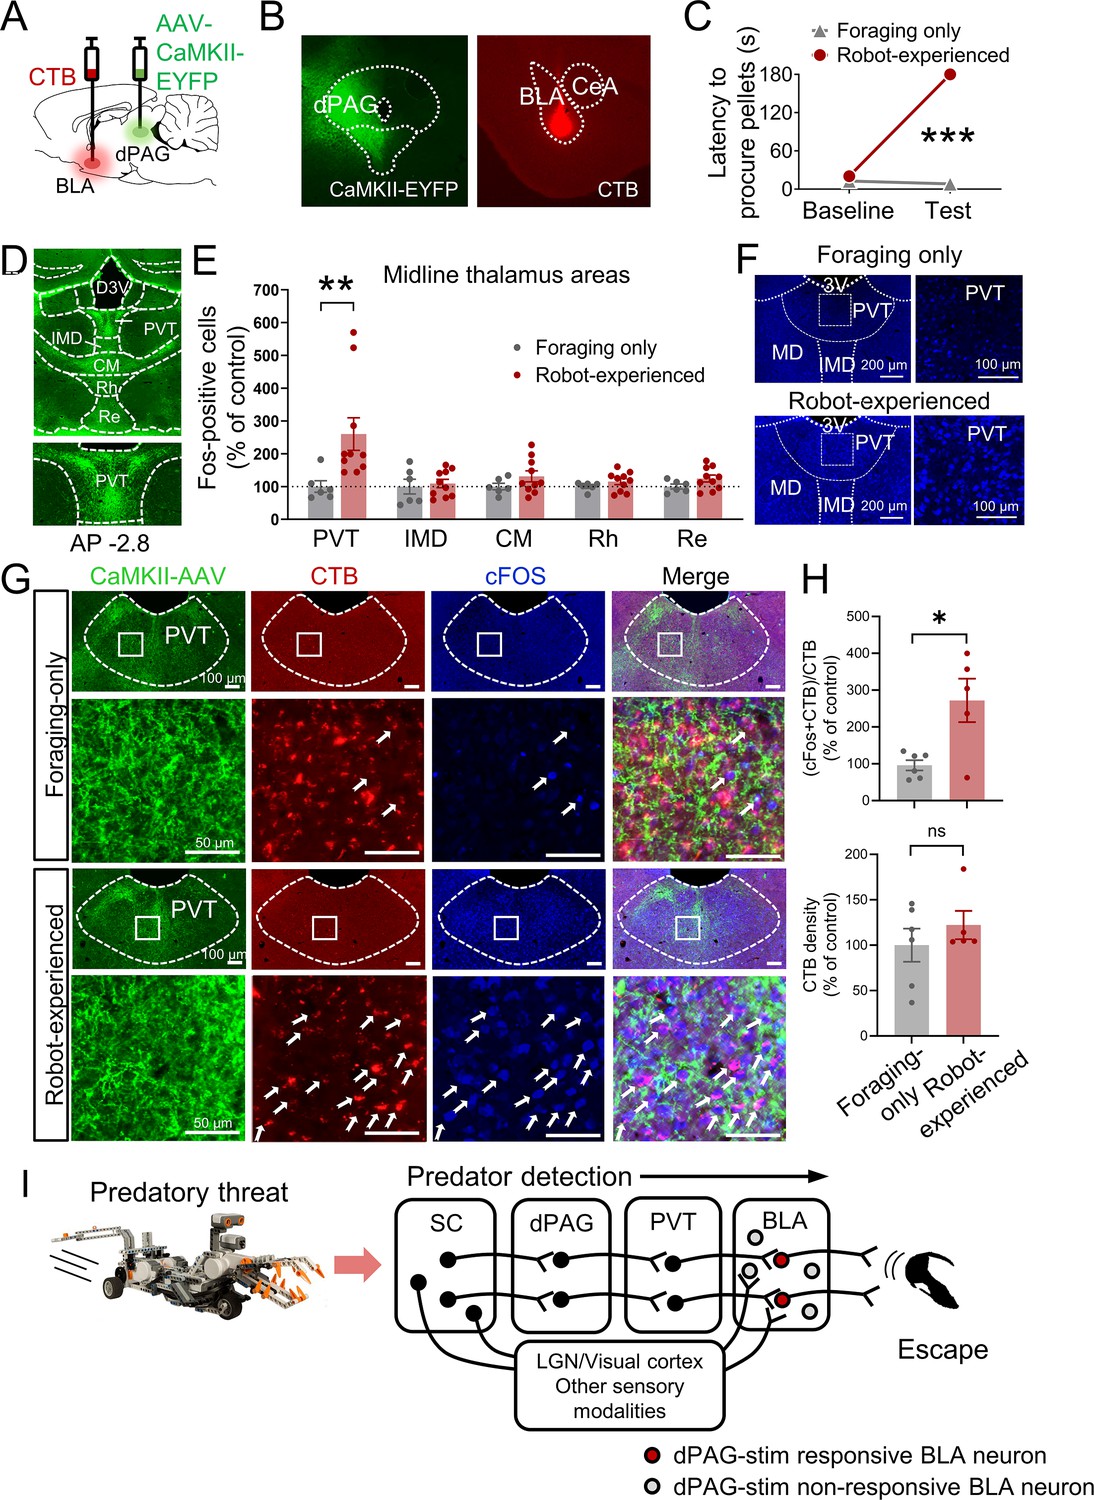
Paraventricular nucleus of the thalamus’ (PVT) hypothesized role in dorsal periaqueductal gray (dPAG) to amygdala signaling and antipredatory behavior model.
(A) Cholera toxin subunit B (CTB) retrograde tracer and AAV-CaMKII-EYFP used to trace dPAG signals to the basolateral amygdala (BLA). (B) Representative images of AAV and CTB expressions in dPAG and BLA, respectively. (C) Robot encounters hindered pellet procurement compared to foraging-only rats (Base, U = 26, p=0.6926; Test, U = 0, p=0.0001; Mann–Whitney U test). ***p<0.001 compared to the foraging-only group. (D) Terminal expressions of AAV injected into the dPAG cell bodies were predominantly observed in the midline nuclei of the thalamus. (E) PVT showed higher c-Fos-positive cells in robot-experienced rats (n = 10) compared to foraging-only control rats (n = 6) (U = 4.0, p=0.0027; Mann–Whitney U test), while other midline thalamic areas showed no differences (t(14)s < 1.611, ps>0.129; t-test). **p<0.01 compared to the foraging-only group. Values were normalized to the mean of the corresponding control group. (F) Representative photomicrographs of PVT c-Fos staining from foraging-only (upper) and robot-experienced (bottom) rats. (G) Representative microphotographs of AAV, CTB, c-Fos, and triple staining in PVT comparing foraging-only and robot-experienced animals. (H) Robot exposure increased the percentage of CTB-labeled PVT neurons expressing c-Fos (t(9) = 3.171, p=0.0113), while CTB density levels were comparable between the two groups (robot-experienced, n = 5; foraging-only, n = 6; t(9) = 0.9039, p=0.3896; t-test). Values were normalized to the mean of the corresponding control group. (I) Proposed model: predator surge detection via visual pathways, e.g., superior colliculus (Furigo et al., 2010; Rhoades et al., 1989), leads to dPAG activation, signaling through PVT to excite BLA. The BLA then projects to regions controlling escape responses, such as dorsal/posterior striatum (Li et al., 2021; Menegas et al., 2018) and ventromedial hypothalamus (Silva et al., 2013; Kunwar et al., 2015; Wang et al., 2015).
Figure 4—figure supplement 1

Double labeling of cholera toxin subunit B and c-FOS in paraventricular nucleus of the thalamus (PVT) cells.
Robot exposure increased the percentage of CTB-labeled PVT neurons expressing c-Fos (t(9) = 2.278, p=0.0487; robot-experienced, t-test; n = 5; foraging-only, n = 6). CTB density levels remained similar between groups (t(9) = 0.7121, p=0.4945; t-test). * denotes p<0.05.
Additional files
-
Supplementary file 1
Reconstructions of histology and normality test results.
(A) Histological reconstructions of recording sites in the dPAG and BLA, and optic fiber locations in the dPAG. (A) Red bars show the trajectory of tetrode recording sites in the dPAG. (B) Red bars depict the trajectory of optrode recording sites in the dPAG. (B) Red and gray circles represent the optic fiber locations for ChR2 and EYFP rats, respectively. (D) Orange circles and red bars indicate the optic fiber locations in the dPAG (left) and recording trajectories in the BLA (right), respectively. Numerical values represent AP coordinates relative to Bregma. (B) Normality test. The normality of the variable distributions was assessed using the Kolmogorov–Smirnov test (p<0.01). Depending on the results of this test, parametric tests were used for normally distributed variables, while nonparametric tests were employed for variables that were not normally distributed.
- https://cdn.elifesciences.org/articles/88733/elife-88733-supp1-v1.docx
-
MDAR checklist
- https://cdn.elifesciences.org/articles/88733/elife-88733-mdarchecklist1-v1.pdf
Download links
A two-part list of links to download the article, or parts of the article, in various formats.
Downloads (link to download the article as PDF)
Open citations (links to open the citations from this article in various online reference manager services)
Cite this article (links to download the citations from this article in formats compatible with various reference manager tools)
Periaqueductal gray activates antipredatory neural responses in the amygdala of foraging rats
eLife 12:RP88733.
https://doi.org/10.7554/eLife.88733.4


