Overburdened ferroptotic stress impairs tooth morphogenesis
- State Key Laboratory of Oral Diseases & National Center for Stomatology & National Clinical Research Center for Oral Diseases, West China Hospital of Stomatology, Sichuan University, China
- Department of Endodontics, West China School of Stomatology, Sichuan University, China
Figures
Figure 1 with 1 supplement
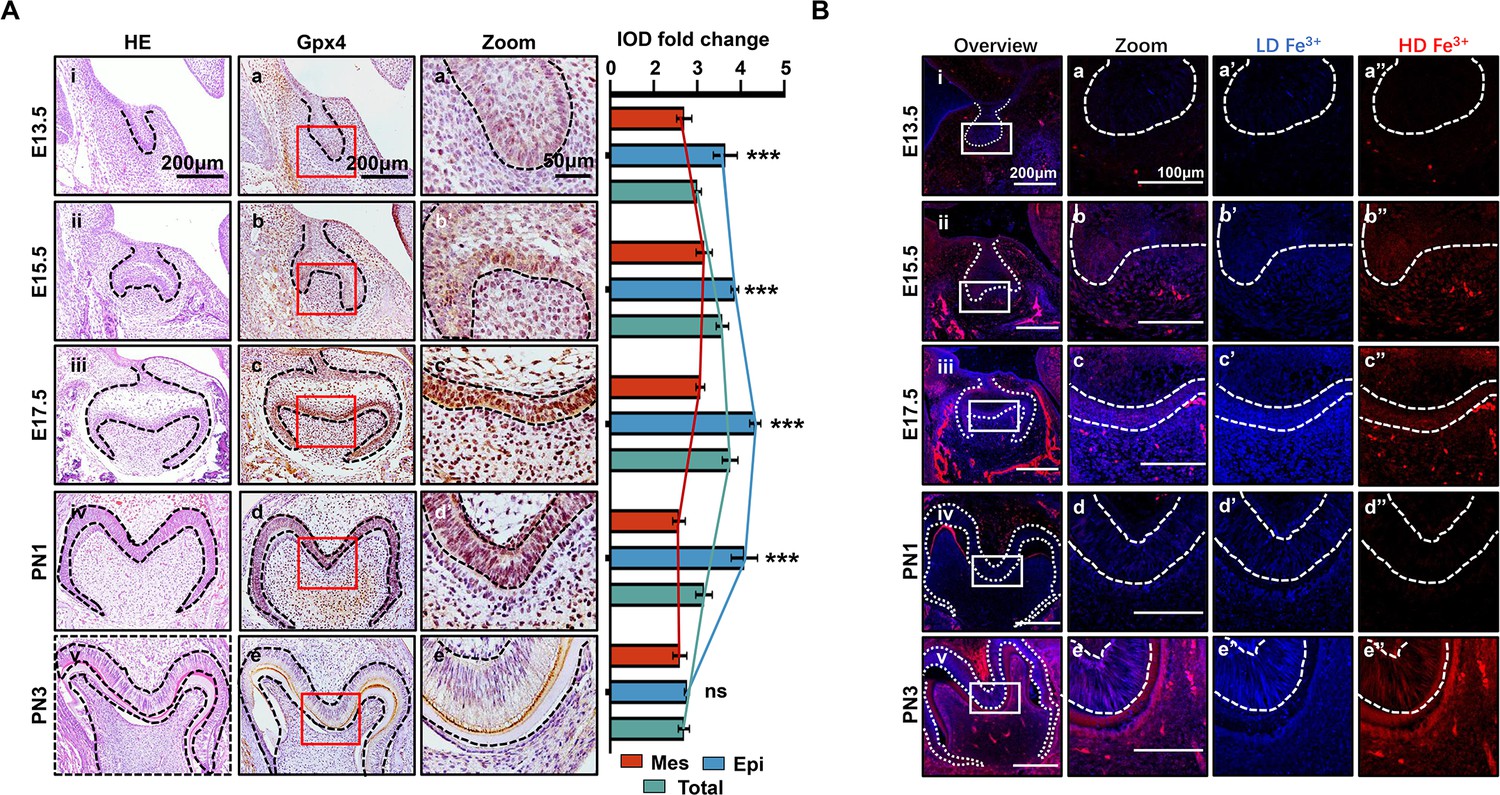
Spatiotemporal characterization of glutathione peroxidase 4 (Gpx4) expression and iron accumulation in tooth morphogenesis.
(A) (i–v) HE staining for tooth germ in E13.5 to PN3, scale bars = 200 μm. (a–e) Gpx4 expression detected by immunohistochemistry (IHC), scale bars = 200 μm. (a’–e’) Enlarged view of each Gpx4 staining, scale bars = 50 μm; epithelia versus mesenchyme, n=3, ***p<0.001. (B) (i–v) Iron probe staining in for tooth germ in E13.5 to PN3, scale bars = 200 μm. (a–e) Enlarged view of selected region, scale bars = 100 μm, low concentration (a’–e’, blue) and high concentration of iron (a’’–e’’, red) are present, scale bars = 100 μm. Epi, Epithelia; Mes, = mesenchyme.
-
Figure 1—source data 1
Source data for the integrated optical density of glutathione peroxidase 4 (Gpx4) in epithelia, mesenchyme, and total area of tooth in Figure 1A.
- https://cdn.elifesciences.org/articles/88745/elife-88745-fig1-data1-v1.xlsx
Figure 1—figure supplement 1
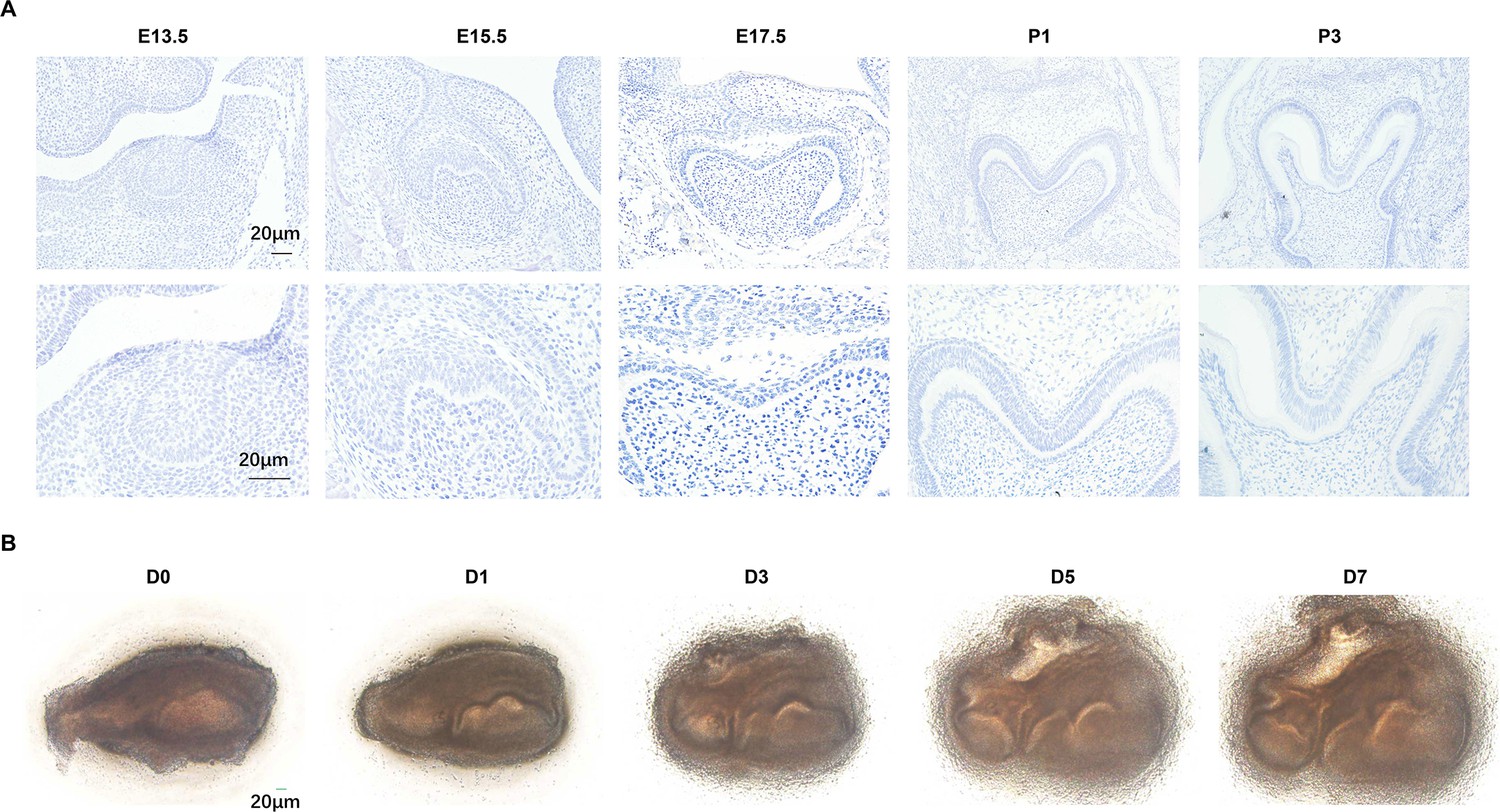
Negative control of IHC staining and the general view of ex vivo cultured tooth germ from D0 to D7.
(A) Negative control of different developmental stage of molar germ in glutathione peroxidase 4 (Gpx4) immunohistochemistry (IHC) staining. (B) Ex vivo culture of tooth molar germ from D0 to D7. Scale bars = 20 μm.
Figure 2 with 1 supplement
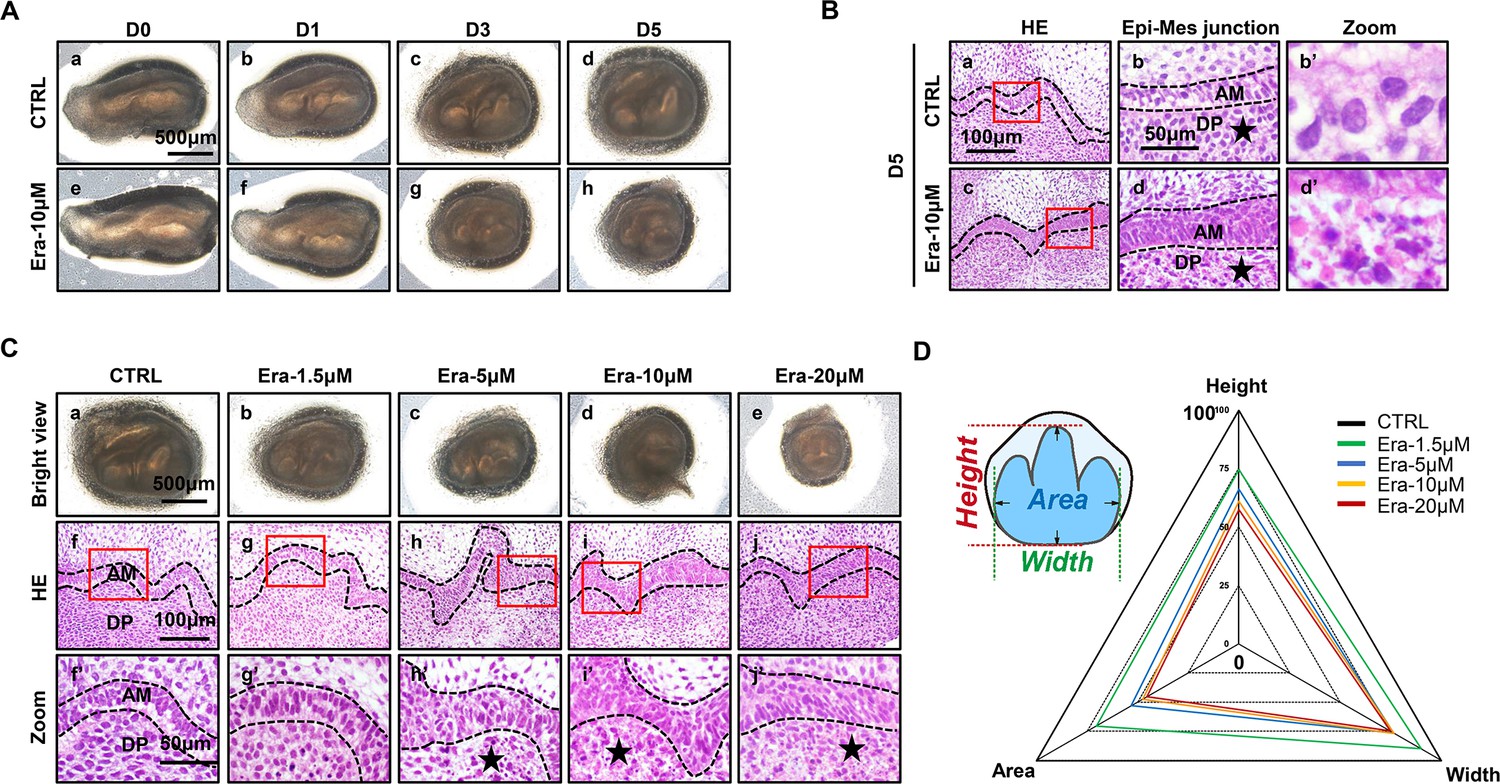
Erastin impairs tooth morphogenesis, especially within dental mesenchyme.
(A) Gross anatomy of tooth germ cultured ex vivo for 5 d, scale bars = 500 μm. (B) (a, c) HE staining for tooth germ on day 5 (D5), scale bars = 100 μm. (b, d) High resolution of epi-mes junction papilla, scale bars = 50 μm; black stars point out necrotic-like cells (NLCs). (b’, d’) NLCs indicated by black stars. (C) (a–e) Gross anatomy of tooth germs in different concentrations of erastin on D5, scale bars = 500 μm. (f–j) HE staining of different concentration-treated tooth germ on D5. (f’–j’) High-resolution view of epi-mes junction region of each tooth germ, scale bars = 50 μm. (D) Rada graph for calculation of height, width, and area in each tooth germ. Black dotted line outlines ameloblasts. AM, ameloblast; DP, dental papilla.
Figure 2—figure supplement 1
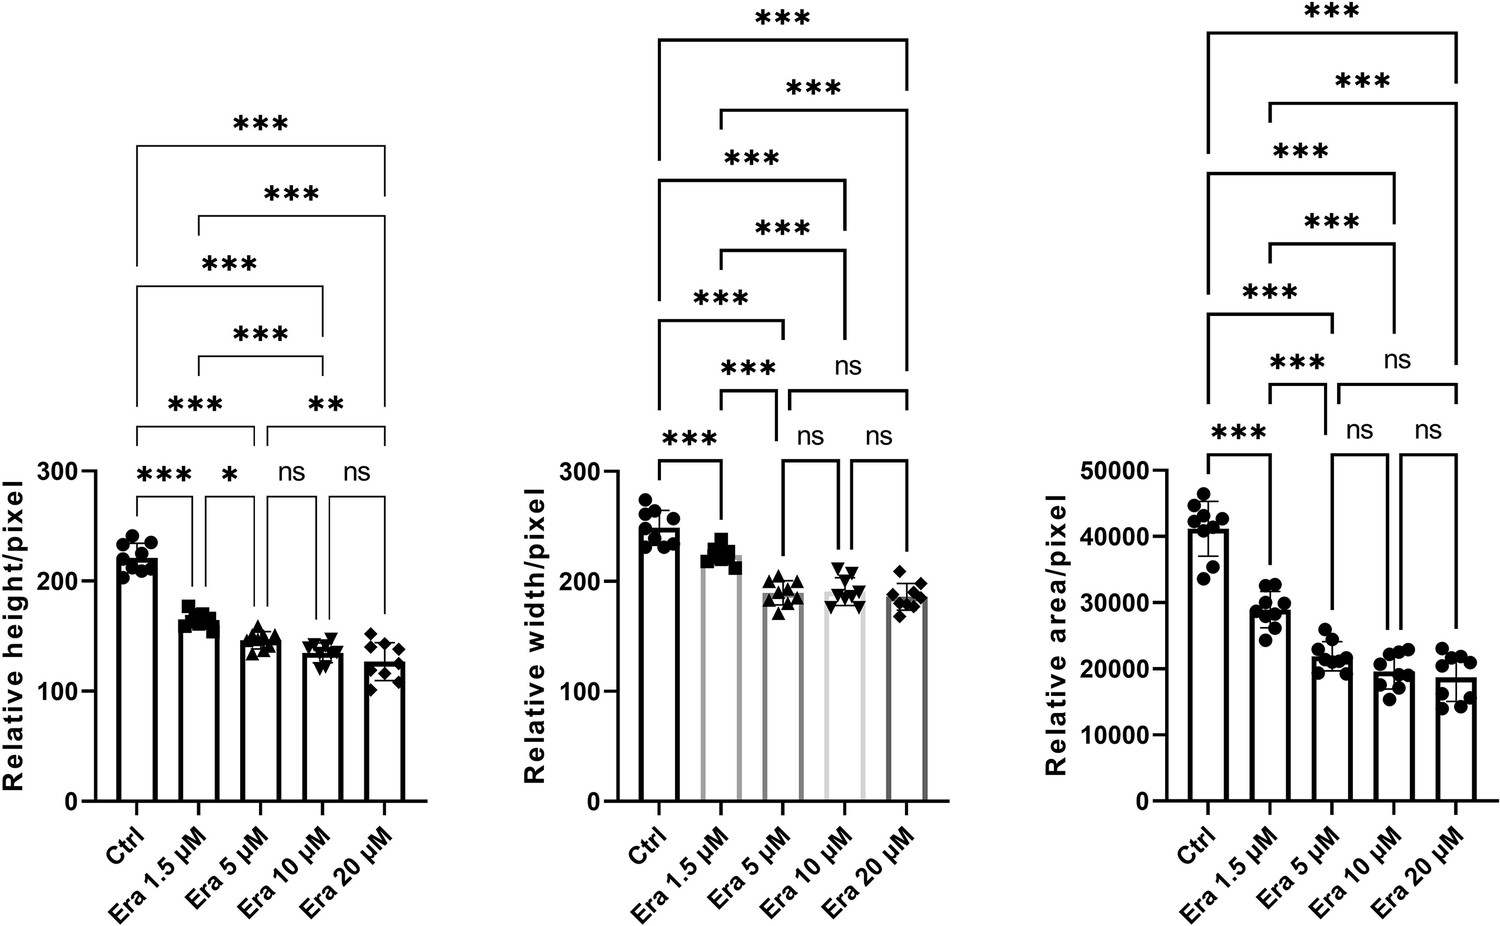
Original bar graphs of height, width, and area of erastin-treated tooth germ.
*p<0.05, **p<0.01, ***p<0.001.
-
Figure 2—figure supplement 1—source data 1
Source data for the bar graphs in Figure 2—figure supplement 1.
- https://cdn.elifesciences.org/articles/88745/elife-88745-fig2-figsupp1-data1-v1.xlsx
Figure 3 with 2 supplements
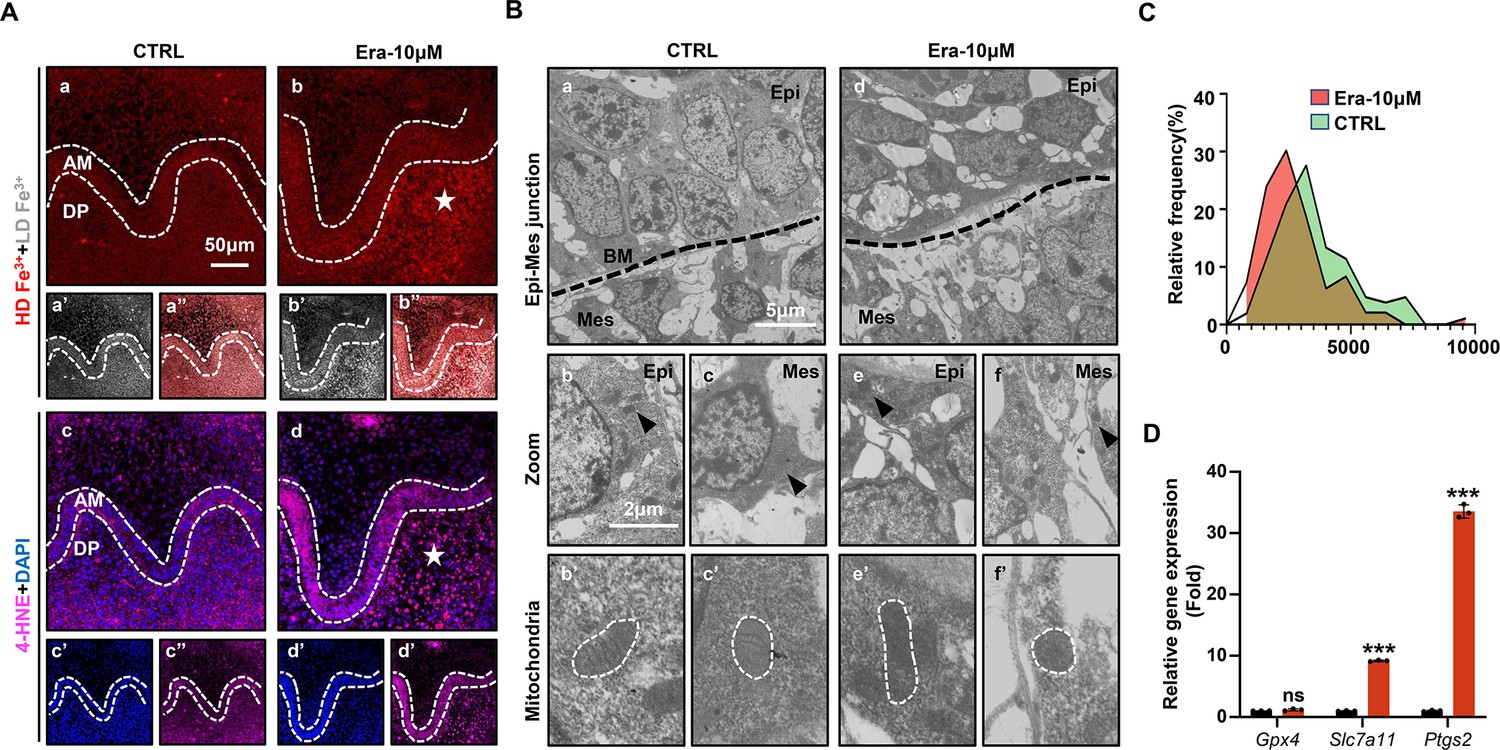
Ferroptosis is activated in erastin-treated molar germ.
(A) (a, b) High-density Fe3+ (red) in CTRL and Era-10 μM of day 5 (D5); white star points out strong fluorescence signal of Fe3+, scale bars = 50 μm. (a’, b’) Low-density Fe3+ (gray) and (a’’, b’’) merged view of iron probe staining. (c, d) Merged view of immunofluorescence (IF) staining of 4-hydroxy-2-nonenal (4-HNE) (magenta) and DAPI (blue), white star points out strong fluorescence signal of 4-HNE, scale bars = 5050 μm. (c’, d’) For DAPI and (c’’, d’’) 4-HNE. AM, ameloblast; DP, dental papilla; HD, high density; LD, low density. (B) Transmission electron microscope (TEM) scanning for CTRL and Era-10 μM on D5. (a, d) epi-mes junction area of CTRL and Era-10 μM on D5 are detected, scale bars = 5 μm. (b, c) Representative view of cells in epithelia and mesenchyme for CTRL, scale bars = 2 μm; black arrow points out typical mitochondria in each region (b’) for epithelia and (c’) mesenchyme, outlined by the white dotted line. (e, f) Representative view of cells in epithelia and mesenchyme for Era-10 μM, scale bars = 2 μm; black arrow points out typical mitochondria in each region (e’) for epithelia and (f’) mesenchyme, outlined by the white dotted line. (C) Relative frequency of the mitochondrial size in both groups. (D) Fold changes of gene expression in CTRL and Era-10 μM on D5 versus CTRL ***p<0.001.
-
Figure 3—source data 1
Source data for the calculation of the mitochondrial area in Figure 3C.
- https://cdn.elifesciences.org/articles/88745/elife-88745-fig3-data1-v1.xlsx
-
Figure 3—source data 2
Source data for the gene expression of Gpx4, Slc7a11, and Ptgs2 in Figure 3D.
- https://cdn.elifesciences.org/articles/88745/elife-88745-fig3-data2-v1.xlsx
Figure 3—figure supplement 1
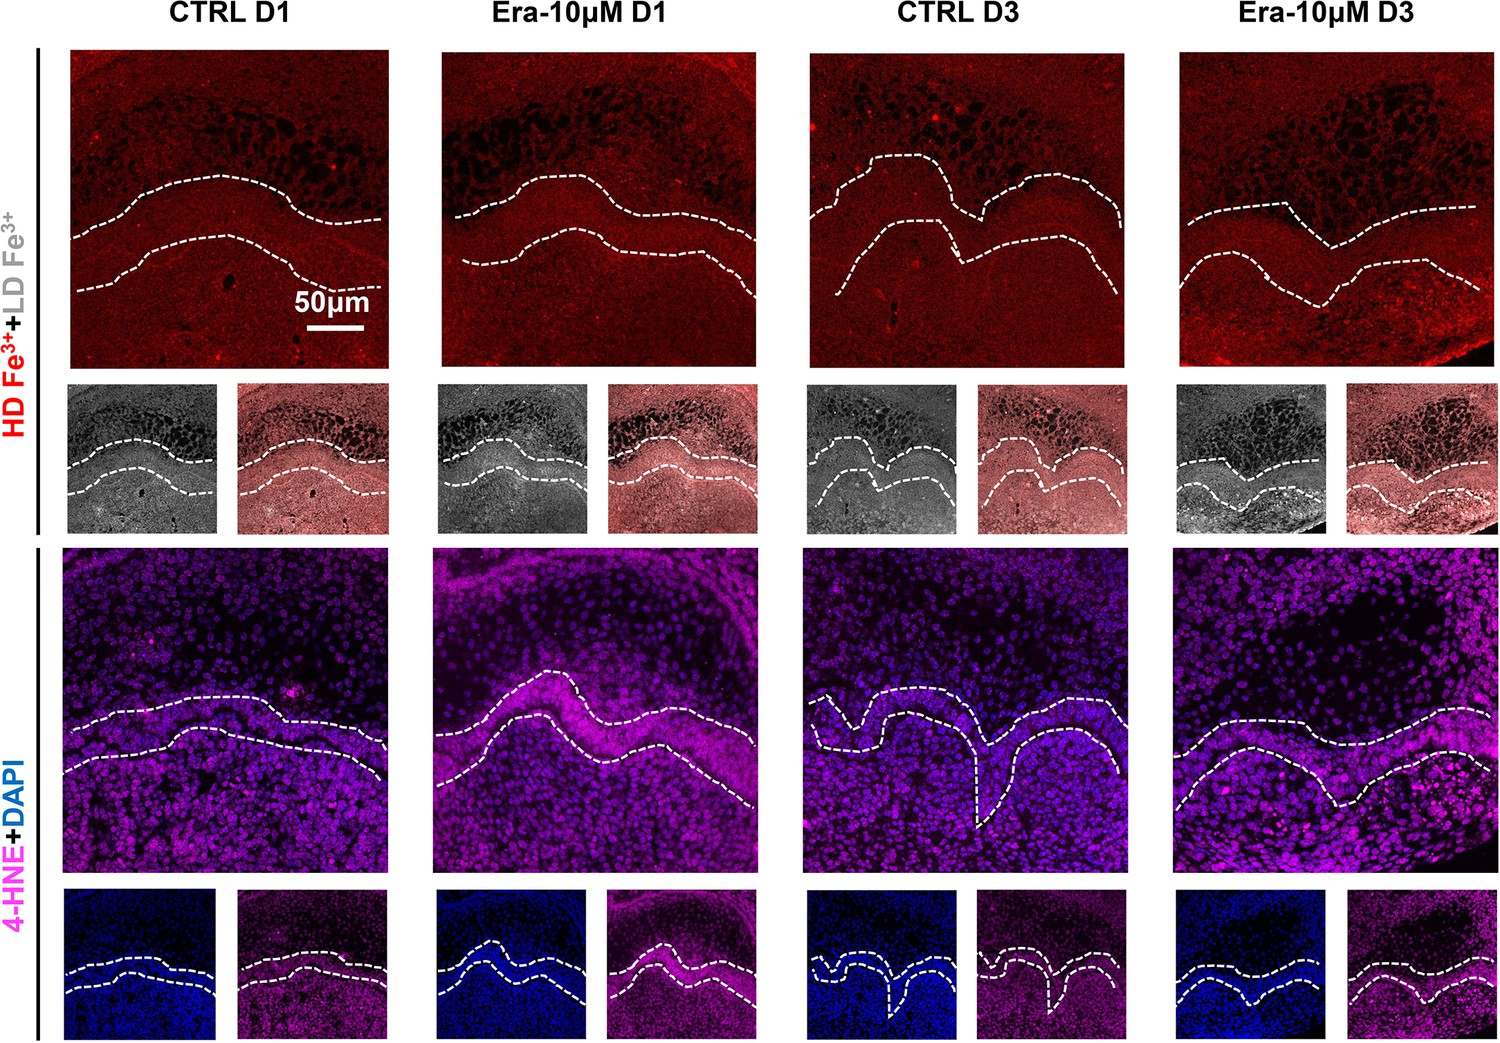
Results for iron accumulation and 4-hydroxy-2-nonenal (4-HNE) expression in Era-10 μM of D1 and D3.
Scale bars = 50 μm.
Figure 3—figure supplement 2
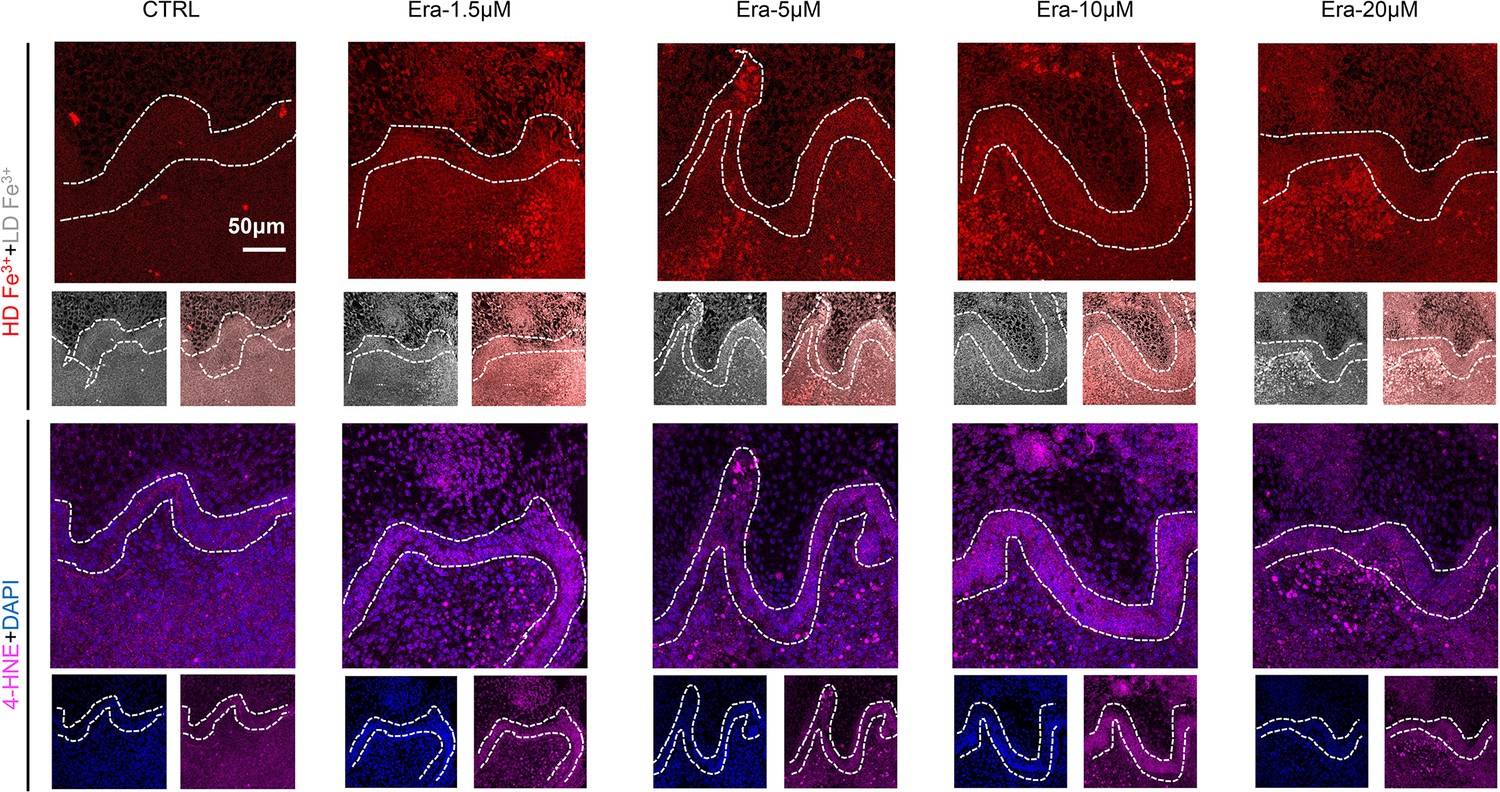
Results for iron accumulation and 4-hydroxy-2-nonenal (4-HNE) expression in Era-1.5 μM, Era-5 μM, Era-10 μM, and Era-20 μM of D5.
Scale bars = 50 μm.
Figure 4 with 4 supplements
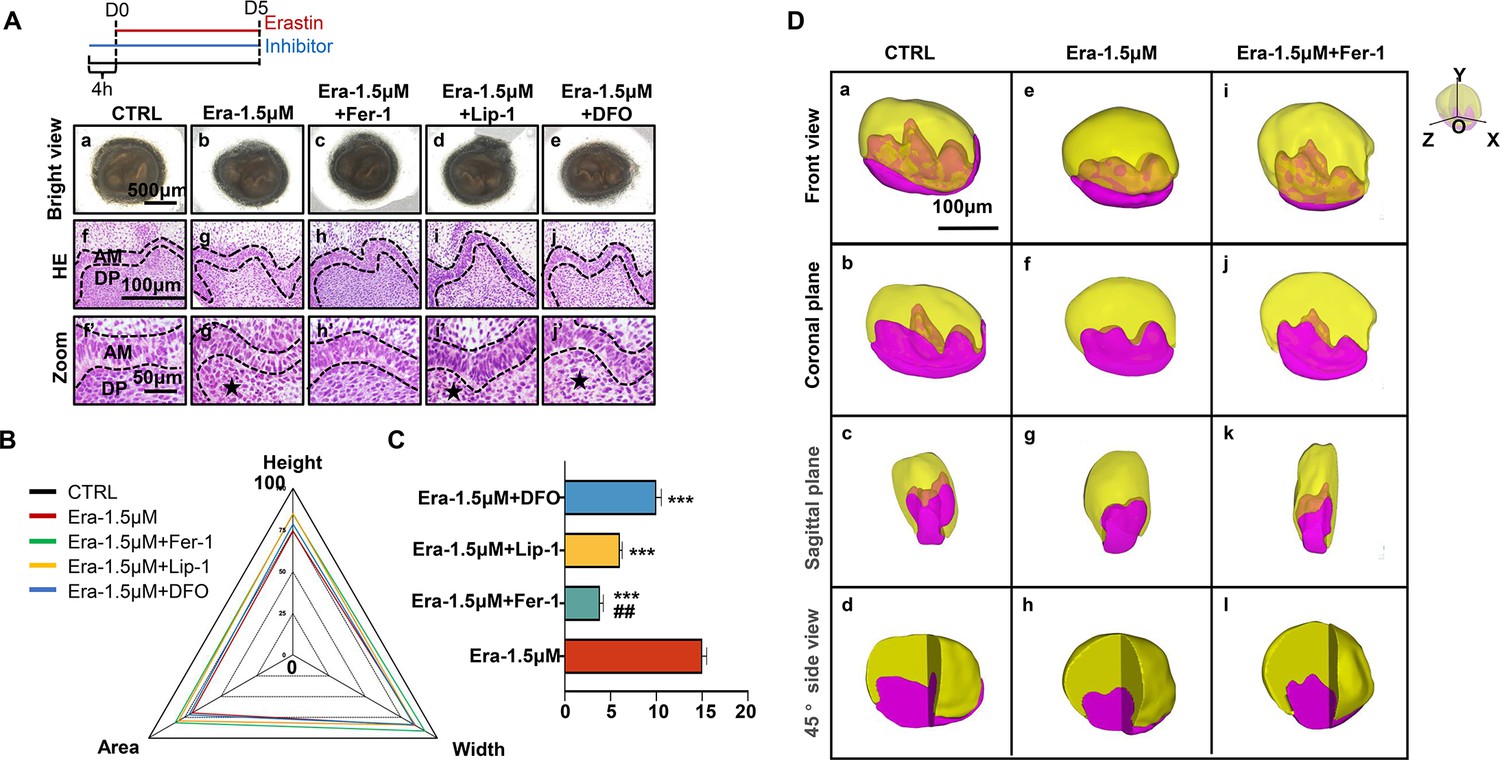
Ferroptotic inhibitors partially rescue erastin-impaired tooth organogenesis.
(A) (a–e) Gross anatomy of tooth germs in the differently treated group, scale bars = 500 μm. (f–j) HE staining of differently treated tooth germ, scale bars = 100 μm. (f’–j’) High-resolution view of epi-mes junction region of each tooth germ; black dotted line outlines ameloblasts, black star points out necrotic-like cells (NLCs). AM, ameloblast; DP, dental papilla; scale bars = 50 μm. (B) Rada graph for calculation of height, width, and area in each tooth germ. (C) Average number of NLCs in each group versus Era-1.5 μM, ***p<0.001, versus Era-1.5 μM + Lip-1, ##p<0.01. (D) 3D reconstructed view of tooth germ on day 5 (D5). (a–d) CTRL from the front view, coronal plane, sagittal plane, and 45° side view. (e–h) Era-1.5 μM and (i–l) Era-1.5 μM + Fer-1 are viewed the same way. Scale bars = 100 μm.
-
Figure 4—source data 1
Source data for the bar graphs in Figure 4C.
- https://cdn.elifesciences.org/articles/88745/elife-88745-fig4-data1-v1.xlsx
Figure 4—figure supplement 1
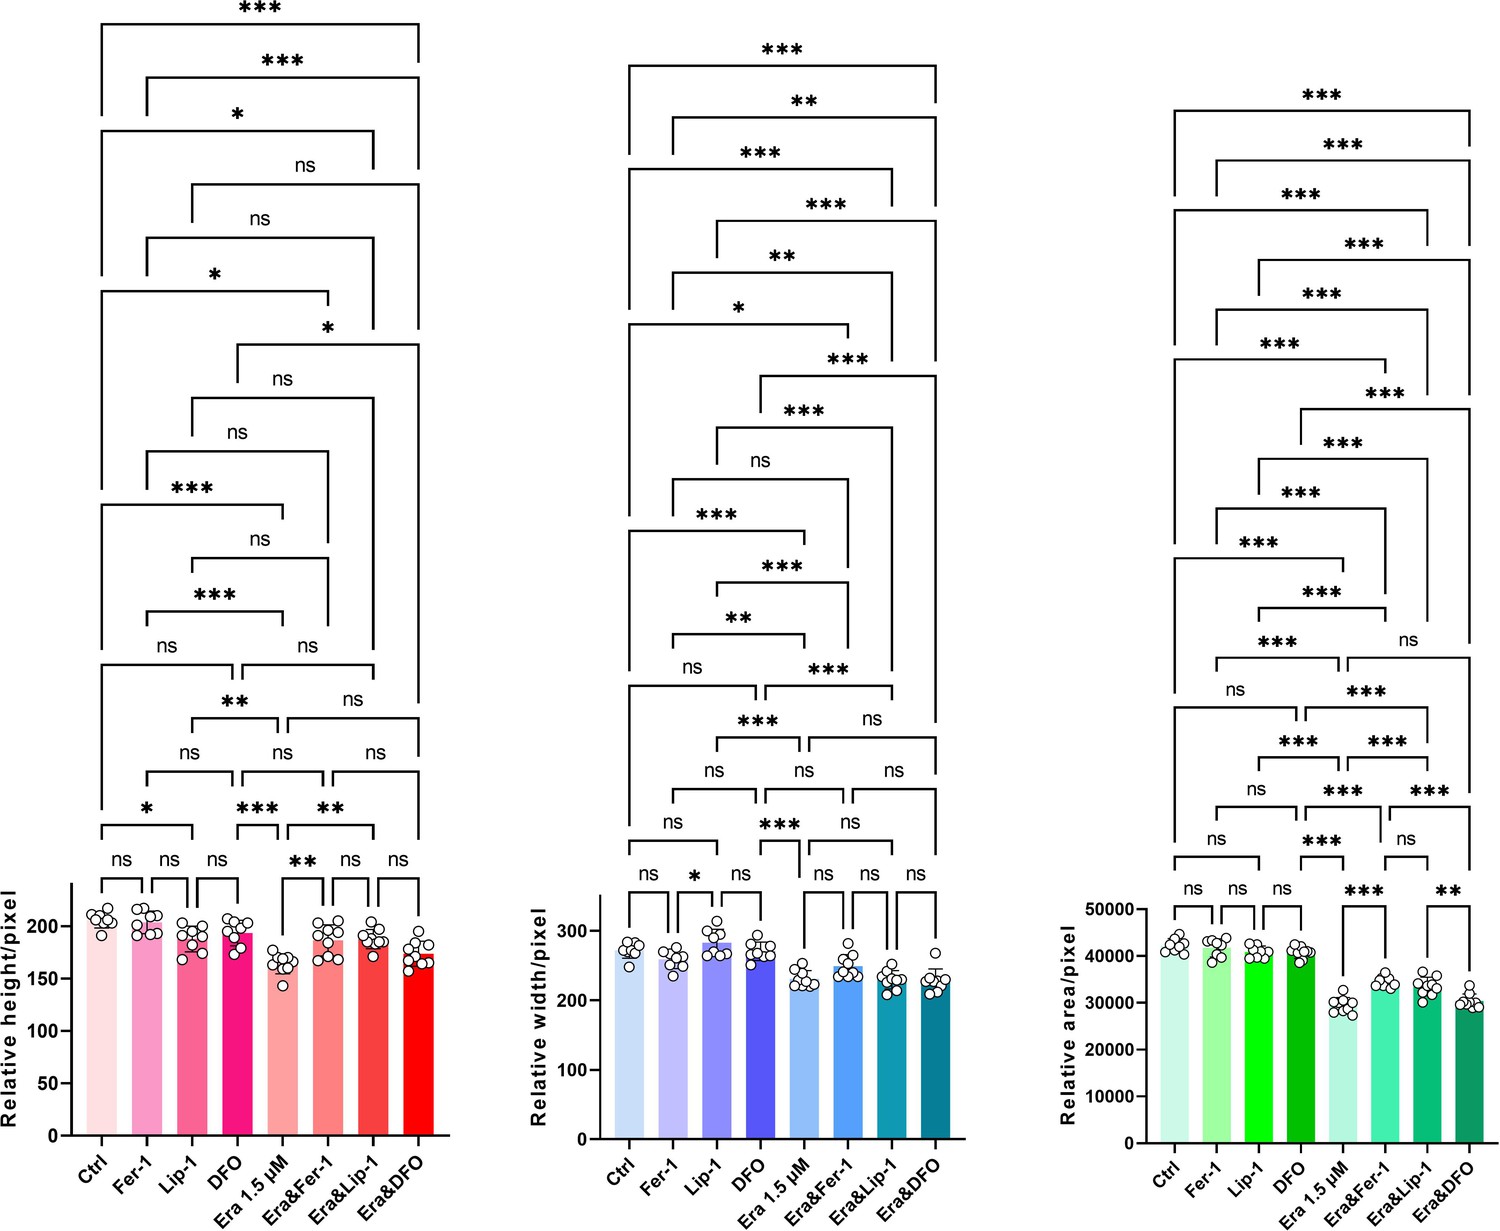
Original bar graphs of height, width, and area of tooth germ in rescue assay.
*p<0.05, **p<0.01, ***p<0.001.
-
Figure 4—figure supplement 1—source data 1
Source data for the bar graphs in Figure 4—figure supplement 1.
- https://cdn.elifesciences.org/articles/88745/elife-88745-fig4-figsupp1-data1-v1.xlsx
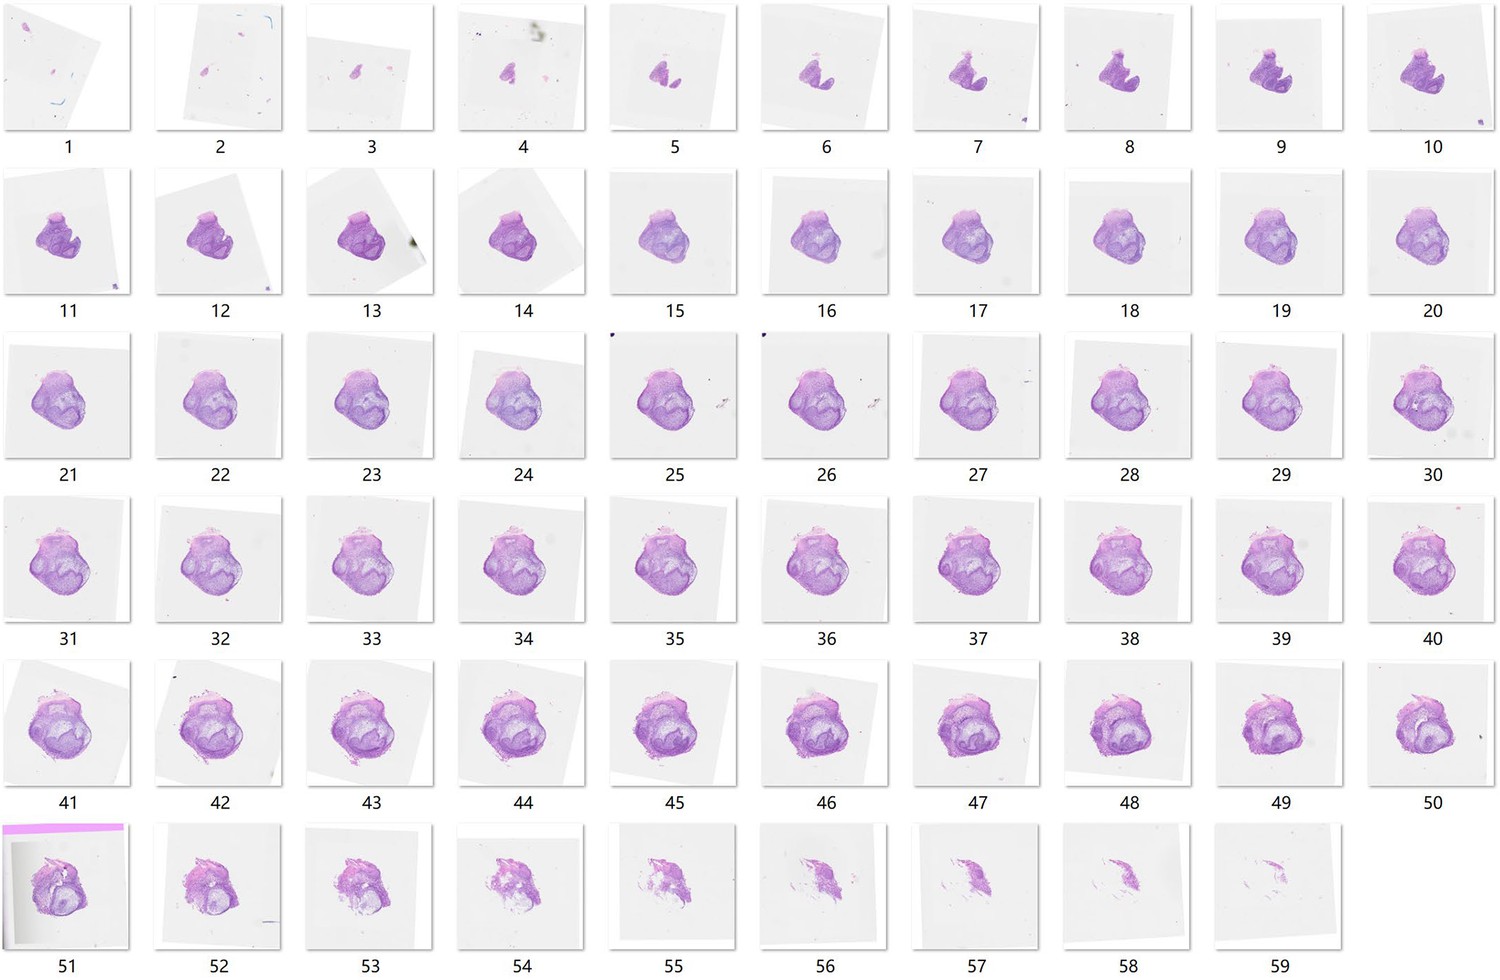
Figure 4—figure supplement 2
Source sequential HE slides for 3D reconstruction of CTRL.
Figure 4—figure supplement 3
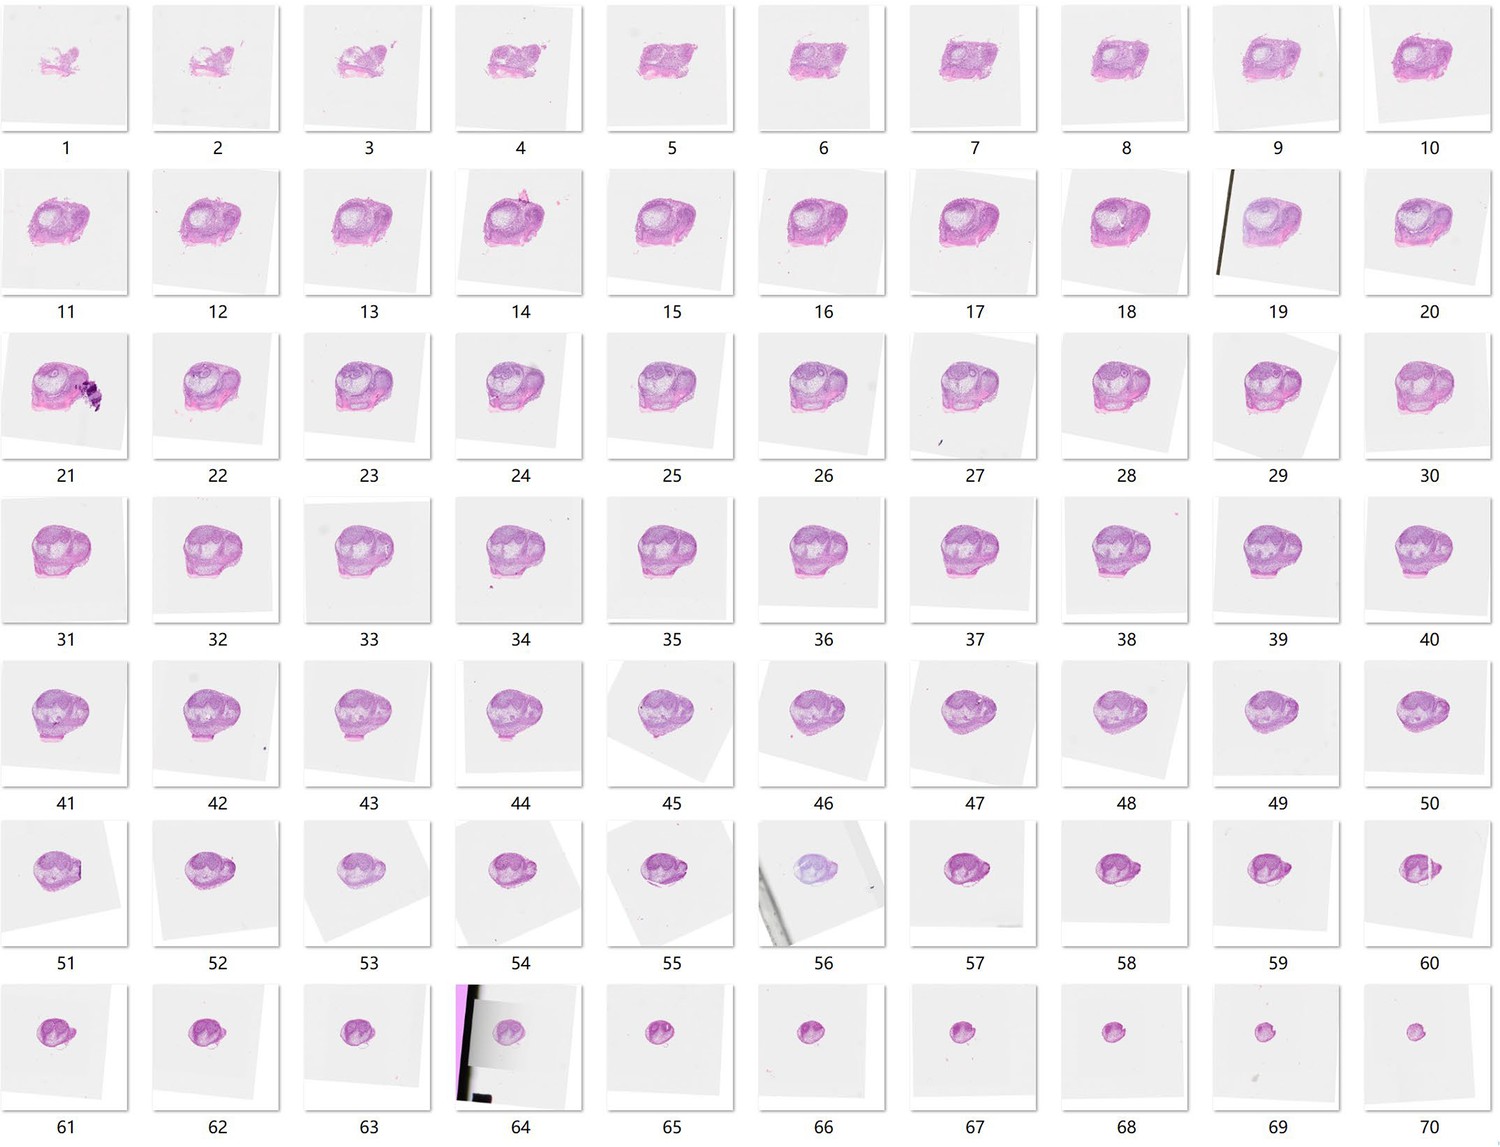
Source sequential HE slides for 3D reconstruction of Era-1.5 μM.
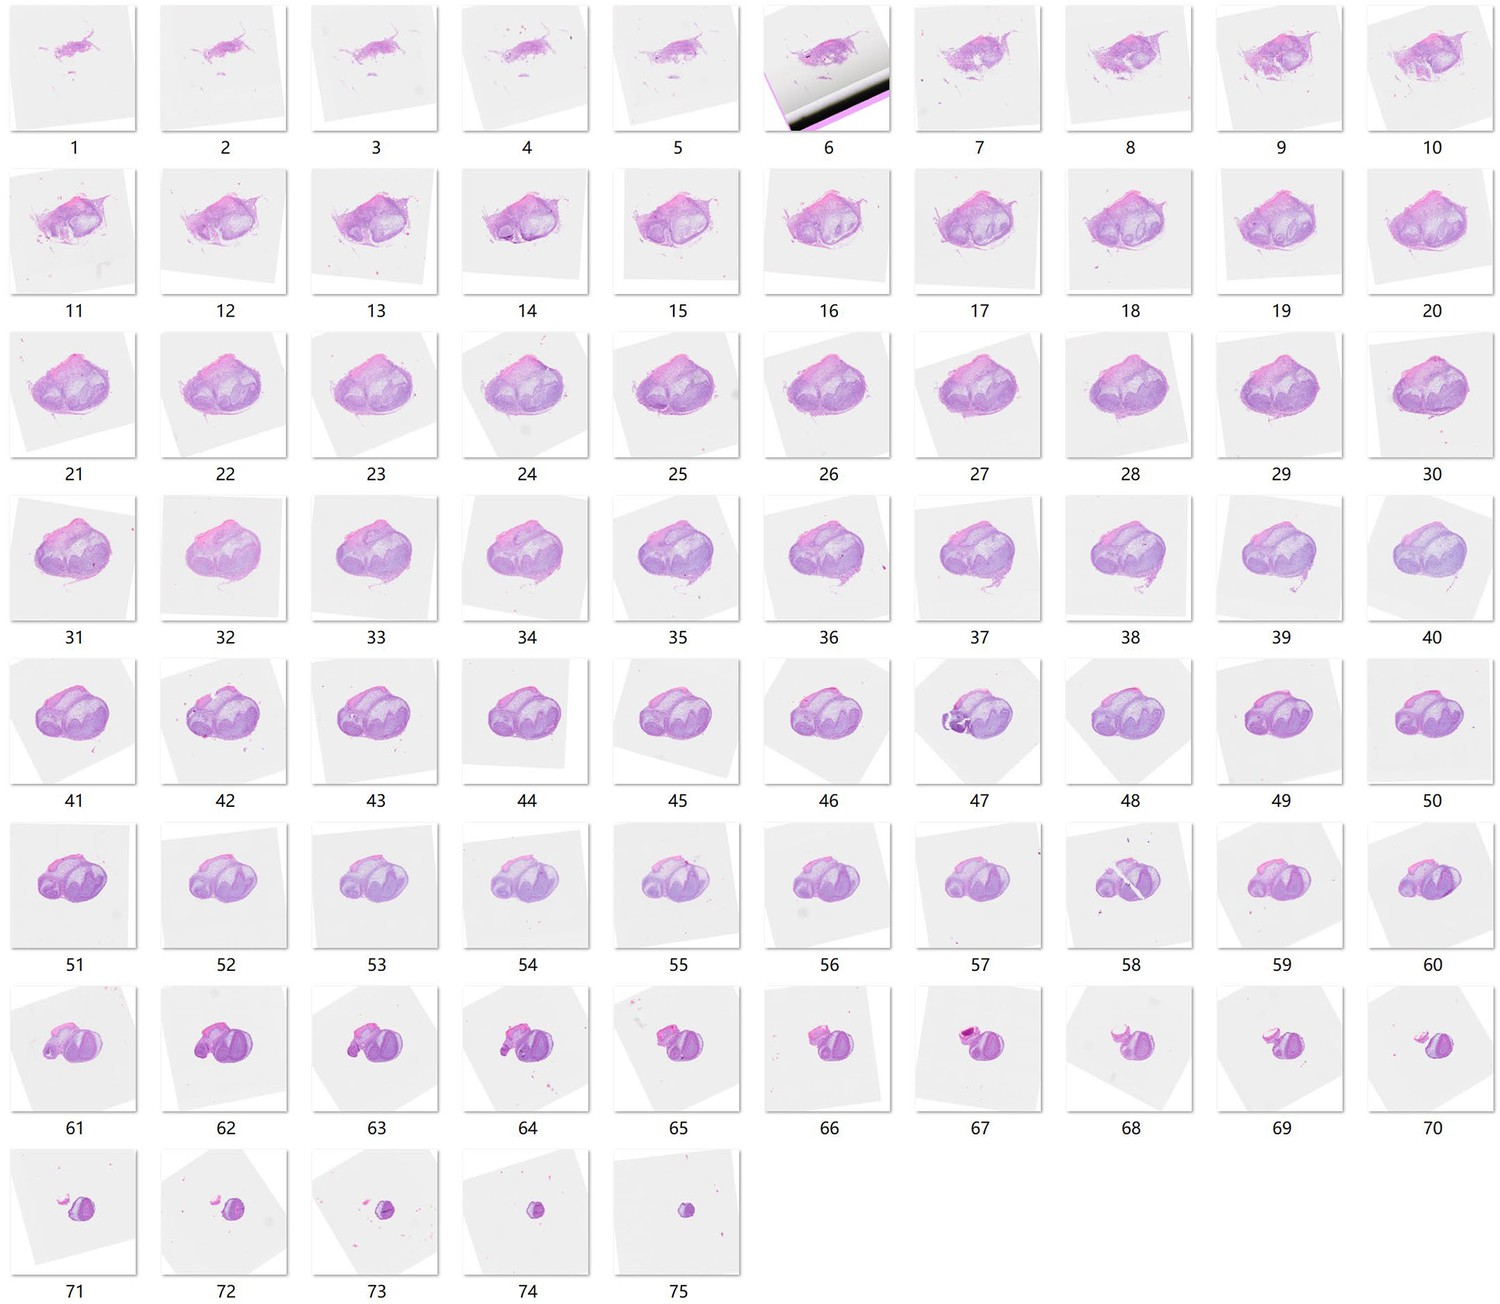
Figure 4—figure supplement 4
Source sequential HE slides for 3D reconstruction of Era-1.5 μM + Fer.
Figure 5 with 1 supplement
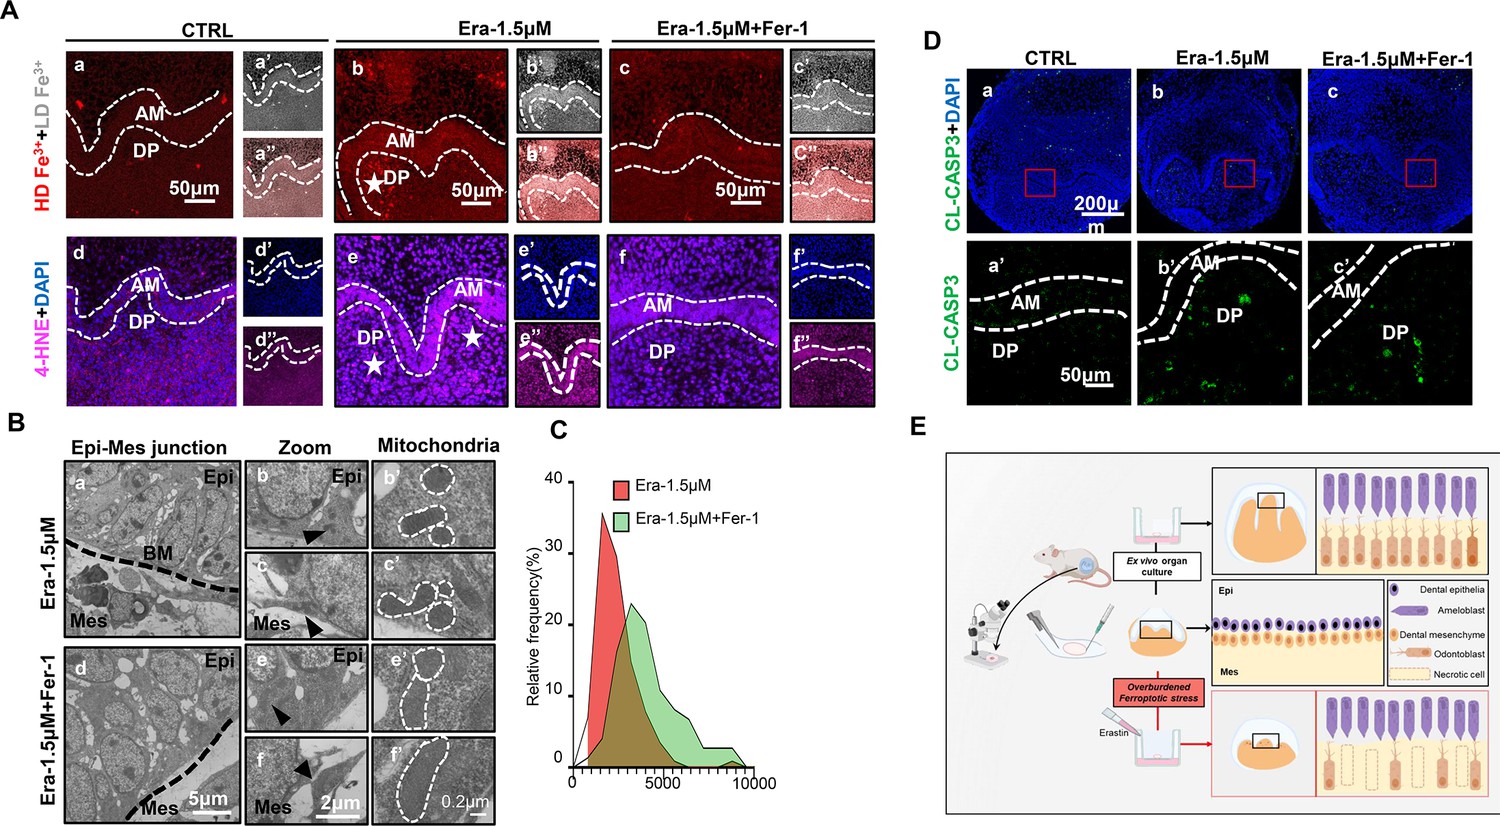
Ferroptosis is the dominant cell death type contributing to erastin-impaired tooth morphogenesis.
(A) (a–c) High-density Fe3+ (red) in CTRL, Era-1.5 μM, and Era-1.5 μM + Fer-1 of day 5 (D5), white star points out strong fluorescence signal of Fe3+, scale bars = 50 μm. (a’–c’) Low-density Fe3+ (gray) and (a’’–c’’) merged view of iron probe staining. (d–f) Merged view of immunofluorescence (IF) staining of 4-hydroxy-2-nonenal (4-HNE) (magenta) and DAPI (blue), white star points out strong fluorescence signal of 4-HNE, scale bars = 50 μm. (d’–f’) DAPI and (d’’–f’’) 4-HNE, AM, ameloblast; DP, dental papilla; HD, high density; LD, low density. (B) Transmission electron microscope (TEM) scanning of Era-1.5 μM and Era-1.5 μM + Fer-1 on D5. (a, d) epi-mes junction area of Era-1.5 μM and Era-1.5 μM + Fer-1 on D5 is detected, scale bars = 5 μm. (b, c) Representative view of cells in epithelia and mesenchyme for Era-1.5 μM, scale bars = 2 μm; black arrow points out typical mitochondria in each region (b’) for epithelia and (c’) mesenchyme, outlined by the white dotted line. (e, f) Representative view of cells in epithelia and mesenchyme for Era-1.5 μM + Fer-1, scale bars = 2 μm; black arrow points out typical mitochondria in each region (e’) for epithelia and (f’) mesenchyme, outlined by the white dotted line. (C) Relative frequency of the mitochondrial size in both groups. (D) (a–c) Expression of CL-CASP3 (green) in CTRL, Era-1.5 μM, and Era-1.5 μM + Fer-1 on D5, scale bars = 200 μm. (a’–c’) Enlarged view of CL-CASP3 in each group, scale bars = 50 μm. (E) Schematic model illustrates the overburdened ferroptotic stress impaired tooth morphogenesis in ex vivo organ culture model.
-
Figure 5—source data 1
Source data for the calculation of the mitochondrial area in Figure 5C.
- https://cdn.elifesciences.org/articles/88745/elife-88745-fig5-data1-v1.xlsx
Figure 5—figure supplement 1
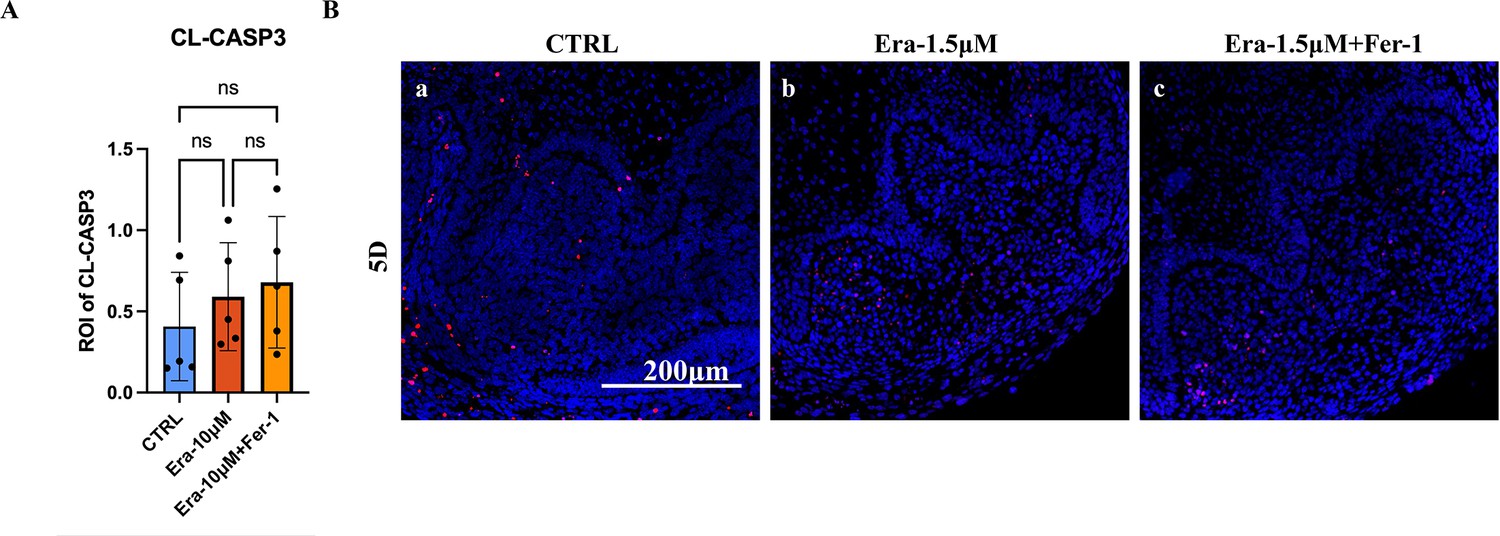
Activation of apoptosis indicated by CL-CASP3 and TUNEL staining.
(A) Mean influence intensity of ROI (Region of Interest) of CL-CASP3 in CTRL, Era-1.5 μM, and Era-1.5 μM + Fer-1. Both Era-1.5 μM and Era-1.5 μM + Fer-1 showed slightly increased CL-CASP3 activation than that in CTRL but showed no statistical differences. (B) Results of TUNEL assay in each experimental group. DNA damage detected by TUNEL assay is similar to that of CL-CASP3, which indicated that apoptosis is not significantly activated in erastin-treated tooth germ. Scale bars = 200 μm.
-
Figure 5—figure supplement 1—source data 1
Source data for the bar graphs in Figure 5—figure supplement 1.
- https://cdn.elifesciences.org/articles/88745/elife-88745-fig5-figsupp1-data1-v1.xlsx
Additional files
Download links
A two-part list of links to download the article, or parts of the article, in various formats.
Downloads (link to download the article as PDF)
Open citations (links to open the citations from this article in various online reference manager services)
Cite this article (links to download the citations from this article in formats compatible with various reference manager tools)
Overburdened ferroptotic stress impairs tooth morphogenesis
eLife 12:RP88745.
https://doi.org/10.7554/eLife.88745.3


