Auditory confounds can drive online effects of transcranial ultrasonic stimulation in humans
- Donders Institute for Brain, Cognition, and Behaviour; Radboud University Nijmegen, Netherlands
- Krembil Research Institute, University Health Network; University of Toronto, Canada
- Neuroimaging Center; Johannes-Gutenberg University Medical Center Mainz, Germany
- Department of Psychosocial Science, Faculty of Psychology, University of Bergen, Norway
- Leibniz Institute for Resilience Research Mainz, Germany
Figures
Figure 1
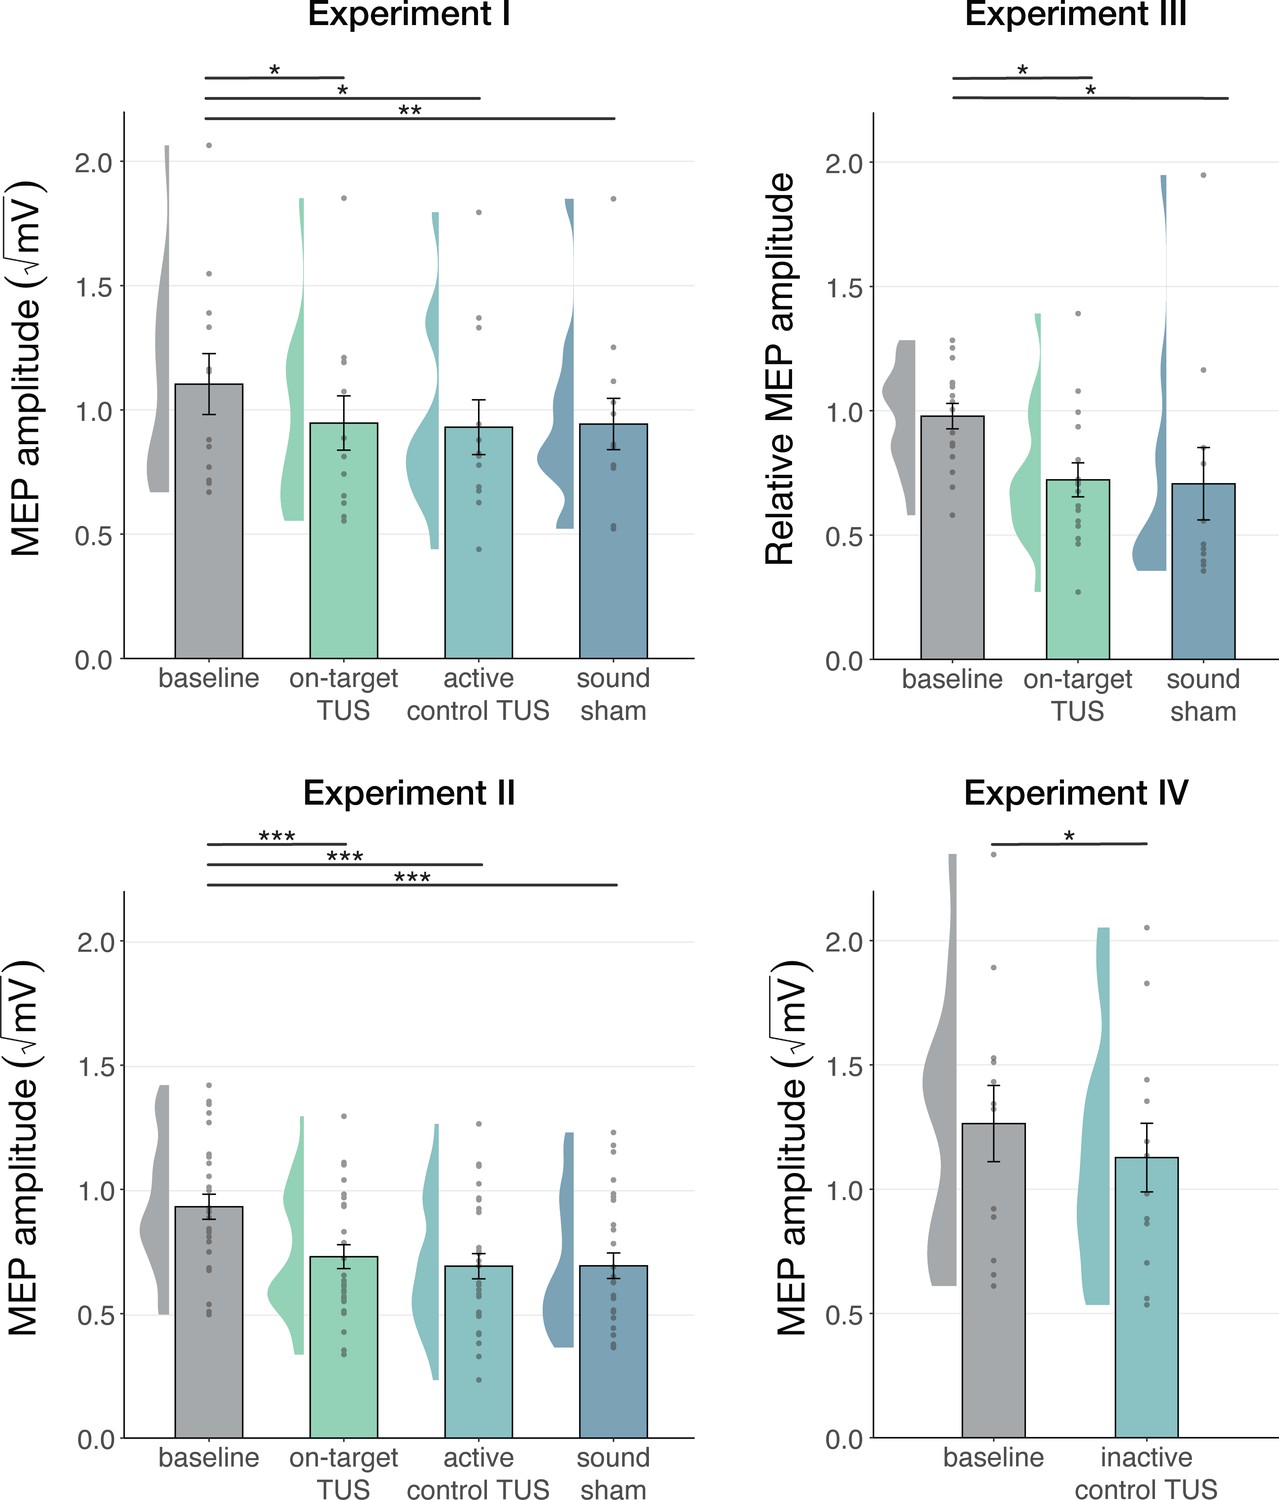
Non-specific motor inhibitory effects of transcranial ultrasonic stimulation (TUS).
A significant suppression of motor-evoked potentials (MEP) amplitude relative to baseline (gray) was observed for on-target TUS (green), but also for stimulation of a control region (cyan), and presentation of a sound alone (sound-sham; blue) indicating a spatially non-specific and sound-driven effect on motor cortical excitability. There were no significant differences between on-target and control conditions. Bar plots depict condition means, error bars represent standard errors, clouds indicate the distribution over participants, and points indicate individual participants. Square-root corrected MEP amplitudes are depicted for Experiments I, II, and IV, and Relative MEP amplitude is depicted for Experiment III (see Methods). *p<0.05, **p<0.01, ***p<0.001.
Figure 2
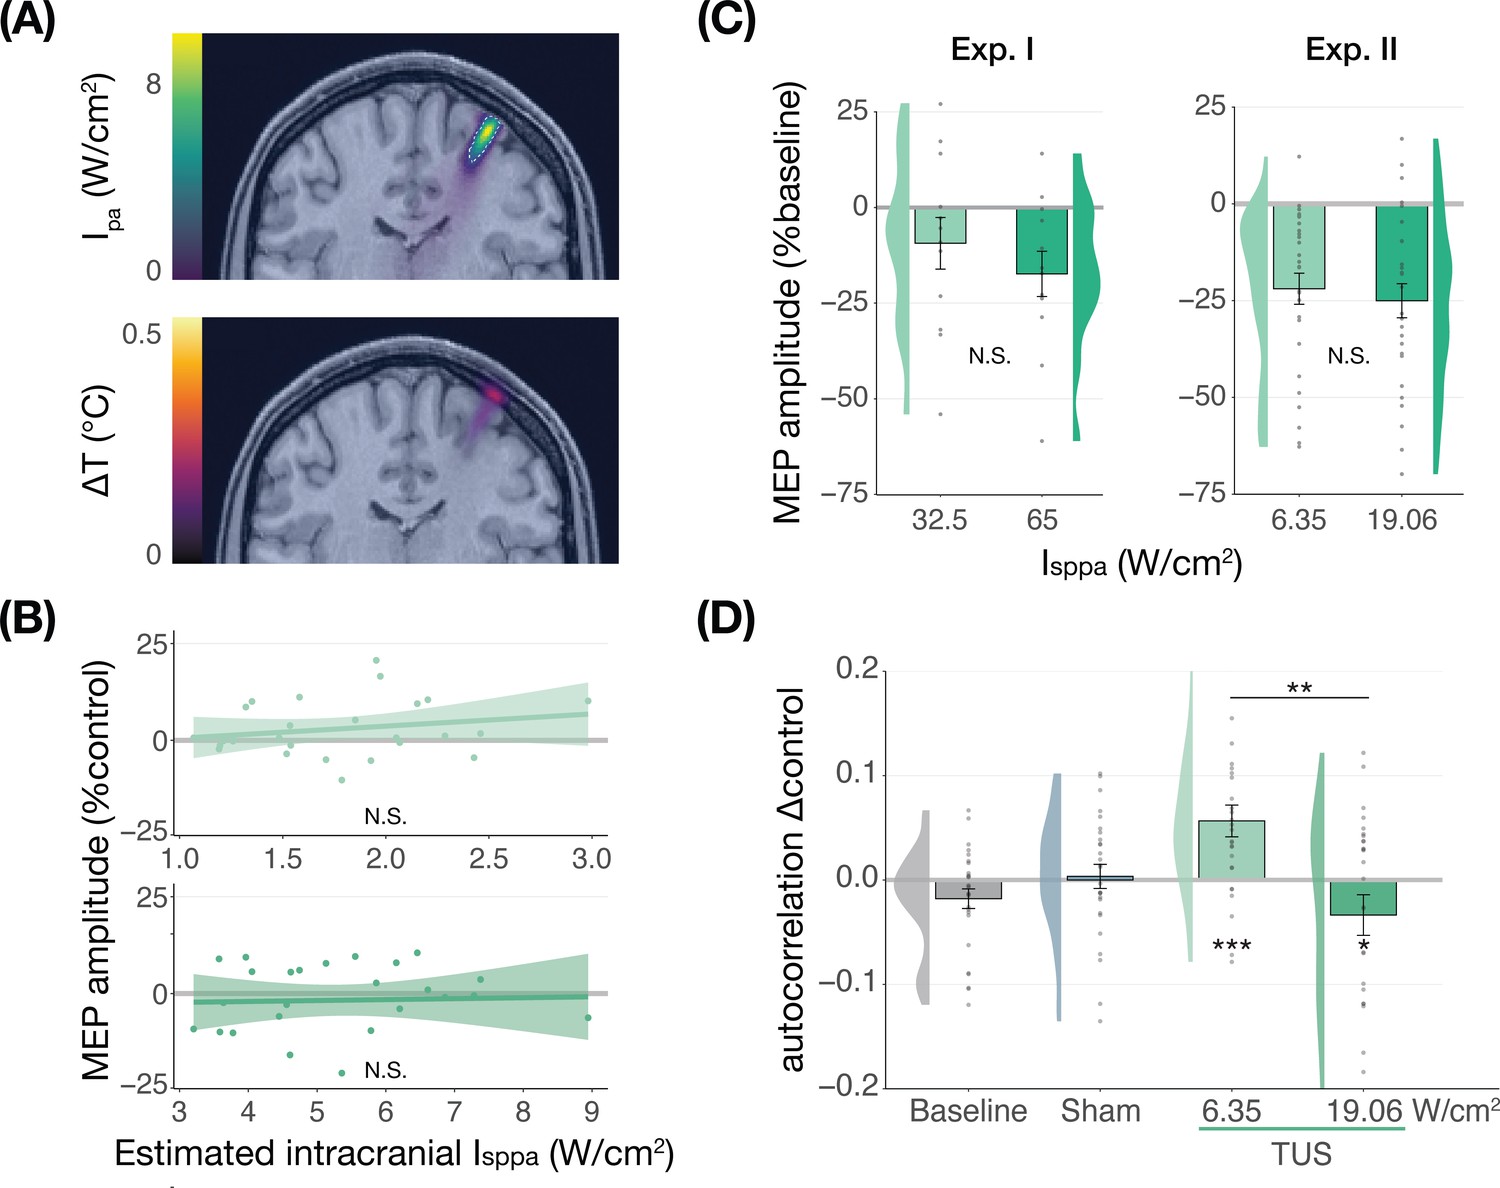
No significant dose-response effects of transcranial ultrasonic stimulation (TUS).
(A) Acoustic (top) and thermal (bottom) simulations for a single subject in Experiment II. The acoustic simulation depicts the estimated pulse-average intensity (Ipa) above a 0.15 W/cm2 lower bound, with the dotted line indicating the full-width half-maximum of the pressure. The thermal simulation depicts the maximum estimated temperature rise. See Appendix 5 for more information on simulations . (B) On-target TUS motor-evoked potentials (MEP) amplitude as a percentage of active control MEP amplitude against simulated intracranial intensities at the two applied free-water intensities: 6.35 W/cm2 (top) and 19.06 W/cm2 (bottom). The shaded area represents the 95% CI, points represent individual participants. No significant intracranial dose-response relationship was observed. (C) There is no significant effect of free-water stimulation intensity on MEP amplitude. Values are expressed as a percentage of baseline MEP amplitude (square root corrected). Remaining conventions are as in Figure 1. (D) Temporal autocorrelation, operationalized as the slope of the linear regression between trial t and its preceding baseline trial t-1, differed significantly as a function of stimulation site and intensity for masked trials. Individual points represent the differential autocorrelation compared to the active control site. Autocorrelation was not modulated during baseline or sound-only sham, but was significantly higher for on-target TUS at 6.35 W/cm2, and significantly lower for on-target TUS at 19.06 W/cm2 compared to active control TUS. *p<0.05, **p<0.01, ***p<0.001.
Figure 3

No effects of time-locked masking.
Figure 4
Sound-driven effects on corticospinal excitability.
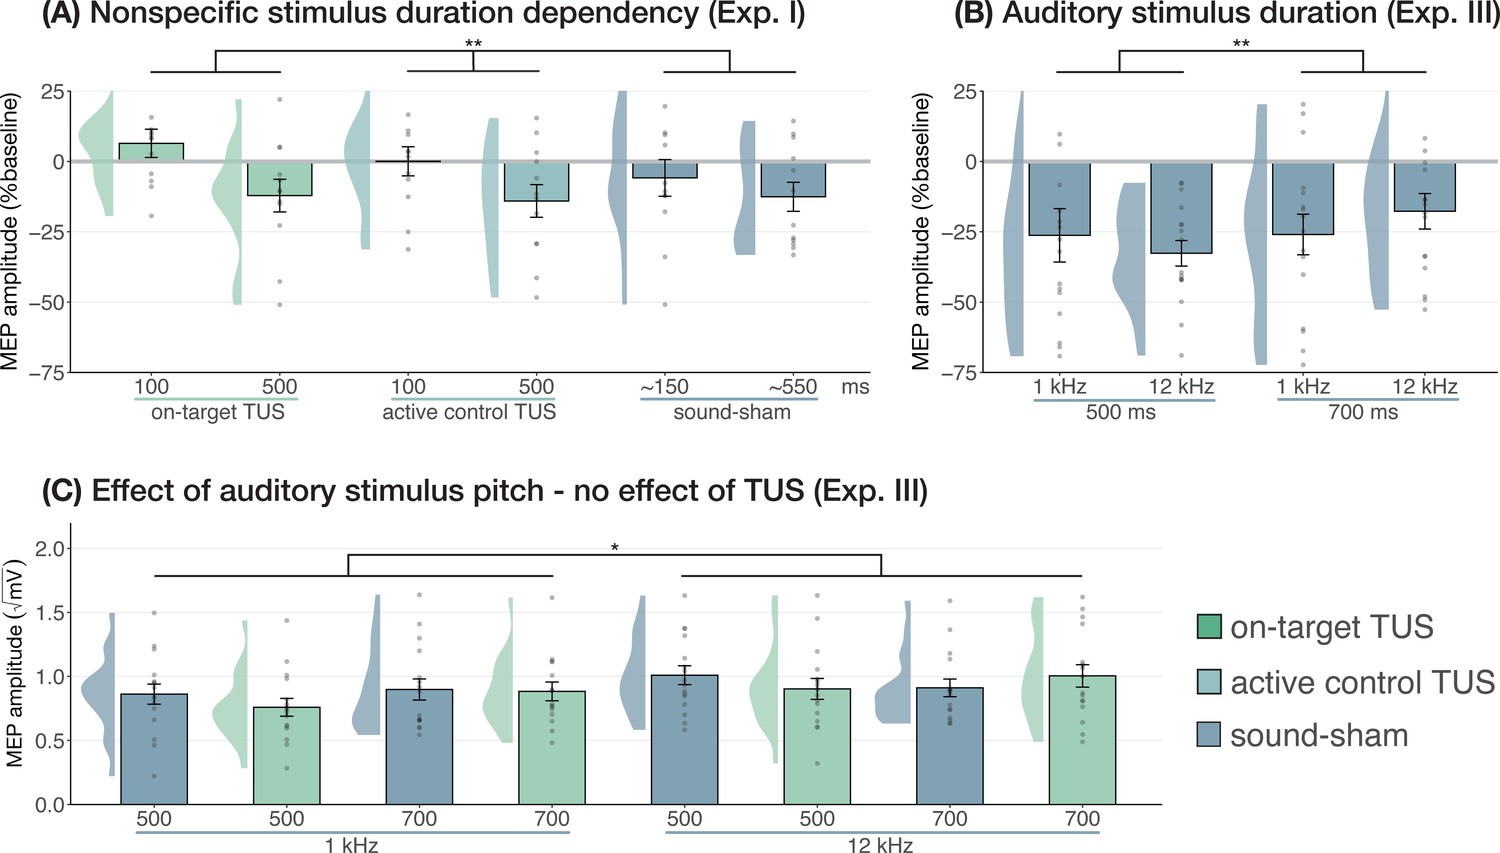
(A) Longer (auditory) stimulus durations resulted in lower motor-evoked potential (MEP) amplitudes, regardless of transcranial ultrasonic stimulation (TUS) administration, indicating a sound-duration-dependency of motor inhibitory outcomes (Exp. I). (B) A significant effect of auditory stimulus duration was also observed in Experiment III. (C) The pitch of auditory stimuli also affected MEPs, where lower amplitudes were observed following a 1 kHz tone compared to a 12 kHz tone. There was no significant effect of TUS. Conventions are as in Figures 1 and 2C. *p<0.05, **p<0.01.
Figure 5
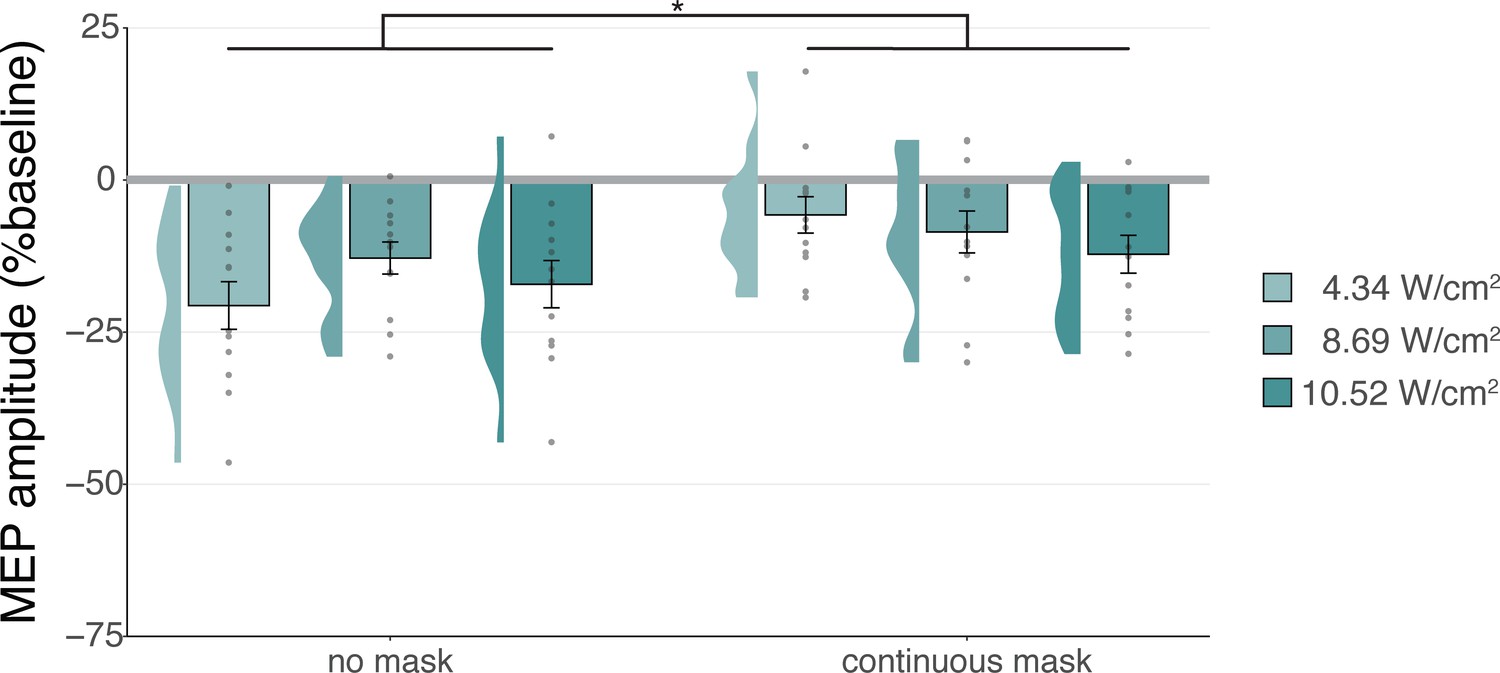
Sound-driven effects on corticospinal excitability.
Less motor-evoked potentials (MEP) attenuation was measured during continuous masking, particularly for lower stimulation intensities (i.e. auditory confound volumes), pointing towards a role of transcranial ultrasonic stimulation (TUS) audibility in MEP attenuation. *p<0.05.
Figure 6
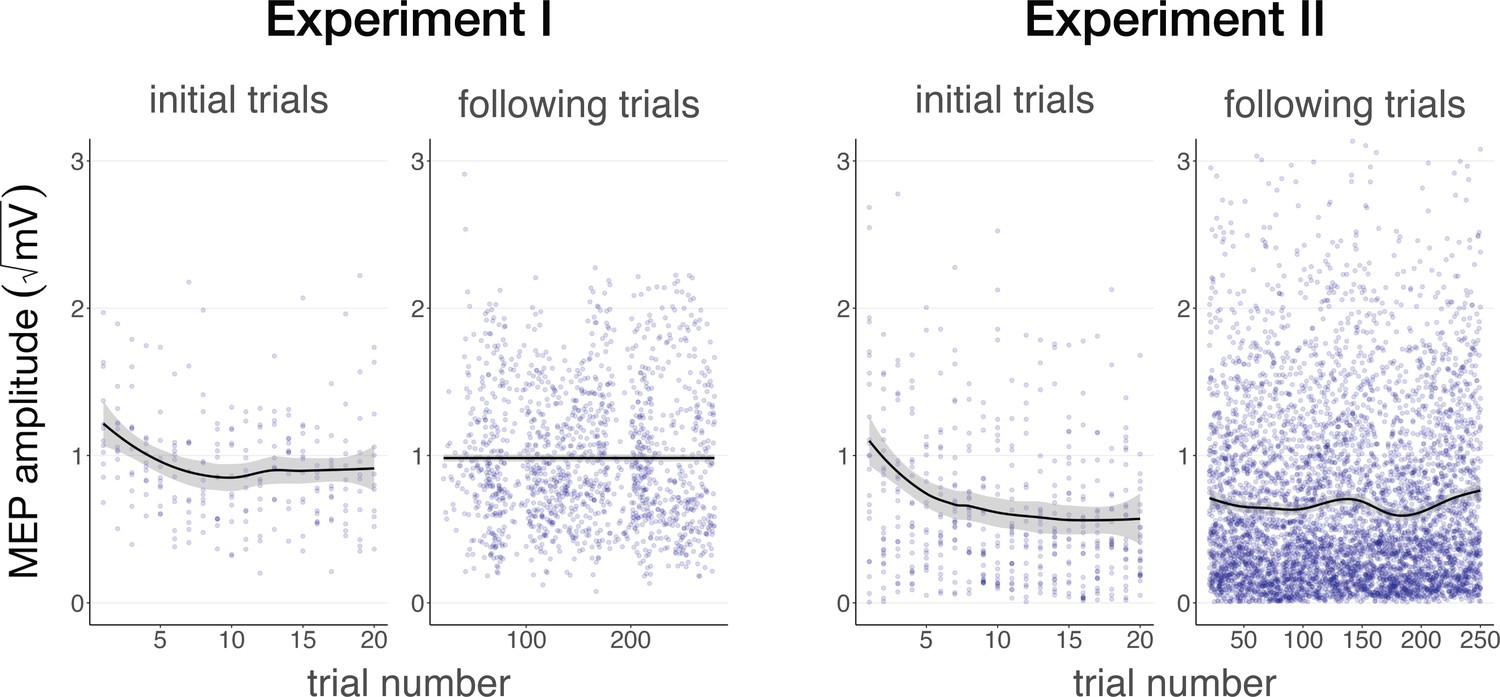
Auditory cueing of transcranial magnetic stimulation (TMS).
There was a significant reduction in motor-evoked potential (MEP) amplitude when participants were first presented with a 500 ms stimulus (initial trials) in Experiment I (left) and Experiment II (right), followed by a stabilization of MEP amplitude during the rest of the experiment (following trials), indicating a learning process in which TUS acts as a cue that signals the onset of TMS. The solid line depicts the loess regression fit, and the shaded area represents the 95% confidence interval.
Figure 7
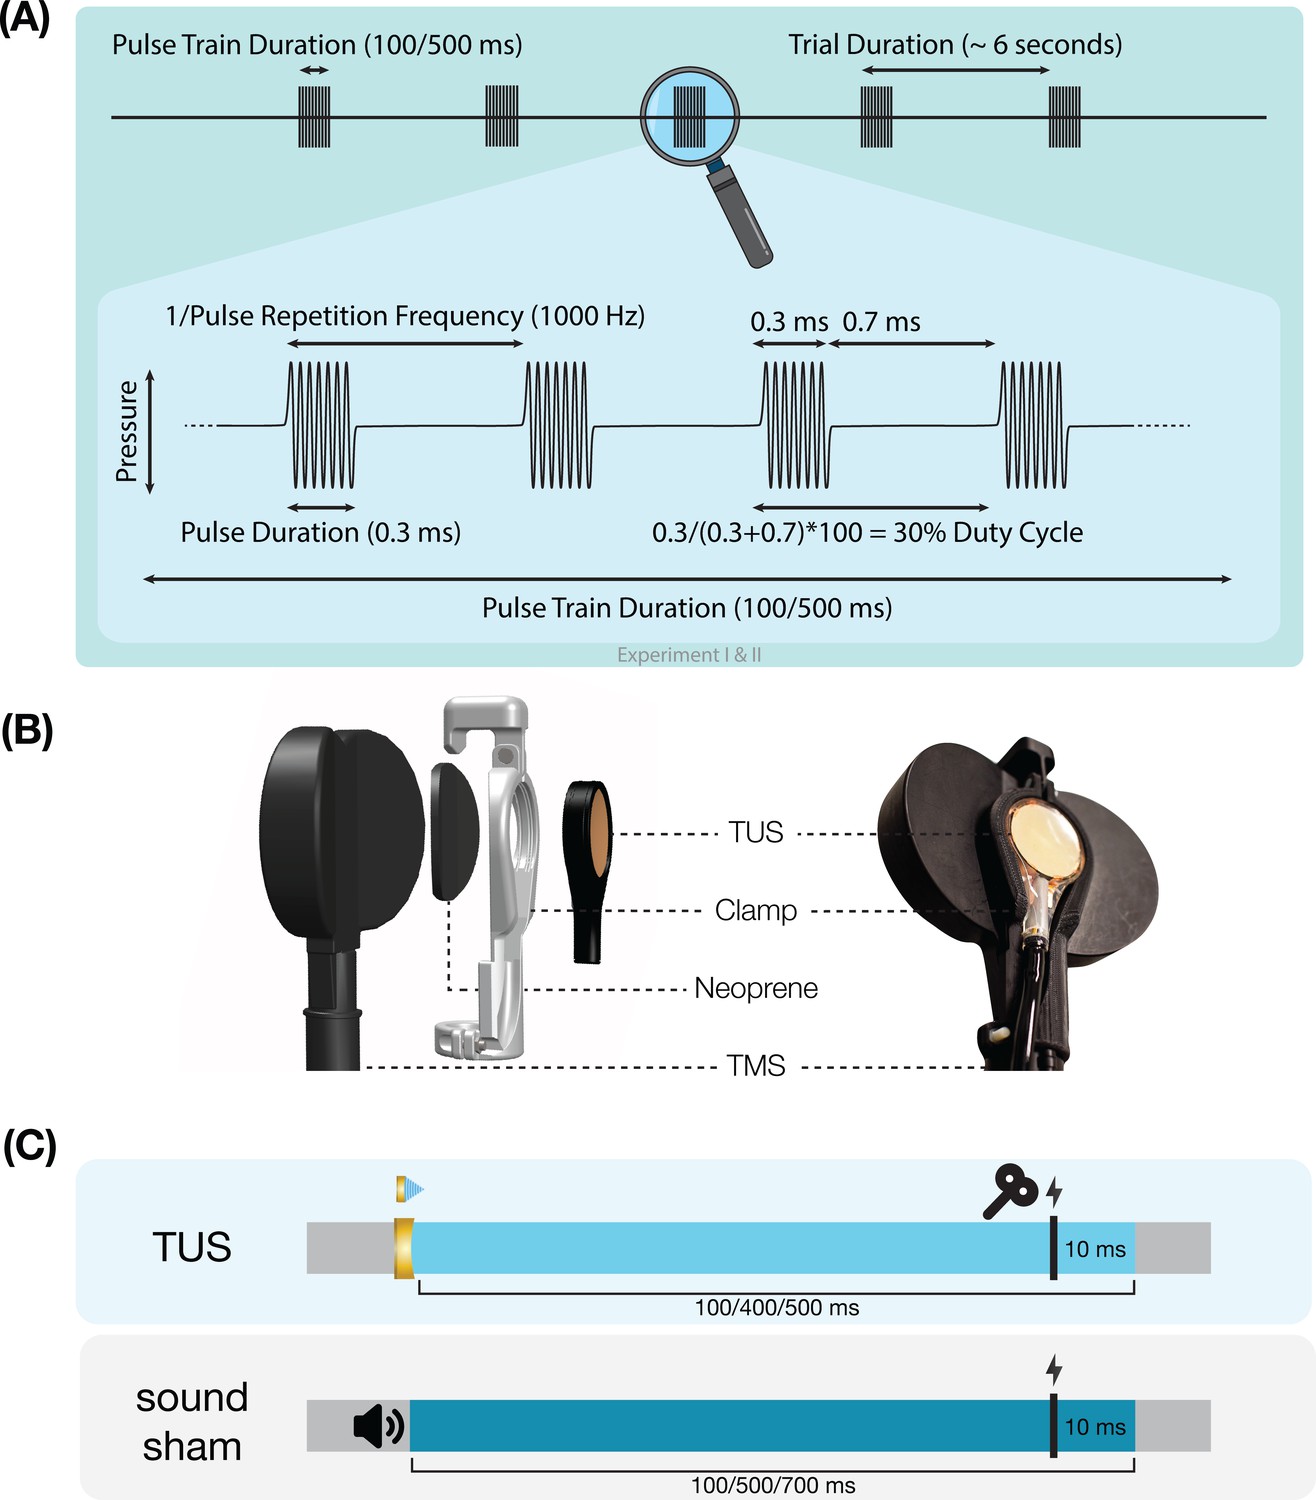
Experimental procedures.
(A) Ultrasonic stimulation protocol for Experiments I & II. In Experiment III a duty cycle of 10% was used. In Experiment IV a stimulus duration of 400 ms was used. (B) Transcranial ultrasonic stimulation (TUS)-transcranial magnetic stimulation (TMS) clamp (https://doi.org/10.5281/zenodo.6517599). (C) Experimental timing. Detailed experimental timing for each experiment is reported in Appendix 7—figures 1–4.
Figure 8
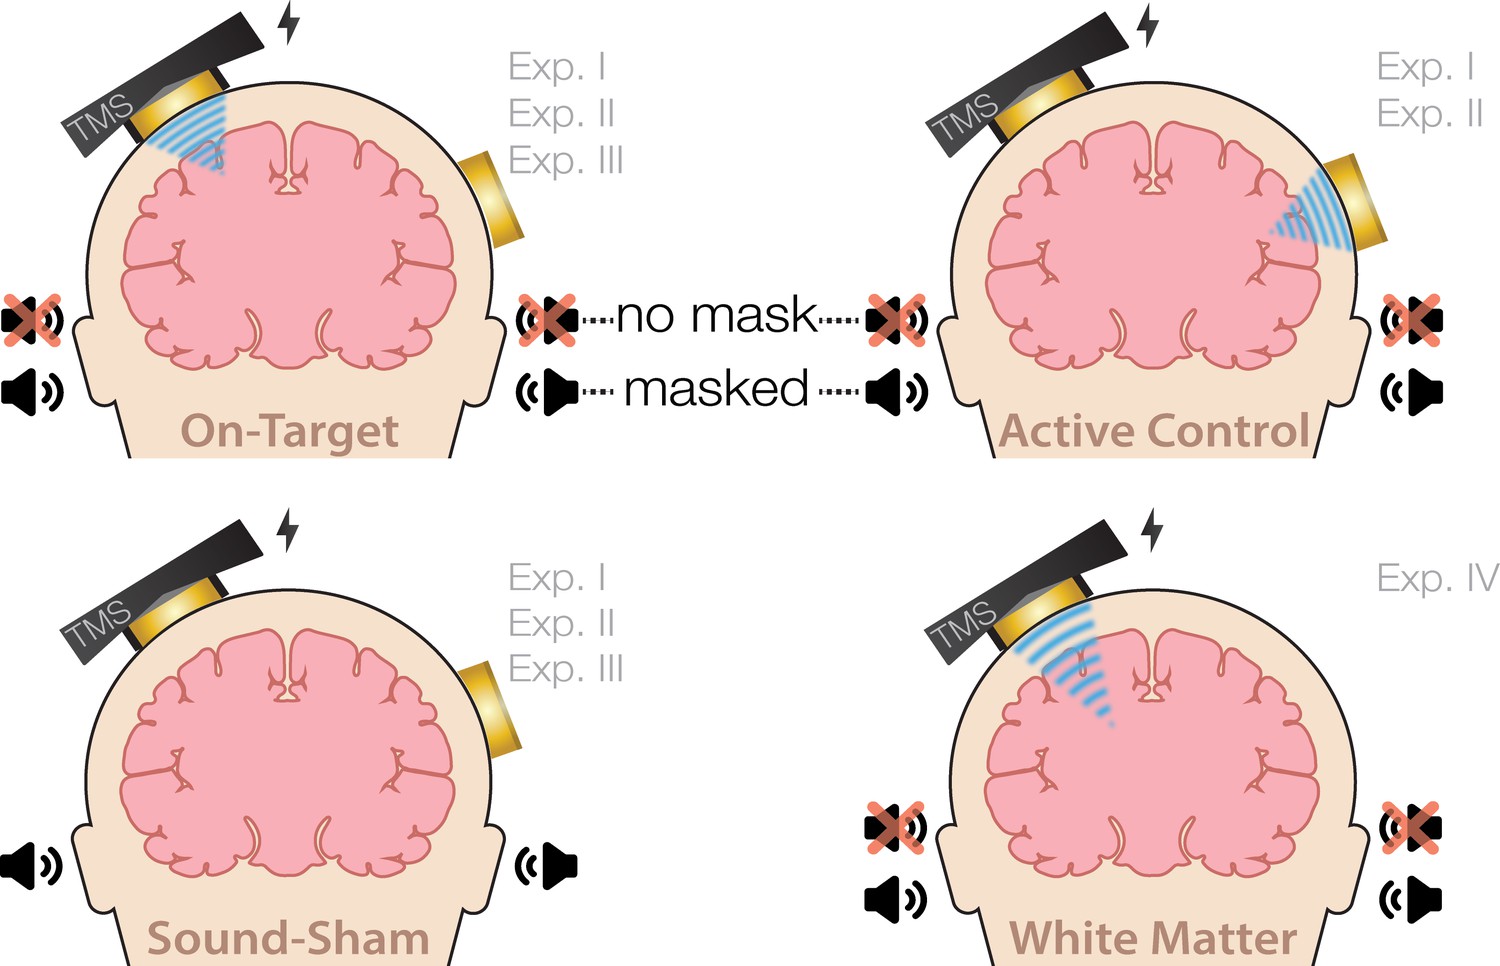
Experimental conditions.
On-target transcranial ultrasonic stimulation (TUS) of the left-hemispheric hand motor area (Exp. I-III), active control TUS of the right-hemispheric face motor area (Exp. I–II), sound-only sham (Exp. I-III), and inactive control TUS of the white matter ventromedial to the hand motor area (Exp. IV). Conditions involving TUS were presented both with and without auditory masking stimuli.
Figure 9

Contribution diagram.
This figure depicts the involvement of each author using the CRediT taxonomy (Brand et al., 2015) and categorizes their contributions according to three levels represented by color: ‘none (gray)’, ‘substantial contribution (light green)’, ‘leading contribution (dark green)’.
Appendix 1—figure 1
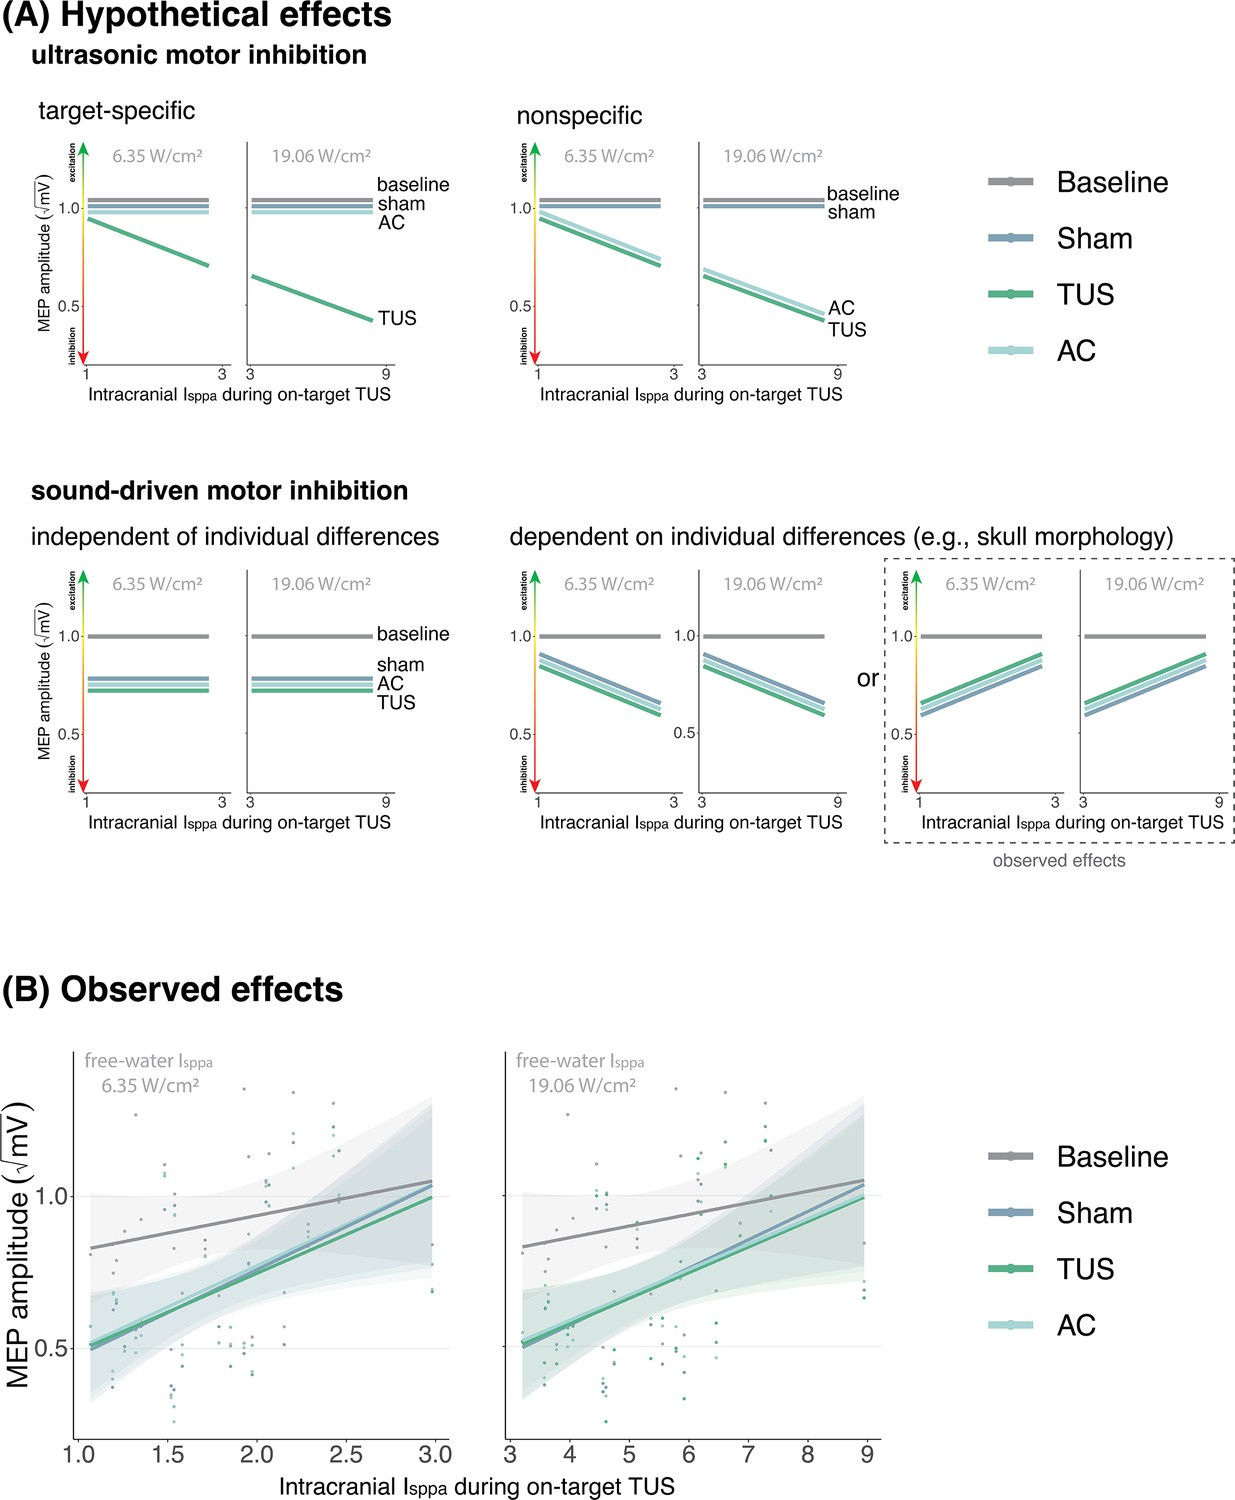
No evidence for direct intracranial dose-response effects (Exp. II).
(A) Hypothetical effects. A target-specific dose-response effect of transcranial ultrasonic stimulation (TUS) would be reflected by a change in motor-evoked potential (MEP) amplitude with increasing intracranial intensity only for on-target TUS (top left), whereas a nonspecific effect of TUS would show the same ‘dose-response’ for both on-target and active control conditions (top right). If there is sound-driven inhibition, a motor inhibitory effect would be observed for on-target, active control, and sound-only sham (bottom left). If sound-driven inhibition would be subject to individual differences, for example in skull morphology which correlates with intracranial intensity, there would be a correlation between MEP amplitude and intracranial intensity that exists for on-target, active control, and sound-sham conditions (bottom right). The latter corresponds with the observed effects. (B) Average square root corrected MEP amplitude, plotted separately for baseline, sham, TUS, and active control conditions, across simulated intracranial intensities. For each participant, we estimated the intracranial ultrasound intensity at the hand M1 target, represented on the x-axis, and the average MEP amplitude for all four conditions. Results for on-target and active control delivered at 6.35 W/cm2 free-water Isppa are depicted on the left, and at 19.06 W/cm2 free-water Isppa are depicted on the right. Please note that, for reference, the baseline and sham conditions are duplicated across both plots. There is no significant difference between on-target TUS and control conditions across inter-individual intracranial intensities. Points represent the average MEP amplitude per participant per condition. The shaded area represents the 95% CI.
Appendix 2—figure 1
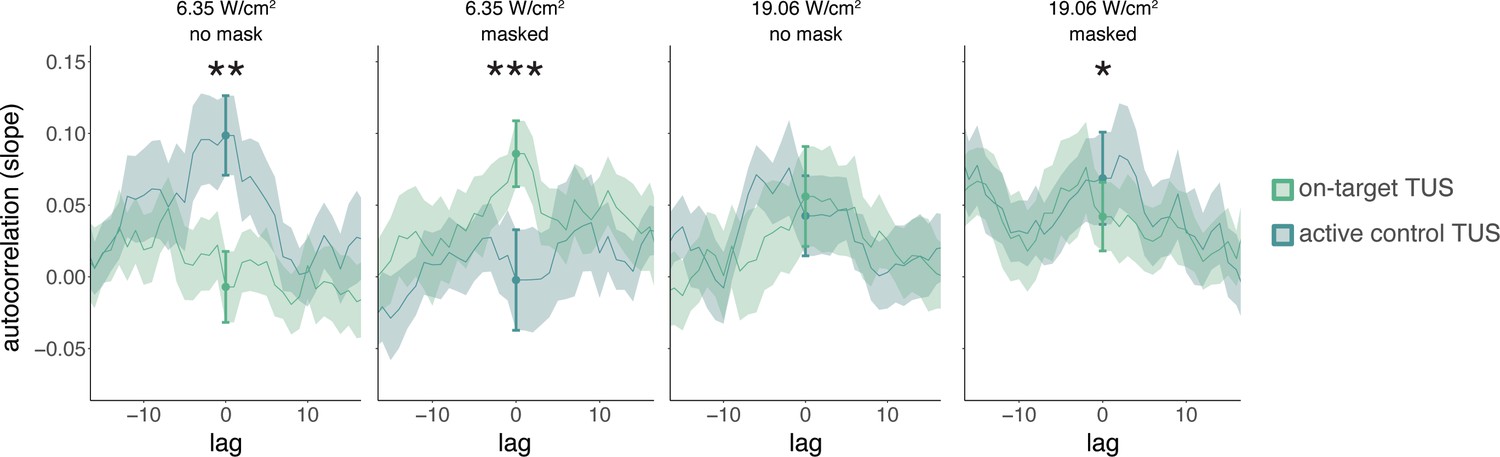
Temporal dynamics (Exp. II).
We operationalized autocorrelation as the slope between motor-evoked potential (MEP) amplitude on a given trial (t) and its preceding baseline MEP amplitude (t-1) for each condition. Statistical inference is drawn at the current trial (lag = 0). Dots and error bars reflect the mean and standard error of the slopes across participants for each level of on-target and active control transcranial ultrasonic stimulation (TUS). Additionally, for visualization purposes, we display autocorrelation for shifts in the preceding baseline time series, with lags ranging from -15 to +15 trials. The line depicts the mean slope across participants for each lag, and the shaded area represents the standard error. *p<0.05, **p<0.01, ***p<0.001.
Appendix 3—figure 1
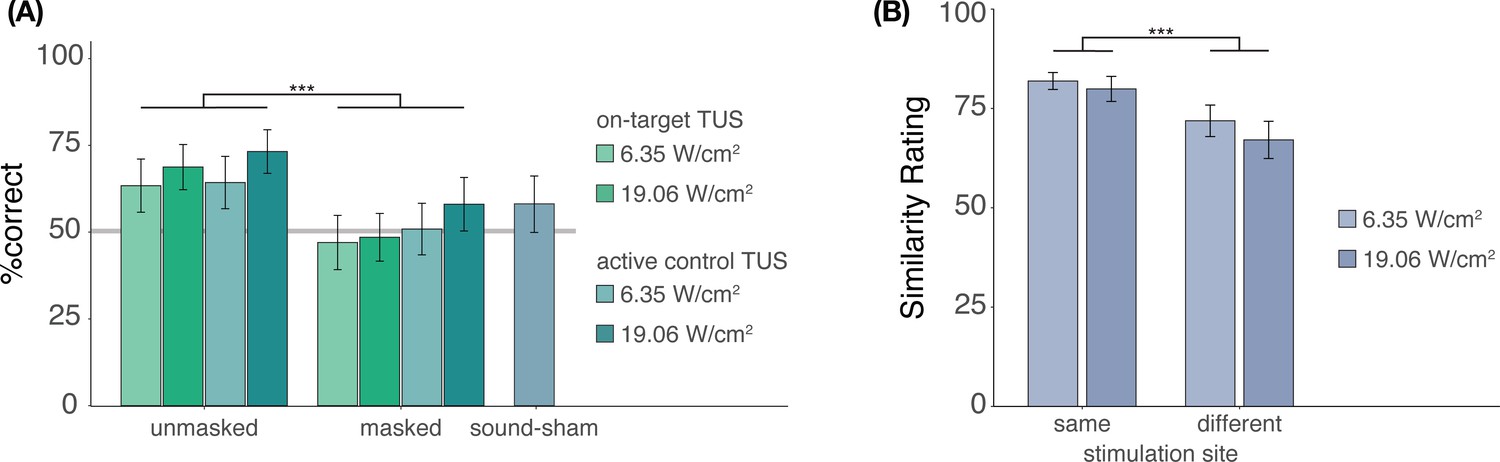
Blinding efficacy (Exp. II).
(A) An auditory masking stimulus significantly decreased participants’ ability to determine whether they had received ultrasonic stimulation. (B) However, when masked stimulation was applied over different sites, participants still rated these stimuli as sounding less similar than stimulation applied over the same site. Bars represent means across participants, error bars represent the standard error, and points represent individual participants. ***p<0.001.
Appendix 4—figure 1
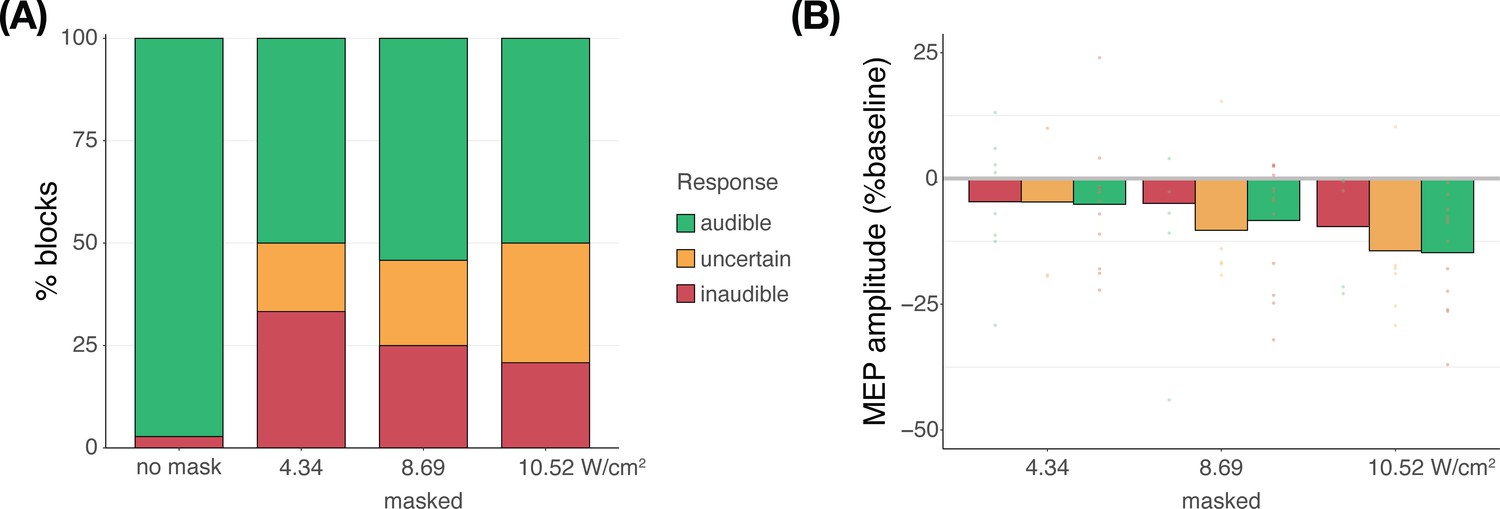
Subjective report of transcranial ultrasonic stimulation (TUS) audibility (Exp. IV).
(A) Depicting the percentage of blocks for which participants reported a condition as audible, uncertain, or inaudible. When no mask was applied, TUS was audible (green) in nearly all cases. During continuous masking, TUS was experienced as inaudible (red) less often at higher stimulation intensities. Descriptively, reports of inaudibility scale with motor-evoked potential (MEP) amplitudes such that in conditions where TUS was inaudible more frequently, less motor inhibition was observed. (B) Motor inhibitory effects during masked stimulation, split by audibility. Descriptively, when masking rendered TUS inaudible, less motor inhibition was observed than when participants were uncertain or when stimulation was heard.
Appendix 5—figure 1

Acoustic simulations for Experiment I.
Individual simulations for Experiment I of acoustic wave propagation at 65 W/cm2 free-water stimulation intensity. Simulated pulse-average intensities above 0.15 W/cm2 are depicted. The FWHM of the pressure is indicated by the dashed white line.
Appendix 5—figure 2

Thermal simulations for Experiment I.
Individual simulations for Experiment I of thermal rise at 65 W/cm2 free-water stimulation intensity.
Appendix 5—figure 3

Acoustic simulations for Experiment II.
Individual simulations for Experiment II of acoustic wave propagation at 19.05 W/cm2 free-water stimulation intensity. Simulated pulse-average intensities above 0.15 W/cm2 are depicted. The FWHM of the pressure is indicated by the dashed white line.
Appendix 5—figure 4

Thermal simulations for Experiment II.
Individual simulations for Experiment II of thermal rise at 19.05 W/cm2 free-water stimulation intensity.
Appendix 5—figure 5
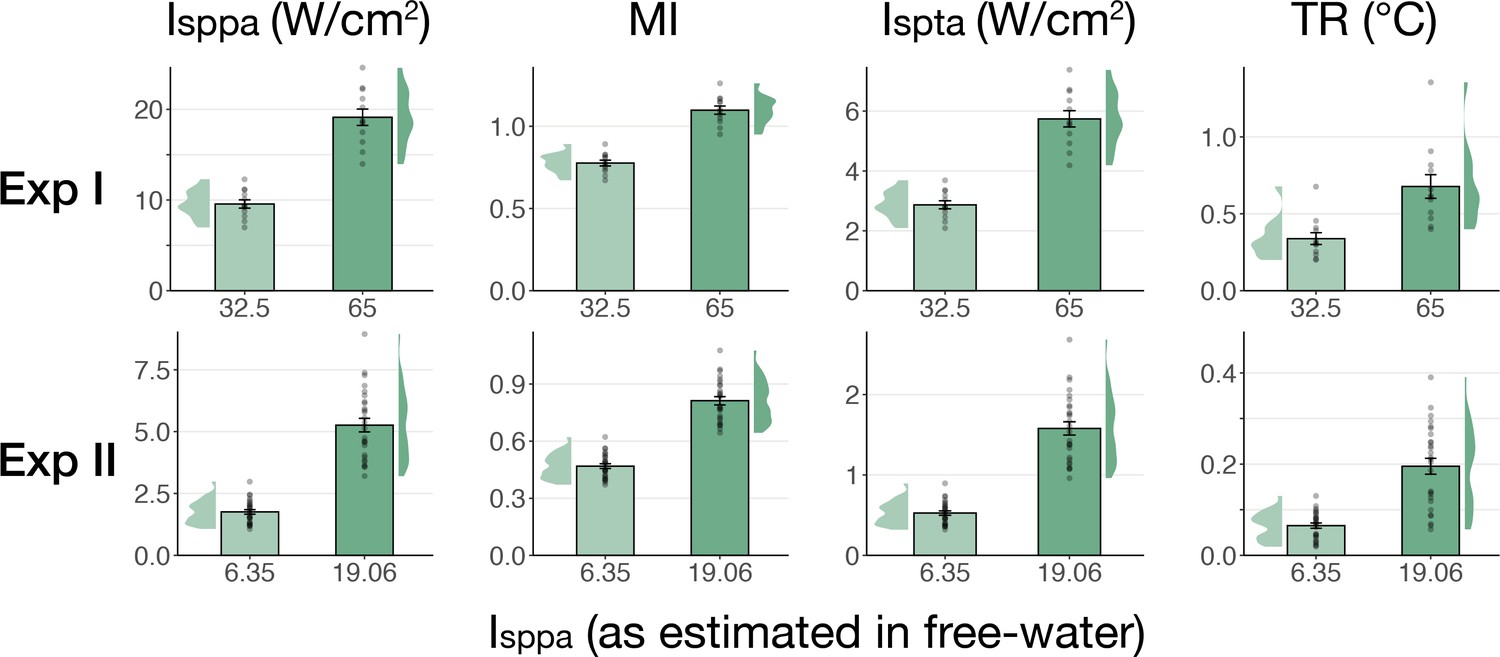
Simulated intracranial indices (Exp. I-II).
Simulated indices for Experiment I (top) and Experiment II (bottom) for both applied free-water stimulation intensities including spatial-peak pulse- and temporal-average intensity (Isppa, Ispta), the mechanical index (MI), and peak thermal rise (TR).
Appendix 6—figure 1
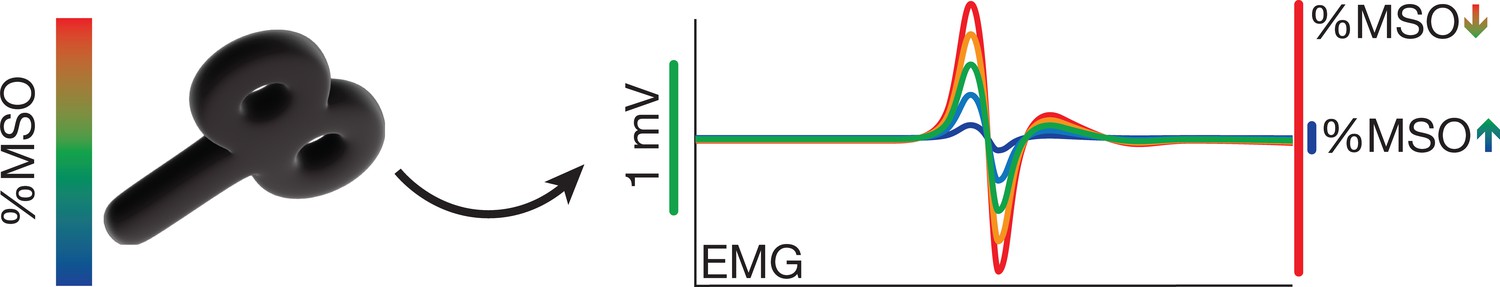
Transcranial magnetic stimulation (TMS) hotspot and intensity determination.
Percentage of maximum stimulator output (%MSO) is determined by finding the motor hotspot and then adjusting %MSO until a stable 1 mV motor-evoked potential (MEP) is observed (Experiments I-III) or until a MEP of minimally 0.05 mV is observed on at least half of trials (Experiment IV).
Appendix 6—figure 2

Transcranial magnetic stimulation (TMS) intensities in Experiment III.
Percentage maximum stimulator output (%MSO) required in Experiment III to evoke a 1 mV motor-evoked potential (MEP) at baseline and during the four sound-sham conditions. Each sound-sham condition required a significantly higher %MSO than the baseline to evoke a 1 mV MEP. **p<0.01, ***p<0.001.
Appendix 7—figure 1
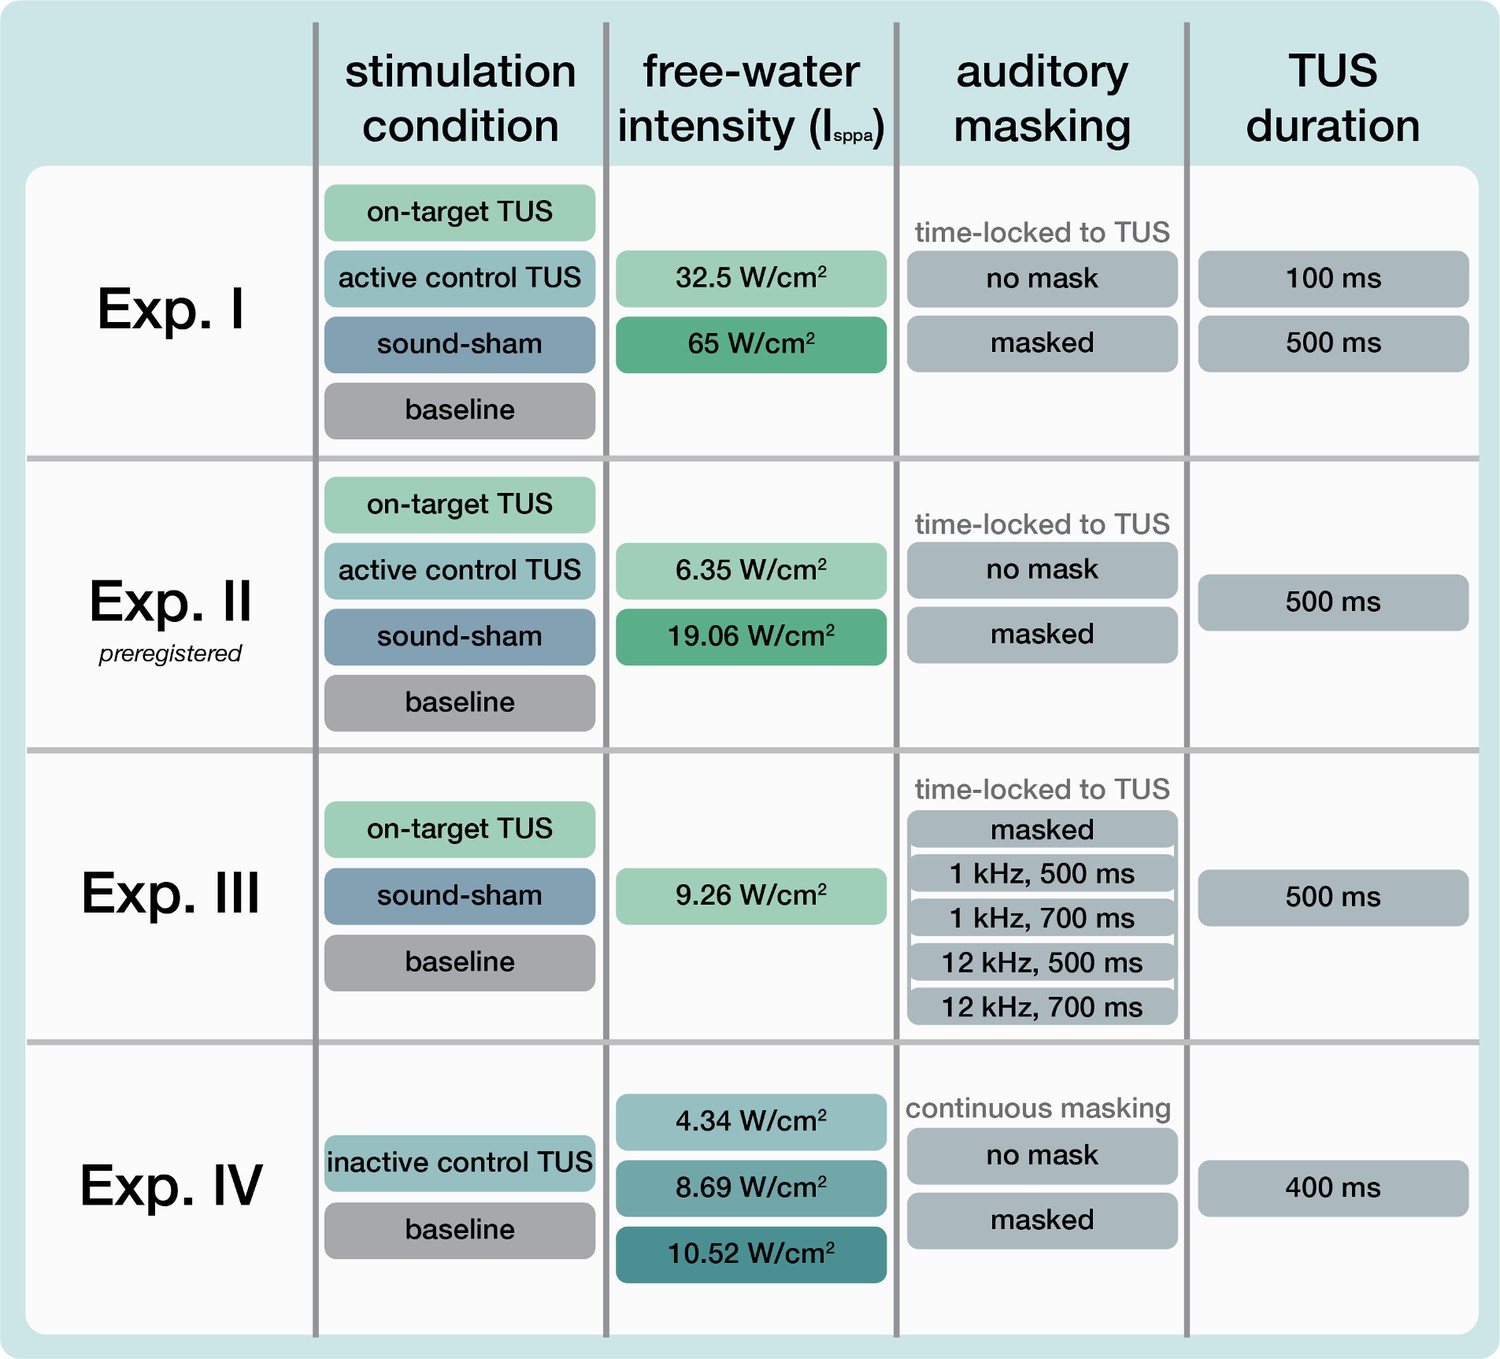
Overview of experimental conditions.
For each experiment (row), core experimental conditions are noted. In Experiments I and II, the main conditions included on-target transcranial ultrasonic stimulation (TUS) (left-hemispheric hand motor area), active control TUS (right-hemispheric face motor area), sound-sham (auditory stimulation alone), and baseline (transcranial magnetic stimulation, TMS only). Here, TUS was applied at two stimulation intensities, and both with and without a time-locked auditory masking stimulus. We report the spatial-peak pulse-averaged intensity in free water without attenuation from biological tissue. In Experiment I, TUS was further administered at both 100 and 500 ms stimulus durations. Experiment II is a preregistered study to confirm and extend the findings of Experiment I. In Experiment III, four auditory stimuli of varying pitch and duration were administered both in isolation (sound-sham) and alongside on-target TUS. In Experiment IV, inactive control TUS was administered to the white matter ventromedial to the hand motor area at three intensities (i.e. auditory confound volumes) both with and without a continuous auditory masking stimulus.
Appendix 7—figure 2
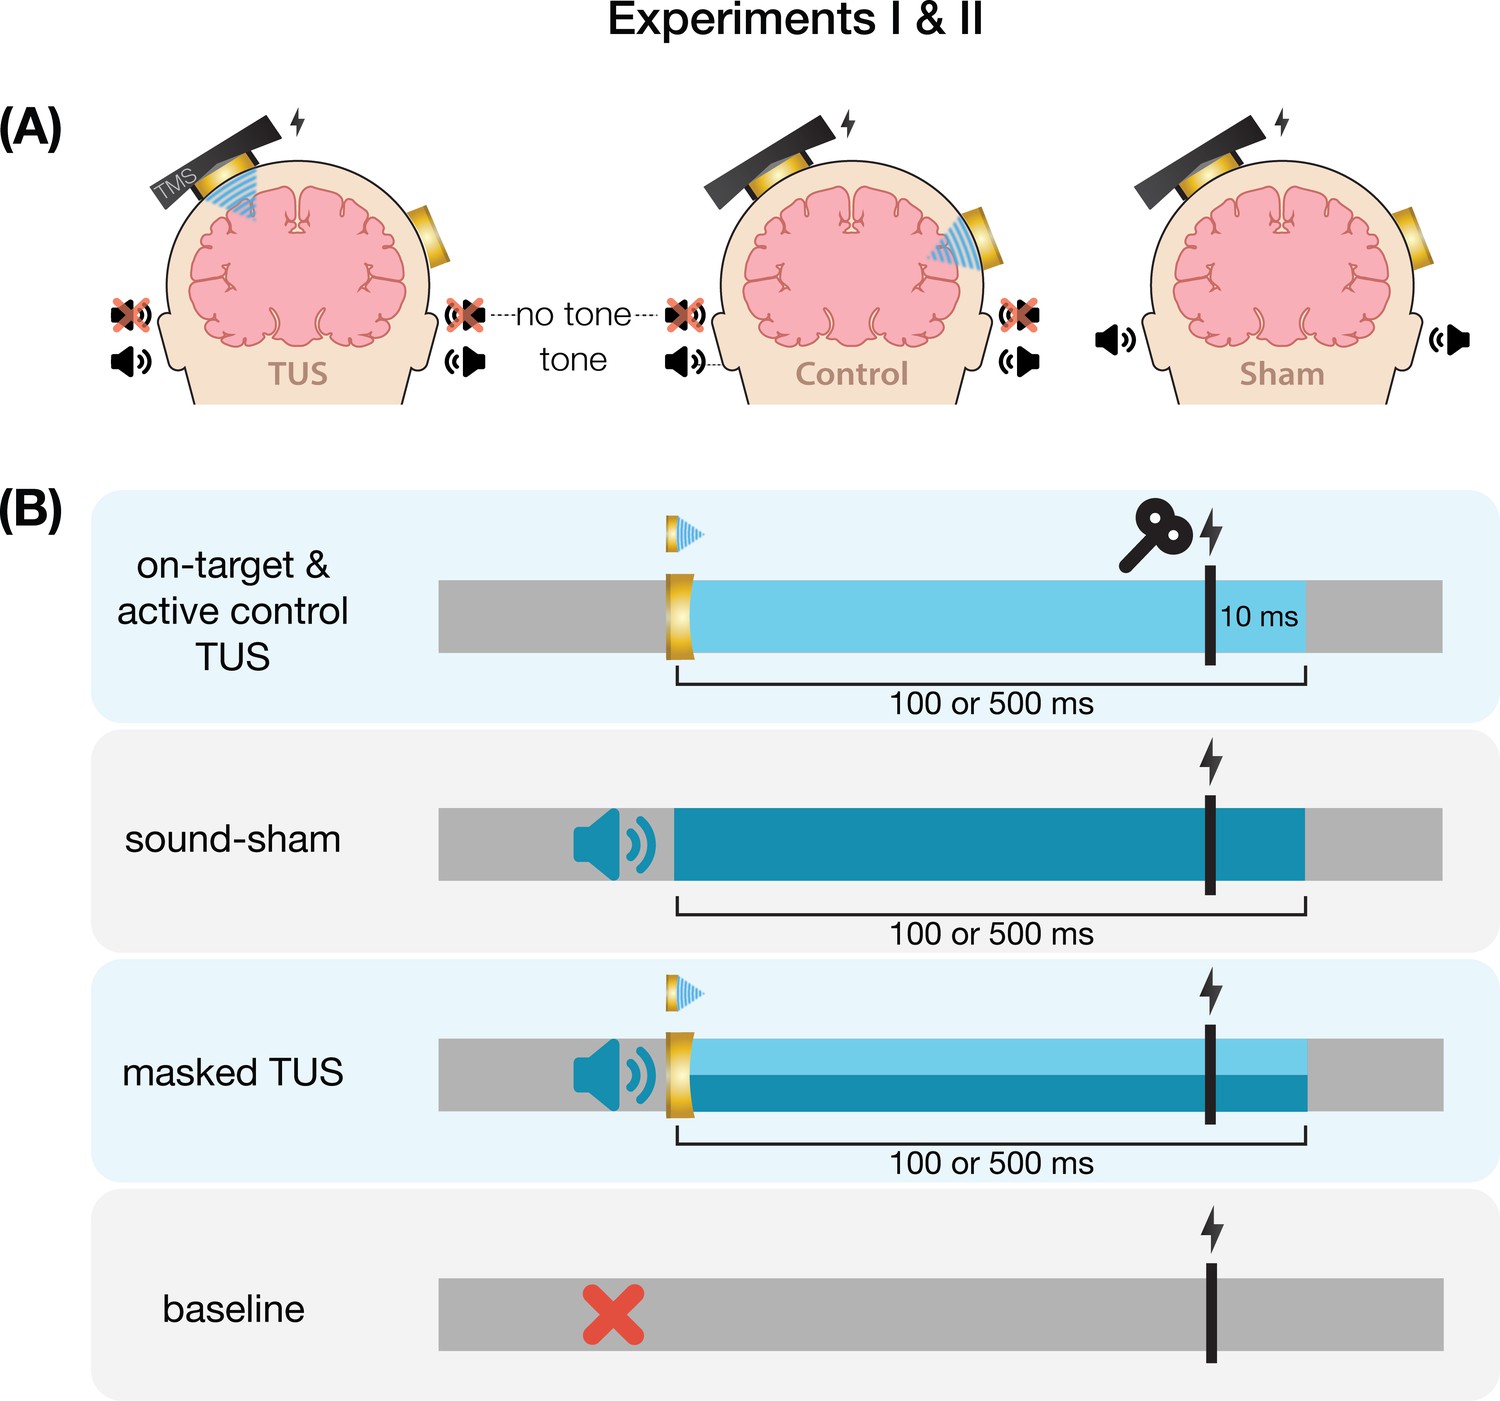
Conditions and timing of Experiments I & II.
(A) On-target left-hemispheric hand area stimulation (left) and active control right-hemispheric face area stimulation (middle) were applied both with and without a masking tone. The sham condition (right) consisted solely of an identical tone. (B) On-target and active control transcranial ultrasonic stimulation (TUS) were administered for 100 ms [Experiment I] and 500 ms [Experiments I & II] with transcranial magnetic stimulation (TMS) applied 10 ms prior to TUS-offset. In Experiment I, the auditory stimulus administered during sound-sham and masked conditions began ~50 earlier and was 100 ms longer than TUS, while in Experiment II the auditory stimulus was precisely timed to match TUS. Baseline measurement involved no intervention other than TMS.
Appendix 7—figure 3
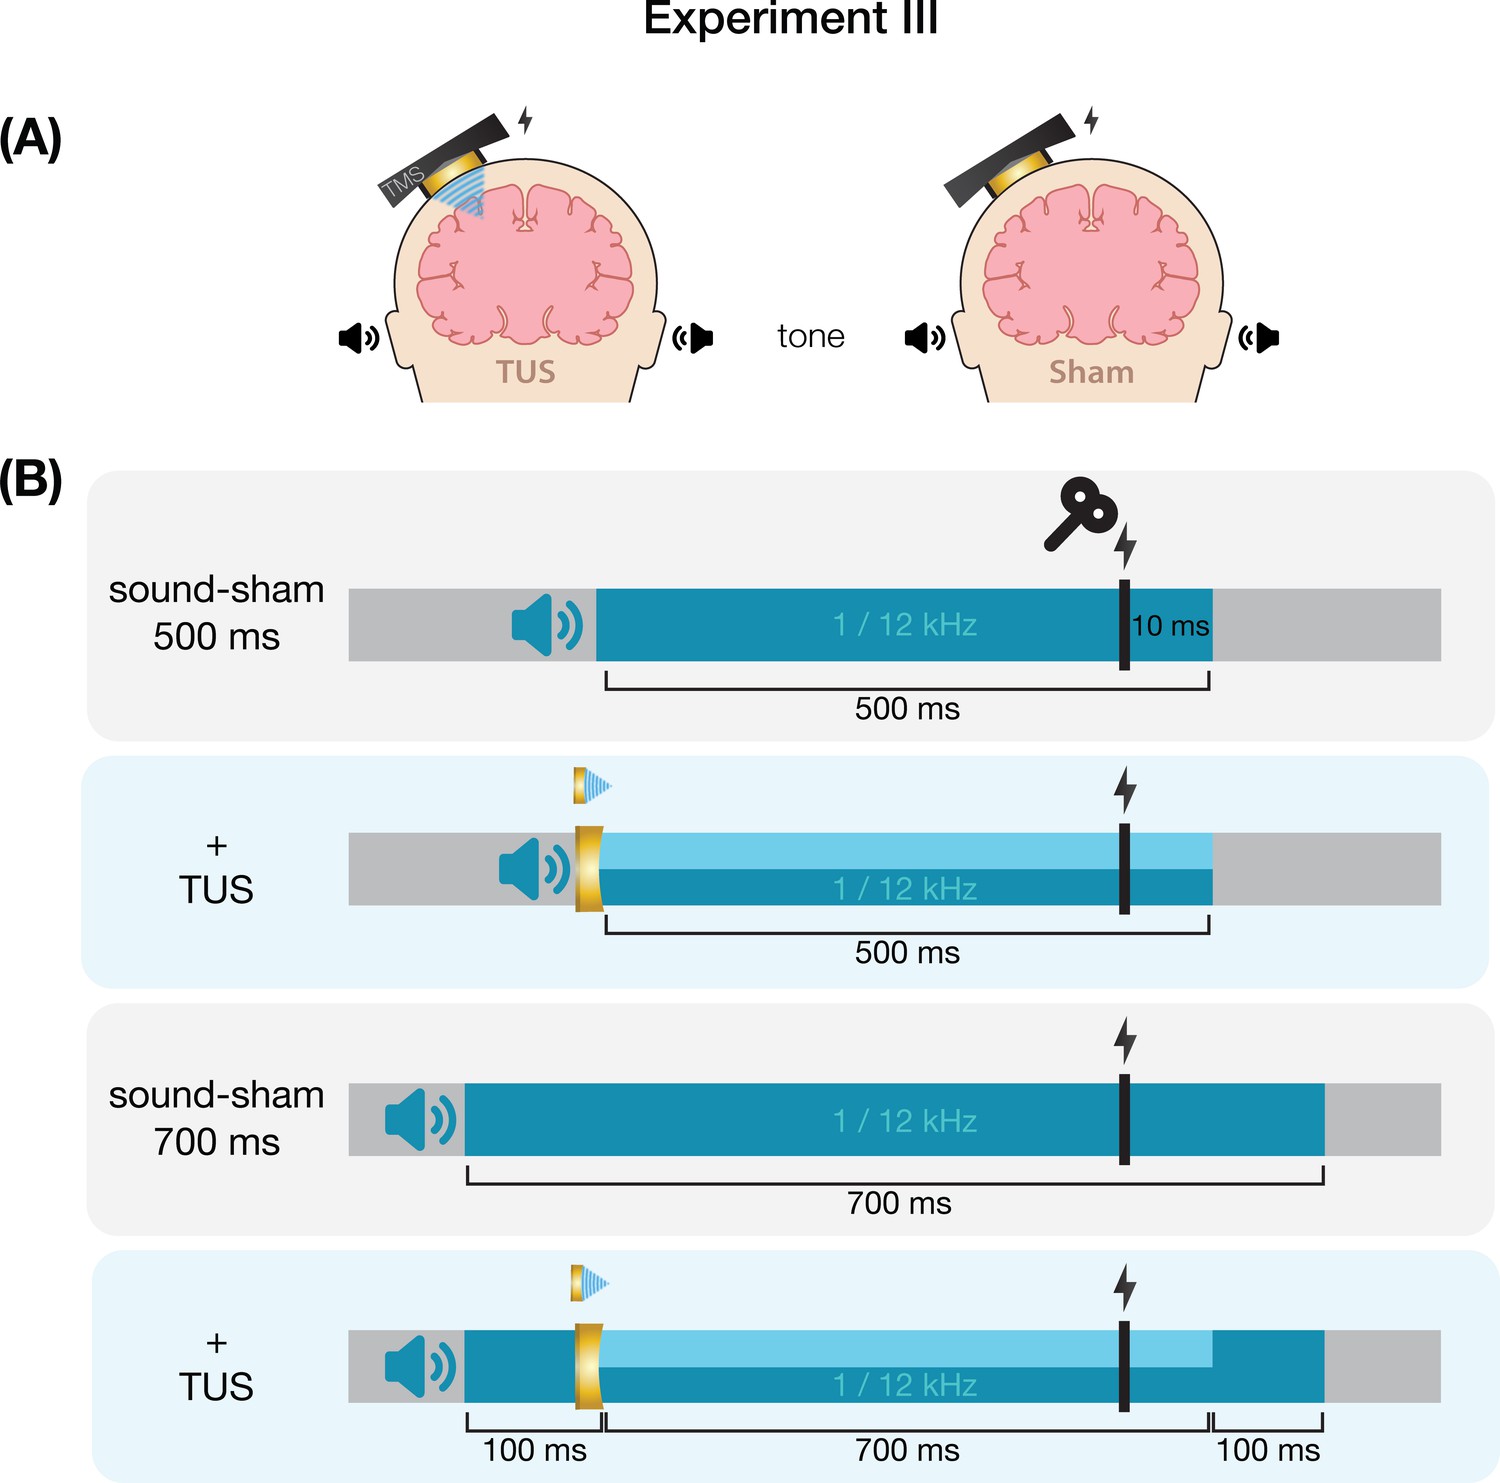
Conditions and timing of Experiment III.
(A) On-target transcranial ultrasonic stimulation (TUS) consisted of left-hemispheric hand motor area stimulation in concurrence with an auditory stimulus (left), while sound-sham consisted solely of an auditory stimulus (right). (B) Auditory stimuli were delivered at both 1 and 12 kHz for either 500 or 700 ms. TUS was delivered for 500 ms. Transcranial magnetic stimulation (TMS) was delivered 10 ms prior to TUS offset (i.e. following 490 ms of TUS), and at the same timing in the absence of TUS.
Appendix 7—figure 4
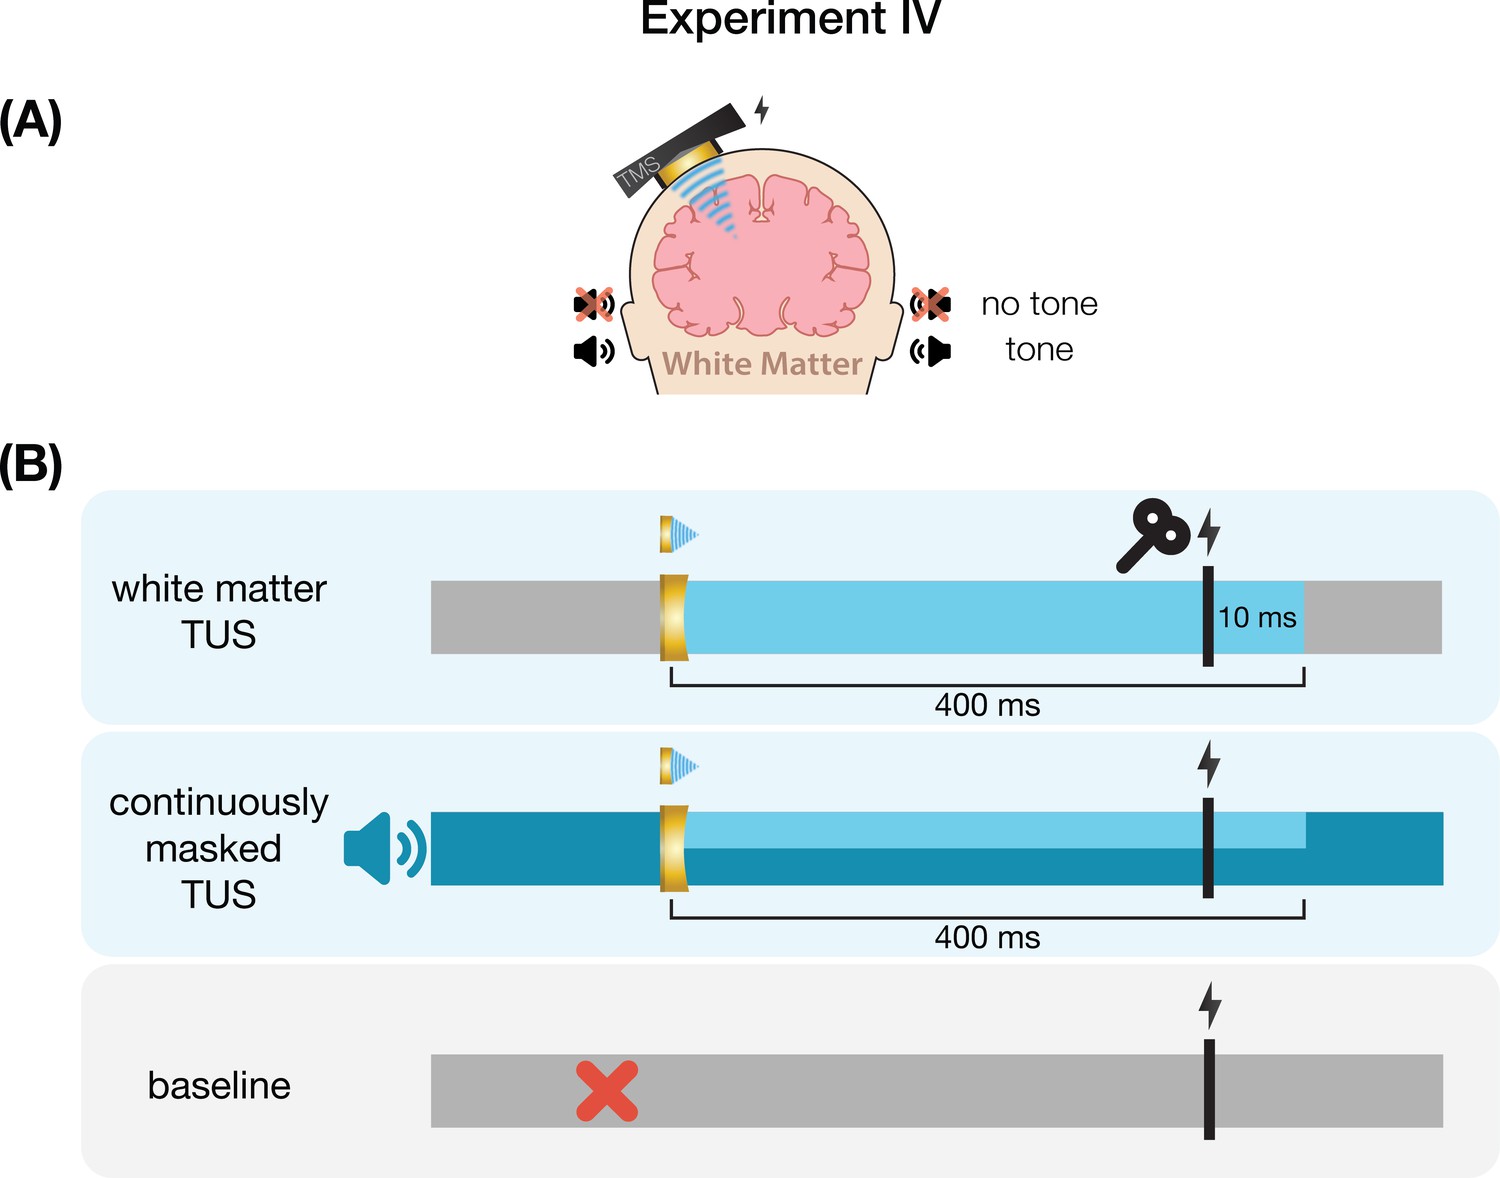
Conditions and timing of Experiment III.
(A) Inactive control stimulation of white matter ventromedial to the left-hemispheric hand motor area. (B) White matter transcranial ultrasonic stimulation (TUS) was administered for 400 ms, with transcranial magnetic stimulation (TMS) applied 10 ms prior to TUS offset. In the masked condition, an auditory stimulus was played continuously throughout the entire block.
Tables
Table 1
Ultrasonic stimulation parameters.
| Exp. | f(kHz) | depth (mm) | PD(ms) | PRF(kHz) | DC | PTD(ms) | Isppa(W/cm2) | P(Mpa) | MItc |
|---|---|---|---|---|---|---|---|---|---|
| I | 500 | 35 | 0.3 | 1000 | 30% | 100/500 | 32.5/65 | 1.02/1.44 | 0.99/1.40 |
| II | 250 | 28 | 0.3 | 1000 | 30% | 500 | 6.35/19.06 | 0.45/0.78 | 0.65/1.12 |
| III | 500 | 30 | 0.1 | 1000 | 10% | 500 | 9.26 | 0.54 | 0.53 |
| IV | 250 | 50* | 0.3 | 1000 | 30% | 400 | 4.34/8.69/10.52 | 0.37/0.53/0.58 | 0.53/0.76/0.83 |
-
f = fundamental frequency, depth = TPO focus setting for distance of free-water full-width half-maximum from transducer exit plane, PD = pulse duration, PRF = pulse repetition frequency, DC = duty cycle, PTD = pulse train duration, Isppa = spatial-peak pulse-average intensity in free-water, P = pressure, MItc = transcranial derated mechanical index. The ramp shape for all experiments was rectangular. For estimated intracranial indices for Experiments I & II see Appendix 5—figure 5.
-
*
Note: Experiments I-III targeted the hand motor area. Experiment IV targeted the corticospinal white matter.
Appendix 5—table 1
Properties for acoustic and thermal simulations (Exp. I-II).
| Density (kg/m3) | Sound speed (ms) | Attenuation coefficient | Thermal conductivity (W/m/°C) | Specific heat capacity (J/kg/°C) | |
|---|---|---|---|---|---|
| Water | 994 | 1500 | 0.0 | 0.60 | 4178 |
| Scalp | 1090 | 1610 | 0.4 | 0.37 | 3391 |
| Skull | 1850 | 2800 | 8.0 | 0.32 | 1313 |
| Brain | 1046 | 1546 | 0.6 | 0.51 | 3630 |
-
This table describes the acoustic and thermal properties assigned to each component included in simulations.
Appendix 6—table 1
Electromyography.
| Experiment | Muscle | Amplification | Filtering | Digital sampling rate | Software |
|---|---|---|---|---|---|
| I & II | FDI | 1000 gain* | 1–1000 Hz* | 5 kHz† | Signal version 7.05‡ |
| III | FDI | 1000 gain§ | 20–2500 Hz§ | 5 kHz† | Signal version 6.04‡ |
| IV | APB | 10 gain¶ | <1250 Hz ¶ | 5 kHz ¶ | BEST Toolbox** |
-
This table describes the EMG acquisition parameters used to measure muscular activity in the first dorsal interosseous (FDI) or abductor pollicis brevis (APB) using a belly-tendon montage.
-
*
D440-2, Digitimer Ltd., Hertfordshire, UK.
-
†
Micro 1401, CED, Cambridge, UK.
-
‡
CED, Cambridge, UK.
-
§
Intronix Technologies Corporation [model: 2024F], Bolton, Canada.
-
¶
Bittium NeurOne Tesla System, Bittium Biosignals Ltd., Finland.
-
**
Appendix 8—table 1
Transducer specifications.
| Exp. | Model number | N elements | Radius of curvature | Aperature diameter | Width | Solid water coupling |
|---|---|---|---|---|---|---|
| I | CTX500-006 | 2 | 63.2 | 45.0 | ~16 | yes |
| II | CTX250-014 | 2 | 63.2 | 45.0 | ~16 | yes |
| III | H246-01 | 2 | 0 (flat) | 33.6 | 10 | no |
| IV | CTX250-005 | 2 | 63.2 | 45.0 | 16.45 | yes |
-
This table describes transducer specifications used with a Sonic Concepts TPO (Bothell, WA, USA).
Appendix 8—table 2
MRI acquisition parameters.
| Experiment | Scan | TR | TE | FoV read | FoV phase | voxel | N slices |
|---|---|---|---|---|---|---|---|
| I & II | T1w* | 2700 ms | 3.69 ms | 230 mm | 128.1% | 0.9 mm iso | 224 |
| T2w* | 3200 ms | 408 ms | 230 mm | 128.1% | 0.9 mm iso | 224 | |
| IV | T1w† | 2700 ms | 3.7 ms | 260 mm | 88.9% | 0.9 mm iso | 224 |
-
This table shows the MRI acquisition parameters used in Experiments I, II, and IV. Anatomical T1w scans were used for online neuronavigation. For Experiments I and II, both T1w and T2w scans were used for post-hoc acoustic and thermal simulations.
-
*
3T Siemens Skyra MRI scanner (Siemens Medical Solutions, Erlangen, Germany) with a 32-channel head coil.
-
†
3T Siemens Prisma MRI scanner with a 32-channel head coil.
Author response table 1
| Effect | DFn | DFd | F | P |
|---|---|---|---|---|
| intensity | 1 | 26 | 2.01136951 | 0.1679998 |
| procedure | 1 | 26 | 1.51481729 | 0.2294241 |
| masking | 1 | 26 | 0.55249790 | 0.4639630 |
| intensity:procedure | 1 | 26 | 0.05069027 | 0.8236267 |
| intensity:masking | 1 | 26 | 0.17466900 | 0.6794268 |
| procedure:masking | 1 | 26 | 0.27552687 | 0.6040957 |
| intensity:procedure:masking | 1 | 26 | 1.96443059 | 0.1728654 |
Additional files
Download links
A two-part list of links to download the article, or parts of the article, in various formats.
Downloads (link to download the article as PDF)
Open citations (links to open the citations from this article in various online reference manager services)
Cite this article (links to download the citations from this article in formats compatible with various reference manager tools)
Auditory confounds can drive online effects of transcranial ultrasonic stimulation in humans
eLife 12:RP88762.
https://doi.org/10.7554/eLife.88762.3


