FMRP regulates postnatal neuronal migration via MAP1B
- Sorbonne Université, CNRS UMR8246, Inserm U1130, Institut de Biologie Paris Seine (IBPS), Neuroscience Paris Seine (NPS), France
- Laboratory of Molecular Regulation of Neurogenesis, GIGA-Stem Cells and GIGA-Neurosciences, University of Liège, CHU Sart Tilman, Belgium
- Institut Curie, France
- Université de Paris, France
Figures
Figure 1
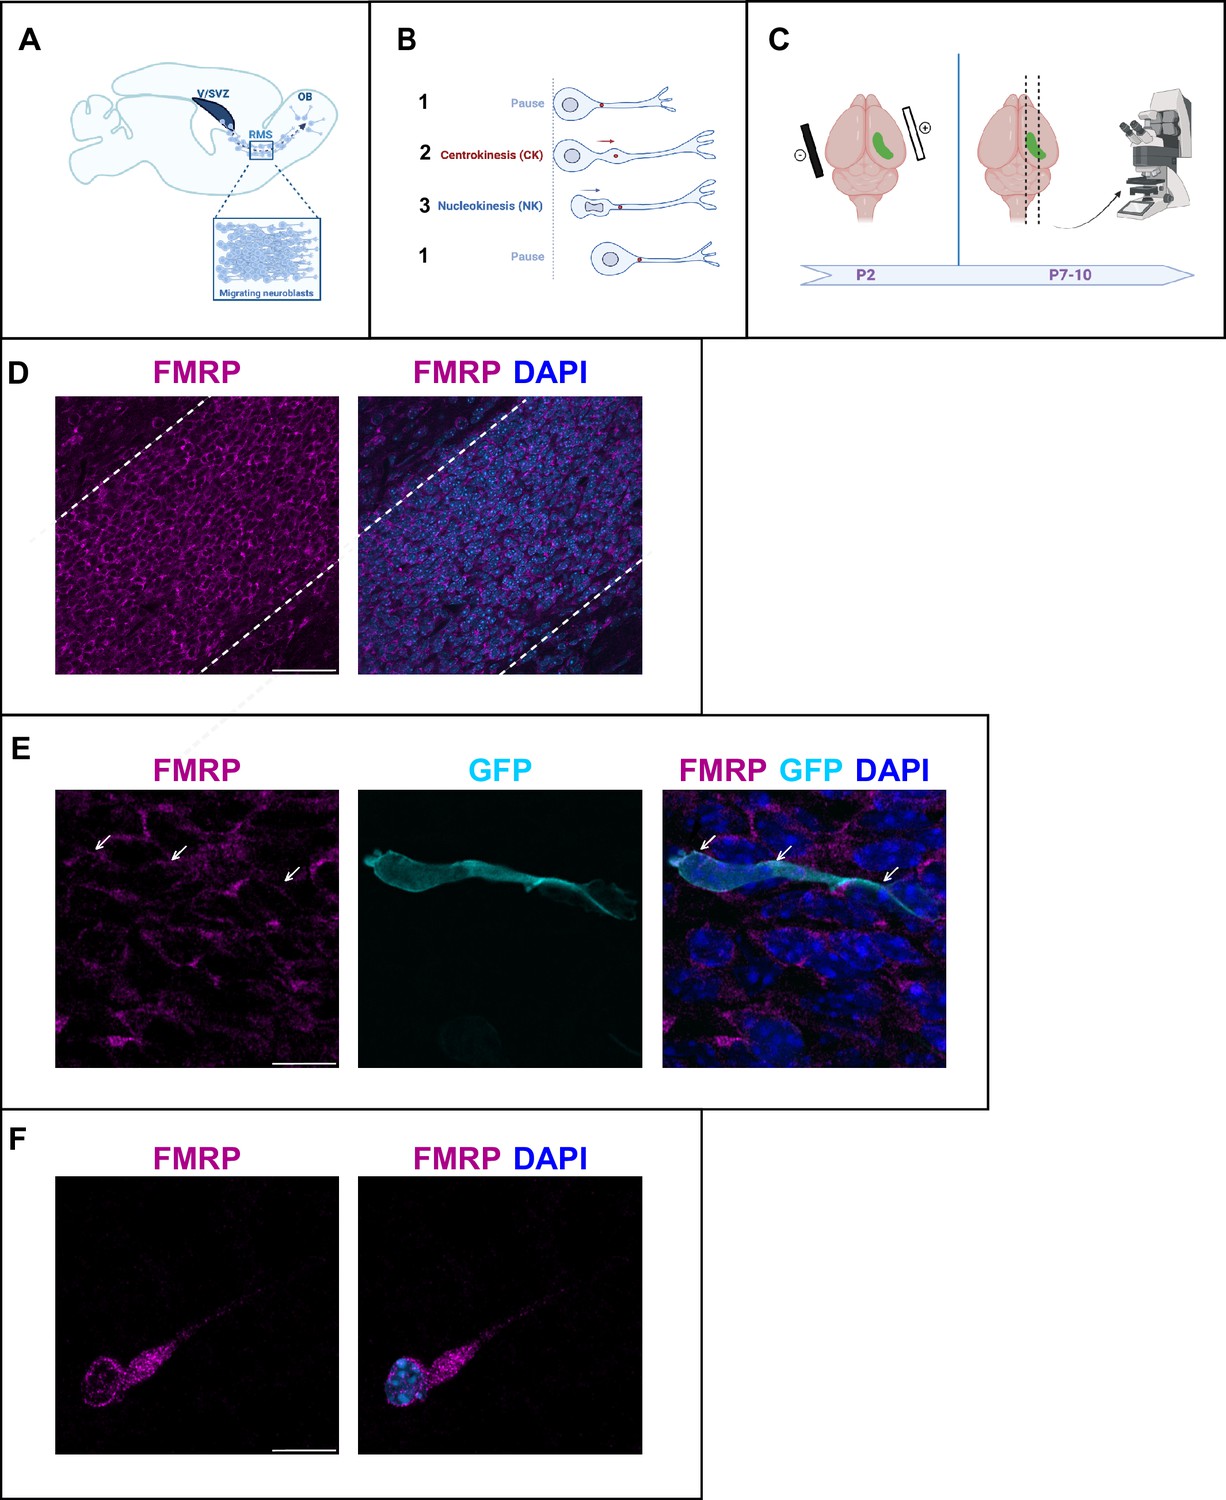
Fragile X messenger ribonucleoprotein (FMRP) is expressed in migrating neurons of the murine postnatal rostral migratory stream (RMS).
(A) Scheme of a sagittal section of the postnatal RMS connecting the V/SVZ to the OB. V/SVZ, ventricular/subventricular zone; OB, olfactory bulb; RMS, rostral migratory stream. The inset shows the high density of homotypically migrating neurons in the RMS. (B) Representation of cyclic saltatory migration. (1) The neuron is in pause. (2) The leading process extends, and the centrosome moves within a swelling in the leading process. (3) The nucleus moves forward. CK, centrokinesis; NK, nucleokinesis. (C) Scheme of the experimental procedure. 2-day-old neonates are intraventricularly electroporated with a GFP-expressing plasmid to label a cohort of migrating neurons that can be subsequently visualized in fixed or acute sections of the RMS. (D) Immunohistochemistry of the RMS showing FMRP expression (magenta) along the stream. The RMS is delineated with dotted lines. Scale bar: 50 μm. (E) Immunohistochemistry of a GFP-positive RMS neuron (cyan) showing FMRP subcellular expression (magenta). The GFP-positive neuron displays a cytoplasmic expression of FMRP around the nucleus (indicated by white arrows). The surrounding GFP-negative neurons express FMRP as well, following the same pattern. Scale bar: 10 μm. (F) Immunostaining for FMRP of a neuroblast migrating away from a V/SVZ explant in Matrigel. The labeling appears granular in the cytoplasm around the nucleus, in the swelling and the leading process. Scale bar: 10 μm.
Figure 2 with 4 supplements
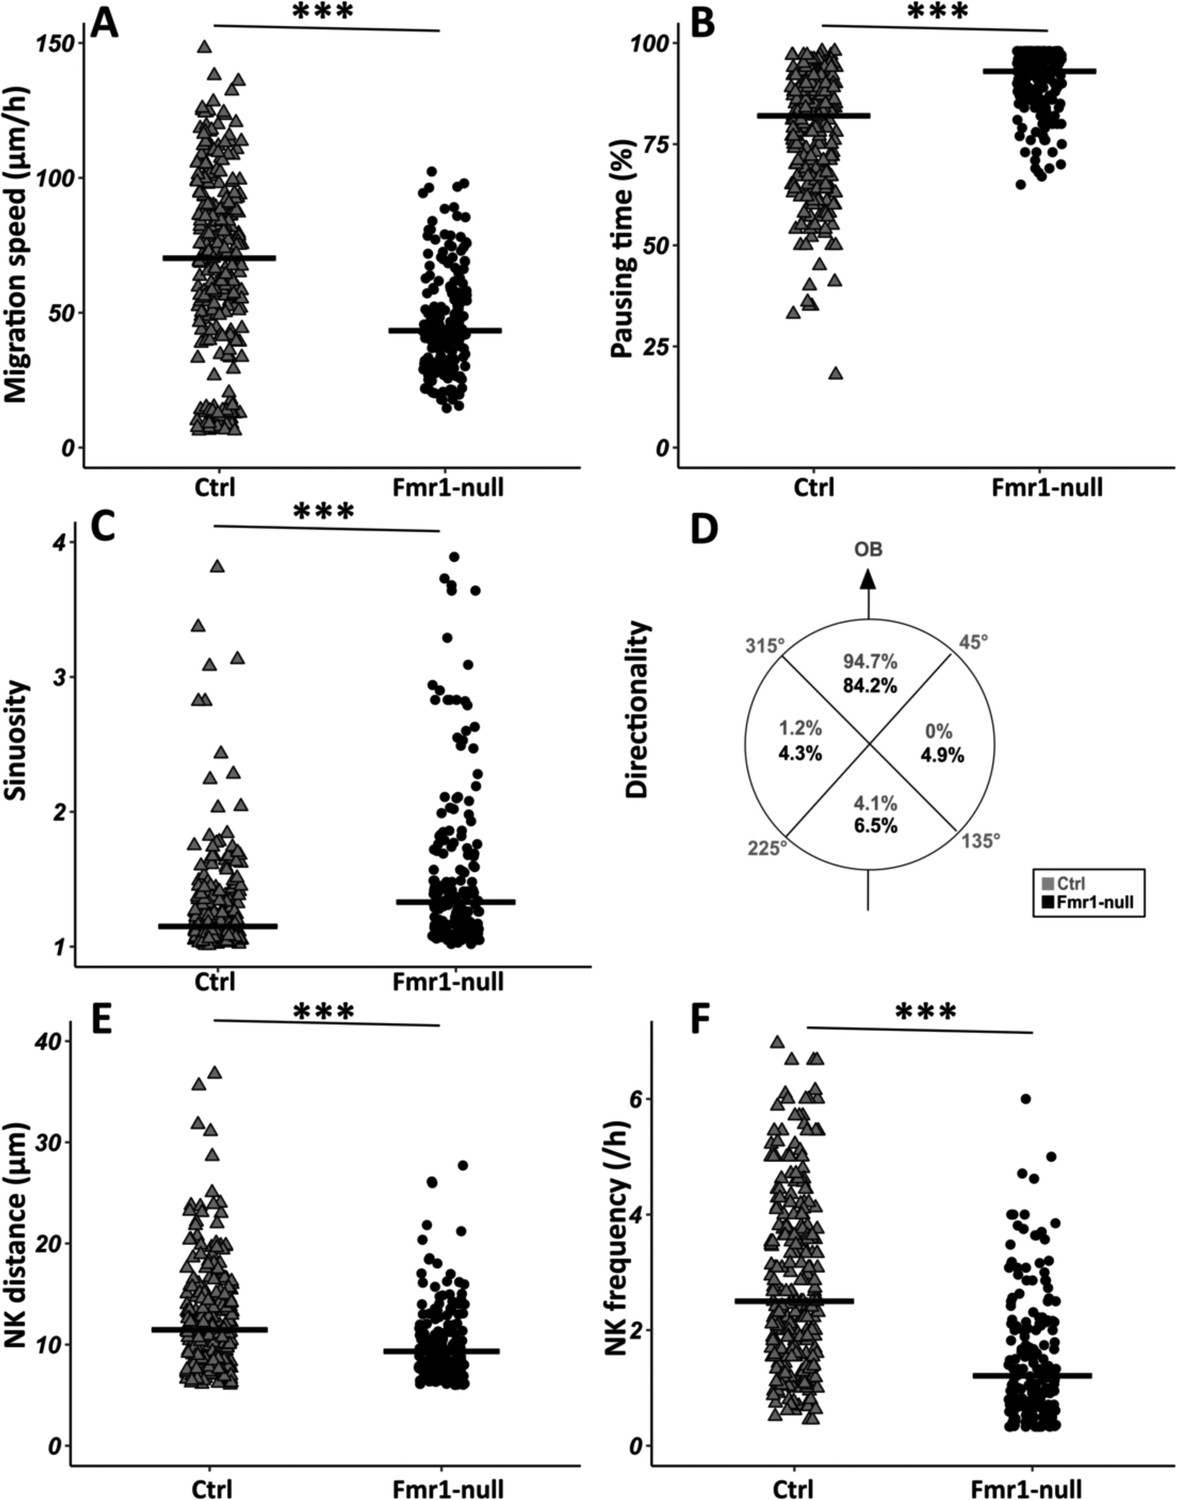
Migration defects in Fmr1-null neurons.
(A) Migration speed of control (Ctrl) and Fmr1-null neurons. Ctrl: 70.62 (43.32) μm/hr; Fmr1-null: 43.34 (25.97) μm/hr (Kruskall-Wallis test: Chi2=91.92, p-value <0.001, df = 3; followed by Dunn’s post hoc test). (B) Percentage of pausing time of control and Fmr1-null neurons. Ctrl: 82 (21.50); Fmr1-null: 93 (9.25) (Kruskall-Wallis test: Chi2=130.61, p-value <0.001, df = 3; followed by Dunn’s post hoc test). (C) Sinuosity index of control and Fmr1-null neurons. Ctrl: 1.15 (0.26); Fmr1-null: 1.35 (0.66) (Kruskall-Wallis test: Chi2=65.19, p-value <0.001, df = 3; followed by Dunn’s post hoc test). (D) Migration directionality radar represented in four spatial dials. Percentage of cells migrating in each spatial direction in control and Fmr1-null neurons, relatively to the vector going straight from the subventricular zone (SVZ) to the olfactory bulb (OB) (Fisher’s exact test, p-value <0.001). (E) Nucleokinesis (NK) mean distance of control and Fmr1-null neurons. Ctrl: 11.46 (6.27) μm; Fmr1-null: 9.34 (4.16) μm (Kruskall-Wallis test: Chi2=53.45, p-value <0.001, df = 3; followed by Dunn’s post hoc test). (F) NK frequency of control and Fmr1-null neurons. Ctrl: 2.5 (2.23) NK/hr; Fmr1-null: 1.21 (1.45) NK/hr (Kruskall-Wallis test: Chi2=111.53, p-value <0.001, df = 3; followed by Dunn’s post hoc test). The black line represents the median. Ctrl: N=3, n=275; Fmr1-null: N=3, n=184. Median (IQR). ***p-value <0.001. Source videos, tracking data (NK frequency, pausing time, sinuosity, speed, NK distance, directionality), and statistical analysis of migrating control and Fmr1-null neurons are available at https://osf.io/eqhzx.
Figure 2—figure supplement 1
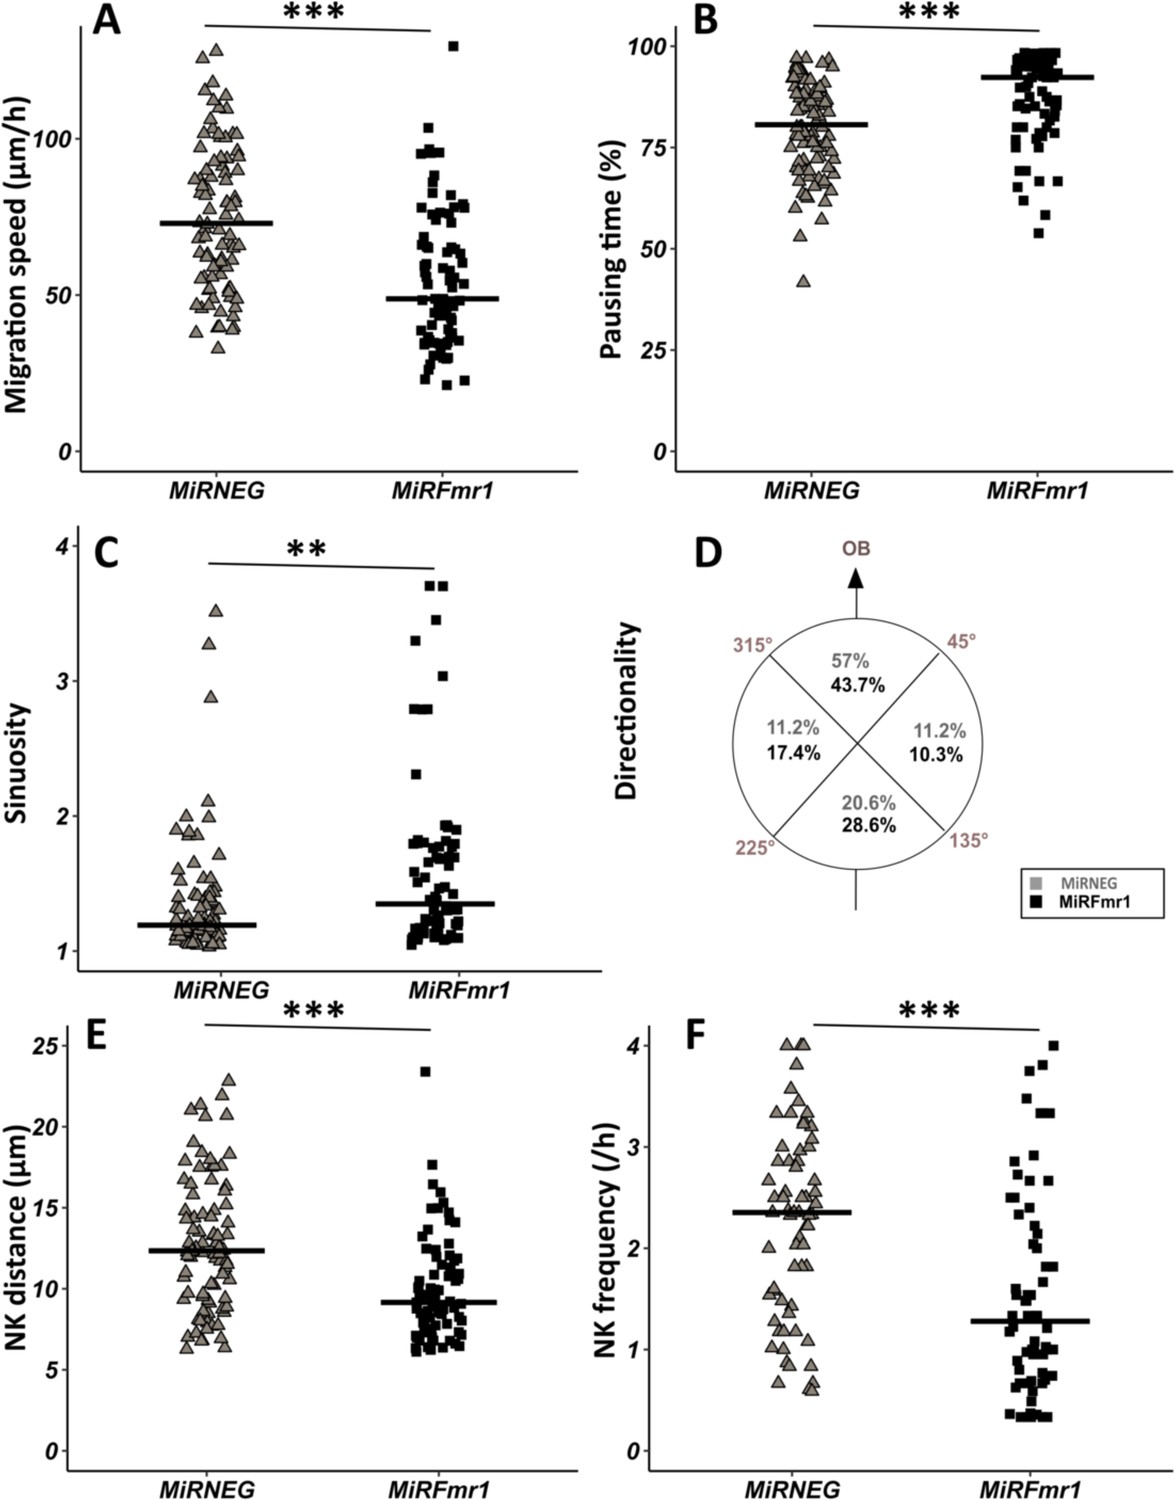
Fmr1 knockdown (KD) recapitulates Fmr1-null neuronal migration defects.
(A) Migration speed of neurons expressing MiRNEG and MiRFmr1. MiRNEG: 72.94 (36.67) μm/hr; MiRFmr1: 48.8 (30.78) μm/hr (Kruskall-Wallis test: Chi2=91.92, p-value <0.001, df = 3; followed by Dunn’s post hoc test). (B) Percentage of pausing time of neurons expressing MiRNEG and MiRFmr1. MiRNEG: 80.62 (16.70); MiRFmr1: 92.31 (12.98) (Kruskall-Wallis test: Chi2=130.61, p-value <0.001, df = 3; followed by Dunn’s post hoc test). (C) Sinuosity index of neurons expressing MiRNEG and MiRFmr1. MiRNEG: 1.20 (0.31); MiRFmr1: 1.36 (0.61) (Kruskall-Wallis test: Chi2=65.19, p-value <0.001, df = 3; followed by Dunn’s post hoc test). (D) Migration directionality radar represented in four spatial dials. Percentage of cells migrating in each spatial direction in neurons expressing MiRNEG and MiRFmr1, relatively to the vector going straight from the subventricular zone (SVZ) to the olfactory bulb (OB) (Fisher’s exact test, p-value = 0.019). (E) Nucleokinesis (NK) mean distance of neurons expressing MiRNEG and MiRFmr1. MiRNEG: 12.34 (5.65) μm; MiRFmr1: 9.16 (3.61) μm (Kruskall-Wallis test: Chi2=53.45, p-value <0.001, df = 3; followed by Dunn’s post hoc test). (F) NK frequency of neurons expressing MiRNEG and MiRFmr1. MiRNEG: 2.55 (2.18) NK/hr; MiRFmr1: 1.48 (1.95) NK/hr (Kruskall-Wallis test: Chi2=111.53, p-value <0.001, df = 3; followed by Dunn’s post hoc test). The black line represents the median. MiRNEG: N=3, n=86; MiRFmr1: N=3, n=79. Median (IQR). *p-value <0.05; **p-value <0.005; ***p-value <0.001. Source videos, tracking data (NK frequency, pausing time, sinuosity, speed, NK distance, directionality), and statistical analysis of migrating control and miRFMR1 neurons are available at https://osf.io/eqhzx.
Figure 2—figure supplement 2
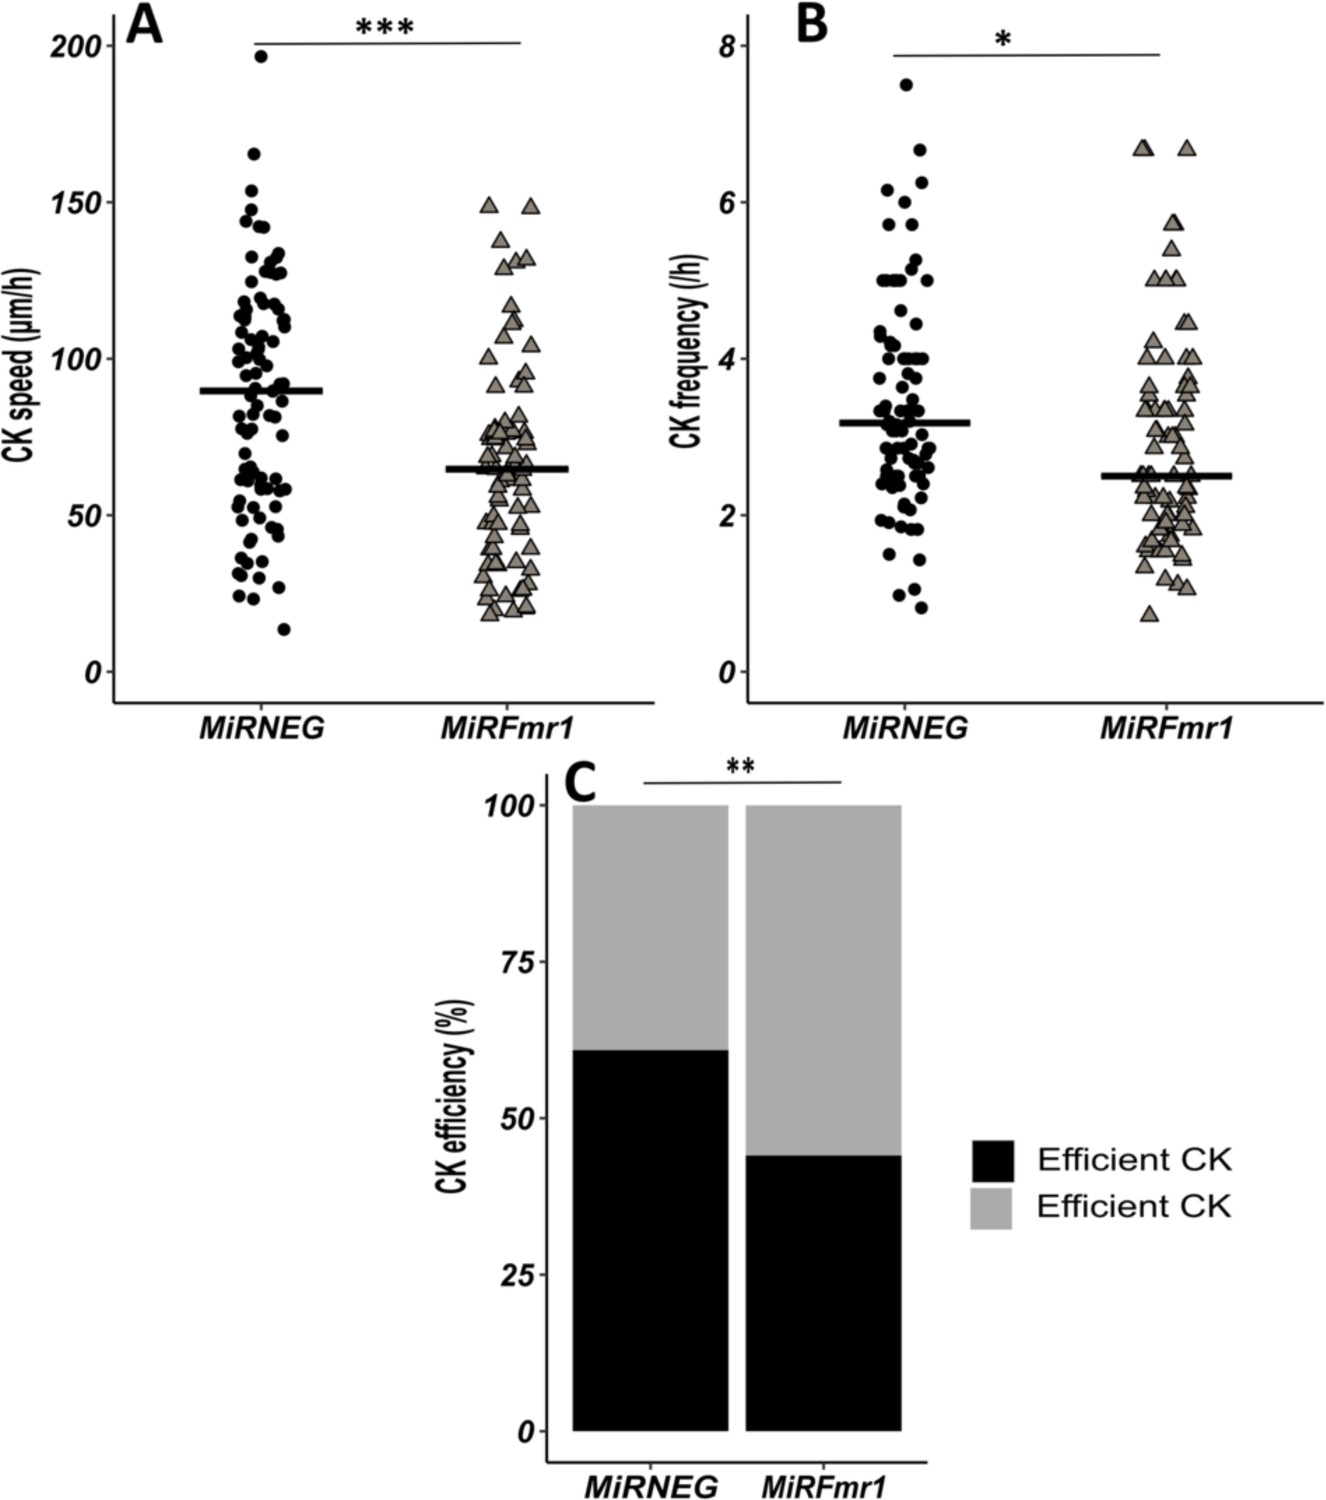
Fmr1 knockdown (KD) recapitulates Fmr1-null neurons centrokinesis (CK) defects.
(A) CK speed of neurons expressing MiRNEG and MiRFmr1. MiRNEG: 89.71 (55.06) μm/hr; MiRFmr1: 64.72 (33.89) μm/hr (Mann-Whitney test, p-value <0.001). (B) CK frequency of neurons expressing MiRNEG and MiRFmr1. MiRNEG: 3.18 (1.50) CK/hr; MiRFmr1: 2.50 (1.64) CK/hr (Mann-Whitney test, p-value = 0.011). (C) Percentage of efficient CKs in neurons expressing MiRNEG and MiRFmr1. MiRNEG: 57%; MiRFmr1: 41% (Chi2=17.999, p-value = 0.0012). The black line represents the median. MiRNEG: N=3, n=96; MiRFmr1: N=3, n=81. Median (IQR). *p-value <0.05; **p-value <0.005; ***p-value <0.001. Source videos, tracking data (CK speed and efficiency and frequency), and statistical analysis of migrating control and miRFMR1 neurons are available at https://osf.io/eqhzx.
Figure 2—video 1
Time-lapse imaging of GFP electroporated neurons in control rostral migratory stream (RMS).
Scale bar: 50 μm.
Figure 2—video 2
Time-lapse imaging of GFP electroporated neurons in Fmr1-null rostral migratory stream (RMS).
Scale bar: 50 μm.
Figure 3 with 1 supplement
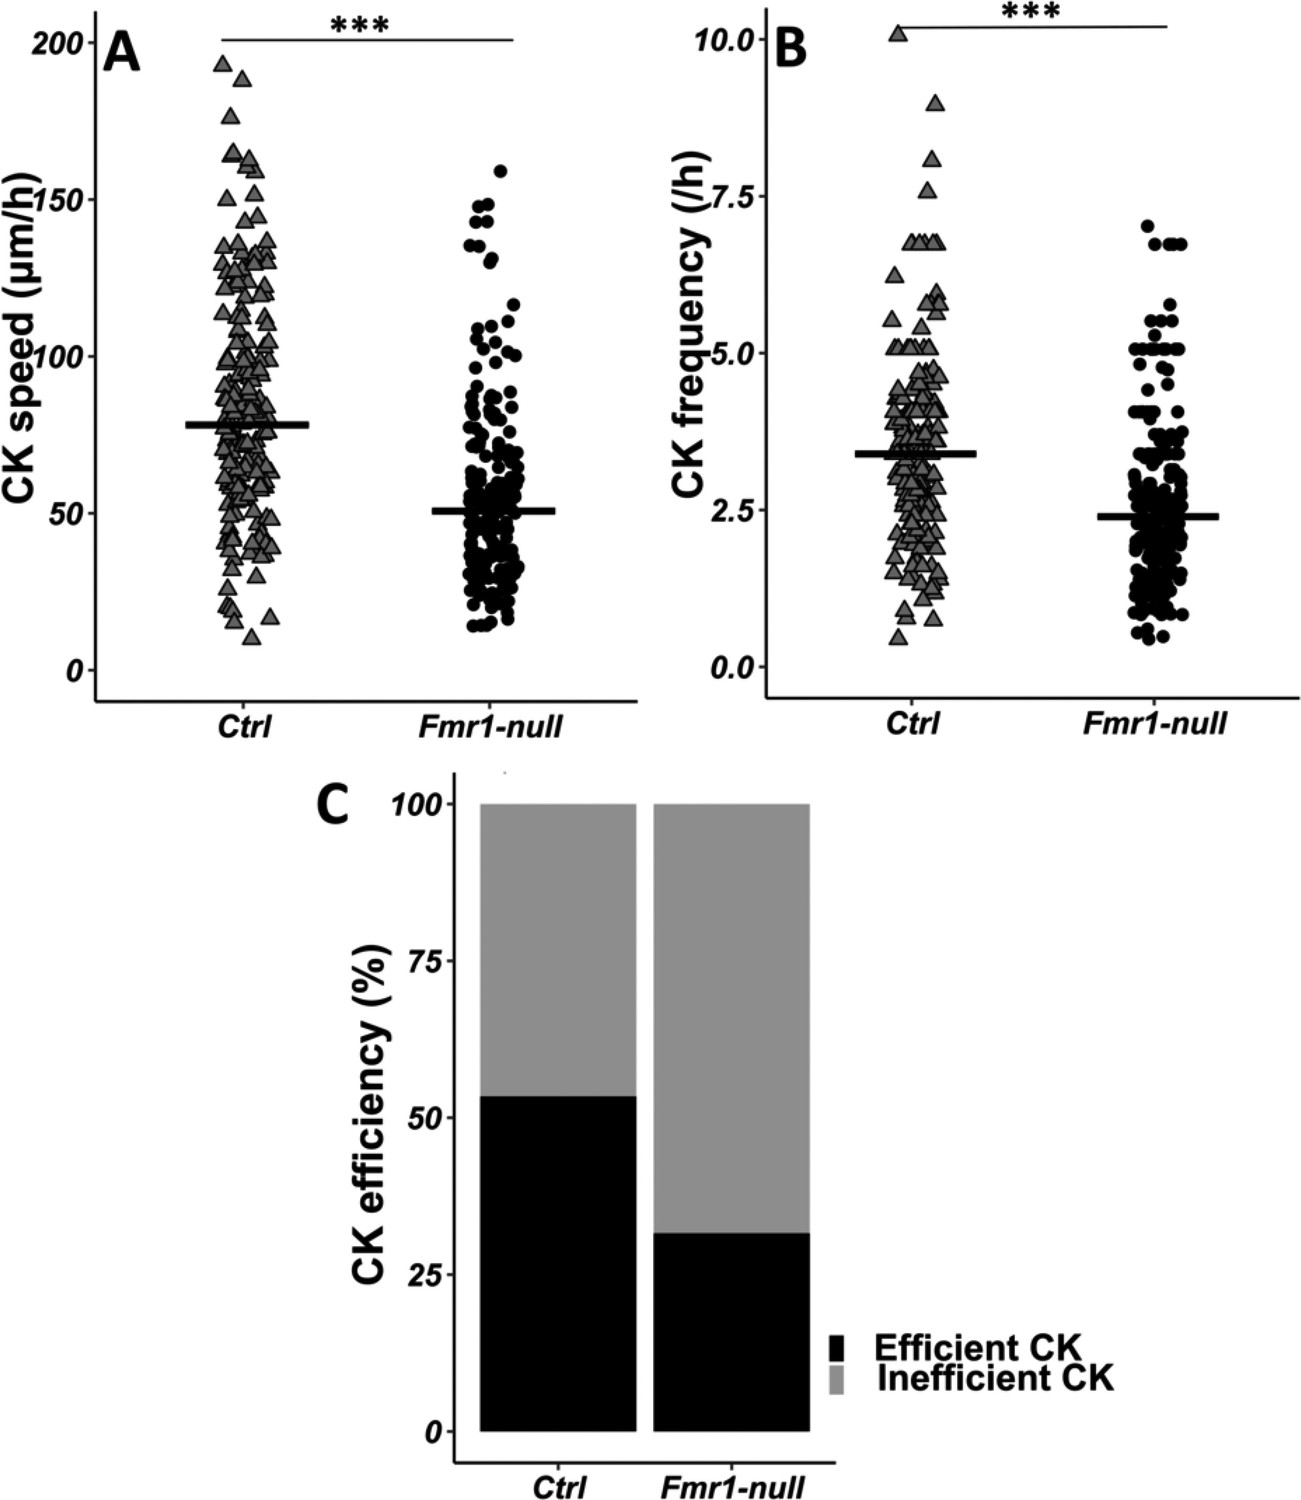
Centrokinesis (CK) defects in Fmr1-null neurons.
(A) CK speed of control and Fmr1-null neurons. Ctrl: 76.90 (46.46) μm/h; Fmr1-null: 49.45 (33.66) μm/hr (Mann-Whitney test, p-value <0.001). (B) CK frequency of control and Fmr1-null neurons. Ctrl: 3.33 (1.71) CK/hr; Fmr1-null: 2.33 (1.71) CK/hr (Mann-Whitney test, p-value <0.001). (C) Percentage of efficient CKs in control and Fmr1-null neurons. Ctrl: 54%; Fmr1-null: 33% (Chi2=57.611, p-value <0.001). The black line represents the median. Ctrl: N=3, n=178; Fmr1-null: N=3, n=216. Median (IQR). ***p-value <0.001. Source videos, tracking data (CK speed and efficiency and frequency), and statistical analysis of migrating control and Fmr1-null neurons are available at https://osf.io/eqhzx.
Figure 3—video 1
Time-lapse imaging of GFP and centrin-RFP co-electroporated neurons in Fmr1-null rostral migratory stream (RMS).
Scale bar: 50 μm.
Figure 4 with 1 supplement
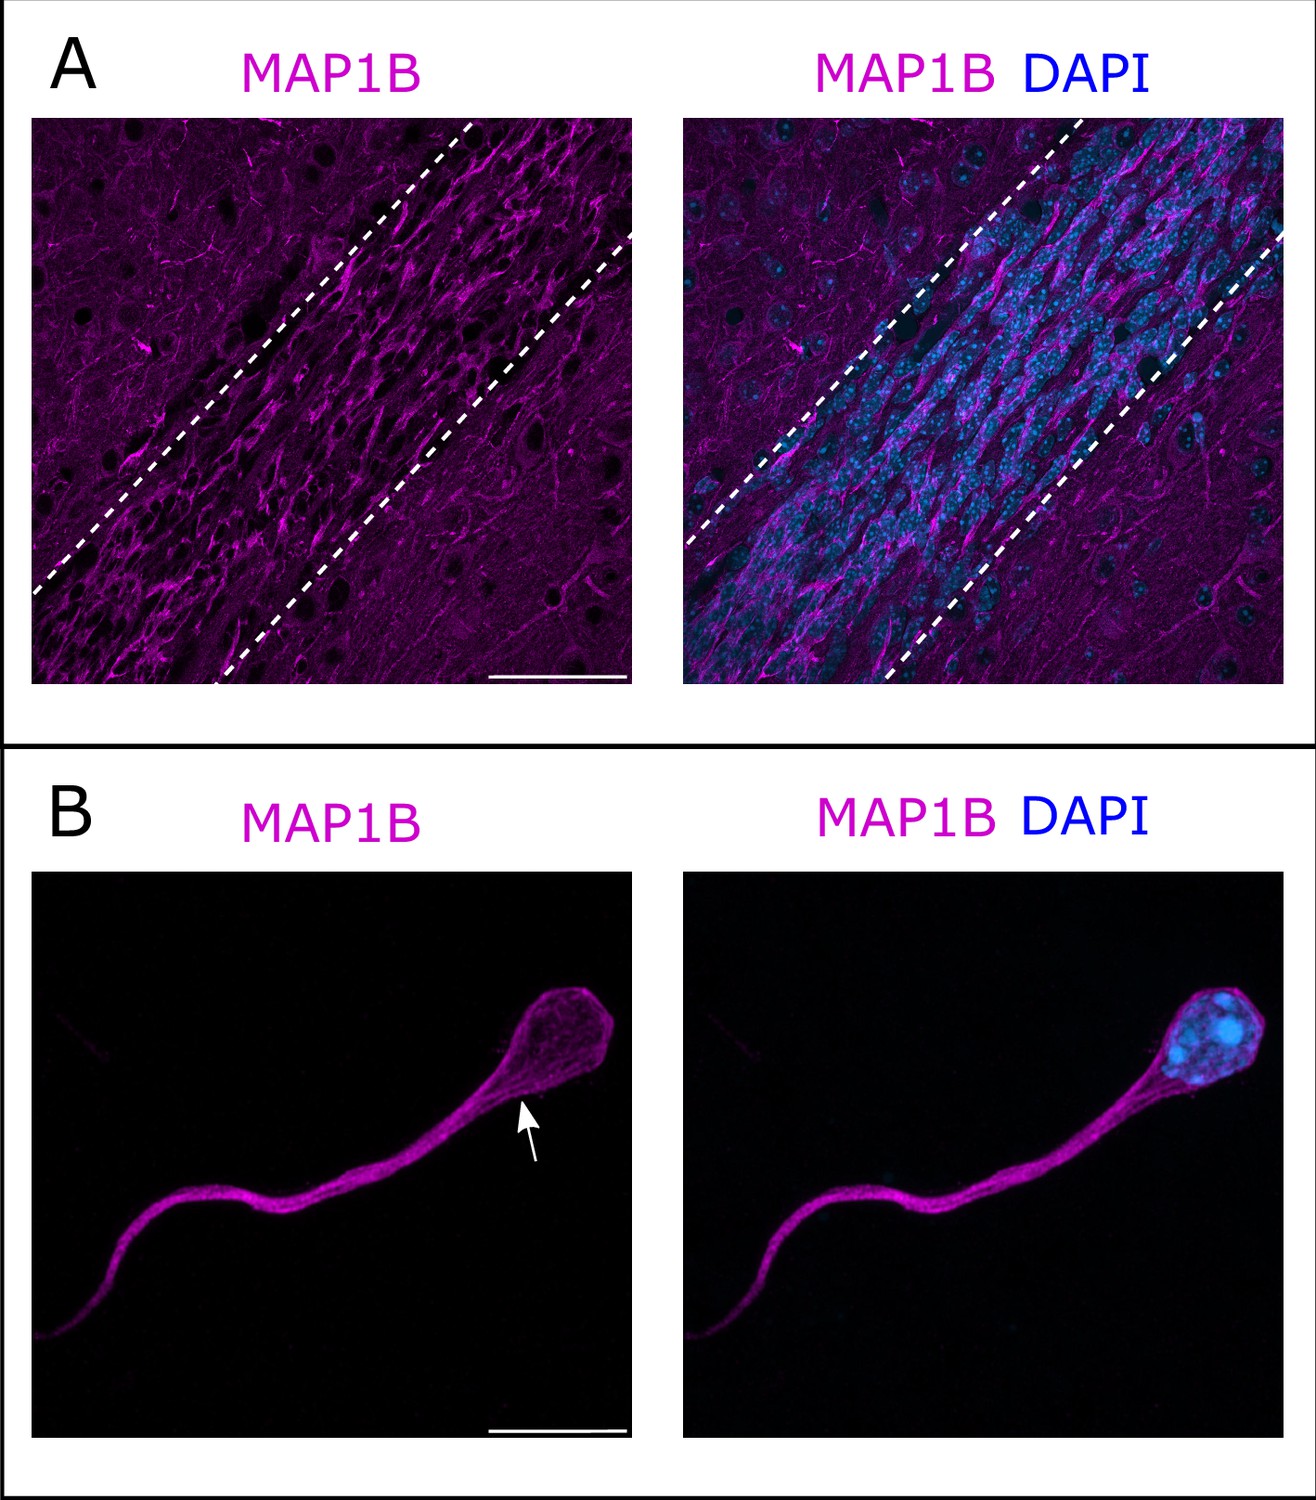
Microtubule-associated protein 1B (MAP1B) expression in the rostral migratory stream (RMS).
(A) Immunohistochemistry of the RMS showing MAP1B expression (magenta) along the stream. The RMS is delineated with dotted lines. Scale bar: 50 μm. (B) Immunostaining for MAP1B of a neuroblast migrating away from a ventricular/subventricular zone (V/SVZ) explant in Matrigel. The labeling is located around the nucleus and in the leading process with occasional bundles of potential microtubules (arrow). Scale bar: 10 μm.
Figure 4—figure supplement 1

Microtubule-associated protein 1B (MAP1B) is overexpressed in Fmr1-null rostral migratory stream (RMS) neurons.
(A) Immunoblot analysis revealing the expression of MAP1B in control and Fmr1-null micro-dissected RMS. (B) Quantification of MAP1B signal was performed with NIH IMAGE software and normalized to Vinculin house-keeping gene signal. MAP1B level in Fmr1-null RMS was statistically compared and normalized to MAP1B level in control RMS (Student’s t test, p-value = 0.004) (Ctrl: N=3; MAP1B KD: N=3. **p-value <0.005.). Original and labelled files for the western blot revealing the expression of MAP1B in control and Fmr1-null micro-dissected RMS, with quantifications and statistical analysis, are available at https://osf.io/eqhzx.
Figure 5 with 1 supplement
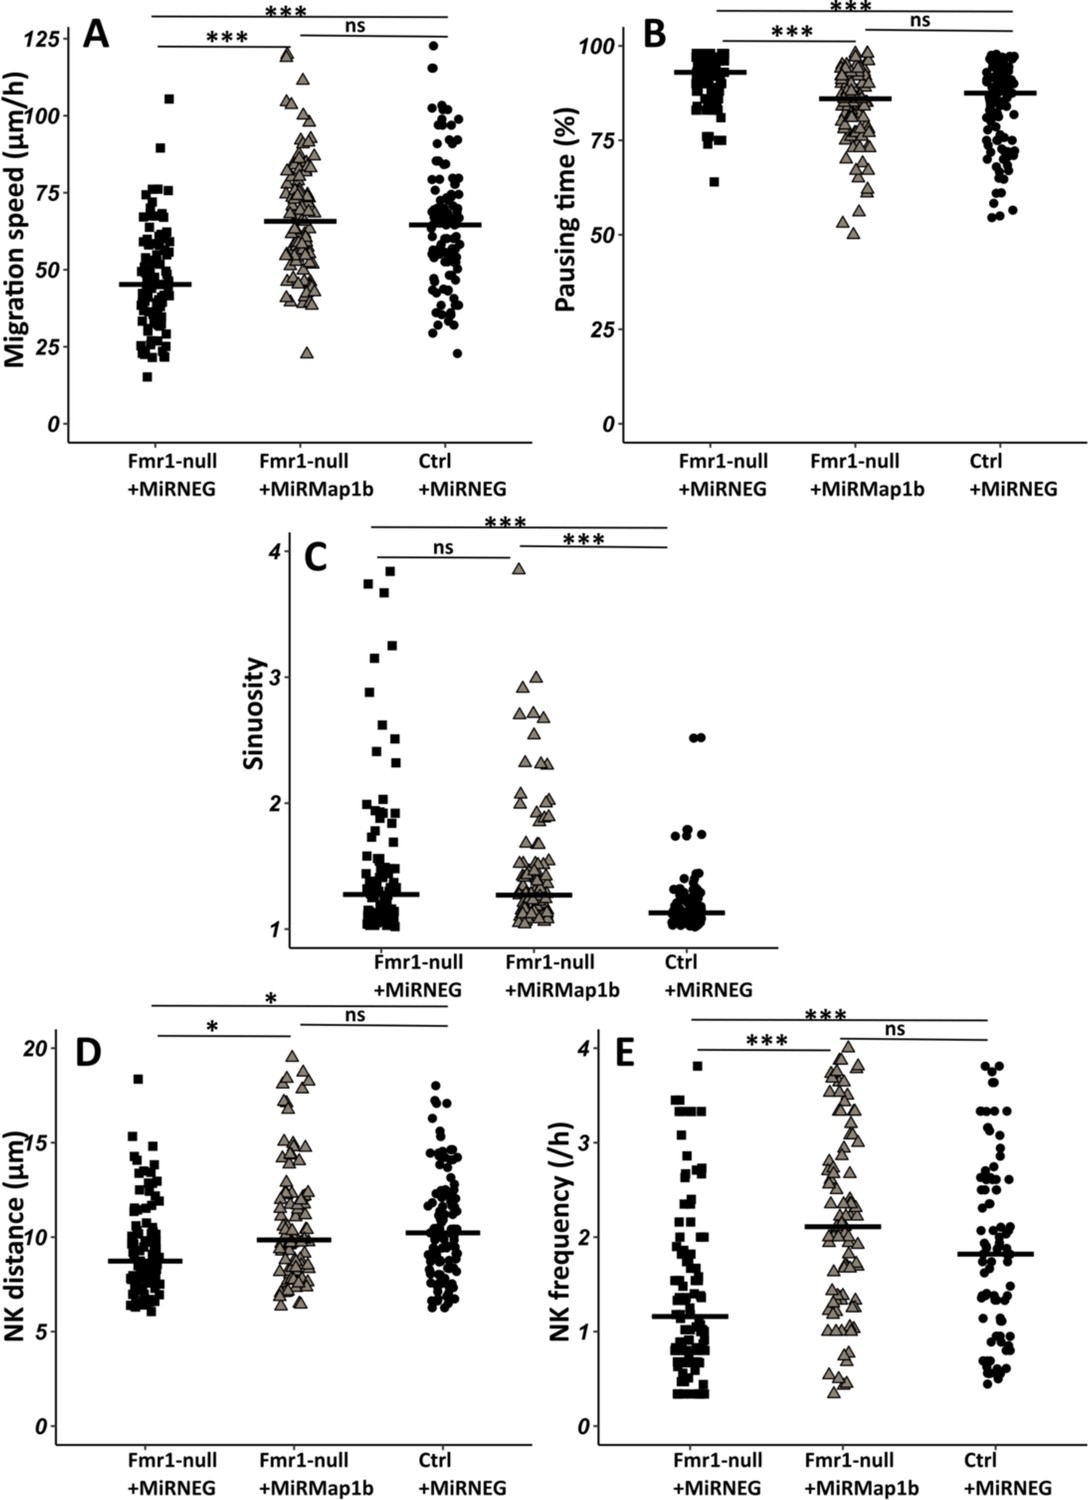
Map1b knockdown (KD) rescues Fmr1-null neurons migration defects.
(A) Migration speed of Fmr1-null neurons expressing miRNEG and miRMap1b and control neurons expressing miRNEG. Fmr1-null neurons + miRNEG: 45.23 (23.25) μm/hr; Fmr1-null neurons + miRMap1b: 65.72 (24.31) μm/hr; control neurons + miRNEG: 64.54 (21.99) μm/hr (Kruskall-Wallis test: Chi2=61.168, p-value <0.001, df = 2; followed by Dunn’s post hoc test). (B) Percentage of pausing time of Fmr1-null neurons expressing miRNEG and miRMap1b and control neurons expressing miRNEG. Fmr1-null neurons + miRNEG: 93 (7); Fmr1-null neurons + miRMap1b: 86 (14); control neurons + miRNEG: 87.50 (15.67) (Kruskall-Wallis test: Chi2=45.716, p-value <0.001, df = 2; followed by Dunn’s post hoc test). (C) Sinuosity index of Fmr1-null neurons expressing miRNEG and miRMap1b and control neurons expressing miRNEG. Fmr1-null neurons + miRNEG: 1.30 (0.45); Fmr1-null neurons + miRMap1b: 1.28 (0.55); control neurons + miRNEG: 1.13 (0.16) (Kruskall-Wallis test: Chi2=39.807, p-value <0.001, df = 2; followed by Dunn’s post hoc test). (D) Nucleokinesis (NK) mean distance of Fmr1-null neurons expressing miRNEG and miRMap1b and control neurons expressing miRNEG. Fmr1-null neurons + miRNEG: 8.93 (3.64) μm; Fmr1-null neurons + miRMap1b: 9.89 (3.85) μm; control neurons + miRNEG: 10.23 (3.9) μm (Kruskall-Wallis test: Chi2=11.573, p-value = 0.003, df = 2; followed by Dunn’s post hoc test). (E) NK frequency of Fmr1-null neurons expressing miRNEG and miRMap1b and control neurons expressing miRNEG. Fmr1-null neurons + miRNEG: 1.18 (1.11) NK/hr; Fmr1-null neurons + miRMap1b:: 2.22 (1.95) NK/hr; control neurons + miRNEG1.65(2) NK/hr (Kruskall-Wallis test: Chi2=39.272, p-value <0.001, df = 2; followed by Dunn’s post hoc test). The black line represents the median. Fmr1-null neurons + miRNEG: N=6, n=102; Fmr1- null neurons + miRMap1b: N=3, n=101; control neurons + miRNEG: N=3, n=78. Median (IQR). *p-value <0.05; ***p-value <0.001; n.s. Source videos, tracking data (NK frequency, pausing time, sinuosity, speed, NK distance), and statistical analysis of migrating contro, Fmr1-null neurons and FMR1-null neurons with miRMAP1B are available at https://osf.io/eqhzx.
Figure 5—video 1
Time-lapse imaging of miRMAP1B-GFP electroporated neurons in Fmr1-null rostral migratory stream (RMS).
Scale bar: 50 μm.
Figure 6
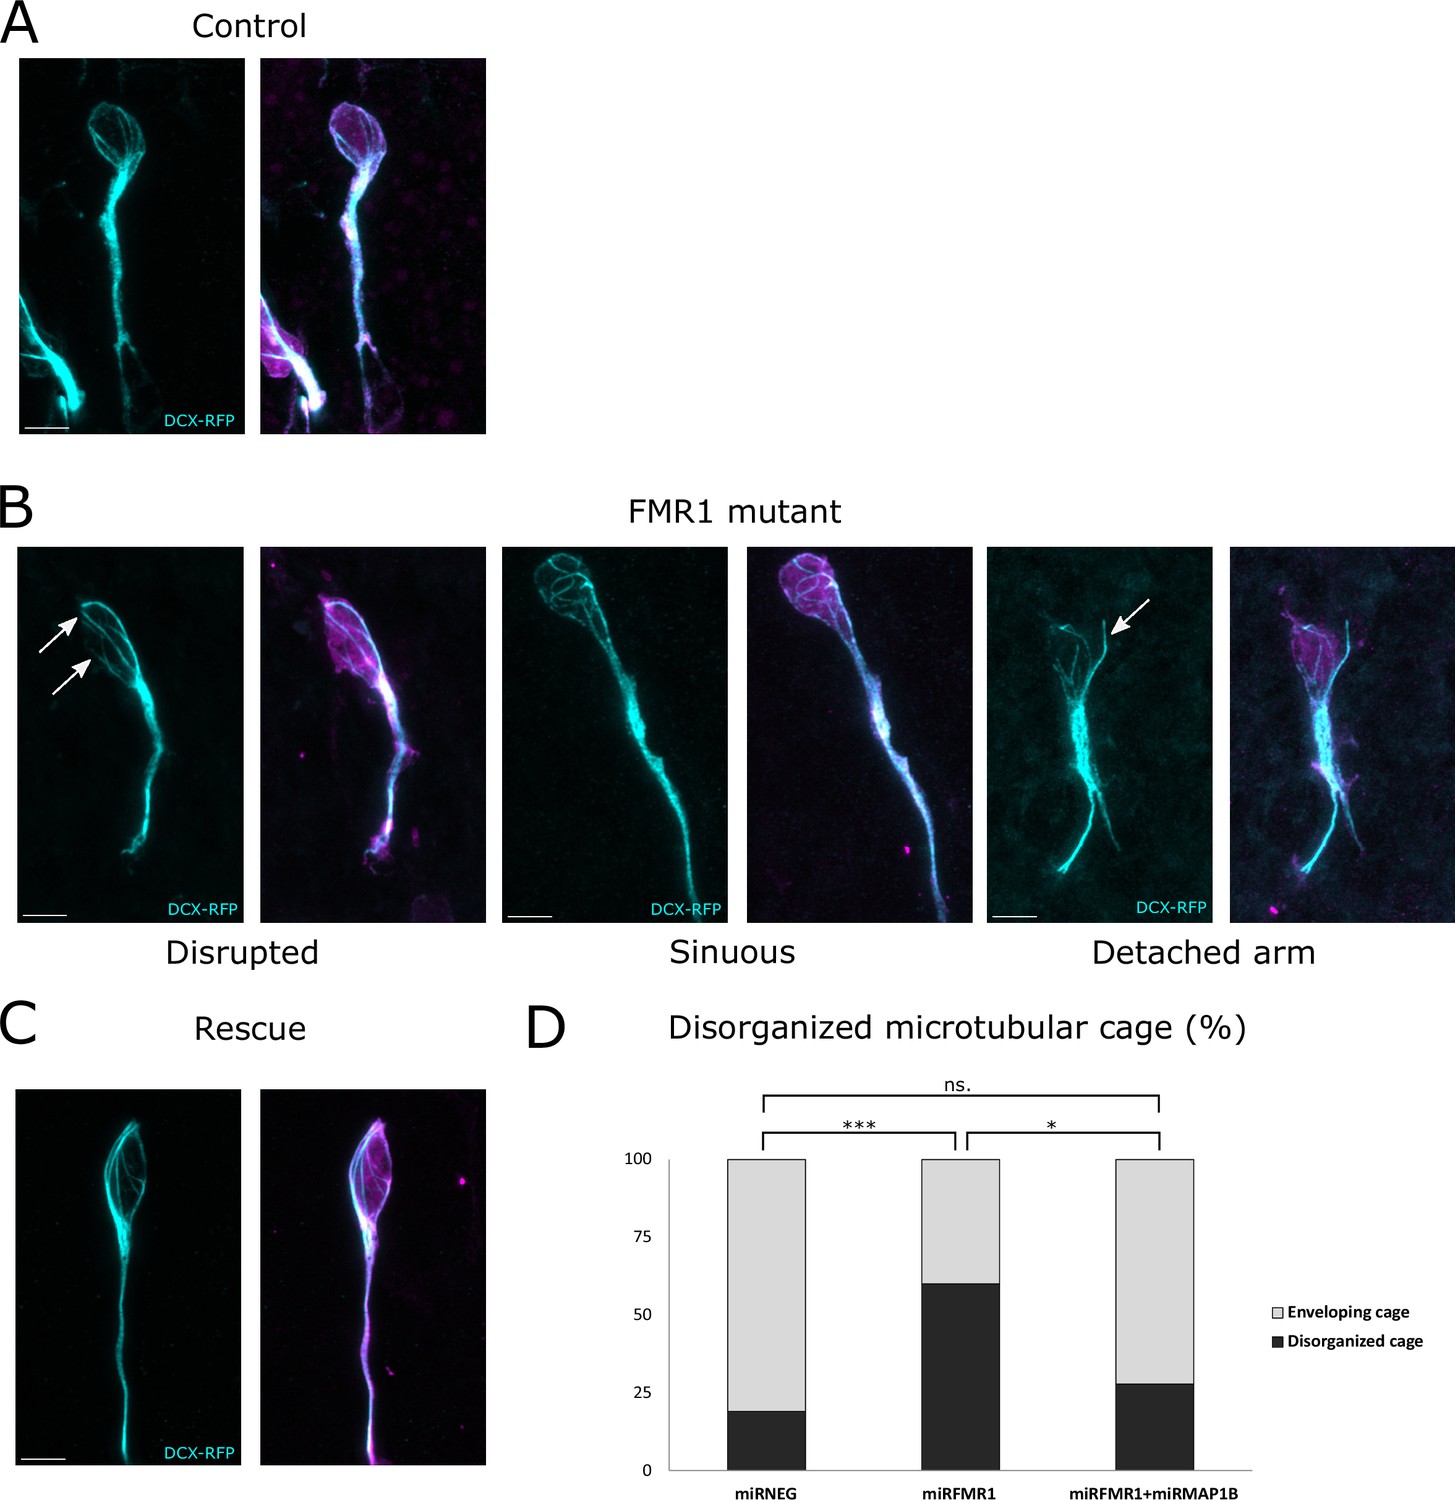
The fragile X messenger ribonucleoprotein (FMRP)/microtubule-associated protein 1B (MAP1B) duo acts on the microtubular nuclear cage of rostral migratory stream (RMS) neurons.
(A) Representative control neurons from mirNEG-GFP (magenta) plus DCX-RFP (cyan) co-electroporated ventricular/subventricular zone (V/SVZ) explants cultured in Matrigel displaying microtubular bundles enveloping the nucleus. (B) Representative Fmr1 knockdown (KD) neurons from mirFmr1-GFP (magenta) plus DCX-RFP (cyan) co-electroporated V/SVZ explants cultured in Matrigel. The majority of them display an abnormal cage with disruption (arrows) (46%), sinuous cages (33%), or even detached bundle (arrow) (28%). (C) Representative rescued neurons from mirNEG-GFP (magenta) plus DCX-RFP (cyan) plus mirMAP1B co-electroporated V/SVZ explants cultured in Matrigel displaying microtubular bundles enveloping the nucleus. Scale bars: 5 μm. (D) Quantification of the percentage of disorganized cages in the different conditions: mirNEG 19%, miRFMR1 60%, mirFMR1 + mirMAP1B 28% (Pearson’s χ2 test [2, N=107])=14.16, p-value <0.001 with the Benjamini-Hochberg method for correcting multiple testing. mirNEG, N=3, n=37; mirFMR1 N=3, n=35; mirF+ mirMAP1B, n=36. Acquisitions of Immunostaining of microtubular cage (DCX-RFP) in controls, miRFMR1 and miRFMR1+miRMAP1B, and quantifications of disorganized microtubular cage and statistical analysis are available at https://osf.io/eqhzx.
Additional files
Download links
A two-part list of links to download the article, or parts of the article, in various formats.
Downloads (link to download the article as PDF)
Open citations (links to open the citations from this article in various online reference manager services)
Cite this article (links to download the citations from this article in formats compatible with various reference manager tools)
FMRP regulates postnatal neuronal migration via MAP1B
eLife 12:RP88782.
https://doi.org/10.7554/eLife.88782.3


